the core of the apple: dark value and degrees of monopoly
TRANSCRIPT

Copyright©2014, American Sociological Association, Volume 20, Number 1, Pages 82-111, ISSN 1076-156X
The Core of the Apple:
Dark Value and Degrees of Monopoly in Global Commodity Chains
Donald A. Clelland1
University of Tennessee (Emeritus)
Abstract
The capitalist world-economy takes the form of an iceberg. The most studied part which appears
above the surface is supported by a huge underlying structure that is out of sight. Unlike the
iceberg, the world-economy is a dynamic system based on flows of value from the underside
toward the top. These include drains of surplus (expropriated value) that take two forms: visible
monetarized flows of bright value and hidden un(der)costed flows that carry dark value (the
unrecorded value of cheap labor, labor reproduction and ecological externalities). Commodity
chains are central mechanisms for these surplus drains in the world-economy. At each node of
the chain, participants attempt to maximize their capture of bright value through wages, rent and
profit. They do this by constructing differential degrees of monopoly (control of the markup
between cost and sale price) and degrees of monopsony (control of markdowns of production
costs). However, this process depends upon the transformation of dark value into bright value
for capture. Via an examination of the Apple iPad commodity chain, I show how the bright value
captured by Apple depends on the dark value extracted by its suppliers. Dark value is estimated
by measurements of the value of under-payments for wage labor, reproductive labor and
environmental damage in Asian countries, especially China. Surprisingly, most dark value
embedded in the iPad is captured by final buyers (mostly in the core) as consumer surplus.
Keywords: Apple, Chinese labor, consumer surplus, dark value, monopsony, unequal exchange,
value capture
We should think of the modern world-system as an iceberg economy in which uncosted
labor and resources comprise the thicker submerged ice layers that are blocked from view
beneath a thin top stratum that is counted as the visible official economy (Mies, Bennholdt-
Thomsen and Werlhof 1988). From this vantage point, we realize that the total world surplus is
far greater than the cumulative GDPs. We also realize that commodity chains are far more than
networks in which “value is added” at nodes.2 From a world-system perspective, these networks
are exploitative structural relationships in which a vast array of unequal exchanges occurs among
nodes of the chain and across zones of the world-economy (Wallerstein 1983). Indeed,
1 I would like to thank Wilma Dunaway and three reviewers for their suggestions about ways in which I could
tighten and strengthen this essay. I would also like to thank Jennifer Bair for her encouragement and support. 2 I use the world-system conceptualization of commodity chain, although the careful reader will recognize the
influence of later variants. See Bair (2009) for an explanation of differences among these approaches.

83 Journal of World-Systems Research
capitalism is grounded in surplus extraction chains through which powerful firms exercise
degrees of monopoly to capture massive transfers of what I term bright value and dark value.3
Using world-systems analysis, this study examines one of those chains. After a brief
methodological discussion, I explicate my conceptual framework of bright and dark value
extraction and of degrees of monopoly in commodity chains. In the fourth part, I examine the
differential expropriation of bright value through degrees of monopoly in the iPad commodity
chain. In the fifth part, I offer an empirical investigation of the expropriation of dark value in the
iPad chain through (a) extraction of hidden labor surpluses, (b) appropriation of unpaid inputs
from laborer households and communities, and (c) surplus extraction through ecological
externalities.
Methods of Inquiry
Between mid-2010 and mid-2011, Apple sold a little more than 100 million iPads, all assembled
in China. This study explores the commodity chain for that product. In 2011, Apple integrated
748 suppliers of materials into its production network (82 percent of them based in Asia, 351 of
them in China) (Apple 2012). Despite this array of input sources, final assembly is centralized at
seventeen plants. This form of commodity chain is governed by a lead firm that sets strict design
and production standards for each component of its finished item (Gereffi, Humphrey and
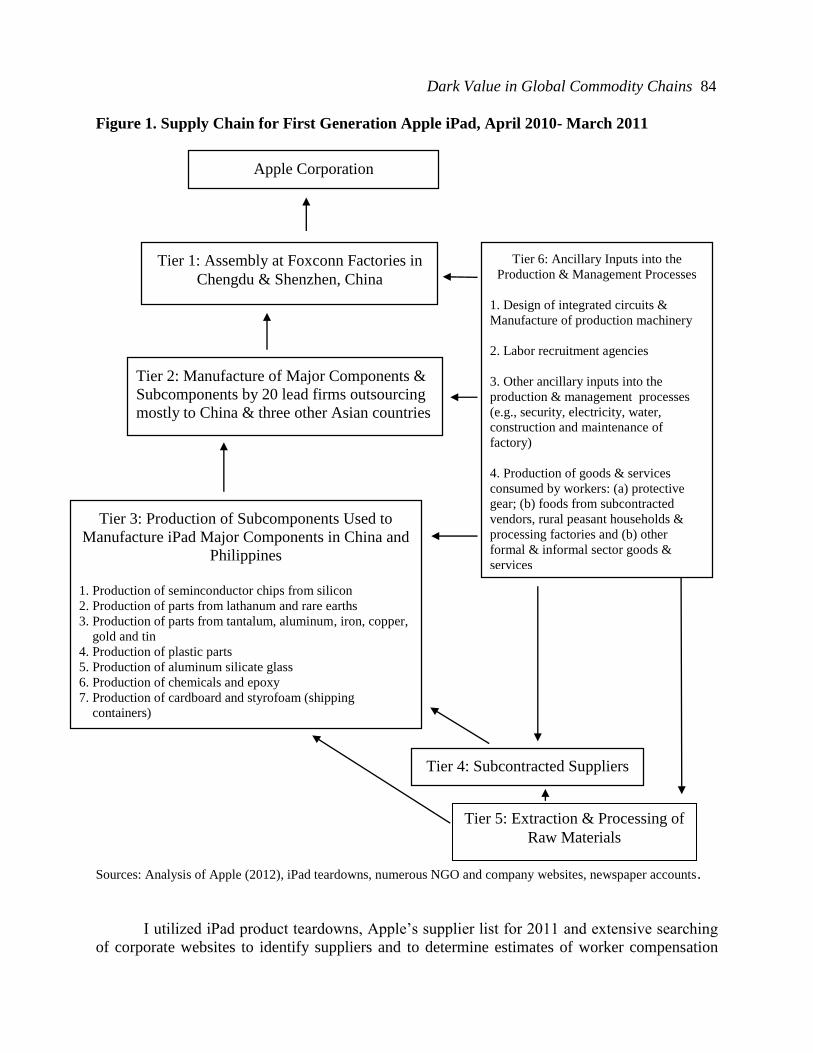
Sturgeon 2005). As shown in Figure 1, there were at least six tiers of first generation iPad
suppliers: (a) one assembly firm, (b) twenty manufacturers and sub-assemblers of major
components, (c) producers of subcomponents used to manufacture components, (d)
subcontractors to those material producers, (e) firms that extracted and processed raw materials,
and (f) ancillary inputs into production and management processes. Due to lack of corporate
transparency, however, I can analyze closely only the first three tiers. Headquartered in the
United States, the European Union, South Korea, Taiwan, Japan, and Singapore, lead suppliers
outsourced most of the manufacturing to China.4 I emphasize this aspect of the supply chain
because previous research underestimated the degree to which the iPad and its components were
manufactured in China.5 In concentrating iPad assembly and component manufacturing in China,
Apple and its suppliers have followed the global trend.6
3 My concept of dark value is an extension of Emmanuel’s (1972) theory of unequal exchange, but I challenge his
assumption of international equal rates of profit (cf. Amin 1976, 2010). It is a basic argument of the original world-
systems conceptualization (Wallerstein 1983, Hopkins and Wallerstein 1986) that commodity chains are surplus
extraction chains based on unequal exchange. 4 Contact the author for a list of first generation iPad suppliers. 5 Kraemer, Linden, and Dedrick (2011) assigned estimates to firm headquarter countries or to an “unidentified”
category, failing to document the extent to which production sites were located in China or other Asian countries. 6 There are more than 15 million workers in the global electronics industry, with China as the production hub
(Sustainable Trade Initiative 2011).
Dark Value in Global Commodity Chains 84
Figure 1. Supply Chain for First Generation Apple iPad, April 2010- March 2011
Sources: Analysis of Apple (2012), iPad teardowns, numerous NGO and company websites, newspaper accounts.
I utilized iPad product teardowns, Apple’s supplier list for 2011 and extensive searching
of corporate websites to identify suppliers and to determine estimates of worker compensation
Apple Corporation
Tier 6: Ancillary Inputs into the
Production & Management Processes
1. Design of integrated circuits &
Manufacture of production machinery
2. Labor recruitment agencies
3. Other ancillary inputs into the
production & management processes
(e.g., security, electricity, water,
construction and maintenance of
factory)
4. Production of goods & services
consumed by workers: (a) protective
gear; (b) foods from subcontracted
vendors, rural peasant households &
processing factories and (b) other
formal & informal sector goods &
services
Tier 1: Assembly at Foxconn Factories in
Chengdu & Shenzhen, China
Tier 2: Manufacture of Major Components &
Subcomponents by 20 lead firms outsourcing
mostly to China & three other Asian countries
Tier 3: Production of Subcomponents Used to
Manufacture iPad Major Components in China and
Philippines
1. Production of seminconductor chips from silicon
2. Production of parts from lathanum and rare earths
3. Production of parts from tantalum, aluminum, iron, copper,
gold and tin
4. Production of plastic parts
5. Production of aluminum silicate glass
6. Production of chemicals and epoxy
7. Production of cardboard and styrofoam (shipping
containers)
Tier 4: Subcontracted Suppliers
Tier 4: Extraction and Processing of Raw Materials
Tier 5: Extraction & Processing of
Raw Materials

85 Journal of World-Systems Research
levels.7 The ground-breaking Apple iProduct research of Kraemer, Linden, and Dedrick (2011)
and Linden, Dedrick and Kraemer (2011) was useful in my operationalization of measurements
of key global commodity chain concepts, as well as estimates of direct waged labor costs. In
addition, their research suggested to me the possibility of an extension to surplus drain analyses.
While I utilized their estimates as starting points, I moved beyond their research in four key
ways. Since I had the advantage of several forms of information that were not available to these
earlier researchers (e.g., Apple 2012), I was able to document that lead suppliers of the first
generation iPad outsourced most of their production to China. Second, I extended their estimates
of waged labor costs to encompass salaried professional/managerial staff that they did not
analyze. Third, I expanded their work to include the third tier of the commodity chain (see Figure
1) that they ignored. Fourth, I radicalized the analysis by exploring world-systems questions and
by introducing my own conceptualizations. While I provide some methodological explanations
in the narrative, I have situated many details about quantitative sources and approaches in the
notes for each table.
Conceptual Model
Physicists now estimate that imperceptible dark matter and dark energy account for 96 percent of
the universe and that dark energy determines the degree to which expansion can occur (Panek
2011). By analogy, I argue that invisible human and natural energy flows are converted into the
dark value that forms part of the basic structure of the world-system. Like other surplus transfers
that are embedded in all commodity chains, this dark energy flows from some locations and
accumulates in others. It is such relationships that allow us to identify some places, organizations
and groups as core, others as periphery (Wallerstein 1983, 1987). Arrighi and Drangel (1986: 11-
12) contend that: “Core activities are those that conquer a large share of the total surplus
produced within a commodity chain, and peripheral activities are those that command little or no
such surplus.” In the following two conceptual sections, I will offer my central theoretical
arguments about how commodity chains operate (a) to extract bright and dark value and (b) to
structure degrees of monopoly.
Bright and Dark Value Extraction in Commodity Chains
In addition to analyzing the inequitable core-periphery relationship, commodity chain analyses
should integrate Braudel’s lowest layer of the world-economy, “material life,” upon which
capitalism depends (Arrighi 1994: 10-11, 25-27). However, analysts typically ignore this
material life which includes the unpaid reproduction of labor within households (Dunaway 2014:
1-15).8 For that reason, I move away from the industry/firm-centric analysis of value-added (e.g.,
7 Specialized companies (e.g., iSuppli and iFixit) develop teardowns for electronic products in which they identify
components, their costs, and some of their manufacturers. In 2010 and 2011, Apple iProducts were the center of
much of that interest. 8 As Brewer (2011: 213-14) indicates, “the commodity chain concept within world-systems analysis was created,
first and foremost, as a means of explaining the polarized distribution of wealth within the modern capitalist world-
system” (also cf. Parnreiter 2012). Nevertheless, actual analysis of distribution of surplus, value-added or value
Dark Value in Global Commodity Chains 86
Gereffi, Humphrey and Sturgeon 2005) to focus sharply on the forms of hidden value that
capitalists expropriate from laborers and from the costs they externalize to households,
communities and ecosystems. In other words, I invert the question of how value is added to a
commodity by pinpointing the concealed value generated by workers and by several types of
externalities. I will argue that these dark inputs account for as much or more value than any firm
contributes to a commodity chain. Dark value is integrated into every economic transaction or
commodity, making it the silenced partner that renders every bright value drain more profitable.
Unlike visible bright value that is directly accumulated by the capitalist (Clelland 2012: 199-
200), this second type of surplus drain is externalized from economic accounting. Dark value
subsidizes capitalists, but it also benefits consumers, mostly in the core, thus legitimizing the
structure of the system.
At each node in a commodity chain, we begin with supply of materials, to which is added
costs of direct production, management, overhead costs, and profit. The total monetarized value
of these factors equals the sales price. The total value of the three factors beyond the material
inputs is termed value-added at that link in the chain. The portion of this added value that is not
paid out in costs is value capture (i.e., profit). All of these components, combined with sales
price, become a portion of material costs at the next node in the chain, at which point the
construction of new value is repeated. Since all this cumulation of value is monetarized (and
measured with transparent accounting techniques), I refer to this set of ideas as the description of
the bright value in a commodity chain (Clelland 2012). 9
At each node of a commodity chain and within each of its constitutive elements, there are
hidden inputs in the form of externalized costs that often contribute greater value than the visible
elements. Wallerstein (2009: 7) points out that “the basic effort of capitalists is to externalize
costs, that is, to not pay the full bill for the inputs they use.” Such externalized costs are found at
every node and every link of every commodity chain. Even though these factors are “uncosted”
by the capitalist, they can be made visible in the money form. When a capitalist lowers wages to
challenge competitors, the value of the reduction in labor costs becomes a form of dark value. If
all the other costs of competitive firms are equal, the reduced labor cost has been captured as
profit. In other words, dark value has been transformed into bright value. Should the capitalist
cut the price to outmaneuver competitors, (s)he passes on the dark value to buyer(s) in the next
node of the chain. The value of the labor input to the buyer is embedded in the product (e.g., a
component part for the iPad) as dark value that can be captured by the buyer. However, the
decreased wages are externalized to laborers as the need to undertake additional work hours to
replace lost income that may be critical for household survival.10 This argument of dark value
capture can also be applied to necessary costs of production for which the capitalist pays nothing
(e.g., environmental damage).
The goal of the capitalist is to capture dark value from as many sources as possible and to
transfer it into bright value.11 In a purely competitive system, all captures of dark value would
quickly be matched by competitors, but this does not happen in real capitalism (Braudel 1981,
captured has been rarer among world-systems analysts (cf. Talbot 2004 as an unusual case) than among business
scholars (e.g., Kaplinsky and Morris 2001). 9 The model presented in this and the following section is an ideal type from which I would expect variations. 10 Since the unpaid costs are externalized to households, Mies, Bennholdt-Thomsen and Werlhof (1988) and
Dunaway (2012) conceptualize this process as housewifization. 11 This is an expansion of Marx’s (1993, vol. 1) analysis of the capture of surplus value from labor power.

87 Journal of World-Systems Research
vol. 2: 228, 413-22). Consequently, those capitalists who capture significant levels of dark value
utilize it in three ways. First, they can apply the hidden value to roll-back prices in order to
attract a greater volume of consumers than their competitors. Second, the capitalist might
transfer some portion of the dark value into bright value in order to expand accumulation through
reinvestment. Third, the capitalist can employ the dark value to attain protection from
competitors through degrees of monopoly. In order to understand the appropriation and capture
of dark value, we must examine the role of degrees of monopoly within commodity chains.
Degrees of Monopoly in Commodity Chains
By degree of monopoly (Kalecki 1954), I mean the control of any mechanisms that can expand a
participant’s share of a surplus in variance from a fully competitive market. Most discussions of
monopoly point to (a) collusion among potential competitors in setting high prices in order to
collect high profits and/or (b) state protection as a source of monopoly. In contrast, I emphasize
that degree of monopoly is more commonly based on advantage of scale, productivity, barriers to
entry, product innovation and/or design, intellectual property rights, advertising and marketing—
i.e., the real-life actions that capitalists take to secure an advantage. These processes are
mechanisms for establishing control over mark-ups in sales prices (Kalecki 1954). While they
are sought by all participants in commodity chains, actual capture is related to the capitalist’s
hierarchical position in the chain. This structure is based in the reality that degree of monopoly
(control of price markets) is highly dependent upon degree of monopsony, the ability to control
“mark-downs” in the costs of inputs. At each node, every firm attempts to attain power over
markups by constraining its supply costs. Within any node, full capture of the surplus is
constrained by the relative monopsony power of the buyer (Robinson 1993). In order to cut costs
deeper than the competition, each firm tends to externalize the least profitable elements of
production and circulation to suppliers and distributors who face more intense competition. The
firm to which production is outsourced “sells semi-dear,” by passing on part of its potential
surplus in the form of a reduced price, allowing the capitalist with a high degree of monopoly to
“buy cheap.” Obviously, this relationship is not between equals (as in the abstract model of
neoclassical economics). Rather, the relationship is one of surplus extraction through unequal
exchange, for capitalists construct their degrees of monopoly through unequal exchanges with
producers and sellers who hold less market power.12 I am convinced that commodity chains have
always tended to be organized in this manner, but today, even more so. Lead firms increasingly
organize and govern commodity chains as degree of monopsony chains and mark-down chains in
order to maximize their capture of value. 13
12 I expand upon Wallerstein’s (1983: 31-34; 2004: 17-18, 26-30) notion of unequal exchange. 13 I am convinced that the “global value chain” approach is mistaken in its emphasis on value-added. The whole
point of the chain is value capture in the narrow sense of distribution of the surplus.

Dark Value in Global Commodity Chains 88
Table 1. Flow of Bright Value in the iPad Commodity Chain, 2010-2011 Activity A
Cost in US$
B
% Factory Price
Retail Price 499 181.5
Wholesale Price 425 154.5
Factory Price 275
Gross Profit Margin (GPM) (Total “value capture”) 223
Apple Gross Profit Margin (Design, Marketing, Chain
Governance, Operating Profit)
150
54.5
Manufacturing GPM (Tiers 1 and 2)*
Taiwan
Korea
United States
European Union
Japan
China
88
27
26
23
5
4
3
32.0
9.8
9.5
8.4
1.8
1.4
1.1
Direct Labor to assemble iPads & to manufacture its
major component parts (Tiers 1 and 2) **
China
Korea
Taiwan
Philippines
33
25
4
2
2
12.0
9.1
1.5
0.7
0.7
Material Inputs for Major Components 154 56.0 Sources and Notes: The model of the iPad examined is the 16GB Non-3G version (2010), the simplest, least expensive model.
The starting point for the figures provided is a “teardown” by iSuppli Corporation (Rassweiler 2010) that identifies the major
components, most suppliers, and the estimated costs. It is likely that these estimates are somewhat high, failing to take into
account Apple’s strong bargaining position (degree of monopoly) (EPT Newsletter 2010). Additional suppliers and component
costs have been identified from teardowns, Wikipedia (2013) and internet searches. The gross margin of each supplier is
available in annual reports and is reported by stock trader internet sites. The country shares of gross margin are the cumulative
shares of the suppliers with headquarters located in that country. The country shares of direct labor are the cumulative shares
allocated to actual production sites. Data in column A are derived from Kraemer, Linden and Dedrick (2010: Table 1) with
adjustments for my revised list of iPad suppliers. Data in column B are calculated by dividing data in column A by the factory
price ($275).
* Includes Singapore (less than 1%) represented in the rounded total. ** Includes Singapore (less than 1%). Numbers have been
rounded.
This approach to commodity chains as gradational, hierarchical degrees of monopsony is in
accord with a monopoly capitalism approach to world-systems analysis. Braudel directly
assaulted “the conflation by classical economists (including Marx) of the market and capitalism”
(Wallerstein 2004: 18). Indeed, Braudel (1981, vol. 2: 228, 413-22, vol. 3: 620) drew a sharp
distinction between the competitive market facing most firms and the “anti-market” sphere of
“real capitalism,” the realm of the monopolists who have shaped and dominated the capitalist
world-system.14 As Wallerstein (2004: 26) observes, capitalists “always prefer a monopoly, for
then they can create a relatively wide margin between the costs of production and the sale price,”
thereby securing profit shares well above the market average. The capitalist world-economy is a
degree of monopoly system because capitalists seek to avoid market competition through
“competitive advantage.” Building upon Braudel and Wallerstein (1983: 17, 29, 33-34, 55), I
contend that the struggle for degrees of monopoly is an historical driving force of capitalism but
14 Talbot (2011) examines the relationship of Braudel’s three layers within the historic coffee commodity chain.
89 Journal of World-Systems Research
that, of necessity, few firms capture high degrees of monopoly. The system is sharply
gradational, following a steep curve of degrees of monopoly. As a result, most capitalists in the
market sphere are subjected to exploitation by the minority of capitalists in the anti-market
sphere who hold strong degrees of monopoly.
Empirical Analysis of Apple Degrees of Monopoly
It is common knowledge that Apple products have generated massive profits, but how is value
added and captured within its commodity chains? Table 1 draws attention to the bright value in
the iPad commodity chain and allows us to see how visible surplus is distributed. Note that 45
percent of the retail price is added after production, i.e., the $224 difference between factory
price and retail price. Apple collects two-thirds of this difference. Most directly, this large
number reflects Apple’s buying power, its ability to drive down the input costs shown in Table 1
(Column A, below Apple’s Gross Profit Margin, GPM). Moreover, Apple obtains greater profits
from the proportion of sales through its own stores (see later discussion). The payoffs exhibit
some rather stunning inequalities. First, the manufacturing GPM ($88) of the total value captured
by all of the Tier 1 and Tier 2 firms that produced the iPad barely exceeds one-half of the GPM
of the non-producer Apple. Firms headquartered in Taiwan, Korea and the United States corner 8
to 10 percent each of the factory price. Second, the direct labor cost ($33) is astonishingly low,
less than 40 percent of the firms’ gross profit share. The disparity is based partially on the
outsourcing of production to cheap labor in China. While China accounts for three-quarters of all
direct labor costs, only 2 percent of the total gross profit margin ($223) stays in that country.
Only 12 percent of the factory price is retained by waged workers, so Apple captures 4.5 times
more of the surplus than its offshored iPad working class.
Empirical Measures of Degrees of Monopoly in the iPad Chain. One crude measure of
degree of monopoly is the gross profit margin (GPM), i.e., the proportion of corporate sales
revenue that remains after payment of costs of materials and waged labor involved in production
(see Tables 1 and 2).15 Apple is an advanced example of a “fabless” company, a corporation that
designs, patents and sells complex innovative integrated circuit systems, the manufacture of
which it outsources (i.e., fabless = fabricationless). Plant, equipment and production labor costs
are turned over to independent subcontractors (Kumar 2008). Four of Apple’s Tier 2 core
suppliers are fabless companies that outsource to Taiwan or China. Of necessity, such firms have
high gross margins, as salaried research and development costs are large compared with the costs
of labor and material inputs. Apple’s 35 percent gross profit margin is not highly unusual among
industries characterized by rapid innovation and maintenance of patent rights (see Table 2). The
15 GPM is sometimes termed “value capture” in global commodity chain analyses. GPM (often called gross margin)
is not what the rhetoric makes it seem. It encompasses research and development (including operating systems and
software), capital investment, and the salaries of engineers, supervisors, managerial and administrative personnel at
production sites, as well as headquarters managerial and sales personnel. Firms like Apple and a few of its suppliers
that focus on innovation and design have high gross margins because of the high salaries of technical employees.
Firms whose production regimes are based on expensive high-tech plants and equipment must also have high gross
margins.

Dark Value in Global Commodity Chains 90
high GPMs enjoyed by most of Apple’s core suppliers are based on their provision of innovative,
patented components for which Apple is unable to drive prices down. Still, their unique high-cost
components garner only a $59 share, roughly 20 percent of the production costs. Most of the
value added by component prices is generated by firms located in the Asian semiperiphery other
than China ($199 for manufacture and assembly). These suppliers score 80 percent of the GPM
of only $53 (i.e., 60 percent of the $88 GPM captured by Tier 1 and 2 suppliers). The lower
mean GPM of these firms represents their relatively weak bargaining positions in setting
component prices. In these cases, Apple can locate alternative sellers. Consequently, the average
GPM of Tier 2 Asian suppliers is 21 percent, reflecting their lower degrees of monopoly in
relation to Apple and a few of its core suppliers (see Table 2).
Table 2. Corporate Degree of Monopoly as Represented by Gross Profit Margins and Operating
Profit Margins of Apple and Its iPad Suppliers, 2010-2011 Corporations A
$US Share of
Wholesale
Price
B
Corporate %
Gross Profit
Margin (GPM)
C
GPM Share of
iPad Unit
Price $US
D
Corporate %
Operating Profit
Margin (OPM)
E
OPM Share of
iPad Unit Price
$US
Apple 150 35 150 25 106
Assembly by Foxconn 24 6 1 3 8
Suppliers head-
quartered in core
countries (US, EU,
Japan)
59
54
32
22
13
Suppliers head-
quartered in semi-
peripheral countries
(Korea, Taiwan,
Singapore)
175
21
37
7
12
Suppliers head-
quartered in China
17
18
3
6
1
Totals 238 140
Sources and Notes: Column A shares are derived from analysis of iPad teardown data and extensive Internet
searches for iPad component pricing. In Columns B and D, the 2010-2011 GPMs and OPMs of Apple and its
core/semiperipheral iPad suppliers are derived from corporate and/or investment brokerage websites. The share of
Chinese suppliers is an estimate derived from analysis of data in Dedrick et al. (2009: 81) and estimates of the costs
of local uncounted inputs in the assembly of Nokia phones (Ali-Yokko et al. 2011). Grouped GPMs and OPMs for
core and semiperiphery are averages of supplier headquarters weighted by the cost of the components supplied.
Column C is calculated by multiplying Column A by Column B, with the exception of Apple (GPM is based on the
wholesale price). Column E is calculated by multiplying Column A by Column D. Contact the author for a list of the
iPad suppliers. Numbers are rounded.
A much stronger measure of differential degrees of monopoly is the corporate operating
profit margin (OPM), which is the proportion of a company's revenue that remains after all costs
are paid, including direct production costs (labor, material inputs), indirect production costs
(managerial and professional salaries, factory operational expenses), and corporate headquarter
costs (general and administrative expenses, marketing expenses, product design, research and
development, supply chain management, infrastructure expenses and depreciation, taxes and
interest on debt). As shown in Table 2, Apple’s OPM (25%) reflects its high degree of monopoly

91 Journal of World-Systems Research
in regard to governance of the supply chain, but other core firms do almost as well (22%).16 In
contrast, suppliers headquartered in Korea, Taiwan and Singapore average an OPM of 7 percent,
and the assembler’s OPM is only 3 percent. As Column E shows, Apple’s OPM share of each
iPad is $106, but the total profit accruing to semiperipheral Asian firms is $21, of which only one
dollar is retained in mainland China. For each iPad, the total OPM share for these firms is lower
than direct labor costs of $33 (Table 1) and one-fifth of Apple’s OPM share, a much worse ratio
than for the GPMs. Asian suppliers do not achieve such low profit shares because they are
located in the semiperiphery or because they are small. Rather they suffer from their
disadvantageous relationship with a monopsonistic core firm.
Even though I have just used profit rates as an indicator, degrees of monopoly are, in
practice, established in several ways. Apple constructs its supply chains to insure that it will
retain a stronger degree of monopsony than its suppliers, even though some of them are larger
corporations. First, it is important to emphasize that degrees of monopoly are not determined by
corporate size. When iPad production began, its assembler and three of its Tier 2 suppliers were
larger corporations than Apple, and four of its Tier 2 suppliers ranked in Fortune’s Global 500.
In 2011, Apple ranked 111 in the Global 500 while one of its key suppliers (Samsung) ranked
22, and the iPad assembler (Foxconn) ranked 60.17 How then has Apple constructed such a
strong degree of monopoly? In the case of the iPad, Apple’s degree of monopoly lies in its track
record at:
1. designing innovations that attract a wide share of the global market,
2. controlling intellectual property rights,
3. governing the commodity chain through oligopolistic relations with suppliers,
4. control of product distribution and marketing, and
5. externalization of costs to suppliers.
Apple’s Degree of Monopoly through Product Innovation and Design. Within world-
systems analysis, Arrighi and Drangel (1986: 19) emphasize the importance of a firm’s
innovation to its establishment of a monopolistic position in a commodity chain. In this way,
innovative design has led to Apple’s technological primacy. Many technical specialists celebrate
Apple as “the Rolls Royce of the technology and design world,” claiming that the company
pioneered “features of standard operating systems and computer systems” and “reinvented the
design standards” (Hangen 2012). On the one hand, the company has developed new computer
operating systems and new technologies by combining existing and new components and
processes into an original patented commodity. On the other hand, Apple’s designs are shaped by
16 Four of the core-based firms exceed Apple’s profit rate, an indicator of their degrees of monopoly over small but
essential components. 17 Apple ranked 111 in Fortune’s Global 500 largest corporations (by gross revenue). iPad suppliers that ranked in
the Global 500 were Broadcom (343), Foxconn (60), LG Display (440), Qualcomm (222), Samsung (22), Texas
Instruments (175), and Toshiba (89).
See http://money.cnn.com/magazines/fortune/global500/2011/full_list/ and
http://money.cnn.com/magazines/fortune/global500/2013/full_list/.
Dark Value in Global Commodity Chains 92
knowledge of the availability and capabilities of its suppliers (Dedrick, Kraemer and Linden
2009). Apple designs its products for offshoring of engineering, management, production and
assembly to subcontractors who can keep costs low. Moreover, Apple maximizes its degrees of
monopoly through “a closed ecosystem” in which it “exerts control over nearly every piece of
the supply chain, from design to retail store” (Satariano and Burrows 2011: 2).
By itself, innovation is not enough to cement degrees of monopoly. What Apple needs is
a set of barriers to limit competition, as in the case of its design patenting and legal protection of
intellectual property rights. In an interview with his biographer, Steve Jobs emphasized that the
three most fundamental strategies of his business philosophy were “to innovate,” to establish
patent rights to protect designs and “to use litigation to maintain Apple’s monopoly” with respect
to those patents (Thompson 2012). In the public arena, Apple “is known for and promotes itself
as actively and aggressively enforcing its intellectual property interests” (Wingfield 2012). Since
2005, Apple has been tied to 60 percent of all major electronics patent lawsuits (Wieland
2012).18 Furthermore, Apple has been accused of pushing beyond protection of its own
innovations to “use the legal process to prevent others from innovating, by engaging in
competition by litigation” (Wilcox 2011).
Apple’s Degree of Monopoly through Supply Chain Governance. Satariano and
Burrows (2011: 1-2) contend that “operations expertise is as big an asset for Apple as product
innovation or marketing.” Apple tightly governs a supply chain that provides it as great (perhaps
greater) a degree of monopoly than does its product innovation. Accolades like “the genius of
Apple’s supply chain” and “world’s best supply chain” have been applied to the corporate
production network. Most analysts are convinced that Apple achieves profit margins (both gross
and operating) that are much greater than most electronics companies because of operational
advantage through the tactics in which it organizes, governs and polices its supply chain.
Between 2008 and 2013, Gartner’s Supply Chain Top 25 annually ranked Apple first because the
judges were convinced that its high profits are due to its orchestration of a tightly managed
global supply chain (Ellinor 2013).
Apple’s supply chain takes the modular form (Gereffi, Humphrey and Sturgeon 2005) in
which components and assembly are outsourced to separate subcontractors that are governed by
the company’s strict design standards. Moreover, Apple holds sufficient governance power that it
can require quick response to design changes and to consumer demand (Dedrick, Kraemer and
Linden 2009: 104). Apple’s supply chain management involves turnkey governance in which the
outsourcing firm maintains “thick” information flow and close supervision of the design to
production process (Sturgeon and Lee 2005). For example, Apple engineers “sometimes spend
months living out of hotel rooms in order to be close to suppliers and manufacturers, helping to
tweak the industrial processes that translate into mass-produced devices” (Satariano and Burrows
2011: 2).
The point of this governance system is to obtain a high degree of monopsony, the ability
to mark down costs beyond what would be possible in a purely competitive system. In
Braudelian terms, Apple acts as an “anti-market” player to exploit a chain of “market” players
who are vulnerable because of their competition with each other. Because bargaining power is
shifted to the buyer/financier, the supplier has limited control over price-setting and profit-taking
18 For an overview of Apple litigation, see http://en.wikipedia.org/wiki/Apple_Inc._litigation.

93 Journal of World-Systems Research
(Robinson 1993). Apple generates inter-firm competition among potential suppliers and
leverages that situation to its advantage. It promotes competition among suppliers by contracting
with several producers of the same components, by constantly searching for alternative
subcontractors, and by threatening to terminate suppliers who do not comply. Consequently, the
rate of exploitation of capitalists by capitalists is high, and the value of the producer’s
contribution to output is far greater than the price received.
Why would suppliers concede to Apple’s demands? According to a small Taiwanese
supplier,
A contract with Apple can send a supplier’s stock share soaring or even represent
most of its revenue. But working with Apple is not easy. Its engineers are
uncompromising and it imposes a code of silence enforced with financial
penalties for product leaks. And its history of cutting suppliers in a heartbeat helps
create a “love-hate relationship” between Apple and the companies that build its
products.... Still, when the world’s undisputed leader in consumer technology
comes calling, company executives often order their engineers to work around the
clock (Boudreau 2012: 2).
In addition to its corporate culture of secrecy (Thomke and Feinberg 2010), Apple extends
credit/financing to some key suppliers in exchange for long-term commitments (Satariano and
Burrows 2011). Financial advances place a producer in a dependent, exploitable position because
it permits Apple (1) to obtain material inputs and labor at below market prices, (2) to shift more
of the risks and costs to producers, and (3) to capture labor and outputs over a longer term.
Apple’s Degrees of Monopoly in Marketing. All the mechanisms for obtaining degrees
of monopsony in production generate no super-profits unless the firm holds a high enough
degree of monopoly in marketing to pass high price markups onto consumers.19 While Apple has
played a strategic role in constructing brand recognition (not to mention cultish fetishism) for its
products (Thomke and Feinberg 2010), key independent actors have reinforced its degree of
monopoly in marketing. Some university business schools and investors idealize Apple as “an
iconic brand, as well as a Wall Street darling” (Thomke and Feinberg 2010; Yoffie and Kim
2011; Zeiler 2012). Since their assessments are not precisely factual, technology specialists and
business journalists help to construct a degree of monopoly for Apple by withholding such
mythological acclaim from its competitors. Despite widespread criticism of its labor and
ecological practices between 2008 and 2013, Fortune awarded Apple the number one spot in its
list of the “World’s Most Admired Companies.”
Between 2000 and 2013, Apple developed a national and global market position that
reflects a stronger degree of monopoly than any of its competitors. Between 2008 and 2012,
Apple received the annual CMO Survey Award for Marketing Excellence, and business
journalists point to three approaches that give Apple a degree of monopoly in comparison to the
marketing strategies of competitors. First, Apple has built its own “marketing moat” through 407
19 Here I am influenced by Marx’s (1858) discussion of the realization process.

Dark Value in Global Commodity Chains 94
stores in fourteen countries that sell only Apple products, thereby allowing a higher markup than
received through wholesaling. Carefully recruited and trained sales associates are described as
“customer-obsessed” in their abilities to interpret how customers will react (Wathieu 2010). The
degree of monopoly that Apple achieves through such marketing strategies is reflected in its
success. Its stores exhibit the highest retail sales per square foot among U.S. retailers, netting $12
profit per visitor per quarter and average annual revenue per store of $52 million (Dediu 2013).
Second, Apple’s products “are communicated to customers through novel and provocative
advertising” that emphasizes a renegade, nonconformist image (Moorman 2012). Apple’s
marketing strategies are couched around the notion that consumers can have a “love affair with
the only company that can make technology cool, relevant and transformative.”20 Third, Apple
has developed a “hardcore fan base” (Hangen 2012), partially through “rumors and clearly-
deliberate leaks about future products” that establish public perception of Apple as a customer-
oriented innovator (Wilcox 2012).
By underpricing its competitors, a lead firm like Apple can use the cumulative benefits of
the serial monopsony power within the commodity chain it governs to enhance its degree of
monopoly in its sales market. Dialectically, it is just such monopoly power that increases that
firm’s monopsonistic ability to exploit subcontractors. Many of the mechanisms to exploit
subcontractors are designed to maximize dark value accumulation.
Apple’s Monopsonistic Externalization of Costs
Up to this point, I have focused on the visible strategies that Apple employs to ensure high
accumulation of bright value. However, I argue that Apple’s profits are just as (if not more)
dependent on strategies through which costs are externalized to accumulate unreported dark
value. Through its supply chain governance, Apple utilizes its degrees of monopsony to
externalize as many costs of production as possible to suppliers and, thereby, to extract dark
value from them. All the suppliers in the iPad supply chain obtained their position by providing
components that exceed their competitors in meeting Apple price, quality and design standards.
Either they controlled some patent rights significant to production (e.g., Samsung), or they sell at
near-cost for the sake of revenue through sheer volume (e.g., Foxconn), or they hope for better
future outcomes (i.e., some of the smaller Tier 2 and 3 firms and most of the Tier 4 and 5 firms).
In all these cases, firms are driven to cut costs. To do so, they must expand their financial
margins by darkening the accounting system through the externalization of costs. Indeed, this
Apple commodity chain achieved a quantum leap in such externalizations. Suppliers pass on to
Apple the dark value embedded in their capture of low-paid labor power, low-cost natural
resources, and the externalization of costs to ecosystems and households. Indeed, a common
feature shared by most of the suppliers is their expertise at finding and maximizing cheap inputs
and at externalizing costs (see later discussion). Monopsonistic chain governance is intended to
structure the flow of dark value to the lead firm, Apple.
20 See www.marketingapple.com (23 January 2013).

95 Journal of World-Systems Research
Apple’s Dark Value Extraction
At every node of the chain, dark value arises from the “dark energy” of low-paid and unpaid
labor and natural resources. By the time a commodity has gone through numerous nodes of a
global chain to arrive at the doorstep of the consumer, it has incorporated not only the embedded
inputs of Marx’s (1993, vol. 1) paid labor power but also massive amounts of under-paid and
unpaid labor and ecological inputs. My argument is that capitalism is dependent upon, even
driven by, a micro-structure of “dark energy” in the form of such externalities. Since these
factors never appear in the accounting of production costs, they are invisible “gifts” to capitalists
and to buyers. These concealed subsidies bubble up the commodity chain to keep the price of the
finished product more appealing to the budgets of distant richer consumers. In the sections that
follow, I will explore the ways in which the iPad commodity chain is grounded in the extraction
of dark value from (a) waged and salaried laborers, (b) from unpaid household labor, (c) from
informal sector labor, and from (d) unpaid ecological externalities.
Apple Exploitation of Chinese Migratory Workers
In the neoliberal era, core deindustrialization has been stimulated by labor arbitrage, the global
search for lower-waged labor to produce items to be sold at high prices in distant zones where
wages are higher (Roach 2004). After the initiation of “capitalism with Chinese characteristics”
in 1978 (Huang 2008), China doubled the size of the world-system’s working class over two
decades. This project is an historic combination of development by means of (a) a vigorous
program for attracting foreign direct investment, (b) expansion of export-oriented industries, and
(c) the semi-proletarianization of its rural surplus labor, following the path advocated by Arthur
Lewis (1954).
China’s labor-intensive industrialization is disproportionately supported by the country’s
most vulnerable class of workers who are recruited from rural areas.21 Apple suppliers keep
wages low because of China’s intentional construction of a segmented labor market (the hukou
system of household registration) in which migratory temporary peasant workers are legally and
structurally inferior to urbanites (Pun and Huilin 2010). These migrant workers are classified as
nonresidential workers who form a “split labor market” (Bonacich 1972) of lower-paid
temporary workers with few legal rights (Selden and Jieh-min 2011: 4). “Without social
insurance and labor rights infrastructure, the migrant labor regime is a safe haven for urban and
industrial employers that thrive on cost-minimization” (Fan 2004: 288). This “floating
population” makes up 70 percent of manufacturing workers, is paid wages below national
averages, works 50 percent longer hours than other urban laborers, and is concentrated in
massive industrial compounds that usually deduct from wages the cost of housing, food and
health services (Foster and McChesney 2010).
21 Until recently, a majority of workers were young women (Pun 2007). In the case of iPad assembly by Foxconn,
two-thirds are young males (Fair Labor Association 2012). However, I have been unable to find gender ratios for
Tier 2 and 3 suppliers.

Dark Value in Global Commodity Chains 96
Apple is quite aware of the concealed value that it captures through exploitation of
migratory workers by its suppliers. In line with its Supplier Code of Conduct (Apple 2005: 1),
Apple conducted audits of 356 of its suppliers in 2010 and 2011, documenting wages lower than
government standards, delayed payment of wages, wage deductions to discipline workers, and
failure to pay overtime. With respect to worker wages and benefits, Apple documented that 2.6
times more suppliers were in violation of corporate standards in 2011 than in 2010. Interviews
with former Apple executives explain the lack of corporate willingness to implement strategies
to improve labor conditions. Commitment to increase worker income “falters when it conflicts
with crucial supplier relationships or the fast delivery of new products.” Labor exploitation
continues because “the system works” for Apple, and “a radical overhaul would slow
innovation” (Duhigg and Barboza 2012: 4).22
Between 2010 and 2012, NGOs and media heavily criticized Foxconn assembly factories
(Duhigg and Barboza 2012; Fair Labor Association 2012) while ignoring the labor forces in the
other tiers of the iPad supply chain. Such public preoccupation with Foxconn assembly creates a
smoke screen for the cheap labor philosophy that pervades Apple’s supply chain. China Labor
Watch (2012b: 1) points out that multinational electronic manufacturers treat labor as the elastic
factor of production. “Because most production costs, including distribution and physical
materials, are to a great extent inelastic, the only way factories are able to offer a competitive
advantage is to lower... labor costs” (Lin 2004: 180). Apple suppliers employ several strategies
to lower costs below officially-recorded wage rates. First, workers are kept in probationary status
in order to evade government regulations about wage increases. Second, a laborer who fails to
meet the daily production quota is often required to complete the work after regular hours
without pay. Third, disappearance of pay slips and under-reporting of work hours is common
(Fair Labor Association 2012). Fourth, many workers are subject to a “dormitory labor system”
in massive company towns (Pun 2007) where they are daily subjected to several forms of unpaid
labor extraction (Fair Labor Association 2012; China Labor Watch 2012a).
Dark Value from Undercompensated Waged Labor
In Table 3, we move from the bright value analyzed in Tables 1 and 2 to the dark value that is
embedded in the iPad commodity chain. Dark value is estimated by comparing actual production
costs with estimated “negative opportunity costs” of production in the United States. In Column
B, dark value is derived from the multiplier effect embedded in the wage compensation
differentials (Bureau of Labor Statistics 2010) among the various countries in which the lead
firm and its outsourced suppliers are situated. Indeed, the wage gap is much greater than it
appears at first sight. Most core workers receive compensation beyond direct wage payments
(e.g., health and retirement benefits) that are worth more than half of the basic wage. Chinese
workers producing the iPad receive no such benefits, a major basis for its cheapness. It is the
context of comparative compensation in which we can most clearly see the interconnectedness of
unequal exchange and dark value. Basic to the theory of unequal exchange is the claim that wage
inequalities cannot be explained away by differences in productivity. Simply put, iPad workers
22 In 2012, Apple Corporation commissioned the Fair Labor Association (2012) to investigate working conditions at
Foxconn’s Chinese factories. Apple (2013) agrees with much of that report and adds additional information about
some forms of labor exploitation.

97 Journal of World-Systems Research
are not paid less because their productivity is lower than that of core workers. Indeed, the
cheaper workers are probably more productive. This Apple supply chain is grounded in labor
practices and productivity standards that exceed or equal those that would occur in the core.
First, assembly or component manufacturing must meet strict quality standards set by the lead
firm to achieve a designated design. Second, suppliers in the first two tiers of the supply chain
are world leaders in productivity, as suggested by earlier information about their rankings in the
Global 500. Third, workers in the first two tiers employ state of the art technology. Fourth,
managerial personnel drive these workers through Taylorist speedups, shift quotas and longer
work weeks that are not legally tolerated in the core. Suppliers organize schedules to intensify
worker productivity, with daily shifts of twelve hours and tight speedup supervision being
routine (SACOM 2011: 8-9). Work weeks surpass sixty hours because workers are required to
work overtime hours that exceed legal regulations (Fair Labor Association 2012).
Table 3. Partial Accounting of Dark Value in the First Generation iPad Supply Chain, January
2010 - March 2011
Basis
A
$ Cost per Unit
B
U.S. Multiplier
C
$ Cost if produced
in U.S.
D
$ Dark
Value
Part A. Dark Value Extractions from Waged Labor
Tier 1: Assembly
Tier 2: Production of Major
Components
Tier 3: Production of Subcomponents
Totals
8
25
12
45
14
Range: 2-12
Range: 2-12
112
246
84
442
104
221
72
397
Part B. Dark Value Extractions from Professional, Managerial, and Indirect Production Costs
Tier 1: Assembly
Tier 2: Production of Major
Components
Tier 3: Production of Subcomponents
Totals
5
20
10
35
8
Range: 3-8
Range: 3-8
40
123
47
210
35
103
37
175
Part C. Totals for Both categories of Workers
All Workers 80 652 572 Sources and Notes: iSuppli estimates the direct labor cost of assembly in China at $9. Some experts (Lasky 2010; Dediu 2012)
contend this is a serious under-estimation. I estimated the average 2010 Foxconn assembly worker’s wage as $1.50 per hour (zero
benefits) or $3,000 per year (Economix Editor 2010). This estimate is high since it was based on the Foxconn Shenzen complex
rather than to the inland Chengdu plant where most iPads are assembled at much lower labor costs. The U.S. rate is “the median
expected salary for a typical Electronics Assembler I”: $29,000 basic wage plus $16,000 in benefits, thus $45,000 per year
(Salary Wizard 2013). I adjusted this estimate downward to $42,000 to account for raises since 2010, thus $21 per hour, arriving
at a multiple of 14. The salaries of managers and engineers involved in production are “indirect production compensation” that
encompasses about 40 percent of gross profit margin (Miller and Vollman 1985). The indirect production compensation measure
is based on the assumption of three-quarters Chinese engineers. The multipliers are derived from Linden et al. (2011: 229).
Column D is calculated by subtracting Column A from Column C. For details about calculation and methods for Tiers 2 and 3,
see Appendix, Table 6. Numbers are rounded.
The waged labor costs for Tiers 1, 2 and 3 of iPad suppliers (see Figure 1) were $45 per
unit (Table 3, Part A). Assembly labor (Tier 1) is separated out because of widespread discussion
of the possibility of returning this last production stage to the United States (e.g., Goldman 2012;
Diedrich 2013). By application of a reasonable multiplier for assembly, I demonstrate that the
dark value from assembly labor is equal to the iPad operating margin (see Table 1). The most

Dark Value in Global Commodity Chains 98
significant input of dark value from labor is in the manufacture of major components by Tier 2
and 3 suppliers, reflecting the vast gap between the wages of Asian and core workers. Moreover,
most of the Tier 2 component manufacturing is done in China at a cost of $196 less than it could
be accomplished in the United States. Thus, the dark value extracted from Tier 2 labor is $221,
and an additional $72 of dark value is expropriated from Tier 3 labor.23
At a 2011 White House dinner for CEOs, President Obama asked Steve Jobs, “What
would it take for Apple to bring its manufacturing home?” The Apple CEO replied: “Those jobs
aren’t coming back” (Duhigg 2012). These empirical data help us understand Jobs’ response to
the President. Bringing iPad assembly and production to the United States would eliminate
Apple profits and/or raise the iPad retail price significantly. The Apple success story of design
innovation is dwarfed by the financial significance of its capture of underpaid waged labor.
Whatever the value created by design, it can hardly match the significance of cheap labor. The
waged workers in the top three tiers of suppliers add $397 of embedded dark value to each iPad.
Without those inputs, Apple’s $106 operating profit margin would not be possible because the
hidden savings from cheap labor is nearly four times greater.24
Dark Value from Salaried Workers
Apple benefits from a second category of underpaid Asian laborers who are not visible in the
direct labor costs reported in Table 1.25 To assess the full labor cost, we need to take into account
the professional and managerial workers (including cheap Asian engineers) who organize,
supervise and provide administrative support services to the waged labor forces. Although much
lower than that extracted from waged workers, the dark value generated by cheap managerial and
engineering labor remains significant. Even though these costs nearly match wage compensation
to production workers, very few researchers analyze the savings generated from the efficiency
and low remuneration of these workers. Therefore, I faced the daunting task of determining how
to develop estimates about these labor cadres. To my surprise, I discovered that these salary costs
are hidden in the gross profit margin. Miller and Vollmann (1985) and Tu and Zhang (2010)
provide leads in their breakdowns of overhead costs included in gross margins. They indicate
that about 40 percent of the gross margin is allocated to these “indirect production salary costs.”
Thus, I applied this ratio to the gross margins for Tier 1 and 2 firms (Table 1) to arrive at a
measure of the payments to these workers at production sites. I then estimated that three-quarters
23 A small part of this dark value is supplied by workers in South Korea, Taiwan and Singapore, so non-Chinese
components of dark value also contribute to unequal exchange. This relatively small Tier 3 amount reflects the
degree to which earlier production is based in Korea and Japan. For a breakdown, see Table 7, Appendix. 24 The Fair Labor Association (2012) reports several forms of unpaid labor that are stolen from these waged
workers. However, I have not attempted to estimate the additional dark value of such theft. For an extended
discussion of these forms of unpaid labor, see http://filebox.vt.edu/users/wdunaway/Clelland/-
SurplusDrain/Missing.pdf. If I could quantify a value for those unpaid labors, the full accounting of dark value
would be much higher. 25 See Appendix for methods used to estimate this form of indirect production costs and its related dark value.
Previous Apple supply chain research (Kraemer, Linden and Dedrick 2011) failed to take these workers into
account. The salaries of the managers, engineers and supervisors in factories are not reported by accountants with
direct labor costs but are included in the gross profit margin. Many academic studies render these workers invisible
by integrating them in the category of “indirect production costs,” a component of GPM. Linden, Dedrick and
Kraemer (2011) is a rare exception.

99 Journal of World-Systems Research
of these payments (about 30 percent of gross margins) was paid to local supervisors, managers
and engineers.26 Table 3 (Part B) shows that the cost per unit ($35) added by these salaries is 78
percent of the wages paid to a much larger labor force of production workers ($45). Moreover,
my conservative estimate of dark value benefits of $175 per unit is an indicator of the economic
significance of these workers. These “hired-hand” capitalists are proficient at (a) organizational
efficiency and time management, (b) problem solving, (c) recruiting cheap waged workers, (d)
expropriating hidden unpaid labor from them, and (e) and speeding up worker productivity.
Moreover, they are quite effective at externalizing costs that squeeze downward the profit
margins of lower-tier suppliers. While cheap in Asia, the dark value of their work at U.S. rates
exceeds Apple’s operating profit margin per iPad by $69. 27
Combined, the dark value embedded in all iPad labor costs is a stunning $572, an amount
that exceeds the retail price and is five times greater than Apple’s operating profit margin. If
these hidden costs were paid, the price of an iPad would double, vastly diminishing Apple profits
from a more limited consumer base. Consequently, Apple’s Jobian innovation nirvana means
little without cheap labor. The company’s degrees of monopoly at maximizing Chinese dark
labor value are as crucial as innovation to its ranking as the second most profitable company in
the Fortune Global 500.
Dark Value from Unpaid Household Labor
Behind the vast army of the low-paid world labor force is an even larger network of unpaid
support workers. World-systems scholars have emphasized the centrality of unpaid household
labor to the world-economy, and feminist economists have exerted much effort to measure the
economic value of women’s unpaid household labor (Beneria, 1999).28 While Marx (1993, vol.
1: 176) claimed “the secret of profit making” lay in exploitation of waged labor that occurred in
the hidden abode of the factory, we commodity chain analysts need to enter the hidden abode of
labor reproduction, the household, to find that secret. The starting point of a commodity chain is
the extraction of surplus from unpaid household work, and that unpaid labor contributes to the
“expanded value” of a commodity at every production step in the chain. The household
reproduces and partially provisions itself, allowing waged labor to be generated for the capitalist
below its paid costs (Mies et al. 1988). Hidden unpaid household labor is embodied in every
waged laborer. In other words, the household provides vast benefits for each employer within a
commodity chain. Thereby, all the capitalists that exist within the full span of a commodity chain
extract from thousands of households the production of this unpaid value, but they conceal its
embodiment in the finished product.
26 The method for estimating Tier 3 costs is found in notes for Table 7, Appendix. 27 One-quarter of indirect production salary costs is paid to managerial workers on assignment from firm
headquarters to work abroad. There is a lower multiplier for these cheap salaried workers because much of this work
is done by Koreans and Taiwanese professionals, and the Chinese engineers are relatively less exploited than wage
workers. See Appendix, Tables 6 and 7 for details. 28 For foundational world-systems background, see Review: vol. 3 (2), vol. 5 (3), vol. 7 (2), Smith et. al. (1984), and
Smith and Wallerstein (1992). For recent scholarship about household linkages to commodity chains, see Dunaway
(2012, 2014). See Clelland (2014) for analysis of the dark value of household labor in a coffee commodity chain.

Dark Value in Global Commodity Chains 100
Table 4. Underpaid and Unpaid Externalities in the iPad Supply Chain (China Only)
Basis
A
$ Cost per Unit
B
U.S. Multiplier
C
Dark Value: $ Cost
if produced in U.S.
Part A. Household Labor Externalities Household Production of Labor
Daily Household Unpaid
Reproduction Costs
Total
7
12
19
9
9
63
108
171
Part B. Underpaid and Unpaid Informal Sector
Informal Sector Services 16 9 144
Part C. Unpaid Ecological Externalities
Pollution Externalities 19 10 190 Sources and Notes: Multipliers in Parts A and B are based on minimum wage rates. In China, the informal sector wage is close to
the minimum wage (Yu et al. 2008), which in China varies by region. I used Shanghai’s rate $0.80/ hour which is roughly one-
half the manufacturing wage. The multiplier of 9 is the multiple of the U.S. minimum wage ($7.25) compared to the minimum
wage for China. My multiplier for household production of labor is much lower than one based just on expenditures of the lowest
of three income categories in the U.S. (ca. $9,000 per year), a multiplier of 15 (Lino 2012:10). Additional details are supplied in
the text. Numbers are rounded.
Think of human labor power as a material good that must be (re)produced like any other
commodity. But how can we measure the value for capitalists and consumers of the dark energy
involved? For estimates of household labor production in China, I began by assuming that the
worth of the labor time in raising a child to worker status is at least that of the minimum wage
($0.80 per hour). Then, I assume that an extended household spends twenty unpaid hours a week
in this endeavor, worth half of a weekly minimum wage. Next, I add one-quarter of the
household income of two minimum wages as child-rearing expenditures, once again worth half a
minimum wage. These two factors total to one minimum wage, which is more than 2,000 hours
or at least $1,600 per year. If costed over fifteen years (many Chinese children end schooling at
that age and enter formal work), the unpaid benefit to the employer of this free human capital is
$24,000. If the producers of this human capital were remunerated without interest over a 40 year
work life for this labor commodity, they would receive a payment of $600 per year. Assuming an
average wage of $2 per hour or $4,000 per year, each year of labor is a provision of a 15 percent
dark value bonus to the employer. I applied this ratio to the total Chinese labor costs embedded
in an iPad.29 In Table 4 (Part A), I conservatively estimate that the unpaid cost of household
production of Chinese labor is about $7 per Apple iPad. Since the human production of the same
amount of labor power in the core would be worth at least nine times more, the dark value for
Apple and the core consumer is expanded to $63.30
In addition to these forms of labor reproduction, dark value is extracted through the
household provisioning that subsidizes low and erratic wages (Dunaway 2012). How might the
value of this dark energy be measured? For estimates of household unpaid reproduction
29 I drew data from Table 1 (Tier 1), Table 3 (Tier 2), and Table 7 (Tier 3). 30 This number would more than double if we added dark value estimates for Korea and Taiwanese unpaid labor
production, plus that embedded in Tiers 4, 5 and 6.

101 Journal of World-Systems Research
externalities in Part A, I began with Qi and Dong (2013: 27) who report thirty hours per week of
unpaid work (two-thirds by females) in Chinese households. Because of the widespread use
within the Chinese export-oriented commodity chains of “the dormitory labor system” (Pun
2007), I assumed that many workers in the iPad commodity chain live in company dorms and are
independent from the unpaid reproductive support of households (i.e., they are more fully
proletarianized than is usually the case). For that reason, I conservatively reduced the estimate of
the hours of unpaid household labor by one-third (to 20 hours weekly per household). In contrast
to the standard variety of higher valuation measures for unpaid household work (Budlender
2002), I use the Chinese minimum wage, which is roughly half the average wage. Thus, my
conservative estimate of unpaid daily reproduction cost is one-quarter of the estimated
wage/salary costs (one-half the wage times one-half the official work week). As a result, I
estimate that there is $12 of unpaid household reproduction costs embedded in each iPad. Since
this labor power would cost nine times more in the core (using the U.S. minimum wage as the
multiplier), the dark value for Apple and the core consumer is expanded to $108. Combined,
there is $171 worth of unpaid household labor embedded as dark value in each iPad, an amount
that exceeds Apple’s gross profit margin.
Dark Value from Informal Sector Labor
The economic significance of the informal sector has been recognized by world-systems scholars
(Portes 1983; Tabak and Crichlow 2000) and by mainstream international development
organizations (International Labour Organization 2001; United Nations 2003). Dark surplus
drains from informal sector labor feed into all commodity chains. These supply chains are
“invisible” because capitalists and consumers seek to deny that they are beneficiaries of
surpluses extracted from semi-proletarianized workers who are concentrated in the informal
sector (Tabak and Crichlow 2000). Informal sector workers subsidize global commodity chains
through exchanges in which their labor time is under-valued. On the one hand, they pass dark
value through goods and services that are embedded into the production processes of commodity
chains.31 On the other hand, these hidden workers provide local dark value to low-paid waged
workers who, in turn, embed that dark value into the export commodities they manufacture. The
daily life of the peripheral wage earner entails unequal exchanges in which one hour’s earnings
are used to purchase goods or services that require greater labor time from cheaper producers. At
iPad factories, Asian workers expand their income by purchasing cheap meals, goods and
services from lower-paid informal sector vendors that ply the streets near their factories (Pun and
Chan 2012).
How might we estimate the value of these hidden externalities? I began by deriving key
information from previous studies. For the United States, Baker and Lee (1993) and Blivens
(2003) identify the modal estimate of the employment “respending multiplier” tied to paid labor
as 50 percent of the spender’s wage. In Tiers 1 to 3 of the commodity chain, approximately $48
is paid to Chinese waged and salaried workers out of the total cost of an iPad. Because of the
31 Such informal sector inputs are documented in a limited fashion for Chinese iPad factories (China Labor Watch
2012a, 2012b; Pun and Chan 2012).

Dark Value in Global Commodity Chains 102
extraordinary high savings rate in China, I reduced to 33 percent the income multiplier that funds
extended employment. Consequently, the $48 paid out to Chinese iPad laborers generates
another $16 payment to other Chinese workers. However, these laborers are situated in the
informal sector, earning about the minimum wage, or about one-half the country’s average
manufacturing wage. In buying the labor power of these underpaid workers, the Chinese
purchaser receives a 100 percent bonus in dark value. This bonus is a capture of local dark value
from the hidden sub-economy of Braudel’s “material life,” and it is a necessary pillar of waged
work in the market economy. In this way, the underpaid labor power of cheaper support work is
embedded in the iPad, now as globalized dark value. By applying the minimum wage ratio
between China and the United States as a multiplier, we see that $144 of veiled value is added to
the iPad. Even though most scholars would consider them to be outside the commodity chain, the
savings from the unpaid services of this Chinese underclass contributes dark value to that chain
that is nearly equivalent to Apple’s gross profit margin for each iPad.
Dark Value from Ecological Externalities
Ecological degradation and depletion comprise a significant array of externalities through which
Apple suppliers extract dark value. Each iPad uses 33 pounds of minerals (some of which are
rare and limited in supply), 79 gallons of water and enough fossil-fuel based electricity to
generate 66 pounds of carbon dioxide (Ecolibris 2012). Moreover, the first generation iPad
generates 105 kilograms of greenhouse gas emissions (Apple 2011b). Apple has been attacked
for failing to alleviate numerous environmental problems throughout its Asian supply chains
(China Watch 2012a; Ecolibris 2012; Friends of Nature 2011). A comparison of Apple (2011a,
2013) factory audits in 2010 and 2012 shows little or no improvement with respect to supplier
management of hazardous substances, wastewater, air emissions, solid waste, or required
governmental environmental permits and reporting. Moreover, Asian NGOs accuse Apple
suppliers of causing chemical emissions, heavy metal discharges, air pollution, and water
degradation that endanger the lives of people in areas adjacent to factories. NGOs also pinpoint
worker exposure to hazardous substances that cause life-threatening illnesses and cancers
(Friends of Nature 2011).
Unfortunately, there are no studies of the monetary value of such ecological costs. In
order to obtain a rough measure, I began with the World Bank (2007) estimate that the total cost
of air and water pollution in China is 5.78 percent of the GDP.32 Since the electronics industry is
an extremely heavy polluter and ecological cleanup is highly expensive, I assumed that the
percentage cost of pollution per iPad would be greater than that found for the GDP, or roughly 9
percent. Multiplying that ratio by the costs of production in China ($207) leads to an estimate of
$19 per unit (reported in Part C, Column A).33 To estimate what ecological cleanup would cost at
32 I arrive at a very conservative estimate because several types of ecological degradation are not covered by this
World Bank estimate. 33 This estimate is conservative as it is based only on production in Tiers 1 and 2. The figure represents the share of
the factory price ($275 in Table 1) of the components produced in China. I have not estimated the unpaid
environmental costs of the remaining $68 worth of components produced elsewhere in Asia.

103 Journal of World-Systems Research
U.S. rates, I employed a multiplier of ten.34 In Table 4 (Part C), I very conservatively estimate
that the dark value savings to Apple of not paying for some ecological externalities is $190 per
iPad. This ecological unequal exchange (cf. Jorgensen and Rice 2012) is nearly double Apple’s
operating profit margin.
Table 5. Summary of Dark Value Embedded in Each iPad Unit
Sources of Dark Value Extraction US$ Dark Value
Waged Labor
Professional, Managerial, & Headquarters Office Labor
397
175
Labor Subtotal 572
Household Labor Externalities
Underpaid and Unpaid Informal Sector
Unpaid Ecological Externalities
171
144
190
Externalities Subtotal 505
Total 1,077
Sources: Tables 3 and 4
Conclusion
The world-economy operates on a large base of unmeasured, uncosted and unrecognized dark
energy. The task of economic elites is to transform a small portion of that dark energy into bright
value that can be sold, accumulated and further expanded. However, much of the expended dark
energy occurs in the forms of unpaid labor and uncosted externalities that are not transformed
into bright value but are embedded in commodities as value beyond price that benefits
consumers. Although commodity chains differ in specifics, this passage from dark energy to dark
value is a basic component of all such chains.35 In this sense, such chains can be viewed as
global dark value chains. I have examined the Apple iPad as an example of the ongoing
incorporation of dark energy into a material commodity. The estimated total dark value
embedded in each iPad is $1,077 (see Table 5), an amount that is ten times greater than Apple’s
operating profit margin and more than twice the retail price (see Table 1).36
34 I assume that the costs of pollution are roughly equivalent to cleanup costs and that the cleanup costs can be
measured roughly in terms of wage/salary costs. This multiplier is the average of multipliers reported for waged
workers and engineers in Table 6, Appendix. 35 Dark value analysis can also be applied to countries, subnational regions and class hierarchies. For example, the
Chinese household registration system generates a national class-based dark value system independent of its role in
global commodity chains. See earlier discussion of migratory workers. 36 My dark value estimates are quite conservative because so much of the commodity chain is still concealed from
public view. The full calculation of dark value in any commodity chain would necessitate public transparency about
transactions that capitalists keep deeply concealed. Capitalists do not intend for us to be able to demystify all the
levels at which they benefit from costed and uncosted surpluses, for public revelation would diminish their capacity
to extract dark value. Consequently, I have been unable to quantify a great deal of dark value that is embedded in the
iPad, including public subsidies and costs externalized to rural communities and women. In addition, Apple
externalizes numerous short-term and long-term costs to workers that are not captured in my dark value estimates.

Dark Value in Global Commodity Chains 104
Even though such dark value is concealed from scholarly and accounting calculations of
“value-added” and gross/operating profit margins, this real value is nearly 32 times greater than
the total operating margin of all the capitalists other than Apple in Tiers 1 and 2 of the
production chain (See Table 2). Apple’s operating profit margin of $106 (Table 2) can be
explained by its ability to extract $572 worth of dark value of cheap labor from its supply chain
(Table 5), about the same as the bright value retail price. Without cheap labor, the retail price
would double, possibly reducing profit to zero. The extension of the dark value concept beyond
low-paid labor to include the informal sector, household labor and ecological degradation is
meant to demonstrate the significance of unpaid externalities to commodity chains. The total
value of these uncosted inputs is $505 (see Table 5), an amount that is 3.4 times Apple’s
operating profit margin (see Table 2). Moreover, this embedded dark value exceeds the retail
price (Table 1). Thus, we are enlightened about why Steve Jobs was confident that production
will never return to the United States.
While I have focused on the Apple iPad commodity chain, it is important to recognize
that the mechanisms of dark value drain that are manipulated so effectively by Apple are
replicated in every global commodity chain. What the Apple iPad supply chain shares with other
forms of export-oriented industrial commodity chains is its use of surplus labor to comparative
advantage. Arthur Lewis (1954) would be astounded at the successful use of his model in China,
going beyond selling surplus labor power at give-away levels. The Chinese state uses its
monopolistic control of its labor surplus to provide a degree of monopoly to entrepreneurs who,
in turn, sell this advantage to core capitalists. The scope of the sale of cheap labor is so great that
it allows for both a large external surplus drain and a large semiperipheral accumulation, an
historical economic precedent still under-theorized. It represents a new regime of global
accumulation, but it has in common with previous core-periphery relations the gift of cheap
labor. Apple’s iPad price is based on this gift. It is the core of the Apple, and the core of the
Apple is the historic core of the world-system: the drain of surplus from the (semi)periphery,
largely through the drain of the value of labor power.
Like other capitalists, Apple gains its profits through the strong degrees of monopoly it
garners from its design, production and marketing strategies. In addition, Apple extracts
enormous levels of dark value that both widen profit margins and keep consumer prices low.
Since Apple has the advantage of such dark energy, it can expand sales by applying a large
portion of these unpaid production costs to lower prices. We should not underplay the wonders
of the capitalist world-system for the workers in the core, and we should not underestimate the
importance of the consumer surplus.37 Most dark value is passed on to distant consumers in the
For an extended discussion of the elements of dark value that I have not been able to include in these estimates, see
http://filebox.vt.edu/users/wdunaway/Clelland/SurplusDrain/Missing.pdf. 37 My argument is a radical variant of the neo-classical economic concept of consumer surplus. My use of the
concept consumer surplus differs from most other scholars who focus on subjective utility, the difference between
real price and what an individual would be willing to pay (see www.businessdictionary.com/definition/consumer-
surplus.html). My usage points toward the objective reality of the hidden value of unpaid costs to consumers. The
passage of such a large proportion of dark value suggests that most analyses underplay the advantage of North-South
trade to the core consumer. It is true, however, that this unrecorded advantage of consumer surplus is vaporous. It
disappears with consumption, so it does not directly provide the advantage of bright value, i.e., availability for
expanded investment.

105 Journal of World-Systems Research
form of lower prices than would have been possible had production taken place in the core. This
question arises: Does the transnational capitalist class, through the international division of labor,
often provide more benefits for the core working and middle classes than it captures for itself? In
the case of the iPad, most of the expropriated dark value is realized, not as corporate profit, but
as consumer surplus in the form of cheaper goods. Consequently, the core citizen becomes an
unwitting beneficiary of this exploitative system when (s)he uses one waged hour to purchase a
product that embodies many more lower-waged and unpaid hours and many under-valued
material and ecological inputs. In this manner, core citizens become a global consumerist
aristocracy.38
References
Ali-Yokko, Jyrki et al. 2011. “Who Captures Value in Global Supply Chains?” Research
Institute of the Finnish Economy, Discussion paper 1240.
Amin, Samir. 1976. Unequal Development. New York: Monthly Review Press.
_______. 2003. “World Poverty, Pauperization and Capital Accumulation.” Monthly Review 55
(5): 1-9.
_______. 2010. The Law of Worldwide Value. New York: Monthly Review Press.
Apple Corporation. 2005. “Apple Supplier Code of Conduct,” www.apple.com.
_______. 2011a. “Apple Supplier Responsibility: 2010 Progress Report,” www.apple.com.
_______. 2011b. “ipad Environmental Report,” www.apple.com.
_______. 2012. “Apple Suppliers List, 2011,” www.apple.com.
_______. 2013. “Apple Supplier Responsibility: 2012 Progress Report,” www.apple.com.
Arrighi, Giovanni. 1994. The Long Twentieth Century: Money, Power and the Origins of Our
Times. London: Verso.
Arrighi, Giovanni, and Jessica Drangel. 1986. “The Stratification of the World-Economy.”
Review 10(1): 9-74.
Bair, Jennifer. 2009. “Global Commodity Chains: Genealogy and Review.” In Frontiers of
Commodity Chain Research, ed. Jennifer Bair. Stanford: Stanford University Press, 1-35.
Baker, Dean and Thea Lee. 1993. “Employment Multipliers in the U.S. Economy.” Washington,
D.C.: Economic Policy Institute, Working Paper 107.
Bannister, Judith and George Cook. 2011. “China’s Employment and Compensation Costs in
Manufacturing through 2008.” Monthly Labor Review (March): 39-52.
Beneria, Lourdes. 1999. "The Enduring Debate Over Unpaid Labor." International Labour
Review 138(3): 287-309.
Blivens, Josh. 2003. “Updated Employment Multipliers for the U.S. Economy.” Washington,
D.C.: Economic Policy Institute, Working Paper 268.
38 This is a word play on the “aristocracy of labor” debate (Communist Working Group 1986; Cope 2012).

Dark Value in Global Commodity Chains 106
Bonacich, Edna. 1972. “A Theory of Ethnic Antagonisms and the Split Labor Market.”
American Sociological Review 37(5): 547-59.
Boudreau, John. 2012. “Apple Taps Obscure Asian Suppliers to Bring the iPhone and Other
Products to the Masses.” Mercury News (26 September),
www.mercurynews.com/business/.
Braudel, Fernand. 1981. Civilization and Capitalism, 15th to 18th Century. Translated by Sian
Reynolds. New York: Harper and Row, 3 vols.
Brewer, Benjamin. 2011. “Global Commodity Chains and World Income Inequalities: The
Missing Link of Inequality and the ‘Upgrading Paradox.’” Journal of World-Systems
Research 17(2): 308-27.
Bureau of Labor Statistics. 2010. “International Comparisons of Hourly Compensation Costs in
Manufacturing, 2011.” U.S. Department of Labor,
www.bls.gov/news.release/pdf/ichcc.pdf.
_______. 2013. “International Comparisons of Hourly Compensation Costs in Manufacturing
Industries, 2011,” www.bis.gov.ilc.
China Labor Watch. 2012a. “Beyond Foxconn: Deplorable Working Conditions Characterize
Apple’s Entire Supply Chain,” www.chinalaborwatch.org.
_______. 2012b. “Tragedies of Globalization: The Truth behind Electronics Sweatshops,”
www.chinalaborwatch.org.
Clelland, Donald A. 2012. “Surplus Drain and Dark Value in the Modern World-System.” In
Routledge Handbook of World-Systems Analysis, eds. Salvatore Babones and Christopher
Chase-Dunn. London: Routledge, 197-205.
_______. 2014. “Unpaid Labor as Dark Value in Global Commodity Chains.” In Gendered
Commodity Chains: Seeing Women’s Work and Households in 21st Century Global
Production, ed. W. A. Dunaway. Stanford: Stanford University Press, 72-87.
Communist Working Group. 1986. Unequal Exchange and the Prospects of Socialism.
Copenhagen: Manifest Press.
Cope, Zaki. 2012. Divided World, Divided Class: Global Political Economy and the
Stratification of Labour Under Capitalism. Montreal: Kersplebedeb.
Dediu, Horace. 2012. “How Much Does It Take to Manufacture an iPhone.” ASYMCO (14
April), www.asymco.com.
_______. 2013. “Apple Retail Revenues per Visitor Reach New Record.” ASYMCO (20 May),
www.asymco.com.
Dedrick, Jason, Kenneth Kraemer and Greg Linden. 2009. “Who Profits from Innovation in
Global Value Chains? A Study of the iPod and Notebook PCs.” Industrial and Corporate
Change 19(1): 81-116.
Diedrich, Philippe. 2013. “Are Manufacturing Jobs Moving Back to the U.S.?” VOXXI (13 July),
www.voxxi.com.
Duhigg, Charles. 2012. “Apple’s Jobs to Obama.” New York Times (23 January).
Duhigg, Charles and David Barboza. 2012. “In China, Human Costs Are Built into an iPad.”
New York Times (25 January).

107 Journal of World-Systems Research
Dunaway, Wilma A. 2003. “Women’s Labor and Nature: The 21st Century World-System from a
Radical Ecofeminist Perspective.” In New Theoretical Directions for the 21st Century
World-System, ed. W. A. Dunaway. Westport, CT: Praeger, 183-202.
_______. 2012. “The Semiproletarian Household over the Longue Duree of the World-System.”
In The Longue Durée of the Modern World-System, ed. Richard Lee. Albany, NY: SUNY
Press.
_______. ed. 2014. Gendered Commodity Chains: Seeing Women’s Work and Households in
Global Production. Stanford: Stanford University Press.
Ecolibris. 2011. “How Green Is Your iPad?” http://www.ecolibris.net/ipad.asp.
Economix Editors. 2010. “The iEconomy: How Much Do Foxconn Workers Make?” New York
Times (February 24).
Ellinor, Rebecca. 2013. “Apple Named World’s Best Supply Chain.” Supply Management (24
May), www.supplymanagement.com.
Emmanuel, Argarhi. 1972. Unequal Exchange: A Study of the Imperialism of Trade. London:
New Left Books.
EPT Newsletter. 2010, www.ventureoutsource.com (April).
Fair Labor Association. 2012. “Independent Investigation of Apple Supplier, Foxconn,”
www.fairlabor.org.
Fan, Cindy. 2004. “The State, the Migrant Labor Regime and Maiden Workers in China.”
Political Geography 23: 283-305.
Foster, John, and Robert McChesney. 2012. “The Global Stagnation and China.” Monthly
Review 63(9): 3-21.
Friends of Nature. 2011. “The Other Side of Apple,” www.ipe.org.cn.
Gereffi, Gary, John Humphrey, and Timothy Sturgeon. 2005. “The Governance of Global Value
Chains.” Review of International Political Economy 12(1): 78-104.
Goldman, David. 2012. “Why Apple Will Never Bring Manufacturing Jobs Back to the U.S.”
CNN Money (17 October).
Hangen, Nathan. 2010. “7 Key Strategies that You Must Learn from Apple’s Marketing.”
Kissmetrics (13 April), http://blog.kissmetrics.com.
Hopkins, Terence and Immanuel Wallerstein. 1986. "Commodity Chains in the World-Economy
Prior to 1800." Review 10(1): 157-70.
Huang, Yasheng. 2008. Capitalism with Chinese Characteristics: Entrepreneurship and the
State. London: Cambridge University Press.
ifixit. 2010. “ipad 3G Teardown.” (30 April), www.ifixit.com.
International Labour Organization. 2001. “World Labour Report 2000: Income Security and
Social Protection in a Changing World,” www.ilo.org/publns.
Jorgensen, Andrew, and James Rice. 2012. “The Sociology of Ecologically Unequal Exchange in
Comparative Perspective.” In Routledge Handbook of World-Systems Analysis, eds.
Salvatore Babones and Christopher Chase-Dunn. London: Routledge, 431-39.
Kalecki, M. 1954. Theory of Economic Dynamics: An Essay on Cyclical and Long-run Changes
in the Capitalist Economy. London: Allen and Unwin.
Kaplinsky, Raphael and Mike Morris. 2001. A Handbook for Value Chain Research. Cape
Town: University of Cape Town.

Dark Value in Global Commodity Chains 108
Kraemer, Kenneth, Greg Linden, and Jason Dedrick. 2011. “Capturing Value in Global
Networks: Apple’s iPad and Phone.” University of California Irvine,
http://pcic.merage.uci.edu.
Kumar, Rakesh. 2008. Fabless Semiconductor Implementation. New York: McGraw Hill.
Lasky, Ron. 2010. “Assembled Cost of an iPad,” http://blogs.indium/blog/an-interview-with-the-
professor.
Lewis, Arthur. 1954. “Economic Development with Unlimited Supplies of Labour.” Manchester
School 22 (May): 139–91.
Lin, Vivian. 2004. “Women Workers and Health: Semiconductor Industry in Singapore and
Malaysia.” In Women Workers in Industrialising Asia: Costed, Not Valued, ed. Amarjit
Kaur. New York: Palgrave Macmillan, 173-94.
Linden, Greg, Jason Dedrick and Kenneth Kraemer. 2011. “Innovation and Job Creation in a
Global Economy: The Case of Apple’s iPod.” Journal of International Commerce and
Economics 3: 233-39.
Lino, Mark. 2012. “Expenditures on Children by Families, 2011.” Center for Nutrition Policy
and Promotion, U.S. Department of Agriculture, Miscellaneous Publication, 1528-2011.
Locke, Richard. 2013. The Promise and Limits of Private Power: Promoting Labor Standards in
a Global Economy. London: Cambridge University Press.
Marx, Karl. 1858. Grundrisse: Outlines of the Critique of Political Economy. Notebook 4.
Archived at www.marxists.org/archive/marx/works/1857/grundrisse/ch08.htm.
_______. 1993. Capital. New York: Penguin Classics, 3 vols.
Mies, Maria, Veronika Bennholdt-Thomsen, and Claudia von Werlhof. 1988. Women: The Last
Colony. London: Zed Books.
Miller, Jeffrey and Thomas Vollmann. 1985. “The Hidden Factory.” Harvard Business Review
(September): 142-50.
Moorman, Christine. 2012. “Why Apple Is a Great Marketer.” Forbes (10 July).
Panek, Richard. 2011. The 4 Percent Universe: Dark Matter, Dark Energy, and the Race to
Discover the Rest of Reality. New York: Houghton Mifflin.
Parnreiter. Christof. 2012. “Global Cities, Global Commodity Chains and the Geography of
Core-ness in the Capitalist World-System.” In Routledge Handbook of World-Systems
Analysis, eds. Salvatore Babones and Christopher Chase-Dunn. London: Routledge, 231-
238.
Portes, Alejandro. 1983. “The Informal Sector: Definition, Controversy and Relation to National
Development.” Review 7(1): 151-74.
Pun, Ngai. 2007. “Gendering the Dormitory Labor System: Production, Reproduction, and
Migrant Labor in South China.” Feminist Economics 13(3): 239-58
Pun, Ngai, and Lu Huilin. 2010. “Unfinished Proletarianization: Self, Anger and Class Action of
the Second Generation of Peasant Workers in Reform China.” Modern China 3(5): 493-
519.
Pun, Ngai, and Jenny Chan. 2012. “Global Capital, the State, and Chinese Workers: The
Foxconn Experience.” Modern China 38(4): 383-410.

109 Journal of World-Systems Research
Qi, Liangshu and Xiao-Yuan Dong. 2013. “Housework Burdens, Quality of Market Work Time,
and Men’s and Women’s Earnings in China.” University of Winnipeg, Department of
Economics, Working Paper 2013-01.
Rassweiler, Andrew. 2010. “User-Interface-Focused iPad Changes the Game in Electronic
Design,” www.isuppli.com (April 7).
Roach, Stephen. 2004. “How Global Labor Arbitrage Will Shape the World Economy.” Global
Agenda Magazine, www.globalagendamagazine.com/2004/stephenroach.asp.
Robinson, Joan. 1993. The Economics of Imperfect Competition. London: Macmillan.
[SACOM] Students and Scholars against Corporate Misbehavior. 2011. “Foxconn and Apple
Fail to Fulfill Promises: Predicaments of Workers after the Suicides,”
http://sacom.hk/archives/837.
Salary Wizard. 2013. “Electronics Assembler I.” www.salarywizard.com (July).
Satariano, Adam and Peter Burrows. 2011. “Apple's Supply-Chain Secret? Hoard Lasers.”
Bloomberg Businessweek (3 November).
Selden, Mark and Wu Jieh-min. 2011. “The Chinese State, Incomplete Proletarianization and
Structures of Inequality in Two Epochs.” Japan Focus (26 May).
Smith, Joan and Immanuel Wallerstein, eds. 1992. Creating and Transforming Households: The
Constraints of the World-Economy. Cambridge: Cambridge University Press.
Smith, Joan, Immanuel Wallerstein, and Hans-Dieter Evers, eds. 1984. Households and the
World-Economy. Beverly Hills, CA: Sage.
Sturgeon, Timothy and Ji-Ren Lee. 2005. “Industry Co-Evolution: A Comparison of Taiwan and
North American Electronics Contracts Manufacturers.” In Global Taiwan: Building
Competitive Strengths in a New International Economy, eds. Suzanne Berger and Richard
Lester. Armonk: M.E. Sharpe, 33-75.
Sustainable Trade Initiative. 2011. “Electronics,” www.idhsustainabletrade.com/electronics.
Tabak, Faruk and Michaeline Crichlow, eds. 2000. Informalization: Process and Structure.
Baltimore: Johns Hopkins University Press.
Talbot, John. 2004. Grounds for Agreement: The Political Economy of the Coffee Commodity
Chain. Boulder: Rowman and Littlefield.
_______. 2011. “The Coffee Commodity Chain in the World-Economy: Arrighi’s Systemic
Cycles and Braudel’s Layers of Analysis.” Journal of World-Systems Research 17(1): 58-
88.
Thomke, Stefan and Barbara Feinberg. 2010. “Design Thinking and Innovation at Apple.”
Harvard Business School, Case 9-609-066.
Thompson, Nicholas. 2012. “Does Apple Have a Bruise? New Yorker (5 October).
Tu, Nan and Danju Zhang. 2010. “How Much Does it Cost to Make It? Product Costing in a
Chinese Small Manufacturing Company.” Paper presented to the 8th International
Conference on Supply Chain Management and Informational Systems, Hong Kong,
October 6-9.
United Nations. 2003. The World's Women 2000: Trends and Statistics. New York: Oxford
University Press.
Wallerstein, Immanuel. 1983. Historical Capitalism. London: Verso.

Dark Value in Global Commodity Chains 110
_______. 1987. “Historical Systems as Complex Systems.” European Journal of Operational
Research 30: 203-207.
_______. 2004. World-systems Analysis: An Introduction. Durham: Duke University Press.
_______. 2009. “Crisis of the Capitalist System: Where Do We Go from Here?” MRZine (11
December), http://mrzine.monthlyreview.org/2009/wallerstein121109.html.
Wieland, Devin. 2012. “Apple’s Thermonuclear War in Mobile Patent Litigations.”
AppChronicles (11 July).
Wikipedia. 2013. “iPad,” www.wikipedia.org.
Wilcox, Joe. 2011. “Apple Patent Lawsuits Are Hypocritical.” BetaNews (24 September).
_______. 2012. “Apple's Perception Problem Is HUGE.” BetaNews (17 December).
Wingfield, Nick. 2012. “Apple Case Muddies the Future of Innovation.” New York Times (26
August).
World Bank. 2007. “Cost of Pollution in China,” http://go.worldbank.org/FFCJVBTP40.
Yoffie, David and Renee Kim. 2011. “Apple in 2010.” Harvard Business School, Case 9-710-
467.
Yu, Mi, Xu Xiao Hing and Apo Leong. 2008. “Informal Employment in China,” Paper presented
at Asia Pacific Research Network Conference, Cebu, Philippines (December 4).
Zeiler, David. 2012. “Why Apple Won't Ditch Controversial Foxconn.” Money Morning
(September 27).

111 Journal of World-Systems Research
Appendix
Table 6. Dark Value from Underpaid Labor in the iPad Tier 2 Suppliers
Basis
A
$ Cost per Unit
B
U.S.
Multiplier
C
$ Cost if produced
in U.S.
D
$ Dark
Value
Waged Labor in Direct
Production
China & Philippines 19
Korea 4
Taiwan 2
12
2
5
228
8
10
209
4
8
Engineers & Management in
Production Facilities
China & Philippines 12
Korea 5
Taiwan 3
8
3
4
96
15
12
84
10
9
Totals 45 369 324 Sources and Notes: The direct production wage ($25) is taken from Kraemer et al. (2011: 11) who estimate that only about $2 of
this is paid to Chinese labor. On the basis of Apple (2012) and internet reports by each of the direct suppliers about factories near
the iPad assembly sites, I located probable production sites. I allocated $16 to Chinese labor and $3 to Philippine workers, the
location of a Toshiba factory. The difference between these estimates is largely based on distinguishing between subassembly in
China and component production in countries other than China in 2010. “Many components, such as batteries and touchscreens,
receive their final processing in China in factories owned by foreign firms” (Kraemer et al. 2011: 8). I estimate the Chinese wage
at $2 per hour (2010), a generous upgrading of the $1.36 reported by the Bureau of Labor Statistics for 2008 (Bannister and Cook
2011) and the cost reported for Samsung’s Chinese factories, $1.30 to $1.60 base pay in 2012 (China Labor Watch 2012b). The
Korean wage ($23) and the Taiwanese wage ($10) are from BLS (2013); the multipliers are 2 and 5. The U.S. rate that I use is the
“median expected wage” for a typical Electronics Assembler II: $35,000 basic wage, plus $17,000 in benefits, thus $52,000 year
(Salary Wizard 2013). I adjusted this number downward to $48,000 to account for raises since 2010, thus $24 per hour, leading to
a multiplier of 12. For the basis for estimating the salary costs of engineers/management, see Table 3. The measures and
multipliers are derived from Linden et al. (2011). Numbers are rounded.
Table 7. Dark Value Extracted from Underpaid Labor in Tier 3 ( Non-Core Production of
Subcomponents)
Basis
A
$ Cost per
Unit
B
U.S. Multiplier
C
$ Cost if produced
in U.S.
D
$ Dark
Value
NIC Waged Labor in Direct
Production
6 Range of 2 to 5 for
Korea and Taiwan
15 9
Chinese Waged Labor in Direct
Production
6 12 72 66
NIC Engineers & Management in
Production Facilities
7 Range of 2 to 5 for
Korea and Taiwan
23 16
Chinese Engineers & Management
in Production Facilities
3 8 24 21
Totals 22 134 112 Sources and Notes: NIC refers to Korea and Taiwan. In order to estimate the dark value contribution from these tiers, it is
necessary to continue the process of “teardown” or reverse engineering. I traced the likely main suppliers of Tier 2 by home and
production locations. Much of the production in this tier is by subsidiaries. The supply chains of Korean firms are largely in
Korea. Other firms that have subassembly plants in China tend to have immediate suppliers there. In Part A, the estimated costs
of materials for Tier 2 suppliers ($154) is the received sales price for the Tier 3 sub-component suppliers. This $154 must be
allocated in four ways: for previously obtained materials, direct labor, gross margin (overhead and profit), and value added taxes,
17%, if collected, in China. After deducting the tax cost, the other costs were distributed in accordance with patterns found in
Tier 2. The basis for the estimation of wage and salary rate and multipliers is found in Table 6 notes. Indirect costs have been
estimated in the manner previously indicated. The multiplier for cheap labor zones direct production wages and NIC
compensation costs from overhead are carried over from Table 6. The multiplier for cheap labor zones compensation costs from
overhead is derived from the Linden et al.’s (2011: 229) estimate of engineers’ average salaries in the U.S. and China.