the contribution of working forests to the economy of the ...data.workingforests.org/doc/wfpa...
TRANSCRIPT
The Contribution of Working Forests to the
Economy of the State of Washington,
by County, 2013
©2015 Forest2Market.
Page 2
Forest2Market®
The Contribution of Working Forests to the
Economy of the State of Washington,
by County, 2013
Prepared for:
Washington Forest Protection Association
Cindy Mitchell
Sr. Director of Public Affairs
724 Columbia St NW, Suite 250
Olympia, WA 98501
Provided by:
Forest2Market, Inc.
15720 Brixham Hill Avenue, Suite 550
Charlotte, NC 28277
Date: September 30, 2015
Our commitment to deliver the most accurate, credible and quantitative market insight to
our customers has never wavered. Our customers make better-informed decisions and
thrive because they have credible and consistent measures of their performance
compared to the broader market.
©2015 Forest2Market.
Page 3
Forest2Market®
Contents
Overview ................................................................................................................................................................. 4
Data Sources ........................................................................................................................................................... 4
Methodology ........................................................................................................................................................... 4
Results ..................................................................................................................................................................... 6
By State ............................................................................................................................................................... 6
Employment and Wages by County ................................................................................................................... 7
Revenue by County ............................................................................................................................................. 8
Taxes by County ................................................................................................................................................. 9
©2015 Forest2Market.
Page 4
Forest2Market®
Overview
In Washington State, there are 23 million acres of forest, of which nearly 11 million acres (or 47%) are working
forests. According to the Washington Forest Protection Association (WFPA), the vast majority of timber
harvested in Washington (70%) in 2014 originated from privately-owned timberlands. By contrast, 19 percent
was harvested from state and county lands, 8 percent from tribal lands and the remaining 3 percent from federal
lands.
When timber is harvested, it becomes an economic engine that drives activity, including employment, wages
and revenue for both state and local governments. The WFPA engaged Forest2Market to quantify the economic
impacts of these working forests that benefit the state of Washington and its citizens. This report demonstrates
our findings for 2013, the most current year of data available.
Data Sources
Forest2Market pulled the necessary raw data from both state and federal sources. These were:
1. 2013 County Business Patterns Data by county and NAICS code, U.S. Census Bureau (CBP)
2. 2013 State Quarterly Census of Employment and Wages by county and NAICS code, Bureau of Labor
Statistics (QCEW)
3. 2013 U.S. Import and Export Merchandise trade statistics by port and commodity, U.S. Census Bureau
4. Regional Input-Output Modeling System (RIMS II), Bureau of Economic Analysis
5. 2013 Public and Private Harvest Statistics, Washington State Department of Revenue
6. 2013 Gross Business Income, Washington State Department of Revenue
7. 2013 Valuation of Privately-Owned Designated Forestland, Washington State Department of Revenue
8. Comparison of Average Levy Rates by Year Due, Washington State Department of Revenue
These sources are referred to by number in the methodology section.
Methodology
Step One:
Forest2Market reviewed the publicly available data on both the state and federal level to understand the most
recent year that complete data sets had been released. Calendar year 2013 was chosen as the study year for the
update.
Step Two:
Forest2Market included all 39 counties in the state of Washington in the study.
Step Three:
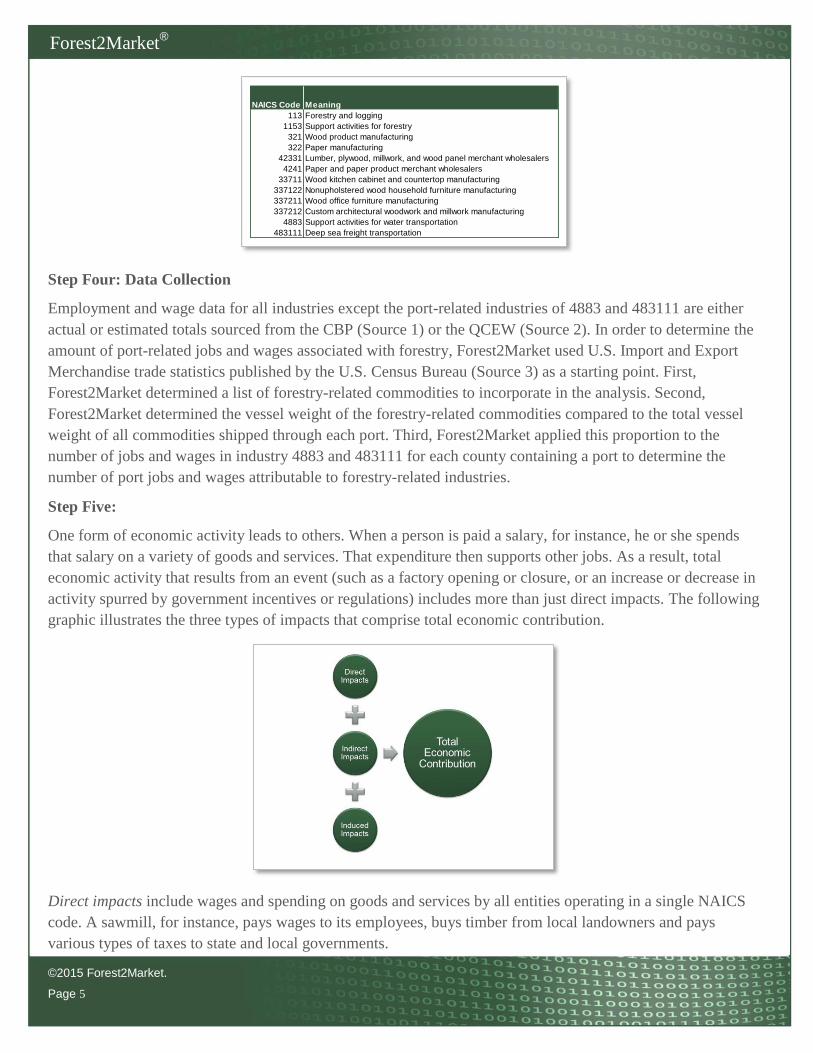
Forest2Market and the WFPA determined the North American Industry Classification System (NAICS) codes
that were used to quantify the economic contribution of working forests. NAICS codes are the standard used by
Federal agencies to classify business establishments for the purpose of collecting, analyzing and publishing
statistical data related to the US business economy. Data for the following NAICS codes were aggregated:
©2015 Forest2Market.
Page 5
Forest2Market®
Step Four: Data Collection
Employment and wage data for all industries except the port-related industries of 4883 and 483111 are either
actual or estimated totals sourced from the CBP (Source 1) or the QCEW (Source 2). In order to determine the
amount of port-related jobs and wages associated with forestry, Forest2Market used U.S. Import and Export
Merchandise trade statistics published by the U.S. Census Bureau (Source 3) as a starting point. First,
Forest2Market determined a list of forestry-related commodities to incorporate in the analysis. Second,
Forest2Market determined the vessel weight of the forestry-related commodities compared to the total vessel
weight of all commodities shipped through each port. Third, Forest2Market applied this proportion to the
number of jobs and wages in industry 4883 and 483111 for each county containing a port to determine the
number of port jobs and wages attributable to forestry-related industries.
Step Five:
One form of economic activity leads to others. When a person is paid a salary, for instance, he or she spends
that salary on a variety of goods and services. That expenditure then supports other jobs. As a result, total
economic activity that results from an event (such as a factory opening or closure, or an increase or decrease in
activity spurred by government incentives or regulations) includes more than just direct impacts. The following
graphic illustrates the three types of impacts that comprise total economic contribution.
Direct impacts include wages and spending on goods and services by all entities operating in a single NAICS
code. A sawmill, for instance, pays wages to its employees, buys timber from local landowners and pays
various types of taxes to state and local governments.
NAICS Code Meaning
113 Forestry and logging
1153 Support activities for forestry
321 Wood product manufacturing
322 Paper manufacturing
42331 Lumber, plywood, millwork, and wood panel merchant wholesalers
4241 Paper and paper product merchant wholesalers
33711 Wood kitchen cabinet and countertop manufacturing
337122 Nonupholstered wood household furniture manufacturing
337211 Wood office furniture manufacturing
337212 Custom architectural woodwork and millwork manufacturing
4883 Support activities for water transportation
483111 Deep sea freight transportation

©2015 Forest2Market.
Page 6
Forest2Market®
Indirect impacts are the production, employment and income changes occurring in other businesses in the
community that supply inputs to the industry under consideration. For instance, if the manufacturing facility
sourced $75,000 worth of timber from a local landowner and $5,000 in office supplies from a local retailer;
these expenditures produce additional spending in the community as landowners replant trees and the office
supply store stocks the office supplies being used.
Induced impacts are the effects of spending by the households in the local economy as the result of direct and
indirect effects. The induced effects arise when employees who are working for the manufacturing plant spend
their incomes in the community. This in turn sets off a new round of spending, as the employees in the movie
theaters, restaurants and grocery stores go out and spend their own wages.
The sum of the direct, indirect and induced activity associated is the total economic activity associated with any
individual NAICS code.
In order to calculate total economic activity, a multiplier is applied to the direct impact figures. Forest2Market
used RIMS II multipliers from the Bureau of Economic Analysis to determine total economic contribution for
employment and wages.
In addition, because forestry-related industries that rely on working forests are interrelated, often providing
inputs to each other, Forest2Market used the Washington input/output table (2007 Washington Input-Output
Table created by William B. Beyers and Dr. Ta-Win Lin) to estimate overcount and ensure that direct jobs in
one industry were not counted as indirect jobs in another. Total jobs and wages in this report exclude overcount.
Results
By State
The following table shows the statewide results of this study. In 2013, forestry-related industries in Washington
directly employed 41,466 people. Total compensation for these jobs was over $2.3 billion.
The total direct, indirect and induced impact of forestry-related industries included 104,986 jobs paying nearly
$4.9 billion in wages. Annual sales in forestry-related industries totaled nearly $27 billion, and these industries
paid more than $200 million in taxes in 2013.
Stumpage Sales $945,529,138
Direct Jobs 41,466
Total Direct, Indirect, and Induced Jobs 104,986
Direct Wages $2,327,592,196
Total Direct, Indirect, and Induced Wages $4,879,645,181
Total Revenue $26,526,175,095
Total Taxes $200,829,823
Washington State, 2013
Economic Impact of Forestry-Related Activities
©2015 Forest2Market.
Page 7
Forest2Market®
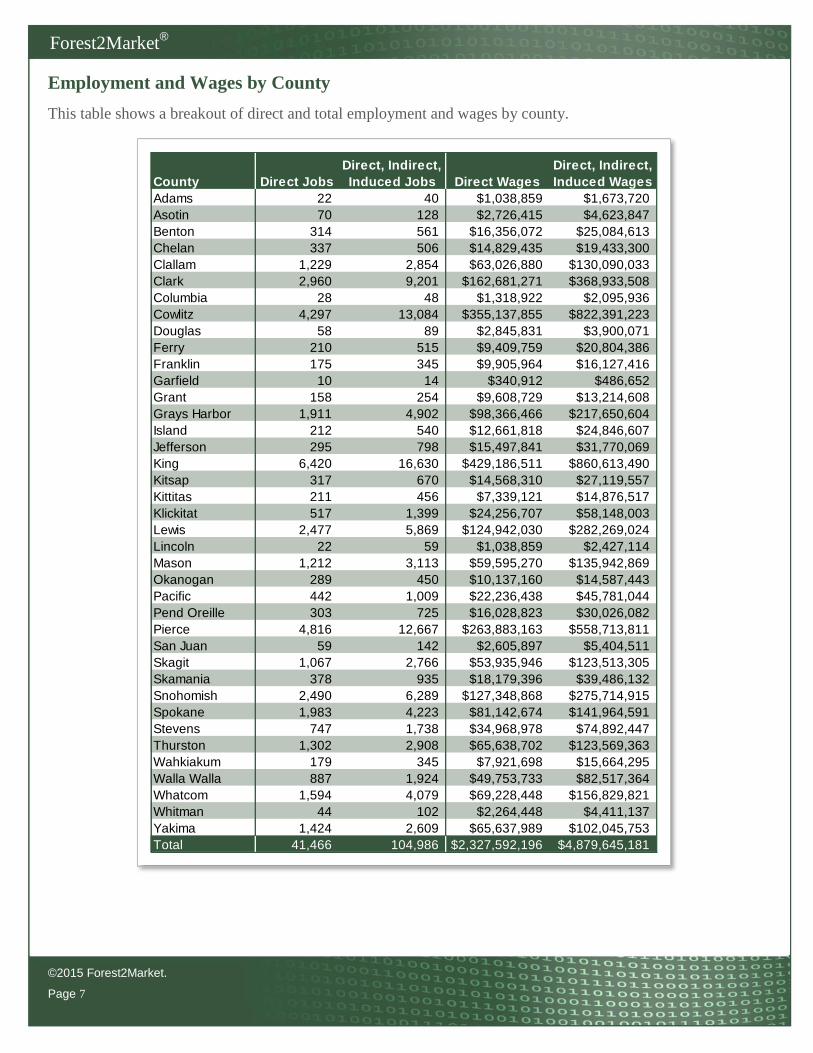
Employment and Wages by County
This table shows a breakout of direct and total employment and wages by county.
County Direct Jobs
Direct, Indirect,
Induced Jobs Direct Wages
Direct, Indirect,
Induced Wages
Adams 22 40 $1,038,859 $1,673,720
Asotin 70 128 $2,726,415 $4,623,847
Benton 314 561 $16,356,072 $25,084,613
Chelan 337 506 $14,829,435 $19,433,300
Clallam 1,229 2,854 $63,026,880 $130,090,033
Clark 2,960 9,201 $162,681,271 $368,933,508
Columbia 28 48 $1,318,922 $2,095,936
Cowlitz 4,297 13,084 $355,137,855 $822,391,223
Douglas 58 89 $2,845,831 $3,900,071
Ferry 210 515 $9,409,759 $20,804,386
Franklin 175 345 $9,905,964 $16,127,416
Garfield 10 14 $340,912 $486,652
Grant 158 254 $9,608,729 $13,214,608
Grays Harbor 1,911 4,902 $98,366,466 $217,650,604
Island 212 540 $12,661,818 $24,846,607
Jefferson 295 798 $15,497,841 $31,770,069
King 6,420 16,630 $429,186,511 $860,613,490
Kitsap 317 670 $14,568,310 $27,119,557
Kittitas 211 456 $7,339,121 $14,876,517
Klickitat 517 1,399 $24,256,707 $58,148,003
Lewis 2,477 5,869 $124,942,030 $282,269,024
Lincoln 22 59 $1,038,859 $2,427,114
Mason 1,212 3,113 $59,595,270 $135,942,869
Okanogan 289 450 $10,137,160 $14,587,443
Pacific 442 1,009 $22,236,438 $45,781,044
Pend Oreille 303 725 $16,028,823 $30,026,082
Pierce 4,816 12,667 $263,883,163 $558,713,811
San Juan 59 142 $2,605,897 $5,404,511
Skagit 1,067 2,766 $53,935,946 $123,513,305
Skamania 378 935 $18,179,396 $39,486,132
Snohomish 2,490 6,289 $127,348,868 $275,714,915
Spokane 1,983 4,223 $81,142,674 $141,964,591
Stevens 747 1,738 $34,968,978 $74,892,447
Thurston 1,302 2,908 $65,638,702 $123,569,363
Wahkiakum 179 345 $7,921,698 $15,664,295
Walla Walla 887 1,924 $49,753,733 $82,517,364
Whatcom 1,594 4,079 $69,228,448 $156,829,821
Whitman 44 102 $2,264,448 $4,411,137
Yakima 1,424 2,609 $65,637,989 $102,045,753
Total 41,466 104,986 $2,327,592,196 $4,879,645,181

©2015 Forest2Market.
Page 8
Forest2Market®
Revenue by County
Annual revenue is the Gross Business Income for each NAICS code as reported by the Washington Department
of Revenue. This table breaks out estimated revenue generated by forestry-related industries in 2013 by county.
Annual revenue data are allocated to each county using the ratio of the county’s direct wages to the state total
wages.
County Annual Revenues
Adams $11,839,249
Asotin $31,071,325
Benton $186,400,359
Chelan $169,002,193
Clallam $718,279,628
Clark $1,853,981,070
Columbia $15,030,966
Cowlitz $4,047,293,563
Douglas $32,432,236
Ferry $107,237,393
Franklin $112,892,347
Garfield $3,885,170
Grant $109,504,929
Grays Harbor $1,121,023,736
Island $144,299,164
Jefferson $176,619,620
King $4,891,181,781
Kitsap $166,026,310
Kittitas $83,639,572
Klickitat $276,439,172
Lewis $1,423,889,529
Lincoln $11,839,249
Mason $679,171,622
Okanogan $115,527,149
Pacific $253,415,371
Pend Oreille $182,670,901
Pierce $3,007,318,463
San Juan $29,697,845
Skagit $614,675,696
Skamania $207,179,699
Snohomish $1,451,318,821
Spokane $924,734,484
Stevens $398,520,516
Thurston $748,044,995
Wahkiakum $90,278,845
Walla Walla $567,013,514
Whatcom $788,955,186
Whitman $25,806,553
Yakima $748,036,874
Total $26,526,175,095
©2015 Forest2Market.
Page 9
Forest2Market®
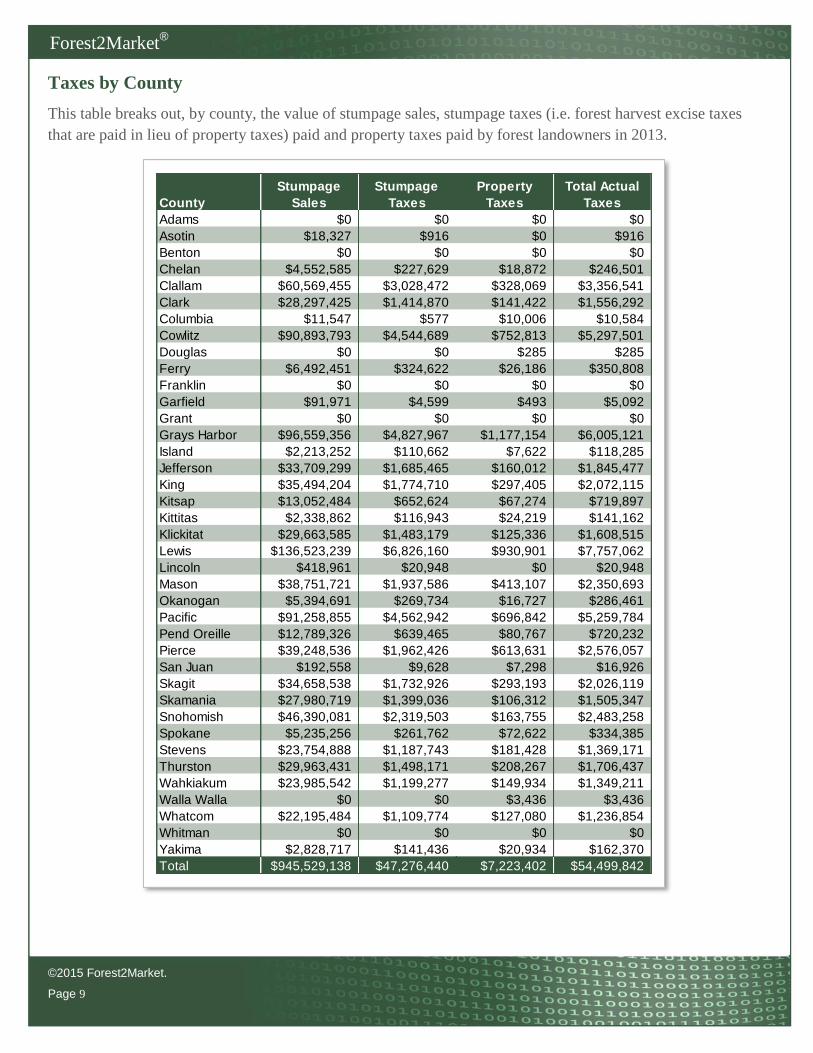
Taxes by County
This table breaks out, by county, the value of stumpage sales, stumpage taxes (i.e. forest harvest excise taxes
that are paid in lieu of property taxes) paid and property taxes paid by forest landowners in 2013.
County
Stumpage
Sales
Stumpage
Taxes
Property
Taxes
Total Actual
Taxes
Adams $0 $0 $0 $0
Asotin $18,327 $916 $0 $916
Benton $0 $0 $0 $0
Chelan $4,552,585 $227,629 $18,872 $246,501
Clallam $60,569,455 $3,028,472 $328,069 $3,356,541
Clark $28,297,425 $1,414,870 $141,422 $1,556,292
Columbia $11,547 $577 $10,006 $10,584
Cowlitz $90,893,793 $4,544,689 $752,813 $5,297,501
Douglas $0 $0 $285 $285
Ferry $6,492,451 $324,622 $26,186 $350,808
Franklin $0 $0 $0 $0
Garfield $91,971 $4,599 $493 $5,092
Grant $0 $0 $0 $0
Grays Harbor $96,559,356 $4,827,967 $1,177,154 $6,005,121
Island $2,213,252 $110,662 $7,622 $118,285
Jefferson $33,709,299 $1,685,465 $160,012 $1,845,477
King $35,494,204 $1,774,710 $297,405 $2,072,115
Kitsap $13,052,484 $652,624 $67,274 $719,897
Kittitas $2,338,862 $116,943 $24,219 $141,162
Klickitat $29,663,585 $1,483,179 $125,336 $1,608,515
Lewis $136,523,239 $6,826,160 $930,901 $7,757,062
Lincoln $418,961 $20,948 $0 $20,948
Mason $38,751,721 $1,937,586 $413,107 $2,350,693
Okanogan $5,394,691 $269,734 $16,727 $286,461
Pacific $91,258,855 $4,562,942 $696,842 $5,259,784
Pend Oreille $12,789,326 $639,465 $80,767 $720,232
Pierce $39,248,536 $1,962,426 $613,631 $2,576,057
San Juan $192,558 $9,628 $7,298 $16,926
Skagit $34,658,538 $1,732,926 $293,193 $2,026,119
Skamania $27,980,719 $1,399,036 $106,312 $1,505,347
Snohomish $46,390,081 $2,319,503 $163,755 $2,483,258
Spokane $5,235,256 $261,762 $72,622 $334,385
Stevens $23,754,888 $1,187,743 $181,428 $1,369,171
Thurston $29,963,431 $1,498,171 $208,267 $1,706,437
Wahkiakum $23,985,542 $1,199,277 $149,934 $1,349,211
Walla Walla $0 $0 $3,436 $3,436
Whatcom $22,195,484 $1,109,774 $127,080 $1,236,854
Whitman $0 $0 $0 $0
Yakima $2,828,717 $141,436 $20,934 $162,370
Total $945,529,138 $47,276,440 $7,223,402 $54,499,842
©2015 Forest2Market.
Page 10
Forest2Market®
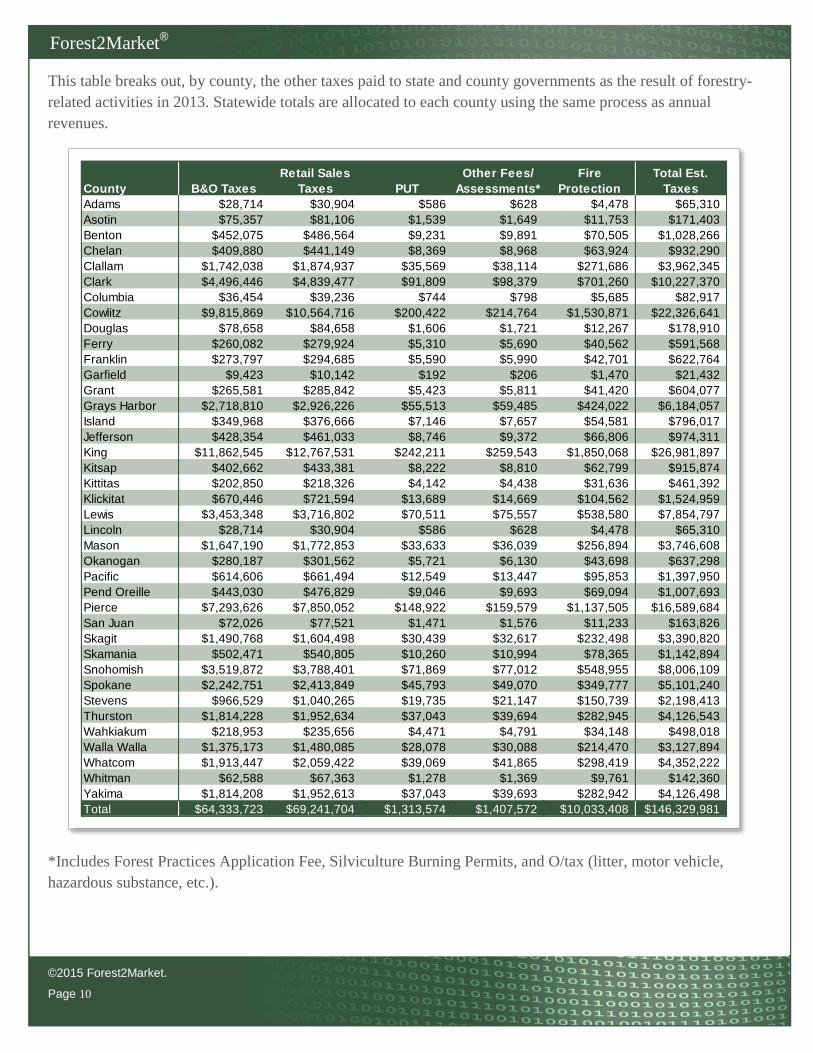
This table breaks out, by county, the other taxes paid to state and county governments as the result of forestry-
related activities in 2013. Statewide totals are allocated to each county using the same process as annual
revenues.
*Includes Forest Practices Application Fee, Silviculture Burning Permits, and O/tax (litter, motor vehicle,
hazardous substance, etc.).
County B&O Taxes
Retail Sales
Taxes PUT
Other Fees/
Assessments*
Fire
Protection
Total Est.
Taxes
Adams $28,714 $30,904 $586 $628 $4,478 $65,310
Asotin $75,357 $81,106 $1,539 $1,649 $11,753 $171,403
Benton $452,075 $486,564 $9,231 $9,891 $70,505 $1,028,266
Chelan $409,880 $441,149 $8,369 $8,968 $63,924 $932,290
Clallam $1,742,038 $1,874,937 $35,569 $38,114 $271,686 $3,962,345
Clark $4,496,446 $4,839,477 $91,809 $98,379 $701,260 $10,227,370
Columbia $36,454 $39,236 $744 $798 $5,685 $82,917
Cowlitz $9,815,869 $10,564,716 $200,422 $214,764 $1,530,871 $22,326,641
Douglas $78,658 $84,658 $1,606 $1,721 $12,267 $178,910
Ferry $260,082 $279,924 $5,310 $5,690 $40,562 $591,568
Franklin $273,797 $294,685 $5,590 $5,990 $42,701 $622,764
Garfield $9,423 $10,142 $192 $206 $1,470 $21,432
Grant $265,581 $285,842 $5,423 $5,811 $41,420 $604,077
Grays Harbor $2,718,810 $2,926,226 $55,513 $59,485 $424,022 $6,184,057
Island $349,968 $376,666 $7,146 $7,657 $54,581 $796,017
Jefferson $428,354 $461,033 $8,746 $9,372 $66,806 $974,311
King $11,862,545 $12,767,531 $242,211 $259,543 $1,850,068 $26,981,897
Kitsap $402,662 $433,381 $8,222 $8,810 $62,799 $915,874
Kittitas $202,850 $218,326 $4,142 $4,438 $31,636 $461,392
Klickitat $670,446 $721,594 $13,689 $14,669 $104,562 $1,524,959
Lewis $3,453,348 $3,716,802 $70,511 $75,557 $538,580 $7,854,797
Lincoln $28,714 $30,904 $586 $628 $4,478 $65,310
Mason $1,647,190 $1,772,853 $33,633 $36,039 $256,894 $3,746,608
Okanogan $280,187 $301,562 $5,721 $6,130 $43,698 $637,298
Pacific $614,606 $661,494 $12,549 $13,447 $95,853 $1,397,950
Pend Oreille $443,030 $476,829 $9,046 $9,693 $69,094 $1,007,693
Pierce $7,293,626 $7,850,052 $148,922 $159,579 $1,137,505 $16,589,684
San Juan $72,026 $77,521 $1,471 $1,576 $11,233 $163,826
Skagit $1,490,768 $1,604,498 $30,439 $32,617 $232,498 $3,390,820
Skamania $502,471 $540,805 $10,260 $10,994 $78,365 $1,142,894
Snohomish $3,519,872 $3,788,401 $71,869 $77,012 $548,955 $8,006,109
Spokane $2,242,751 $2,413,849 $45,793 $49,070 $349,777 $5,101,240
Stevens $966,529 $1,040,265 $19,735 $21,147 $150,739 $2,198,413
Thurston $1,814,228 $1,952,634 $37,043 $39,694 $282,945 $4,126,543
Wahkiakum $218,953 $235,656 $4,471 $4,791 $34,148 $498,018
Walla Walla $1,375,173 $1,480,085 $28,078 $30,088 $214,470 $3,127,894
Whatcom $1,913,447 $2,059,422 $39,069 $41,865 $298,419 $4,352,222
Whitman $62,588 $67,363 $1,278 $1,369 $9,761 $142,360
Yakima $1,814,208 $1,952,613 $37,043 $39,693 $282,942 $4,126,498
Total $64,333,723 $69,241,704 $1,313,574 $1,407,572 $10,033,408 $146,329,981

©2015 Forest2Market.
Page 11
Forest2Market®
The total of both actual and estimated taxes paid by industry participants totaled nearly $201 million in 2013.
County
Total Actual
Taxes
Total Est.
Taxes
Total Actual &
Est. Taxes
Adams $0 $65,310 $65,310
Asotin $916 $171,403 $172,319
Benton $0 $1,028,266 $1,028,266
Chelan $246,501 $932,290 $1,178,791
Clallam $3,356,541 $3,962,345 $7,318,886
Clark $1,556,292 $10,227,370 $11,783,662
Columbia $10,584 $82,917 $93,501
Cowlitz $5,297,501 $22,326,641 $27,624,142
Douglas $285 $178,910 $179,195
Ferry $350,808 $591,568 $942,376
Franklin $0 $622,764 $622,764
Garfield $5,092 $21,432 $26,524
Grant $0 $604,077 $604,077
Grays Harbor $6,005,121 $6,184,057 $12,189,178
Island $118,285 $796,017 $914,302
Jefferson $1,845,477 $974,311 $2,819,788
King $2,072,115 $26,981,897 $29,054,012
Kitsap $719,897 $915,874 $1,635,771
Kittitas $141,162 $461,392 $602,555
Klickitat $1,608,515 $1,524,959 $3,133,474
Lewis $7,757,062 $7,854,797 $15,611,859
Lincoln $20,948 $65,310 $86,259
Mason $2,350,693 $3,746,608 $6,097,300
Okanogan $286,461 $637,298 $923,759
Pacific $5,259,784 $1,397,950 $6,657,734
Pend Oreille $720,232 $1,007,693 $1,727,925
Pierce $2,576,057 $16,589,684 $19,165,741
San Juan $16,926 $163,826 $180,752
Skagit $2,026,119 $3,390,820 $5,416,939
Skamania $1,505,347 $1,142,894 $2,648,241
Snohomish $2,483,258 $8,006,109 $10,489,367
Spokane $334,385 $5,101,240 $5,435,624
Stevens $1,369,171 $2,198,413 $3,567,584
Thurston $1,706,437 $4,126,543 $5,832,981
Wahkiakum $1,349,211 $498,018 $1,847,229
Walla Walla $3,436 $3,127,894 $3,131,330
Whatcom $1,236,854 $4,352,222 $5,589,075
Whitman $0 $142,360 $142,360
Yakima $162,370 $4,126,498 $4,288,869
Total $54,499,842 $146,329,981 $200,829,823
©2015 Forest2Market.
Page 12
Forest2Market®
Prepared for:
Washington Forest Protection Association
Cindy Mitchell
Sr. Director of Public Affairs
724 Columbia St NW, Suite 250
Olympia, WA 98501
Provided by:
Forest2Market, Inc.
15720 Brixham Hill Avenue, Suite 550
Charlotte, NC 28277