the contribution of human activities to subsurface...
TRANSCRIPT

S C I E N C E O F T H E T O T A L E N V I R O N M E N T 4 0 7 ( 2 0 0 9 ) 3 1 2 9 – 3 1 4 1
ava i l ab l e a t www.sc i enced i rec t . com
www.e l sev i e r. com/ loca te / sc i to tenv
The contribution of human activities to subsurfaceenvironment degradation in Greater Jakarta Area, Indonesia
Robert M. Delinoma,⁎, Abdurrahman Assegafb, Hasanuddin Z. Abidinc, Makoto Taniguchid,Dadan Suhermana, Rachmat Fajar Lubise, Eko Yuliantoa
aResearch Centre for Geotechnology, Indonesian Institute of Sciences, Jln. Cisitu - Sangkuriang, Bandung 40135, IndonesiabGeological Department, Trisakti University, Jln. Kyai Tapa No. 1, Jakarta 11440, IndonesiacGeodesy Research Division, Faculty of Civil and Environmental Engineering, Institute of Technology Bandung, Jln. Ganesha 10,Bandung 40132, IndonesiadResearch Institute for Humanity and Nature, 457-4 Motoyama, Kamigamo, Kitaku, Kyoto 603-8047, JapaneGraduate School of Chiba University, 1-33 Yayoi-cho, Inage-ku, Chiba 263-8522, Japan
A R T I C L E D A T A
⁎ Corresponding author. Tel.: +62 22 250 3654E-mail addresses: [email protected]
0048-9697/$ – see front matter © 2008 Elsevidoi:10.1016/j.scitotenv.2008.10.003
A B S T R A C T
Available online 13 December 2008
This study examines the factors of human activities causing environmental stresses on thesubsurface environments in the urban settings of Jakarta. A major objective of this study isto identify the basin geometry and estimate how critical is the degradation of the subsurfaceenvironment within the basin, and it covered micro-palaeontology and chemical analyses,the decrease of water level, and GPS data. New data on shallow groundwater quality isprovided and the results indicate strong evidence for human activities have influenced thedegradation of the Jakarta subsurface environment.© 2008 Elsevier B.V. All rights reserved.
Keywords:JakartaMicro-palaeontologyWater qualityGroundwaterUrbanizationDense populationLand subsidence
1. Introduction
In 2001, the UNEP (United Nations Environment Program)produced its third UNEP Global Environment Outlook, Geo 3(UNEP Website, 2002). It draws attention to the fact that theavailability and quality of fresh water is rapidly becoming oneof the most critical environmental and developmental issuesof the twenty first century. The use of groundwater resourcesis becoming more important as it is a very easy abstract.Despite its importance, groundwater is oftenmisused, usuallypoorly understood and rarely well-managed.
The main threats to groundwater sustainability arise fromthe steady increase in demand for water and from theincreasing use and disposal of chemicals to the land surface.Management is required to avoid serious degradation and thereneeds to be increased awareness of groundwater at the planningstage, to ensure equity for all stakeholders and most important
; fax: +62 22 250 4593.o.id, delinom2002@yahoo
er B.V. All rights reserved
of all tomatchwater quality to end use. Despite the threats frompotentially polluting activities, groundwater is often surpris-ingly resilient, and water quality over a large area of the worldremains good. A vital aid to good groundwatermanagement is awell-conceived and properly supported monitoring and surveil-lance system. For this reason monitoring systems should beperiodically reassessed to make sure that they remain capableof informing management decisions so as to afford earlywarning of degradation and provide sufficient time to devisean effective strategy for sustainable management.
Most global environmental studies have focused on theenvironmental issues above ground surface such as air andwater pollution, global warming, seawater pollution, anddecrease in biodiversity. Subsurface environmental issuesare also important for human life in the present and future,but they have been largely ignored because of the invisibilityof the phenomena and difficulty of the evaluations. Change in
.com (R.M. Delinom).
.

3130 S C I E N C E O F T H E T O T A L E N V I R O N M E N T 4 0 7 ( 2 0 0 9 ) 3 1 2 9 – 3 1 4 1
reliable water resources between groundwater and surfacewater are occurring in many Asian cities depending on thedevelopment stage of urbanization. Although surface water isrelatively easy to evaluate, changes in regional groundwaterstorage remain a difficult task. Subsurface environmentalproblems such as subsidence due to excessive pumping andgroundwater contamination have occurred repeatedly inAsian major cities (Foster and Chlton, 2003) with a time lagdepending on the character of urbanization.
Under the RIHN project on “Human Impacts of UrbanSubsurface Environment, this project will focus on the subsur-face environment of the entire Jakarta Basin. It is at this basinscale that subsurface water, heat, and material transport areinterconnected. Sub-theme 1 (Development stage of the Asiancity and subsurface environments) will focus on identifying thefactors in human activities causing the environmental stresseson the subsurface environments in the urban settings. It willidentify the different development stages and describe themajor causalities with respect to urbanization and changes insubsurface environment over a long-term perspective.
A major objective of this study is to identify the basingeometry and estimate how critical is the degradation of thesubsurface environment within the Jakarta Basin due tohuman activities. Groundwater over-abstraction has becomea common issue along the coastal area where good qualitygroundwater is available.
This study presents the results of the following activities:
1. micro-palaeontology analysis using 3 drilling cores forsetting down the basin geometry,
2. chemical analyses from 17 water samples from springslocated in the southern part of Jakarta, 51 water samplesfrom monitoring wells inside Jakarta groundwater basin,and 42 water samples from shallow groundwater aroundJakarta Area,
3. an analysis of the decrease of water level in 51 monitoringwells and 50 dug-drilled wells of 5 years period records,
4. and GPS data from 27 networks station.
This study examines the basin geometry and the impact ofgroundwater pumpage and soil layer compaction on thesubsurface environment.
2. Study area
2.1. General View
The Greater Jakarta is the capital of the Republic of Indonesiaand occupies the coastal plain area which borders the Java Seato the North (Fig. 1). The elevations of this plain vary from 0 to1000 m above sea level. It is one of the most developed basinsin Indonesia and is located between 106° 33′–107° E longitudeand 5° 48′ 30″–6° 10′ 30″ S latitude covering an area of about652 km2. It has a humid tropical climate with annual rainfallvarying between 1500 and 2500 mm and influenced by themonsoons. Land use in Greater Jakarta mostly compriseshousing, industry and commerce whilst some agriculture ispracticed in the urban fringe areas.
The population of Jakarta at present is around 8.3 millions(Jakarta Local Government Website, 2007). It represents theofficial number of population that actually lives in the GreaterJakarta Area. The population can be expected to increase in thenear future by both natural increase and net in immigration asmany people have been attracted to come to this city to pursuea better life.Manypeoplewhoareworking in Jakarta during thedaytime are living in the adjacent cities i.e., Bogor, Depok,Tanggerang, and Bekasi (BodetabekArea). Since the opening ofthe Jakarta–Bandung Highway, some people living in the citiesof Purwakarta and Bandung have also become commuters.This circumstance has caused the population of Jakarta toincrease up to 10 or 11 millions during the weekdays.According to the Statistical Local Office of Greater Jakarta(2003), the highest population density of Jakarta Area wasfound inCentral Jakarta (18,746 people/km2) andwere followedby West Jakarta (12,426 people/km2), South Jakarta (11,676people/km2), East of Jakarta (11,157 people/km2), North Jakarta(8,267 people/km2), and Seribu Island (1616 people/km2).
It is obvious that urbanization has increased the waterdemand in this area. As the drinking water which is suppliedby surface water covers only 30% of water demand, people areharvesting the available groundwater in the basin. In theJakarta Groundwater Basin, the use of groundwater has greatlyaccelerated conforming to the rise of its population and thedevelopment of the industrial sector, which consumes arelatively huge amount of water. According to the Ghyben–Herzberg model, the natural hydrostatic equilibrium betweensalt and fresh water can change when a change occurs in thefresh groundwater head pressure. It can occur due to ground-water over-pumping as it is taking place at the present time inJakarta. Over-pumping can also decrease the volume ofgroundwater and produce subsidence of the land surface.The subsurface layer compaction has led to land subsidence.Geyh and Soefner (1996) reported on the salt water intrusionphenomena in the Jakarta Area. Djaja et al. (2004) recognizedland subsidence phenomenon occurring in some parts of theJakarta Metropolitan Area.
2.2. Geological Setting
According to Engelen and Kloosterman (1996), structurally, theJakarta Basin is part of the so called a Northern Zonecomprising the low hilly areas of folded Tertiary strata, andcoastal lowlands bordering the Java Sea. Regionally, JakartaArea is occupied by lowland area that has fivemain landforms(Rimbaman and Suparan, 1999) that consists of:
1. volcanic and alluvial landforms, that are found in southernpart of the basin,
2. marine origin landforms, which are occupied the northernarea adjacent to the coastline,
3. beach ridge landforms, which are discovered along thecoast with east–west direction,
4. swamp and mangrove area landforms, which are encoun-tered in the coastal fringe,
5. paleo-channels, which run perpendicular to the coastline.
Geologically, the study area is dominated by quaternarysediment and, unconformably, the base of the basin is formed

Fig. 1 –Location of study area and sampling sites. The Greater Jakarta is located in theIsland of Java. The clove symbol ismarkedformicropaleontology sampling site, star symbol for springs hydrochemistry sample site, circle symbol formonitoringwell sitewhere the hydrochemistry samples were collected and groundwater level were monitored, and square symbol is marked forGPS measurement sites.
3131S C I E N C E O F T H E T O T A L E N V I R O N M E N T 4 0 7 ( 2 0 0 9 ) 3 1 2 9 – 3 1 4 1
by impermeableMiocene limestone sediments cropping out atthe southern area, which were known as Bojongmanik andKlapanunggal Formation. The basin fill, which consist ofmarine Pliocene and quaternary sand and delta sediments, isup to 300m thick. Individual sand horizons are typically 1–5mthick and comprise only 20% of the total fill deposits. Silts andclays separate these horizons. Fine sand and silt are veryfrequent components of these aquifers (Martodjodjo, 1984;Asseggaf, 1998), and the sand layers were connected to eachother (Fachri et al., 2003). This conclusion was based onstratigraphic cross correlation of South–North direction fromcore and cutting evaluation of 20 boreholes around JakartaBasin. The geologicalmap of this area is presented on Figure 2.
3. Sampling and methods
3.1. Micro-paleontology
The knowledge of basin geometry is important as it will giveinformation about the environment of the area we deal with.Many approaches can be used to analysis the geometry. In thispaper, micropaleontology analysis, pollen and spores con-tents, was used as a tool to get the information. Samples formicro-palaeontology analysis were taken from five coresnamely Cengkareng, Babakan, Blok-M, Tongkol and Meruyacores (Fig. 1). Four samples collected from Blok-M core at

Fig. 2 –The Geological Map of Greater Jakarta and its Surrounding Area. The study area is dominated by quaternary sedimentwhich was dominated by coastal and deltaic deposits. The impermeable Miocene formation is acted as the base of the basin.(Effendi, 1974; Sudjatmiko, 1972; Turkandi et al., 1992).
3132 S C I E N C E O F T H E T O T A L E N V I R O N M E N T 4 0 7 ( 2 0 0 9 ) 3 1 2 9 – 3 1 4 1
162.5–162.55 m, 153.45–153.5 m, 152.3–152.35 m and 36.6–36.65 m depths; seven samples from Tongkol core at 116.2–116.25m, 124.4–124.45m, 143.5–143.52m, 159.8–159.82m, 174–174.02 m, 188.6–188.62 m and 234.6–234.65 m; six samplesfrom Meruya core at 48–48.02 m, 68–68.02 m, 117–117.45 m,134–134.35m, 136.3–136.35m and 147.8–147.85m. Those levelswere defined because the stratigraphic profile of the cores thePlio-Pleistocene boundary was predicted to stand within therange of those levels.
Samples were then treated with 10% KOH, swirlingtechnique to remove sand, mix of HCl and HNO3, treatedwith 40%HF. Heavyminerals were removed by using ZnCl2 e.g.2.2 prior to acetolysis treatment. All pollen and spore grainswere counted. Ages of samples are deducted based on thefossil index. Frequencies for all pollen and spore types werecalculated on the total counts of pollen grain and presented inpollen diagrams.
Foraminifera data were obtained from the report of DinasPertambangan DKI Jakarta (LPM-ITB, 1997) and LGPN-LIPIteam (Hehanussa and Djoehanah, 1983). These two reportsprovide un-analyzed planktonic foraminifera data. These datawill be reviewed to determine sample ages and Plio-Pleisto-cene boundaries.
3.2. Hydrochemistry
Serious problems of salt water intrusion have affected somecoastal cities in Indonesia, including Jakarta, Medan, Surabaya,andSemarang. The sizeandextent of the intrusion isverymuchdependent on the manner of groundwater usage. An initialmodel was developed by Ghyben in 1888 and by Herzberg (1901)(the Ghyben–Herzberg model) which describes the hydrostaticbalance between fresh and saline water (cited from Carlston,1963). Beside that, the nitrate content in groundwater can be anevident of human activities to groundwater condition as nitrateconcentration at a certain area is always connected with theinput of domestic waste which is influenced by the density ofseptic tank (Hammer and MacKichan, 1981). Domestic wasteproducedammonia (NH3), and then it is changed to benitrate bybacteria via nitrification reaction as below:
2NH3 + 3O2NItrosomonas=Nitrosococcus
nitrite bacteriaY2HNO2 + 2H2O + 158 kilo calorie
Ammonia nitrit acidð Þ
2 HNO2 +O2 Nitrobacter¯
Y2HNO3 + 36 kilo calorie¯nitrate acidð Þ
Nitrate acid, then, formed nitrate ion by ionization process.

3133S C I E N C E O F T H E T O T A L E N V I R O N M E N T 4 0 7 ( 2 0 0 9 ) 3 1 2 9 – 3 1 4 1
The nitrate concentration level is also influenced by thestage of city development and the older is the higher nitratecontent (Appleyard, 1995). In groundwater, nitrate contami-nant will always be found at groundwater level zone.
In order to obtain an overview of the groundwatercondition in the Jakarta Basin, 17 springs located in the hillyarea south of Jakarta, 47 shallow drilled wells, and 32monitoring wells distributed throughout Jakarta were col-lected (Fig. 1). Water laboratory analysis used the followingtechniques: ion chromatography (Shimadzu) for NO3–N, SiO2,Cl− and SO4 2−; inductively couple plasma (ICPS-1000 III C,Shimadzu) for Na+, K+, Mg2+, Ca2+; titration (pH 4.8 alkalinity)for HCO3
−; while electrical conductivity (EC), pH, water tem-perature, and groundwater depth were measure in-situ.
3.3. Groundwater level
Groundwater level monitoring, either of shallow or deepgroundwater, was conducted between 2001 and 2005. Thereare 50 wells for monitoring the shallow ground water levelwhich were located on the area of 50 elementary schools and51 wells for monitoring deep groundwater level which wererandomly distributed within the Jakarta Basin area (Fig. 1).Among the 51 monitoring wells for deep groundwater level,only 30 wells were equipped with automatic water levelrecorders (AWLR). There is no AWLR available for shallowgroundwater monitoring wells.
Generally, the shallow groundwater monitoring wells wereconstructed using 4 inch diameter pipes reaching 12 to20 meter depth. No data of screen positions were availableand the wells are open-ended. The water level measurementswere carried out once a month during the 2002 to 2005 period.Those wells were located on the Bogor Alluvial Fan with anunconfined aquifer. The deep monitoring wells were con-structed using 5 in. diameter pipes reaching 200 m deep andthe screens were located on the target aquifers depth. Thewells were drilled exclusively to monitor groundwater leveland land subsidence caused by groundwater withdrawal.
3.4. Global Positioning System (GPS) Measurement
Considering the detrimental impact of land subsidence onbuilding and other infrastructures, a number of researcherscarried out investigations on the cause and the rate ofsubsidence. Most of the land subsidence investigations havebeen conducted over part of the Jakarta territory. The trendand rate of subsidence are a function of the condition of thepoint where the equipments are located.
In view of the higher cost saving and speed of simultaneousdata collection of GPS surveys compared to levelling, theDepartment of Geodetic Engineering, Institute of TechnologyBandung (ITB) decided to establish a new GPS network formonitoring land subsidence in the Jakarta basin, with somestations occupying points of the existing BPN network. Theconfiguration of this GPS monitoring network is shown inFigure 1. Station BAKO is the southern most point in thenetwork and is also the Indonesian zero order geodetic point.It is used as the reference point. BAKO is an IGS (InternationalGlobal Navigation Satellite Systems (GNSS) Service) station,operated by the National Coordinating Agency for Survey and
Mapping (BAKOSURTANAL). The use of GPS satellite-basedpositioning system to systematically establish geodetic con-trol points over the Jakarta Area was firstly conducted in 1994by the National Land Agency (BPN). This GPS network is aimedat supporting cadastral mapping and its design was notintended to monitor land subsidence.
Seven GPS surveys have been conducted during December1997, June 1999, June 2000, June 2001, October 2001, July 2002,and December 2002 to September 2005 (Fig. 5). These surveysdid not always occupy the same stations. The first surveystarted with 13 stations. The network then expanded to 27stations. At certain times, some stations could not beobserved due to the destruction of monuments, or severesignal obstruction caused by growing trees and/or newconstruction.
The GPS surveys exclusively used dual-frequency geodetic-type GPS receivers. The length of the sessions was in generalbetween 9 and 11 h. The data were collected with a 30 sinterval using an elevation mask of 15°. The data wereprocessed using the software Bernese 4.2 (Beutler et al.,2001). Since the present study was mostly interested inrelative heights with respect to a stable point, the radialprocessing mode was used instead of network adjustmentmode. In this case the relative ellipsoidal heights of all stationswere determined relative to the BAKO station.
Considering the length of the baselines of 40 to 50 km, aprecise ephemeris was used instead of the broadcast ephe-meris. The effects of tropospheric and ionospheric biases weremainly reduced by the differencing process and the use ofdual-frequency observations. The residual tropospheric biasparameters for individual stations are estimated to furtherreduce the tropospheric effects. In the case of the residualionospheric delay reduction, a local ionospheric modellingwas implemented. The algorithms for the tropospheric para-meter estimation and local ionospheric modelling can befound in Beutler et al. (2001). In processing baselines, most ofcycle ambiguities of the phase observations were successfullyresolved.
4. Result and Discussion
4.1. Micro-palaeontology
In general pollen and spores contents in the samples do notrefer to a definite level of the Plio-Pleistocene boundary. ThePlio-Pleistocene boundary is characterized by last appearanceof Stenochlaniidites papuanus and first appearance of Dacrycar-pus/Podocarpus imbricatus (Rahardjo et al., 1994). Accordingly,the presences of S. papuanus and Dacrycarpus/P. imbricatus insample 68 m of the Meruya core indicate that the Plio-Pleistocene boundary is at 68 m depth.
The presence of S. papuanus only in sample 162.5–162.55 mof the Block-M core and high value of Gramineae in sample162.5–162.55 m and 153.45–153.5 m indicate that the Plio-Pleistocene boundary lies on ca. 162 m depth in this core. Theabsence of S. papuanus from samples 153.45–153.5 m, 152.3–152.35 m and 36.6–36.65 m indicate that it might havedisappeared after sample 162.5–162.55m deposited. Moreover,last appearance of S. papuanus associated with Gramineae

3134 S C I E N C E O F T H E T O T A L E N V I R O N M E N T 4 0 7 ( 2 0 0 9 ) 3 1 2 9 – 3 1 4 1
abundance is a characteristic of the Plio-Pleistocene Boundaryin Java. Therefore, the Plio-Pleistocene boundary may fallwithin 153–163 m level. Single specimen of S. papuanusindicates that it may be a reworked-fossil. If it is a reworked-fossil, the Plio-Pleistocene boundary would stand at a leveldeeper than 162 m in this core.
Abundant mangrove pollen in samples of 162.5–162.55 m,153.45–153.5 m, and 152.3–152.35 m indicates a mangrovedepositional environment. Accordingly, sea level was at about150–160 m lower than present level when the samples weredeposited. This confirms the position of Plio-Pleistoceneboundary at about 150–160 m in the Blok-M core because globalsea level was in its lowest position during the Plio-Pleistocene.
The occurrence of Gs. obliquus in TKL 227–228 m, SituBabakan 79.7 m, Cengkareng 105–106 m and Cengkareng 108–109 m indicate that the ages of these samples are not youngerthan Early Pliocene in respect to Bolli et al. (1985). Thepresences of Gs. obliquus and Gs. ruber in sample 105–106 mof the Cengkareng core indicate that this sample wasdeposited in the Early Pliocene. Accordingly, the Plio-Pleisto-cene boundary is at a depth shallower than 105 m in theCengkareng core. Gs. obliquus and G. cf. venezuelana which are
Fig. 3 –The geometry of Greater Jakarta Basin which was delineashowed that the Quaternary sediment is thin. The Tertiary sedimcropped out in some places.
present in sample 79.7 m of the Situ Babakan core indicateMiddle Pliocene age. By this reason, Plio-Pleistocene boundaryis at a depth shallower than 79.7 m in the Situ Babakan core.Based on the presence of Gs. obliquus in sample 227 m, it isevident that the Plio-Pleistocene boundary is at a depthshallower than 227 m in Tongkol core.
Pollen and foraminifera data show us that the Plio-Pleisto-ceneboundary in Jakarta isnot placedona similar level. It variesin depth from place to place rather than simply sloping in aparticular direction. Structure configuration in which Jakartaand its surrounding areas have been evident to be in low andhigh structures shows that the basement configuration mighthave controlled in some parts to this undulation.
Considering the position of the cores, a north–south sectionputs the cores respectively as follows: Cengkareng core, Tongkolcore, Meruya core, Blok M core, and Babakan core. Reconstruc-tion of the Plio-Pleistocene boundary along this section allowsrecognizing two low and two high structures. The Babakan andMeruya cores stand on low structureswhile BlokMandpossiblyTongkol and Cengkareng cores stand on high structures (Fig. 3).The Plio-Pleistocene boundary is at a level shallower than 300mdepth in all cores. This contradicts the argument that the
ted by Micropaleontology Analysis. This reconstructionent in the southern part of the basin is very shallow and
3135S C I E N C E O F T H E T O T A L E N V I R O N M E N T 4 0 7 ( 2 0 0 9 ) 3 1 2 9 – 3 1 4 1
boundary in general lies at depthsmore than 250 m and locallymore than 300m as argued by Soekardi and Koesmono (1973). Italso rejects the previous argument that the Plio-Pleistoceneboundary in Jakarta sloping and deepening to the north(Soekardi and Purbohadiwidjojo, 1979).
Although the basement configuration may be the mainfactor in the boundary undulation, quaternary tectonic alsoseems to contribute some influences. The presence of woodfossil dated 38,000 yr BP in the river terrace sediment about25 m above the modern river surface at Depok and somemarine terraces (LPM-ITB, 1997) indicate quaternary tectonicuplift. Some seismicity in the last decades might have alsoinfluenced the boundary by fault reactivation. In contrast,compaction and sediment consolidation due to over pumpingof ground water and loading by surface construction mighthave been the other considerable factor.
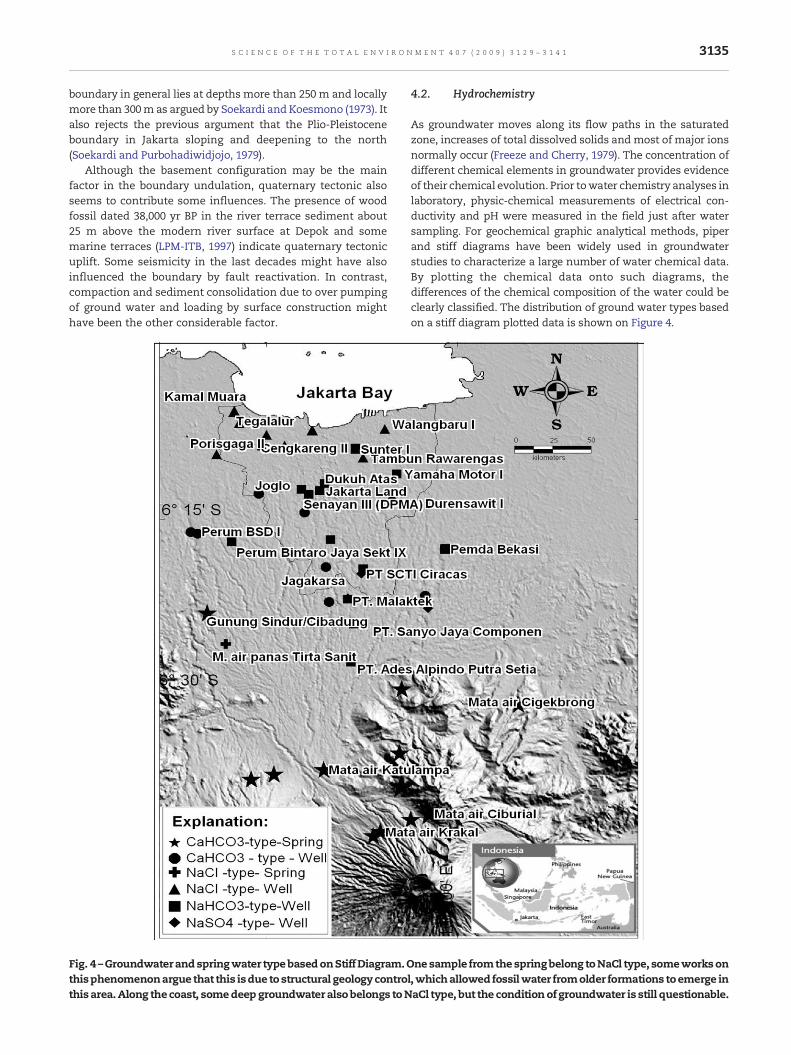
Fig. 4 –Groundwaterandspringwater typebasedonStiffDiagram.Othisphenomenonargue that this isdue to structural geology controthis area.Along the coast, somedeepgroundwater alsobelongs toN
4.2. Hydrochemistry
As groundwater moves along its flow paths in the saturatedzone, increases of total dissolved solids and most of major ionsnormally occur (Freeze and Cherry, 1979). The concentration ofdifferent chemical elements in groundwater provides evidenceof their chemical evolution. Prior towater chemistry analyses inlaboratory, physic-chemical measurements of electrical con-ductivity and pH were measured in the field just after watersampling. For geochemical graphic analytical methods, piperand stiff diagrams have been widely used in groundwaterstudies to characterize a large number of water chemical data.By plotting the chemical data onto such diagrams, thedifferences of the chemical composition of the water could beclearly classified. The distribution of ground water types basedon a stiff diagram plotted data is shown on Figure 4.
nesample fromthespringbelong toNaCl type, someworksonl,whichallowed fossilwater fromolder formations toemerge inaCl type, but the conditionof groundwater is still questionable.

3136 S C I E N C E O F T H E T O T A L E N V I R O N M E N T 4 0 7 ( 2 0 0 9 ) 3 1 2 9 – 3 1 4 1
The sample from theCiseenghot spring belongs to theNaClwater type. Based on geological condition, this phenomenon isdue to structural geology control which allowed fossil water(brine) from older formations to emerge in this area. Along thecoast, west to east, all groundwater samples belong to theNaCl-typewater as the content of sodium chloride is high. But,it can not be assumed as a result of sea water intrusion as allmonitoring wells are deep. Therefore, high sodium chloridecontent can be an influence of brine from old formation. Itneeds further analysis, such as C14 isotope study, to confirm it.
Major pollutants in groundwater associated with humanactivities are the nutrients, nitrate-N (NO3
−–N), nitrite (NO2−),
and phosphate (PO43−). Nitrate and nitrite are mainly related
with domestic waste, while phosphate is linked with agricul-tural activity (Hammer and MacKichan, 1981). Before collect-ing water samples, based on the geological condition, it isassumed that only the shallow groundwater (0–40 m depth)has been polluted by human activities waste (Fig. 5). There-fore, only the samples from these unconfined aquifers wereanalyzed for nitrate-N, nitrite-N, and phosphate contents.Nitrate-N may enter the shallow groundwater from naturalleaching of nitrates, nitrogenous fertilizer runoff, humanorganic waste, and industrial waste.
In the dense population areas of Jakarta, i.e., Central andWest Jakarta, the nitrate-N content are high (Table 1), evenexcess nitrate-Nmaximumcontaminant level (MCL)which are
Fig. 5 –Shallow Groundwater Sampling Site. 42 sam
allowed by the Indonesian Government, this limit value issimilarwith the limit of someother countries such asAustraliai.e., 10 mg/l, and no nitrite contents are in excess of MCL.Infants below the age of six months who drink water contain-ing nitrate-N in excess of 10 mg/l could become seriously ill(methaemoglobinaemia). Concentration of up to 23 mg/l maybe acceptable if not used for infant (Hart, 1974). Nitrite contentis still very low as it is rapidly oxidized to nitrates. Phosphatewas found in the area where agricultural activities still exist,i.e., South, East, and West Jakarta. Phosphate may enter thesurface and groundwater from decomposition of organicmatters in industrial waste and fertilizer. The content ofphosphate is rarely remaining in thewaters as they are used byplants as nutrient sources. The fertilizer that is used in thisarea is mostly phosphate type fertilizer.
4.3. Groundwater Level
Based on the water level measurement data of the 2002–2005periods, it was shown that in general the shallow groundwaterlevel has a negative trend, it was decreasing. This is shown onFigure 6.
The deep groundwater monitoring wells have been con-structed within the period of 1994 to 2000. Total of themonitoring well is 51 wells and only 30 wells were equippedwith automatic water level recording (AWLR) of which 1 (one)
pling sites were visited during the field work.

Table 1 – Major element nitrate-N, nitrite-N, and Phosphate content in shallow groundwater (unconfined aquifer) samples inGreater Jakarta Area.
Sample site pH Ca2+
(mg/l)Mg2+
(mg/l)K+
(mg/l)Na+
(mg/l)HCO3
−
(mg/l)Cl
(mg/l)SO4
2
(mg/l)N–NO3
−
(mg/l)N–NO2
−
(mg/l)PO4
3−
(mg/l)
South JakartaSJ 1 6.96 1.20 0.39 0.08 1.83 2.03 0.85 0.32 1.34 0.54 1.1SJ 2 5.50 0.33 0.77 0.03 0.09 0.25 0.81 0.18 1.14 0.00 0.5SJ 3 6.47 1.34 0.79 0.03 0.70 1.27 0.94 0.25 5.68 0.00 0.6SJ 4 6.19 0.53 0.79 0.04 0.87 1.16 1.04 0.22 1,28 0.00 1.7SJ 5 7.61 4.36 1.59 0.21 2.26 6.86 1.37 0.75 0.94 0.15 1.7SJ 6 4.87 0.67 0.57 0.03 1.04 0.58 1.13 0.36 6.68 0.02 0.1SJ 7 6.96 1.07 1.06 0.05 0.48 1.54 0.52 0.50 0.20 0.04 0.2SJ 8 6.58 1.07 1.06 0.05 1.28 1.16 1.70 0.49 3.84 0.05 0.0SJ 9 6.96 2.55 0.53 0.03 0.97 1.58 1.42 0.63 9.72⁎ 0.02 0.0SJ 10 7.76 1.34 0.92 0.09 1.39 2.47 0.94 0.54 0.28 0.03 0.8
East JakartaEJ 1 7.70 1.20 0.79 0.12 1.35 2.800 0.47 0.13 0.08 0.02 1.0EJ 2 5.95 1.20 1.46 0.05 0.97 1.56 1.32 0.08 0.18 0.00 1.0EJ 3 5.75 0.94 1.59 0.05 2.53 0.87 3.07 0.47 15.16⁎ 0.08 1.1EJ 4 4.79 0.40 0.26 0.38 1.39 0.48 0.94 0.24 6.72 0.00 0.6EJ 5 5.60 0.53 0.98 0.26 0.87 0.49 1.23 0.38 6.26 0.01 0.4EJ 6 7.00 3.09 0.53 0.14 2.01 3.56 0.94 0.39 2.46 0.03 0.8
West JakartaWJ 1 7.13 4.16 1.33 0.08 2.61 5.08 0.62 1.27 9.72⁎ 0.30 1.1WJ 2 6.58 1.93 3.74 0.76 13.57 6.59 5.89 6.35 0.23 0.01 0.6WJ 3 5.94 0.42 0.74 0.13 3.39 1.36 1.97 1.29 0.09 0.01 0.6WJ 4 6.51 1.43 1.38 0.79 9.13 4.78 2.25 4.07 0.16 0.00 0.2WJ 5 7.20 4.46 6.39 0.92 36.15 13.53 24.43 8.41 1.43 0.54 0.1WJ 6 6.29 18.72 10.42 0.35 19.14 3.36 37.04 8.08 0.28 0.01 0.59WJ 7 6.58 1.12 1.12 0.56 9.35 2.91 4.97 4.48 19.23⁎ 0.01 0.6WJ 8 6.89 6.43 6.68 0.84 5.96 9.04 2.54 5.86 12.57⁎ 0.00 0.3WJ 9 7.22 3.81 6.97 0.68 22.61 14.23 14.36 3.82 1.02 0.14 1.5
Central JakartaCJ 1 7.37 2.28 1.46 0.08 1.74 3.59 0.32 1.27 2.08 0.06 1.1CJ 2 7.58 5.11 2.26 1.03 4.47 10.17 1.27 0.56 1.60 0.90 0.06CJ 3 7.19 1.36 1.16 0.18 3.36 3.36 0.52 1.77 14.00⁎ 0.00 0.60CJ 4 7.01 2.37 3.42 0.28 7.30 9.37 4.76 0.14 16.10⁎ 0.00 0.30CJ 5 6.86 5.15 2.59 0.64 5.46 6.85 4.42 1.64 12.03⁎ 0.00 0.2CJ 6 7.00 2.75 0.45 0.28 2.70 2.10 1.13 2.35 3.00 0.00 0.5CJ 7 7.63 1.08 3.15 0.89 29.58 11.64 19.11 2.59 1.89 0.00 0.0CJ 8 7.36 3.14 2.44 0.38 8.09 5.09 5.12 2.02 18.40⁎ 0.00 0.6
North JakartaNJ 1 7.40 2.25 3.45 0.40 16.44 12.47 7.15 1.42 1.27 0.24 0.3NJ 2 4.04 2.86 3.84 0.52 5.05 11.91 0.76 0.29 1.98 0.00 0.1NJ 3 6.91 4.72 2.85 1.23 21.53 14.38 11.37 2.28 1.43 0.07 0.1NJ 4 8.01 0.44 0.26 0.19 12.41 8.86 1.79 0.38 12.50⁎ 0.00 0.2NJ 5 7.05 4.31 2.21 0.52 4.02 7.69 1.92 0.28 11.45 8 0.00 0.2NJ 6 6.86 5.85 1.89 0.64 7.97 7.57 6.95 1.01 1.79 0.24 0.2NJ 7 6.83 5.67 5.98 0.64 6.96 10.59 4.15 2.78 2.35 0.00 0,4NJ 8 7.07 2.37 1.98 0.25 6.79 7.94 2.73 0.45 2.02 0.00 0.1NJ 9 6.94 2.43 3.32 0.56 8.27 8.32 4.70 1.58 2.81 0.00 0.1
Note: ⁎ marks are for high nitrate contents samples which were taken from dense populated area. All samples were taken from shallowgroundwater (unconfined aquifers).
3137S C I E N C E O F T H E T O T A L E N V I R O N M E N T 4 0 7 ( 2 0 0 9 ) 3 1 2 9 – 3 1 4 1
was defect and could not be used even manually. At the endof 2005, only 48 wells still existed and only 22 AWLR werestill working. Based on the range of screen depths, whichwas assumed to be identical with the aquifer position, those50 wells could be grouped into 5 clusters i.e. 0–40 m, 40–95 m,95–140 m, 140–190 m, and 190–250 m.
• Cluster 0–40 meter Aquifers. This cluster consists of 5monitoring wells with water level fluctuated between−2.18 and −32.68 m below sea level (b.s.l.). Most of those
wells are located on the Bogor Alluvial Fan. Based on waterlevel data of those wells, 1 well showed a positive trend(Bapedalda, Central of Jakarta), 1 well with a negative trend(Senayan, Central of Jakarta), and 3 wells just fluctuated asthe season changed i.e., Pasar Rebo and Cilandak (South ofJakarta), Tongkol (North of Jakarta).
• Cluster 40–95 meter Aquifers. This cluster comprises 7monitoring wells with water level ranging between −4.12and −25.80 m b.s.l. The seasonal fluctuating water levelcould only be observed at the Duren Sawit monitoring well

Fig. 6 –Groundwater Level Fluctuation of January 2002 to December 2005. This figure showed that groundwater in most Jakartais declining slightly, but it can be identified.
3138 S C I E N C E O F T H E T O T A L E N V I R O N M E N T 4 0 7 ( 2 0 0 9 ) 3 1 2 9 – 3 1 4 1
in the eastern part of Jakarta. The wells located on thesouthern part of Jakarta (Jagakarsa, PT SCTI, and NationalGobel) showed a positive trend, while all wells located in thecentral and northern part of Jakarta (Tongkol, Senayan, andYamaha Motor), showed a negative trend. Generally, thiscluster is relatively balanced between negative and positivetrends.
• Cluster 95–140 m Aquifers. This cluster consists of 10monitoring wells with water levels ranging between −1.34and −51.05m b.s.l. The water levels in the north-western partof Jakarta (Sunter, Kapukand Jelambar)mostly showseasonal
fluctuation. In the eastern part of Jakarta (Sinar Sostro), thewater level is relatively stable. A positive trend was observedin the northern part of Jakarta (Walangbaru and Tongkol)while a negative trend was observed in south and centralJakarta (Dharmawangsa, Joglo, Tegal Alur and Jakarta Land).
• Cluster 140–190 m Aquifers. Five monitoring wells belong tothis cluster. The water level ranged between −10.56 and−31.82 m b.s.l. In the eastern part (Tambun Rengas), thewater level tended to be positive, while the other four wellswhich are located in the central part (DPR/MPR and GedungJaya) and in the northern part (Kamal Muara and Sunter) of

Fig. 7 –Rates of Land Subsidence (cm/year) in Jakarta Area. The GPSmeasurements showed that some land subsidence hadoccurred in Jakarta Area. Themeasurementswere carried out during the period of December 1997 to September 2005. The darkestsymbol represented the highest subsidence rate. It showed that subsidence rate in a certain area was not the same year by year.
3139S C I E N C E O F T H E T O T A L E N V I R O N M E N T 4 0 7 ( 2 0 0 9 ) 3 1 2 9 – 3 1 4 1
Jakarta show a negative trend. Therefore, for this cluster,generally, the water levels are decreasing.
• Cluster 190–250 m Aquifers. Within this deepest aqui-fer, 6 monitoring wells were drilled. Only one well
(Walang Baru in northern part of Jakarta), showed apositive water level trend. The other 5 wells, Cakung(north-east), DPRD DKI (central), Pasar Minggu (south),Sunter (north-west), and Tongkol (north), showed a

Table 2 –Matrix of Subsurface Condition in the Jakarta Area.
West Region East Region Central Region North Region South Region
Water Quality −3 0 −5 −5 0Shallow GW −3 −1 −5 −5 00–40 Aquifer −3 −1 −3 −5 −340–95 Aquifer −3 −3 −3 −5 −395–140 Aquifer −5 −3 −3 −3 −3140–190 m Aquifer −3 −3 −3 −3 −3190–250 m Aquifer −3 −3 −3 −3 −3Land Subsidence −3 −3 −5 −5 0Total Score −26 −17 −30 −34 −12
The value of the matrix is ranged between 0 (zero) and −5 (minus five) and it depends on the condition of each substance that will scored. Zeromeans the substance still in a good condition while −5 means the worst condition.
3140 S C I E N C E O F T H E T O T A L E N V I R O N M E N T 4 0 7 ( 2 0 0 9 ) 3 1 2 9 – 3 1 4 1
negative trend. Generally, the water level of this aquiferis decreasing.
4.4. Global Positioning System (GPS)
The estimated subsidence rates during the period Dec. 1997 toSept. 2005 are 1 to 10 cm/yr and reach 15–20 cm/yr, as shownonFigure 7. The highest rates of land subsidence occur in north-western Jakarta. The central and north-eastern parts some-times also show quite high rates of subsidence. This figureshows more clearly the nature of spatial and temporalvariation of land subsidence rates in the basin. These verticaltemporal variations however, may still be contaminated byannual/semi-annual signal bias that plagues all GPS temporalmeasurements.
The measurement result suggests that the subsidencerates of stations over a certain observation period can slowdown, accelerate or be relatively steady in comparison withthe rates from the previous period. It indicates that thesubsidence in the Jakarta basin is not homogeneous. Thevariability is due to a number of causalmechanisms including:excessive groundwater extraction, building load, sedimentcompaction and tectonic activities. Our data set does not allowus to identify which of these causal mechanisms is mostimportant or determine their spatial relationship across thebasin. More detailed results on GPS-derived subsidence inJakarta basin can be found in Abidin et al. (2007).
From the observation period 1982–1991, the highest sub-sidence occurred at Cengkareng (North Jakarta) with a rate of8.5 cm/year. In the period 1997–1999, the highest subsidenceoccurred at Daan Mogot (North-west Jakarta) with a rate of31.9 cm/year. The rate increase shows that the land sub-sidence in Jakarta is continuing. Therefore, planners andengineers should take into account this condition for theirplanning and construction works.
5. Conclusion
In order to acquire a comprehensive view based on the abovedata, a matrix method (Table 2) has been utilized. The value ofthe matrix is ranged between zero and minus five and itdepends on the condition of each substance that will score.Zero means the substance is still in a good condition while −5means the worst condition. The results show that the worst
subsurface conditions were found in north, central and westparts of Jakarta.
In the northern part of Jakarta the population density islesser than in any other part of Jakarta Area, but the scores arethehighest andmany factorieswerebuilt in thenorthernareaofJakarta. This is unavoidable as the seaport and the airport arelocated in these areas, resulting in the highest ground wateryield (highest extraction rate) andmost extensive build-up area.In the central part of Jakarta, as a central activities area and thedensest area, there aremany government and offices andmanyskyscrapers have been built. The heavy buildings erected on asurface of loosematerial togetherwith groundwater harvesting,undoubtedly, it will trigger a compaction process which mightcause land-subsidence in the area.
Comparing with the density population of each area andTable 2, it is obvious that in the Jakarta Area, human activitieshave influenced the subsurface environment condition ofJakarta, and the relationship of a densely populated area andenvironment alteration is recognizable. So far, not manysubsurface environment studies have been carried out in thisarea. Hence, the chance for detecting new phenomena in thisbasin is quite plausible.
Acknowledgments
The authors wish to thank the managers of all textile factoriesand director of Drinking Water Supply of Bogor Regency forallowing them to carry out measurements at their monitoringwells and springs. Without their permission, this study couldnot be accomplished. Our thanks are also due to the Head of theJakarta Metropolitan Energy and Mining Department for allow-ing us to use their long period records of water levels in Jakarta.This research was financially supported by The ResearchInstitute for Humanity and Nature (RIHN) Project 2–4 “HumanImpact on Urban Subsurface Environment” and CompetitiveResearch Project of Indonesian Institute of Sciences (LIPI).
R E F E R E N C E S
Abidin HZ, Andreas H, Djaja R, Darmawa D, Gamal M. Landsubsidence characteristics of Jakarta between 1997 and 2005, asestimated using GPS surveys” GPS Solutions. Berlin /Heidelberg: Springer; 2007. doi:10.1007/s10291-007-0061-0.Website: http://dx.doi.org/10.1007/s10291-007-0061-0.

3141S C I E N C E O F T H E T O T A L E N V I R O N M E N T 4 0 7 ( 2 0 0 9 ) 3 1 2 9 – 3 1 4 1
Appleyard S. The impact of urban development on recharge andgroundwater quality in a coastal aquifer near Perth, westernAustralia. Hydrogeol J 1995;3(2):65–74.
Asseggaf, A., 1998, Hidrodinamika Airtanah Alamiah CekunganJakarta, MSc Thesis, Geological Engineering Dept., BandungInstitute of Technology, unpublished.
Beutler G, Bock H, Brockmann E, Dach R, Fridez P, Gurtner W, et al.Bernese GPS software version 4.2. In: Hugentobler U, Schaer S,Fridez P, editors. Astronomical Institute, University of Berne;2001. 515pp.
Biro Pusat Statistik Provinsi DKI Jakarta (Statistical Local Office ofGreater Jakarta). Jakarta Dalam Angka, Pemda Jakarta,Unpublished; 2003.
Bolli HM, Saunders JB, Perch-Nielson K, editors. PlanktonStratigraphy. Cambridge Univ. Press; 1985. p. 1-328.
Carlston CW. An early American statement of the BadonGhyben–Herzberg principle of static fresh-water–salt-waterbalance. Am J Sci 1963;261:88–91.
Djaja R, Rais J, Abidin HZ, Wedyanto K. Land subsidence of JakartaMetropolitan Area. Proceeding 3rd IG Regional Conference,Jakarta, Indonesia; 2004.
Effendi, A.C. Peta Geologi Lembar Bogor, Jawa, Skala 1 : 100.000,Direktorat Geologi, Bandung, Bandung, Indonesia; 1974.
Engelen GB, Kloosterman FH. Hydrological System Analysis,Method, and Application. Dordrecht, The Netherlands: KluwerAcademic Publisher; 1996. p. 140–4.
Fachri M, Djuhaeni, Hutasoit LM, Ramdhan AM. Stratigrafi danHidrostratigrafi Cekungan Airtanah Jakarta, Bull Geol Vol 34,No. 3. Indonesia: Institut Teknologi Bandung; 2003. p. 169–89.
Foster SSD, Chilton PJ. Groundwater: the process and globalsignificance of aquifer degradation. Philos Trans R Soc Lond, BBiol Sci 2003;358(1440):1957–72.
Freeze RA, Cherry JA. Groundwater, Prentice-Hall, EaglewoodCliffs, NJ 17632; 1979.
Geyh MA, Soefner B. Groundwater mining study by simplifiedsample collection in the Jakarta Basin aquifer, Indonesia,International Atomic Energy Agency. Proceedings Series; 1996.p. 174–6.
Hammer MJ, MacKichan KA. Hydrology and Quality of WaterResources. Singapore: John Wiley& Sons Inc.; 1981. 486 pp.
Hart BT. A Compilation of AustralianWater Quality Criteria,AustralianWater Resources Council, Technical Paper No.7.Canberra:AustralianGovernmentPublishingService; 1974. 348pp.
Hehanussa, P.E. and Djoehanah, S., 1983. Stratigrafi Sumur BorCengkareng, Jakarta Barat, LGPN-LIPI: Laporan Penelitian(unpublished).
Jakarta Local Government Website. Statistik Penduduk; 2007.http://www.jakarta.go.id/v22/home/index.php.
LPM-ITB, 1997, Studi Pertumbuhan Pantai Purba danPerkembangan Pembangunan (Pantura) DKI Jakarta, LaporanAkhir (unpublished).
Martodjodjo, S., 1984, Evolusi Cekungan Bogor, Jawa Barat, PhDDissertation, Bandung Institute of Technology, unpublished.
Rahardjo, A.T., Polhaupessy, A.A., Wiyono, S., Nugrahaningsih, L.and Lelono, E.B., 1994. Zonasi Polen Tersier Pulau Jawa. Pros.PIT IAGI XXIII.
Rimbaman, Suparan, P., 1999, Geomorphology in Coastal PlainJakartaBay Project, Coastal Environmental Geologyof the JakartaReclamation Project and Adjacent Areas, CCOP COASTPLANCase Study Report No. 2, Jakarta/Bangkok, pp 21–25.
Soekardi, Koesmono, M., 1973. Pengamatan Neotektonik danMorfogenesa di Daerah Daratan Jakarta (Neotectonic andMorphogenetic Observations in the Jakarta Area). Unp. Rept.,Geol. Survey of Indonesia, no.1799.
Soekardi R, Purbohadiwidjojo. Cekungan Artesis Jakarta (TheJakarta Artesian Basin). Geol Indones 1979;2(1):25–8.
Sudjatmiko. Peta Geologi Lembar Cianjur, Jawa. Bandung:Geological Research and Development Center; 1972.
Turkandi T, Sidarto, Agustyanto DA, dan Hadiwidjoyo MMP. PetaGeologi Lembar Jakarta dan Kepuluan Seribu, Jawa. Bandung:Geological Research and Development Center; 1992.
UNEP. Groundwater and its susceptibility to degradation: A globalassessment of the problem and options for management,UNEP Website; 2002.