the contrasting characteristics and destinations of gcse
TRANSCRIPT

The Contrasting Characteristics and Destinations of GCSE Lower Attainers in English Core City Regions
February 2019
Sanne Velthuis
Ruth Lupton
Stephanie Thomson
Lorna Unwin

Acknowledgements
We are grateful to the Nuffield Foundation for their funding and support.
The Nuffield Foundation is an endowed charitable trust that aims to improve social well-being in the widest sense. It funds research and innovation in education and social policy and also works to build capacity in education, science and social science research. The Nuffield Foundation has funded this project, but the views expressed are those of the authors and not necessarily those of the Foundation. More information is available at www.nuffieldfoundation.org.

1
Contents
Abbreviations ........................................................................................................................ 2
Introduction ........................................................................................................................... 3
1. The scale of lower attainment in core city regions ...................................................... 5
2. The characteristics of lower attainers ......................................................................... 7
3. Post-16 transitions .................................................................................................... 10
4. Progress in English and maths during 16-18 phase .................................................. 18
Conclusion .......................................................................................................................... 22
References ......................................................................................................................... 23
Appendix A: The ethnic composition of lower attainers in core city regions ................. 24
Appendix B: English as an Additional Language among lower attainers in core city regions ......................................................................................................................... 25
Appendix C: School sixth forms and sixth form colleges in core city regions ............... 26
2
Abbreviations
A level General Certificate of Education Advanced Level
DfE Department for Education
FE further education
FSM free school meals
GCSE General Certificate of Secondary Education
SEN special educational need

3
Introduction
Attainment in the national General Certificate of Secondary Education (GCSE) examinations (known as Key Stage 4) taken by 16 year olds in England is a key determinant of future progression in education and training and later outcomes. Achieving grade 4/C or above in both GCSE English and maths is critical since this provides access to many further academic and vocational courses, as well as apprenticeships. Young people who fail to meet this standard must continue to work towards grade 4 in English and maths1 between the ages of 16-18, when they are required to remain in some form of recognised education and training. This paper forms part of a research project2 examining the post-16 transitions and pathways of young people who do not meet this threshold, a group referred to here as ‘lower attainers’.3
In an earlier paper (Velthuis et al., 2018) we described the characteristics and destinations of lower attainers in England as a whole. We now focus on how these patterns vary spatially, at the city region level. As powers over aspects of education and skills begin to be devolved from central government to city regions in England, improving educational outcomes and aligning post-16 provision with local skill demand is of increasing importance to city-regional authorities. There is particular concern about those young people who do least well in the school system and whose pathways to further education and labour market success are least obvious. Yet there is little currently available analysis on lower attainers per se, and data is typically not aggregated to the city region level.
Using publicly available data for five cohorts of learners (the cohort completing Key Stage 4 in 2012/13 up to the cohort completing Key Stage 4 in 2016/17), we examine what proportion of young people in each city region did not achieve the C/4 benchmark, as well as how the characteristics of these ‘lower attainers’ differed between city regions. We also present data on what these young people went on to do after completing Key Stage 4, showing how the pathways of lower attainers appear to be shaped in part by local differences in the nature of 16-18 provision. The paper presents data for London and the English core city regions outside London (see Box 1). To exemplify within city region variation, we also focus in more detail on Greater Manchester and Newcastle City Region, since these areas are case study areas in the larger project of which this paper is a part.
The paper shows that there are important variations between city regions in terms of the level of GCSE ‘lower attainment’, the post-16 destinations of those without a C/4 in English and maths, and the progress made in these subjects during the 16-18 phase. It also reveals both the wide variety of post-16 provision at city region level and the different approaches taken by providers towards lower attainers. Hence, young people’s post-16 options are
1 This requirement applies to all 16-18 year olds who did not achieve this standard and who are on a programme of 150 hours or more, except if they already hold overseas qualifications equivalent to GCSE grade 9-4/A*-C in English and maths, or if they have an EHC plan and an institution assessment confirms they are not able to study GCSE or stepping stone qualifications. Those who obtained a grade 2 or below at GCSE are able to study approved ‘stepping stone’ qualifications (such as Functional Skills) instead of GCSE. 2 Full details of the project can be found at https://www.mui.manchester.ac.uk/igau/research/post-16-educational-transitions/. 3 We use the term ‘lower attainers’ as a shorthand to refer to this group of learners while recognising that definitions of what constitutes ‘good’ attainment and ‘low’ attainment are subject to change over time as policy targets and benchmarks shift. We also recognise that levels of attainment vary quite substantially within this group of young people, and that what may be ‘low’ attainment for some people may be good attainment for others. A wider discussion of the concept of lower attainment is the subject of a further paper by the project team, currently under development.
4
subject to where they live and affect the efforts of city regions as they strive to ensure successful transitions and improve progression. The paper provides strong evidence to support the case for locally-sensitive strategies which take into account the particular nature of the post-16 landscape in the city region (as well as differences between areas within each city region).
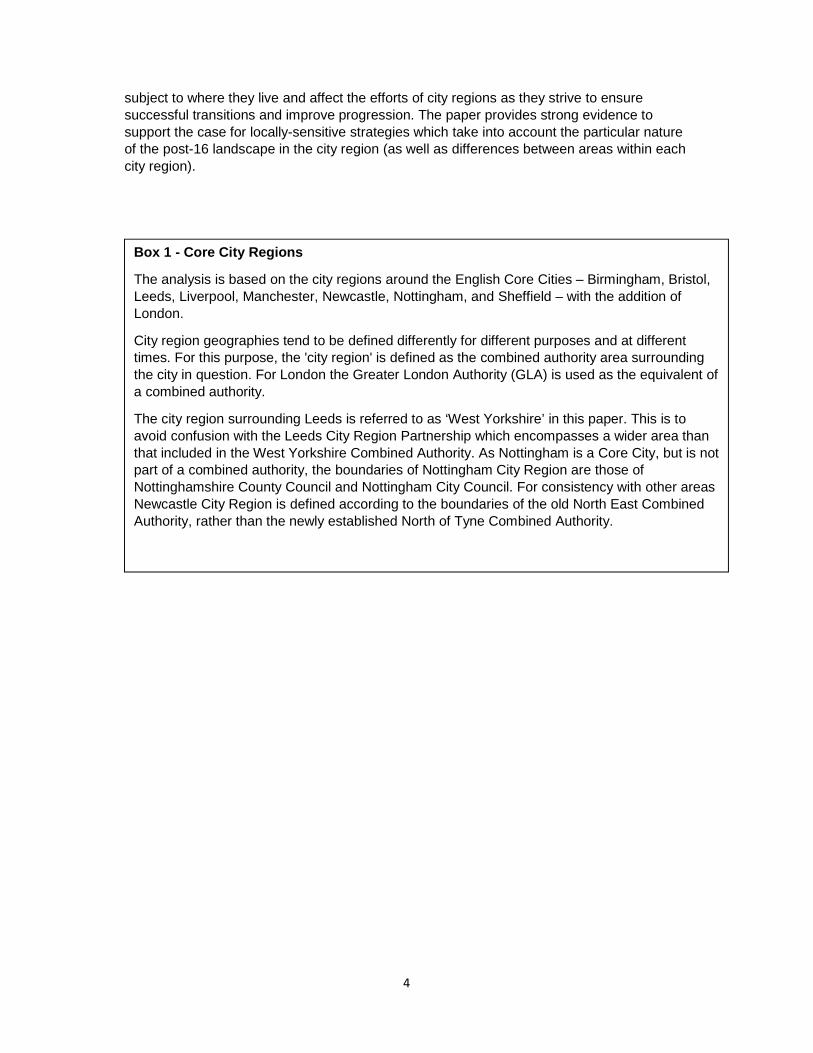
Box 1 - Core City Regions
The analysis is based on the city regions around the English Core Cities – Birmingham, Bristol, Leeds, Liverpool, Manchester, Newcastle, Nottingham, and Sheffield – with the addition of London.
City region geographies tend to be defined differently for different purposes and at different times. For this purpose, the 'city region' is defined as the combined authority area surrounding the city in question. For London the Greater London Authority (GLA) is used as the equivalent of a combined authority.
The city region surrounding Leeds is referred to as ‘West Yorkshire’ in this paper. This is to avoid confusion with the Leeds City Region Partnership which encompasses a wider area than that included in the West Yorkshire Combined Authority. As Nottingham is a Core City, but is not part of a combined authority, the boundaries of Nottingham City Region are those of Nottinghamshire County Council and Nottingham City Council. For consistency with other areas Newcastle City Region is defined according to the boundaries of the old North East Combined Authority, rather than the newly established North of Tyne Combined Authority.

5
1. The scale of lower attainment in core city regions
Over the period 2012/13 to 2016/174, the proportion of young people in England as a whole who did not achieve A*-C/9-4 in English and maths at the end of Key Stage 4 was 38.5 per cent (see figure 1). This means that nearly two-in-five 16 year olds fall under the definition of ‘lower attainer’. When we look at the proportion of lower attainers in core city regions, two things stand out. Firstly, almost all city regions had a higher proportion of lower attainers than the England average, with the exception of London where the proportion of young people missing the English and maths benchmark is substantially lower. Secondly, with the exception of London, there is not a great deal of difference between city regions in terms of the proportion of young people who are lower attainers.5
Figure 1: Percentage of pupils not attaining A*-C/9-4 in English and maths in core city regions, average over period 2012/13 to 2016/17
Sources: SFR05/2014: GCSE and equivalent attainment by pupil characteristics: 2013 - National and local authority tables; SFR06/2015: GCSE and equivalent attainment by pupil characteristics: 2014 - National and local authority tables; SFR03/2016: GCSE and equivalent results: 2015 to 2016 (revised) - Characteristics local authority tables; and SFR01/2018: GCSE and equivalent results: 2016 to 2017 (revised) - Characteristics local authority tables.
Differences in lower attainment within city regions
4 Throughout this paper we combine data from multiple cohorts (usually the five cohorts from 2012/13 to 2016/17). This is because, at the city region level and especially at the local authority level, attainment levels tend to fluctuate from year to year. By averaging over multiple cohorts we smooth out these fluctuations and obtain a better picture of persistent attainment differences between areas. 5 In figure 1, and in all subsequent figures in this section, data for city regions refer to young people who completed Key Stage 4 in educational institutions in each city region, rather than young people who live in each city region.
34.6
40.2 40.3 40.4 41.4 41.7 42.3 42.3 42.5
38.5
0
5
10
15
20
25
30
35
40
45

6
While overall levels of English and maths attainment do not differ very strongly between city regions, within city regions there tend to be substantial spatial variations in attainment. To illustrate this point, figure 2 focuses on Greater Manchester and Newcastle City Region as examples. As figure 1 shows, these had the same aggregate proportion of lower attainers (just over 40 per cent). But, as shown in figure 2, there are stark differences between individual local authorities in the proportion of pupils not meeting the A*-C/9-4 English and maths measure, especially in Greater Manchester. Although in Trafford only 26.2 per cent of pupils did not achieve this benchmark over the five-year period from 2012/13 to 2016/17, in Manchester this increased to 46.8 per cent and in Salford to 47.4 per cent. The particularly low proportion of lower attainers in Trafford is likely to be due in part to the high number of academically selective schools in the authority.6 Differences in attainment between local authorities in the Newcastle were not quite as large. Nonetheless, lower attainers made up a substantially larger proportion of Key Stage 4 pupils in Sunderland (43.6 per cent) than in North Tyneside (36.1 per cent).
Figure 2: Percentage of pupils who did not achieve A*-C or 9-4 in English and maths in local authorities Greater Manchester and Newcastle city region, average over period
Sources: SFR05/2014: GCSE and equivalent attainment by pupil characteristics: 2013 - National and local authority tables; SFR06/2015: GCSE and equivalent attainment by pupil characteristics: 2014 - National and local authority tables; SFR03/2016: GCSE and equivalent results: 2015 to 2016 (revised) - Characteristics local authority tables; and SFR01/2018: GCSE and equivalent results: 2016 to 2017 (revised) - Characteristics local authority tables.
These two examples show that, within city regions, there can be substantial variation in the share of young people with lower attainment – especially if there are academically selective schools in one part of a city region and not others. Given this spatial variation in outcomes,
6 Note that attainment figures refer to young people who completed Key Stage 4 in schools located in Trafford, rather than young people who live in Trafford. Although a substantial number of pupils attending schools in Trafford are likely to come from the local authority itself, schools in Trafford may also attract a number of young people from neighbouring local authorities.
26
36 38 39 40 4044 44
47 47
4036 38 40 41 41 42 44
40
05
101520253035404550
Tra
fford
Sto
ckpo
rt
Wig
an
Bur
y
Tam
esid
e
Bol
ton
Old
ham
Roc
hdal
e
Man
ches
ter
Sal
ford
Gre
ater
Man
ches
ter
aver
age
Nor
th T
ynes
ide
Gat
eshe
ad
Cou
nty
Dur
ham
Sou
th T
ynes
ide
New
cast
le u
pon
Tyn
e
Nor
thum
berla
nd
Sun
derla
nd
New
cast
le c
ity r
egio
nav
erag
e
Greater Manchester Newcastle city region

7
it is worth exploring whether the characteristics of lower attainers are different in some areas than in others. In the next section, we explore how the characteristics of lower attainers vary by area.
2. The characteristics of lower attainers
We start by looking at what proportion of lower attainers are eligible for Free School Meals (FSM). As shown in figure 3, the rate of FSM-eligibility among lower attainers each core city region is strongly linked to the rate of FSM-eligibility among all Key Stage 4 pupils in that city region. In city regions with a larger overall proportion of pupils who are eligible for FSM, rates of FSM eligibility among lower attainers also tend to be higher. However, in all city regions the share of pupils who are eligible for FSM is considerably higher among lower attainers than among all Key Stage 4 pupils. It is well known that GCSE attainment tends to be lower, on average, among young people who are FSM-eligible (Cassen et al., 2007).
It is also interesting to note that in city regions where overall rates of FSM eligibility are higher, the FSM attainment gap – that is, the difference in attainment between FSM-eligible pupils and non FSM-eligible pupils – tends to be smaller. In these city regions, particularly in London and Birmingham, the attainment of young people who are FSM-eligible tends to be more similar to that of learners in general. This means that, despite overall high rates of FSM eligibility, FSM-eligible pupils in these city regions are not as strongly overrepresented among lower attainers as in city regions where rates of FSM eligibility are lower, such as Bristol or Nottingham.

8
Figure 3: Percentage of low attainers who are eligible for Free School Meals in core city regions, average for period 2012/13 to 2016/17
Sources: SFR05/2014: GCSE and equivalent attainment by pupil characteristics: 2013 - National and local authority tables, SFR06/2015: GCSE and equivalent attainment by pupil characteristics: 2014 - National and local authority tables, SFR01/2016: GCSE and equivalent results: 2014 to 2015 (revised) - Local Authority tables, SFR03/2016: GCSE and equivalent results: 2015 to 2016 (revised) - Characteristics local authority tables and SFR01/2018: GCSE and equivalent results: 2016 to 2017 (revised) - Characteristics local authority tables.
Like FSM-eligible pupils, young people with special educational needs (SEN) are overrepresented among lower attainers in all city regions, as can be seen in figure 4. But, as is the case with regards to FSM eligibility, city regions with a higher proportion of SEN among the Key Stage 4 population in general also tend to have a higher proportion of SEN pupils among lower attainers. However, in some city regions, pupils with SEN are overrepresented among lower attainers to a stronger degree than in others. London particularly has a greater proportion of SEN pupils among its lower attainers than what would be expected given the overall incidence of SEN among its Key Stage 4 population. This is because, although attainment levels among both SEN and non-SEN pupils in London are significantly better than the national average, the proportion of SEN pupils who miss out on an A*-C/9-4 in English in maths is high relative to attainment among those without SEN. In England as a whole, pupils with SEN are 2.5 times more likely not to have achieved the A*-C/9-4 English and maths benchmark than pupils without SEN.7 In most core city regions, the corresponding figure is slightly lower than this national average. For instance, in Liverpool SEN pupils are only 2.2 times more likely to have missed this benchmark. But in London, SEN pupils are 2.8 times more likely not to have achieved an A*-C/9-4 in English and maths compared to pupils without SEN.
7 Here ‘likelihood’ refers simply to the probability of achieving this benchmark based on whether or not a pupil has SEN, and doesn’t take into account any other pupil characteristics or circumstances that could influence someone’s chances of meeting this benchmark.
0
5
10
15
20
25
30
35
05
10152025303540
Percentage of all pupils who are FSM-eligible (left axis)
Percentage of lower attainers who are FSM eligible (left axis)
FSM attainment gap (right axis)

9
Figure 4: SEN composition of lower attainers and all pupils in core city regions, average for period 2012/13 to 2016/17
Sources: SFR05/2014: GCSE and equivalent attainment by pupil characteristics: 2013 - National and local authority tables, SFR06/2015: GCSE and equivalent attainment by pupil characteristics: 2014 - National and local authority tables, SFR01/2016: GCSE and equivalent results: 2014 to 2015 (revised) - Local Authority tables, SFR03/2016: GCSE and equivalent results: 2015 to 2016 (revised) - Characteristics local authority tables and SFR01/2018: GCSE and equivalent results: 2016 to 2017 (revised) - Characteristics local authority tables. Note: the source data contains some suppressed cells which were imputed to calculate the composition of lower attainers. As such the values represented in this figure are an estimate and may deviate slightly from the true values.
In contrast to FSM eligibility and SEN, the ethnic composition of lower attainers is fairly similar to that of the wider key stage 4 population in each city region. For instance, lower attaining pupils in Newcastle City Region and Liverpool City Region are less ethnically diverse than lower attainers in Birmingham City Region or in London. This is, however, mostly a reflection of the ethnic composition of pupils in general in these city regions. London and Birmingham have much larger proportions of non-white pupils than other city regions, and the composition of lower attainers largely mirrors these differences. Appendix A provides more detail on the ethnic composition of lower attainers in each city region.
The proportion of lower attainers for whom English is an additional language (EAL) is also largely in line with the overall percentage of EAL pupils among young people in each core
0 20 40 60 80 100
lower attainers
lower attainers
lower attainers
lower attainers
lower attainers
lower attainers
lower attainers
lower attainers
lower attainers
lower attainers
Percentage of low attainers with SEN but without a statement/EHC plan
Percentage of low attainers with SEN statement/EHC plan
Percentage of low attainers with no identified SEN
all pupils
all pupils
all pupils
all pupils
all pupils
all pupils
all pupils
all pupils
all pupils
all pupilsBristol City Region
Greater Manchester
Newcastle City Region
Nottingham City Region
West Yorkshire
Sheffield City Region
Birmingham City Region
Liverpool City Region
London
England

10
city region (see Appendix A). London has the highest share of lower attainers, and pupils in general, who have EAL, followed by Birmingham City Region. Liverpool City Region and Newcastle City Region, on the other hand, have relatively few lower attainers with EAL, reflecting the fact that few Key Stage 4 pupils in general speak English as an additional language in these city regions.
In summary, while the population of lower attainers in each city region is fairly similar to the general KS4 population in terms of ethnic mix and EAL status, the proportions of young people who are eligible for FSM and who have SEN are generally higher in the lower attaining group. Any variation between city regions in the characteristics of the lower attaining group tends to mirror variation there more generally. London stands out as having a particularly low FSM attainment gap, and therefore not as many FSM-eligible lower attainers as you would expect given overall rates of FSM eligibility, but in contrast it has a relatively high percentage of young people with SEN in the low attaining group. Most of the other regions show little variation from each other on headline indicators although, of course, there is likely to be variation within these areas.
In the next section, we explore the destinations of lower attainers. Given the similarity across city regions in terms of attainment in English and maths, we analyse whether the destinations and trajectories of young people also look similar from one city region to another. Differences in the post-16 destinations of lower attainers – and young people in general – are potentially important as there is evidence that the route taken at 16 can have implications for educational outcomes at the end of the 16-18 phase (Crawford et al., 2011; Hupkau et al., 2017).
3. Post-16 transitions
Destinations after Key Stage 4 for all young people
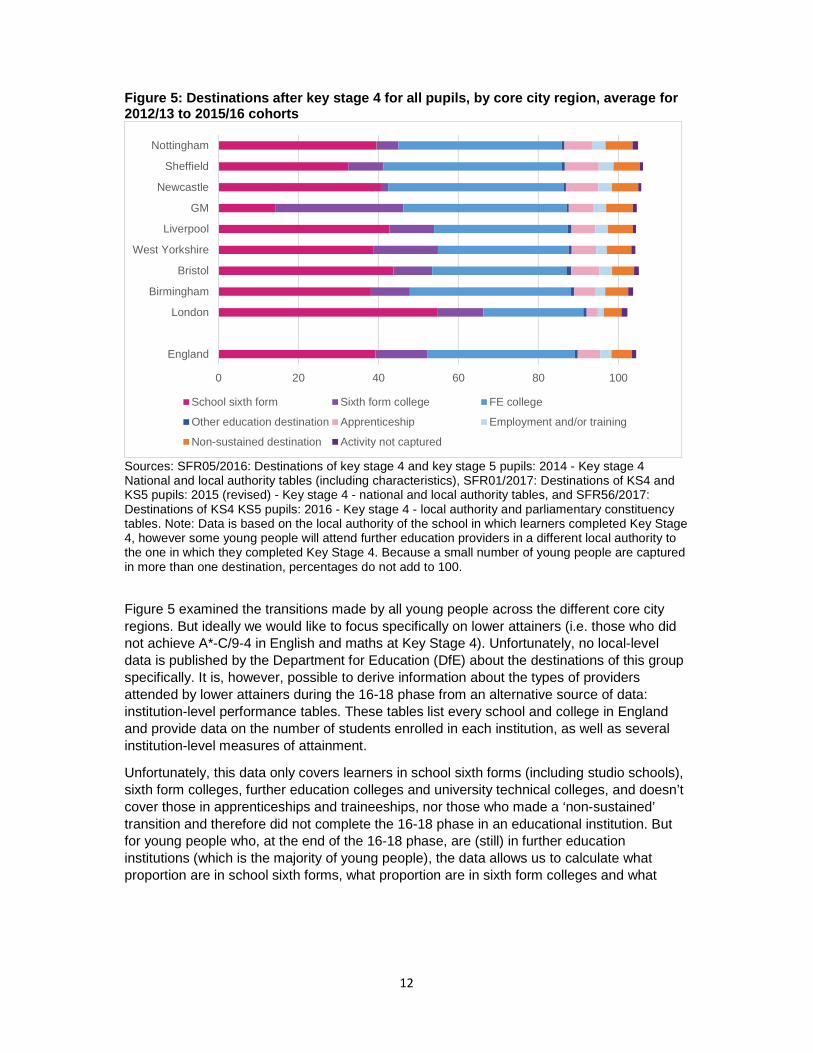
In section 1, we analysed overall levels of attainment of the English and maths benchmark, and saw that the proportion of young people who do not meet this benchmark does not vary a great deal between the core city regions, with the exception of London. Yet despite these fairly similar levels of attainment, the transitions made by young people after completing Key Stage 4 look quite different across the city regions. Figure 5 takes all pupils (not just lower attainers) in the 2012/13, 2013/14, 2014/15 and 2015/16 cohorts8 and shows what they were doing in the six months from October to April following their completion of year 11 (i.e. the first six months of the 16-18 phase). The figure shows: a) what proportion were still in education in a school sixth form, a sixth form college, an FE college, or another type of educational institution; b) what proportion were doing an apprenticeship; and c) what proportion were in sustained employment and/or training. It also shows what proportion of young people made a so-called ‘non-sustained’ transition, which means that they might have been recorded as being in education, employment or an apprenticeship for some of the six months between October and April, but not for the whole six month period.
The first finding in figure 5 is that in all core city regions, the vast majority of young people were still in education following the completion of Key Stage 4, ranging from 87 per cent in Nottingham City Region to 92 per cent in London. But the types of educational providers that young people attended differed quite strongly between city regions. For instance, in London
8 At the time of writing no data was available on the destinations of young people in the 2016/17 cohort.

11
a significantly higher proportion of young people made a transition to a school sixth form after Key Stage 4 than in most other city regions, while in Greater Manchester the proportion of 17 year olds who were in a school sixth form is the lowest of all the core city regions. In contrast, the percentage of young people who made a transition to a sixth form college is much higher in Greater Manchester than in other city regions. Taking school sixth forms and sixth form colleges together, the proportion of young people in Greater Manchester who are in sixth form provision is therefore not far off the average for England as a whole9.
Yet the difference between the post-16 system in London, where school sixth forms are a dominant post-16 destination, and the system in Greater Manchester, where sixth form colleges are a more common destination, has important implications for young people. In London a relatively large share of 16 years olds is likely to be staying on at the same school in which they completed Key Stage 4.10 In Greater Manchester on the other hand, the overwhelming majority of young people will be making a transition to a different institution at the age of 16.
As well as showing that there are marked city-region differences in the types of educational provider accessed by young people during the 16-18 phase, figure 5 also shows that there is substantial variation in the transitions made by young people who enter destinations other than education. For instance, the proportion who go into apprenticeships appears to vary substantially between city regions. In London, an average of only 2.8 per cent of young people were in an apprenticeship in the six months after completing Key Stage 4, but in Sheffield this percentage was three times as high, at 8.5 per cent. It has to be noted, however, that most young people do not start an apprenticeship straight after completing Key Stage 4 but instead complete one or multiple years of further education or training before entering an apprenticeship (Hupkau et al., 2017).
There are also considerable differences between city regions in terms of the proportion of young people making a non-sustained transition, with Greater Manchester, Newcastle City Region, Sheffield City Region and Nottingham City Region in particular standing out as having a relatively large share of young people in non-sustained destinations (between 6.6 and 6.7 per cent), and London having the lowest rate of non-sustained transitions (4.4 per cent).
9 A further finding from figure 5 is that in Newcastle City Region almost no young people appear to be transitioning to sixth form colleges. It is worth noting, however, that there are two sixth form colleges in Newcastle City Region: Newcastle Sixth Form College, which is part of the Newcastle College Group, and Queen Alexandra Sixth Form College, which is part of the Tyne Coast College Group. In the data, FE colleges and sixth form colleges which are part of the same consortium or umbrella organisation are recorded as one provider, and tend to be labelled as ‘FE colleges’. This means that young people attending one of the sixth form colleges mentioned above are recorded as being in an FE college. This issue also affects some other city regions, albeit to a lesser degree, if they have similar combined FE/sixth form institutions. For instance in Greater Manchester, Salford City College could be said to fall into the same category (having absorbed two formally independent sixth form colleges, where A level and other Level 3 courses are still offered in locations separate from the main vocationally-oriented campus). 10
This is something that would need to be verified by examining pupil-level data, which we are planning to do in the next phase of the project.
12
Figure 5: Destinations after key stage 4 for all pupils, by core city region, average for 2012/13 to 2015/16 cohorts
Sources: SFR05/2016: Destinations of key stage 4 and key stage 5 pupils: 2014 - Key stage 4 National and local authority tables (including characteristics), SFR01/2017: Destinations of KS4 and KS5 pupils: 2015 (revised) - Key stage 4 - national and local authority tables, and SFR56/2017: Destinations of KS4 KS5 pupils: 2016 - Key stage 4 - local authority and parliamentary constituency tables. Note: Data is based on the local authority of the school in which learners completed Key Stage 4, however some young people will attend further education providers in a different local authority to the one in which they completed Key Stage 4. Because a small number of young people are captured in more than one destination, percentages do not add to 100.
Figure 5 examined the transitions made by all young people across the different core city regions. But ideally we would like to focus specifically on lower attainers (i.e. those who did not achieve A*-C/9-4 in English and maths at Key Stage 4). Unfortunately, no local-level data is published by the Department for Education (DfE) about the destinations of this group specifically. It is, however, possible to derive information about the types of providers attended by lower attainers during the 16-18 phase from an alternative source of data: institution-level performance tables. These tables list every school and college in England and provide data on the number of students enrolled in each institution, as well as several institution-level measures of attainment.
Unfortunately, this data only covers learners in school sixth forms (including studio schools), sixth form colleges, further education colleges and university technical colleges, and doesn’t cover those in apprenticeships and traineeships, nor those who made a ‘non-sustained’ transition and therefore did not complete the 16-18 phase in an educational institution. But for young people who, at the end of the 16-18 phase, are (still) in further education institutions (which is the majority of young people), the data allows us to calculate what proportion are in school sixth forms, what proportion are in sixth form colleges and what
0 20 40 60 80 100
England
London
Birmingham
Bristol
West Yorkshire
Liverpool
GM
Newcastle
Sheffield
Nottingham
School sixth form Sixth form college FE college
Other education destination Apprenticeship Employment and/or training
Non-sustained destination Activity not captured

13
proportion are in general FE colleges11. We start by looking at all learners, as we did in figure 5.
In figure 6 we can see that in Greater Manchester, a very small proportion of learners are in school sixth forms at the end of the 16-18 phase, which is consistent with the destinations data presented in figure 6. In London, on the other hand, the proportion of learners in school sixth forms is the highest of all city regions, again mirroring the destinations data shown in figure 5. Greater Manchester again stands out as having a very high proportion of young people studying at sixth form colleges (35 per cent).
Figure 6: Educational provider types for all learners at the end of the 16-18 phase, by city region
Source: Department for Education - School and college performance tables in England: 2016 to 2017. Note: totals do not add up to 100 because for some providers an institution type is not recorded.
Again, the findings in figure 6 suggest that there is a substantial amount of variation in the types of institutions in which young people complete the 16-18 phase, which largely corresponds to differences in the local landscape of provision. For instance, when we examine, for each city region, the percentage of schools with sixth forms (see appendix C), we can see that in city regions with a higher proportion of school sixth forms, such as Bristol City Region, Nottingham City Region and London, a higher proportion of young people tend to complete the 16-18 phase in school sixth forms.
11 In order to calculate these proportions, institutions were categorised into ‘school sixth forms’, ‘sixth form colleges’, ‘FE colleges’ and ‘other’ based on the information provided in the institution-level Key Stage 5 performance tables, cross-checked with information from the Get Information About Schools (GIAS) database. For schools/colleges with very small numbers of English and maths lower attainers the data is suppressed in the published tables so figure 6 excludes a small number of learners and therefore may not be entirely accurate.
0 10 20 30 40 50 60 70 80 90 100
Greater Manchester
Sheffield City Region
Birmingham City Region
West Yorkshire
Newcastle City Region
Bristol City Region
Liverpool City Region
Nottingham City Region
London
England
School sixth form School sixth form (independent)
School sixth form (special) Sixth form college
General FE college Other education destination

14
Post-16 provider types for lower attainers
We now move on to examine the types of post-16 educational provision accessed by those with lower English and maths attainment. Here, we find similar city region-level variation in the distribution of young people across different types of providers (see figure 7). Figure 7 is based on the same institutional-level performance tables as above, but this time using the data relating to progress in English and maths. All learners who did not meet the expected C/4 benchmark in English and/or maths at the end of Key Stage 4 have since 2014 been made to continue these subjects, alongside their main qualifications, until the end of the academic year in which they turn 18. For each school and college in England, the performance tables provide data on the number of learners subject to this policy, from which it is possible to work out the proportions of lower attainers attending different types of providers. The data is presented separately for those with English attainment below a C/4 (referred to as ‘English lower attainers’) and those with maths attainment below a C/4 (referred to as ‘maths lower attainers’).12 As before, the data refers only to those who complete the 16-18 phase in educational institutions.
The first thing to note is that, perhaps not surprisingly, lower attainers seem to be much more likely to study at FE colleges during the 16-18 phase compared to learners in general. In England as a whole, around 80 per cent of those without a C/4 in English, and 75 per cent of those without a C/4 in maths, completed their 16-18 phase at an FE college13. A much lower proportion – around 20 per cent of English lower attainers, and 25 per cent of maths lower attainers – study at school sixth forms or sixth form colleges.
However, as was the case with learners in general, there are significant city-region differences with regards to the types of providers in which lower attainers complete the 16-18 phase. As before, Greater Manchester stands out for the low share of learners attending school sixth forms. Only 4.5 per cent of English lower attainers and 5.1 per cent of maths lower attainers are in school sixth forms at the end of the 16-18 phase. In London, in contrast, these proportions are more than five times as high, with 23.6 per cent of English lower attainers, and 27.4 per cent of maths lower attainers studying at school sixth forms. Liverpool City Region and Nottingham City Region also have relatively large numbers of lower attainers who are in school sixth forms.
The proportion of lower attaining learners studying at sixth form colleges is also substantially higher in London than in other city regions. This is somewhat surprising, because among the overall 16-18 cohort in London, the proportion studying at sixth form colleges is not particularly high. In contrast, in Greater Manchester – where, as we’ve seen, a high overall number of learners complete the 16-18 phase in sixth form colleges – lower attainers do not appear to be attending sixth form colleges in as quite as large numbers as we might expect.
12 Some young people who are categorised as ‘maths lower attainers’ will also have missed out on a C/4 in English, and, equally, some young people in the ‘English lower attainer’ category will also have missed out on a C/4 in maths. This means that there is a degree of overlap between ‘maths lower attainers’ and ‘English lower attainers’, rather than these being two distinct groups. 13 As noted on p. 12-13, this refers only to lower attainers who are in education, rather than in apprenticeships, employment or NEET.

15
Figure 7: Educational provider types for lower attainers at the end of the 16-18 phase, by city region
Source: Department for Education - School and college performance tables in England: 2016 to 2017.
These variations in the types of transitions made by lower attainers in part simply reflect local differences in the post-16 provider landscape – as illustrated in part in Appendix C. But city region-level variations in the post-16 pathways taken by lower attainers are almost certainly not explained by differences in local provision alone. There are many additional facets that are likely to play a role, including differences in the particular attainment profiles of lower attainers, the characteristics of lower attainers in each city region, and the preferences and norms that prevail in different places. For instance, Allen et al. (2016) show that, even when they have similar Key Stage 4 attainment and live in the same neighbourhood (meaning they have access to a very similar set of institutions), FSM-eligible students make markedly different post-16 transitions. Similarly, compared to White British pupils, ethnic minority pupils have a greater likelihood of attending a school sixth form or sixth form college, even when holding pupils’ prior attainment and neighbourhood constant (ibid.).
On a more ‘structural’ level, the selectivity of school sixth forms and sixth form colleges is also likely to be important in determining post-16 pathways. In particular, it will have an effect on what proportion of lower attainers enter a school sixth form or sixth form college, instead of taking a different pathway such as attending a general further education college, or starting an apprenticeship. There is little publicly available data on the selectivity of sixth form providers, but it may be possible to provide some indication of selectivity by examining how likely lower attainers are to attend school sixth forms and sixth form colleges relative to the likelihood of attending a sixth form for all 16-18 year olds.
Figure 8 indicates that in Sheffield city region and Bristol city region, the proportion of lower attainers attending school sixth forms only equates to about a quarter of the proportion of all learners attending school sixth forms. Another way of interpreting this is that, in Sheffield City Region and Bristol City Region, the likelihood of completing Key Stage 5 at a school sixth form for someone who did not get a C/4 in English or maths is about four times lower
0 50 100
Greater…
Sheffield City…
Bristol City…
Newcastle City…
Birmingham…
West Yorkshire
Liverpool City…
Nottingham…
London
England
English lower attainers
School sixth form School sixth form (independent) School sixth form (special)
Sixth form college General FE college Other education destination
0 50 100
Greater…
Sheffield City…
Bristol City Region
Newcastle City…
Birmingham City…
West Yorkshire
Liverpool City…
Nottingham City…
London
England
Maths lower attainers

16
than the likelihood of studying at school sixth form for the average learner14. In London, Nottingham City Region and Liverpool City Region, on the other hand, the likelihood that a lower attainer will attend a school sixth form, relative to the likelihood of studying at a school sixth form for all learners, is much higher. In other words, there is a less marked difference in the rate at which lower attainers attend school sixth forms compared to the average learner.
Again, there are likely to be several other factors at play in explaining these patterns, including not just the selectivity of school sixth forms, but also the particular characteristics of Key Stage 4 pupils in different city regions, and even the selectivity of schools (with and without sixth forms) in terms of their intake at year 7.
A further finding to note in figure 8 is that, across all city regions, the proportion of ‘maths lower attainers’ studying at school sixth forms and sixth form colleges is higher than the proportion of ‘English lower attainers’. This may suggest that those without at least a C/4 in maths could find it slightly easier to get admitted to a sixth form than those without a C/4 or above in English. It is important to note, though, that at least some ‘maths lower attainers’ will also have missed out on a C/4 in English, and vice versa. Moreover, there could be other differences between maths lower attainers and English lower attainers that aren’t accounted for. It is therefore difficult to draw firm conclusions about the relative impact of missing out on a grade C/4 in English versus missing out on a grade C/4 in maths when it comes to attending sixth form.
Figure 8: Rate at which English lower attainers and maths lower attainers complete the 16-18 phase at school sixth forms, expressed as a percentage of the rate at which all learners complete the 16-18 phase at school sixth forms
Source: Department for Education - School and college performance tables in England: 2016 to 2017.
14 Here, this likelihood is based only on whether or not someone attained a C/4 in English or maths, and doesn’t take into account any of the other factors which may play a role in determining whether someone attends a school sixth form or not.
0102030405060708090
100110
English lower attainers Maths lower attainers All learners

17
In figure 9 we repeat the same exercise as in figure 8, but for sixth form colleges. (As we have no data on the number of young people who complete the 16-18 phase at sixth form colleges in Newcastle city region it is not included in the figure.) The picture for sixth form colleges is somewhat different to that for school sixth forms. While in Sheffield city region lower attainers appeared to be substantially less likely to study at school sixth forms than 16-18 year olds on average, the same doesn’t seem to be the case when it comes to sixth form colleges. In fact, Sheffield City Region stands out as having one of the lowest gaps between the rate at which lower attainers study at sixth form colleges and the rate at which young people in general complete the 16-18 phase at a sixth form college. Interestingly, in London those without A*-C/9-4 in English and maths have a higher probability of completing their 16-18 phase at a sixth form college than learners in general. In contrast, in Nottingham City Region lower attainers appear to attend sixth form colleges at a much lower rate than the average 16-18 year old.
Figure 9: Rate at which English lower attainers and maths lower attainers complete the 16-18 phase at sixth form colleges, expressed as a percentage of the rate at which all learners complete the 16-18 phase at sixth form colleges
Source: Department for Education - School and college performance tables in England: 2016 to 2017. Note: Newcastle City Region is not included as there are no lower attainers attending sixth form colleges.
To summarise, post-16 destinations differ quite substantially between core city regions, despite very similar attainment of the English and maths A*-C/9-4 benchmarks. In London, and to a lesser extent in Nottingham and Liverpool, a much larger proportion of young people attend sixth form provision, than in city regions such as Sheffield and Greater Manchester. The same is the case for lower attainers, although in all city regions the most common destination for lower attainers are general FE colleges. Not only are there marked variations in the types of provision in which lower attainers complete their 16-18 phase, there also appears to be a difference between city regions in how likely lower attainers are to attend a school sixth form or sixth form college, relative to young people in general. Again
0102030405060708090
100110120
English lower attainers Maths lower attainers All learners

18
London is distinctive in that, unlike in other city regions, those without a C/4 in maths and/or English seem to be more likely to complete their 16-18 study at a sixth form college than the average young person.
4. Progress in English and maths during 16-18 phase
Having examined the post-16 transitions of lower attainers to different types of provision, we now focus on how much progress is made by lower attainers in English and maths during the 16-18 phase (see Box 2 for details on how progress is measured). We examine data for the year 2016/17 (relating to the cohort which completed Key Stage 4 in 2014/15). On average, for England as a whole, progress in both English and maths for this cohort was negative15. This means that young people’s highest attainment in English and maths during the 16-18 phase was lower, on average, than their highest attainment during Key Stage 4.
The same is the case for all core city regions, as shown in figures 10 and 11. However, some city regions fared better than others. Greater Manchester, London and Liverpool City Region performed relatively well compared to the other city regions, with regards to progress in both English and maths. In Newcastle, Bristol and Nottingham City Region progress was less good, with students seeing their point score fall by over 0.2 points in English and a similar amount in maths (meaning their attainment fell by around a fifth of a GCSE grade, on average). Because data for only one year is examined here, further analysis is needed to determine to what extent these city region differences are stable over time.
15 Provisional data for 2017/18 suggest that, for the first time, average progress in both subjects was positive, although only marginally so.
Box 2 - Measuring progress in English and maths
To examine progress in English and maths during the 16-18 phase, we use institutional-level performance tables published by the DfE. The performance tables include, for each institution, data on the average progress of learners who are required to continue studying English and maths because they did not achieve a C/4 or above at the end of Key Stage 4. From this we can calculate the average progress made by all lower attainers in a particular area1. The progress measure is based on a point score system. All GCSE grades are awarded a point score, with a U equating to 0 points and an A*/9 equating to 8 points. Other English and maths qualifications, such as Functional Skills, are also awarded a point score. Progress is calculated by comparing a young person’s point score at the end of Key Stage 4 with the highest point score they obtained by the end of the 16-18 phase. A negative progress score indicates that an individual achieved a lower level of attainment during the 16-18 phase than at the end of Key Stage 4, and a positive score indicates that they made progress.

19
Figure 10: Average progress rates in English and maths during 16-18 phase, by city region
Source: Department for Education - School and college performance tables in England: 2016 to 2017. Note: figures refer to progress made by learners who are enrolled in institutions in each city region, rather than learners who live in each city region.
Figure 11: Average progress rates in English and maths during 16-18 phase, by city region
Source: Department for Education - School and college performance tables in England: 2016 to 2017. Note: figures refer to progress made by learners who are enrolled in institutions in each city region, rather than learners who live in each city region. The progress score for Liverpool is very close to zero (0.0002), which is why it is not visible on the graph.
These city region differences in English and maths progress are likely to be the result of an interplay of different factors. One of these might be differences in the types of 16-18
-0.30
-0.25
-0.20
-0.15
-0.10
-0.05
0.00
-0.30
-0.25
-0.20
-0.15
-0.10
-0.05
0.00
0.05

20
providers attended by lower attainers in different city regions, as explored in section 3, or differences in SEN and FSM rates, as explored in section 2. In general, levels of progress in English and maths tend to be higher in school sixth forms and sixth form colleges, which could explain why London – where, as shown in figure 7, a relatively large proportion of lower attainers attend school sixth forms and sixth form colleges – does well in terms of progress in English and maths. But this does not explain why Greater Manchester – where relatively fewer lower attainers attend school sixth forms and sixth form colleges – also has relatively high rates of progress. This is because there isn’t a straightforward relationship between provider types and progress in English and maths. For instance, although school sixth forms and sixth form colleges tend to have higher progress rates, this is likely, at least partly, to be due to the fact that their student intakes tend to have higher attainment at Key Stage 4, even when considering only those with below expected attainment in English and maths. But, importantly, the attainment profile of students admitted to the same provider type – say, sixth form colleges – is likely to differ between city regions. For instance, in some city regions sixth form colleges may only admit those with relatively high Key Stage 4 attainment, whereas in other areas sixth form colleges may be an accessible pathway for young people with a wider range of prior attainment profiles (as figures 8 and 9 try to illustrate).
This is one of the reasons why, even within the same provider type, there are substantial city region differences in the amount of progress made by lower attainers (see figure 13). While sixth form colleges generally have relatively high progress scores in both English and maths, in London the average amount of progress made in sixth form colleges is much lower compared to most other city regions16. And when considering FE colleges, where the majority of lower attainers are found, figure 12 shows that average progress score in both English and maths are higher (less negative) in Liverpool City Region and Sheffield City Region than in the other core city regions. FE colleges in Greater Manchester also have relatively good progress score in both English maths. The high overall progress rates found in Greater Manchester, reported in figures 10 and 11, therefore appear to be partly due to the fact that those at FE colleges in Greater Manchester make more progress than (or, more accurately, don’t fall behind as much as) those at FE colleges in most other city regions. FE colleges in Newcastle city region, on the other hand, have the lowest average progress scores in both English and maths of all core city regions, which explains, to a large extent, why overall progress in Newcastle city region is relatively low compared to other city regions.
16
Even more extreme, students in sixth form college in Nottingham city region had negative average progress rates, although there is only one sixth form college in Nottingham city region in the data so this finding should be interpreted as reflecting the situation in this particular provider (in this particular year).

21
Figure 12: Progress rates in English and maths during 16-18 phase, by city region and provider type, 2016/17.
Source: Department for Education - School and college performance tables in England: 2016 to 2017. Note: figures refer to progress made by learners who are enrolled in institutions in each city region, rather than learners who live in each city region.
-0.6 -0.4 -0.2 0.0 0.2 0.4 0.6 0.8
Birmingham City Region
Bristol City Region
Greater Manchester
Liverpool City Region
London
Newcastle City Region
Nottingham City Region
Sheffield City Region
West Yorkshire
English
School sixth form Sixth form college General FE college
-0.6 -0.4 -0.2 0.0 0.2 0.4 0.6 0.8
maths

22
Conclusion
The findings in this report have shown that there are important variations between core city regions in terms of the level of GCSE ‘lower attainment’, the post-16 destinations of those without a C/4 in English and maths, and the progress made in these subjects during the 16-18 phase. Although there are differences between all city regions, London is perhaps most distinctive, partly because of its relatively low share of lower attainers, but also because the post-16 transitions made by young people in London – including those with lower attainment – look quite different to elsewhere. Young people in London are least likely to enter into an apprenticeship after completing Key Stage 4, as well as having the lowest rate of ‘unsustained’ transitions. The proportion of lower attainers who are in sixth form institutions (school sixth forms or sixth form colleges) during the 16-18 phase is moreover much higher in London than in other core city regions – around 35 per cent of those without a C/4 in English and around 40 per cent of those without a C/4 in maths are in sixth form institutions.
The relatively large number of school sixth forms and sixth form colleges in London is obviously part of the explanation. In addition, the data also suggests that school sixth forms and sixth form colleges in London appear to be relatively accessible to lower attainers, as judged by the fact that those without grade C/4 in English and maths do not attend these institutions at a dramatically lower rate than young people on average. In fact, lower attaining young people in London appear slightly more likely to attend a sixth form college than the average young person. In other city regions, there appears to be a much clearer divide between the rate at which young people in general attend sixth form providers and the rate at which lower attainers attend these providers. In these city regions, the post-16 destinations of lower attainers therefore tend to look more distinct from the destinations of learners in general.
These differences in the structure of the post-16 system have important implications, for young people in general, and for lower attainers in particular. The variety of provision in the city region, and the approach that different types of providers take towards those with lower English and maths attainment, shapes the options that are available to lower attainers and thus, whether they are able to access the type of provision that is most suitable for them. The type of provision that lower attainers are able to access at 16 will, in turn, influence their experience during the 16-18 phase and, potentially, their outcomes.
Importantly, spatial differences in the nature of provision also mean that when it comes to ensuring successful post-16 trajectories for those with lower attainment and improving their progress during the 16-18 phase, city regions are all relying on very different post-16 systems to meet these goals. While they will have common challenges, the particular resources and tools available to address these will vary between city regions. This fact strengthens the case for locally-sensitive approaches which take into account the particular nature of the post-16 landscape in the city region (as well as differences between areas within each city region).

23
References
Allen, R., Parameshwaran, M., Thomson, D., 2016. Social and ethnic inequalities in choice available and choices made at age 16. Social Mobility Commission.
Cassen, R., Kingdon, G.G., Joseph Rowntree Foundation, 2007. Tackling low educational achievement. Joseph Rowntree Foundation, York.
Crawford, C., Meschi, E., Vignoles, A., 2011. Post-16 Educational Choices and Institutional Value Added at Key Stage 5. CEE DP 124. Centre for the Economics of Education.
Hupkau, C., McNally, S., Ruiz-Valenzuela, J., Ventura, G., 2017. Post-Compulsory Education in England: Choices and Implications. National Institute Economic Review 240, R42–R57.
Velthuis, S., Lupton, R., Thomson, S., Unwin, L., 2018. The characteristics and post-16 transitions of GCSE ‘lower attainers.’ Inclusive Growth Analysis Unit, Manchester.

24
Appendix A: The ethnic composition of lower attainers in core city regions
Figure A1: Ethnic composition of lower attainers in core city regions, average over period 2012/13 to 2016/17
Sources: SFR05/2014: GCSE and equivalent attainment by pupil characteristics: 2013 - National and local authority tables; SFR06/2015: GCSE and equivalent attainment by pupil characteristics: 2014 - National and local authority tables; SFR03/2016: GCSE and equivalent results: 2015 to 2016 (revised) - Characteristics local authority tables; and SFR01/2018: GCSE and equivalent results: 2016 to 2017 (revised) - Characteristics local authority tables.
0
10
20
30
40
50
60
70
80
90
100
Percentage who are white Percentage who are mixed Percentage who are Asian
Percentage who are black Percentage who are Chinese

25
Appendix B: English as an Additional Language among lower attainers in core city regions
Figure B1: English as an Additional Language among lower attainers and all pupils, by core city region, average over 2012/13 to 2016/17
Sources: SFR05/2014: GCSE and equivalent attainment by pupil characteristics: 2013 - National and local authority tables, SFR06/2015: GCSE and equivalent attainment by pupil characteristics: 2014 - National and local authority tables, SFR01/2016: GCSE and equivalent results: 2014 to 2015 (revised) - Local Authority tables, SFR03/2016: GCSE and equivalent results: 2015 to 2016 (revised) - Characteristics local authority tables and SFR01/2018: GCSE and equivalent results: 2016 to 2017 (revised) - Characteristics local authority tables.
0
5
10
15
20
25
30
35
40
45
Percentage of lower attainers whose first language is other than English
Percentage of all pupils whose first language is other than English

26
Appendix C: School sixth forms and sixth form colleges in core city regions
Figure C1 shows, for each city region, the percentage of schools with sixth forms, and the ratio of sixth form colleges relative to the number of 16-18 students. It is clear that very few schools in Greater Manchester have sixth forms, whereas in London, Nottingham and Bristol more than 70 per cent of schools have a sixth form. The number of sixth form colleges relative to the number of young people in the 16-18 phase also varies substantially, with Greater Manchester, London, Sheffield, and Liverpool City Region having a relatively large number of sixth form colleges compared to Nottingham, Birmingham or Bristol City Region. Newcastle City Region appears to have no sixth form colleges, but this is because the sixth form institutions in the city region are part of larger FE organisations and therefore are not recorded separately in the data.
Figure C1: Percentage of schools which have sixth forms, and the number of sixth form colleges per 1,000 16-18 learners*, by city region, 2016/17
Source: Get Information About Schools: 2016/17, and Department for Education School and college performance tables in England: 2016 to 2017. *Learners refers to those who completed the 16-18 phase in education providers (schools, sixth form colleges, FE colleges and other education institutions) in each city region.
0.00
0.05
0.10
0.15
0.20
0.25
0.30
0.35
0
10
20
30
40
50
60
70
80
90
percentage of schools with sixth form number of sixth form colleges per 1,000 learners (right axis)