the contamination mechanism and behavior of amide bond
TRANSCRIPT
Journal of The Electrochemical Society, 162 (4) F427-F435 (2015) F427
The Contamination Mechanism and Behavior of Amide BondContaining Organic Contaminant on PEMFCHyun-Seok Cho,a,∗,z Mayukhee Das,a Heli Wang,b Huyen N. Dinh,b,∗ and J. W. Van Zeec,∗
aDepartment of Chemical Engineering, University of South Carolina, Columbia, South Carolina 29208, USAbChemical and Materials Science Center, National Renewable Energy Laboratory, Golden, Colorado 80401, USAcDepartment of Chemical and Biological Engineering, University of Alabama, Tuscaloosa, Alabama 35487, USA
This paper presents a study of the effects of an organic contaminant containing an amide bond (-CONH-), ε-caprolactam, on polymerelectrolyte membrane fuel cells (PEMFCs). The ε-caprolactam has been detected in leachates from polyphthalamide materials thatare being considered for use as balance-of-plant structural materials for PEMFCs. Contamination effects from ε-caprolactam inNafion membranes are shown to be controlled by temperature. A possible explanation of the temperature effect is the endothermicring-opening reaction of the amide bond (-NHCO-) of the cyclic ε-caprolactam. UV-vis and ATR-IR spectroscopy studies confirmedthe presence of open ring structure of ε-caprolactam in membranes. The ECSA and kinetic current for the ORR of the Pt/C catalystwere also investigated and were observed to decrease upon contamination by the ε-caprolactam. By comparison of the CVs ofammonia and acetic acid, we confirmed the adsorption of carboxylic acid (-COOH) or carboxylate anion (-COO-) onto the surface ofthe Pt. Finally, a comparison of in situ voltage losses at 80◦C and 50◦C also revealed temperature effects, especially in the membrane,as a result of the dramatic increase in the HFR.© The Author(s) 2015. Published by ECS. This is an open access article distributed under the terms of the Creative CommonsAttribution Non-Commercial No Derivatives 4.0 License (CC BY-NC-ND, http://creativecommons.org/licenses/by-nc-nd/4.0/),which permits non-commercial reuse, distribution, and reproduction in any medium, provided the original work is not changed in anyway and is properly cited. For permission for commercial reuse, please email: [email protected]. [DOI: 10.1149/2.0631504jes]All rights reserved.
Manuscript submitted December 29, 2014; revised manuscript received January 22, 2015. Published February 3, 2015. This wasPaper 1137 presented at the Boston, Massachusetts, Meeting of the Society, October 9–14, 2011.
Although research efforts have been made to reduce systemcosts and improve efficiency of polymer electrolyte membrane fuelcells (PEMFCs), cost and durability issues continue to delay theircommercialization.1 In addition, because contamination of the stackcan affect performance and durability, studies designed to elucidatethese effects and mechanisms have been receiving more attention.1–41
In general, three fundamental contamination mechanisms areknown: conductivity loss by ion exchange in the membrane/ionomer,Pt contamination by adsorption, and water/mass transport issues in-duced by changes in the gas diffusion layer (GDL) properties. Alkali,alkaline-earth, or transitional-metal cations such as Li+, Na+, K+,Cs+, Ni2+, Cu2+, Ca2+, and Fe3+ are well known contaminants thatundergo ion exchange2–4,6–7,12–30 with the proton exchange membrane(PEM) in a PEMFC. Changes in the oxygen reduction reaction (ORR)kinetics at a Pt electrode covered with a Nafion ionomer20–24 have alsobeen reported. In addition to the decrease in PEM conductivity dueto the reaction with cationic contaminants, a structural change alsooccurs in the ionomer. This structural change appears to be related tothe degradation of Pt/C catalyst activity. Catalyst contamination by anadsorption mechanism from feed-gas contaminants such as SO2,8–9
CO,10 and H2S11 are well known. In addition, we have reported thataniline adsorbs onto the Pt/C electrode because it contains an aromaticring and a nitrogen atom in the form of an amine group.31,35
In a recent cost analysis,36,37 the need for cost reduction of balance-of-plant (BOP) materials increased relative to the need for cost reduc-tion of the stack in PEMFCs. Using off-the-shelf materials for BOPrather than customized hand-made materials may provide an advan-tage in cost reduction; however, durability may be adversely affectedby the contaminants arising from such materials. A few studies37,38
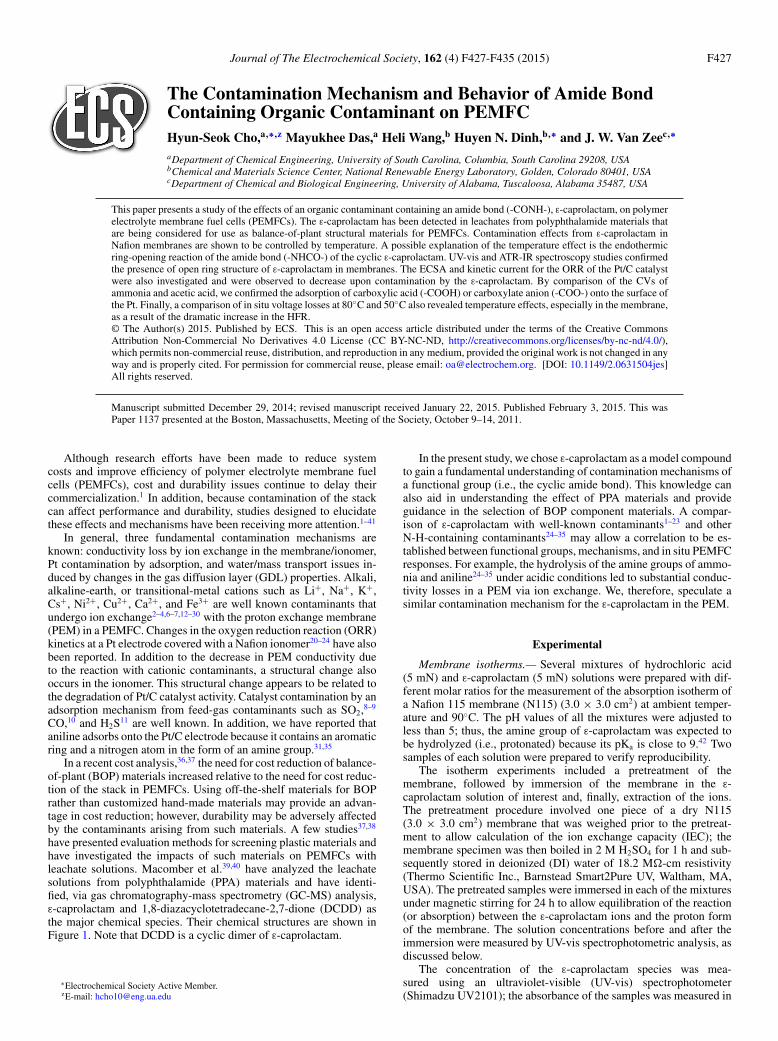
have presented evaluation methods for screening plastic materials andhave investigated the impacts of such materials on PEMFCs withleachate solutions. Macomber et al.39,40 have analyzed the leachatesolutions from polyphthalamide (PPA) materials and have identi-fied, via gas chromatography-mass spectrometry (GC-MS) analysis,ε-caprolactam and 1,8-diazacyclotetradecane-2,7-dione (DCDD) asthe major chemical species. Their chemical structures are shown inFigure 1. Note that DCDD is a cyclic dimer of ε-caprolactam.
∗Electrochemical Society Active Member.zE-mail: [email protected]
In the present study, we chose ε-caprolactam as a model compoundto gain a fundamental understanding of contamination mechanisms ofa functional group (i.e., the cyclic amide bond). This knowledge canalso aid in understanding the effect of PPA materials and provideguidance in the selection of BOP component materials. A compar-ison of ε-caprolactam with well-known contaminants1–23 and otherN-H-containing contaminants24–35 may allow a correlation to be es-tablished between functional groups, mechanisms, and in situ PEMFCresponses. For example, the hydrolysis of the amine groups of ammo-nia and aniline24–35 under acidic conditions led to substantial conduc-tivity losses in a PEM via ion exchange. We, therefore, speculate asimilar contamination mechanism for the ε-caprolactam in the PEM.
Experimental
Membrane isotherms.— Several mixtures of hydrochloric acid(5 mN) and ε-caprolactam (5 mN) solutions were prepared with dif-ferent molar ratios for the measurement of the absorption isotherm ofa Nafion 115 membrane (N115) (3.0 × 3.0 cm2) at ambient temper-ature and 90◦C. The pH values of all the mixtures were adjusted toless than 5; thus, the amine group of ε-caprolactam was expected tobe hydrolyzed (i.e., protonated) because its pKa is close to 9.42 Twosamples of each solution were prepared to verify reproducibility.
The isotherm experiments included a pretreatment of themembrane, followed by immersion of the membrane in the ε-caprolactam solution of interest and, finally, extraction of the ions.The pretreatment procedure involved one piece of a dry N115(3.0 × 3.0 cm2) membrane that was weighed prior to the pretreat-ment to allow calculation of the ion exchange capacity (IEC); themembrane specimen was then boiled in 2 M H2SO4 for 1 h and sub-sequently stored in deionized (DI) water of 18.2 M�-cm resistivity(Thermo Scientific Inc., Barnstead Smart2Pure UV, Waltham, MA,USA). The pretreated samples were immersed in each of the mixturesunder magnetic stirring for 24 h to allow equilibration of the reaction(or absorption) between the ε-caprolactam ions and the proton formof the membrane. The solution concentrations before and after theimmersion were measured by UV-vis spectrophotometric analysis, asdiscussed below.
The concentration of the ε-caprolactam species was mea-sured using an ultraviolet-visible (UV-vis) spectrophotometer(Shimadzu UV2101); the absorbance of the samples was measured in
F428 Journal of The Electrochemical Society, 162 (4) F427-F435 (2015)
Figure 1. Chemical structures of (a) ε-caprolactam and (b) 1,8-diazacyclotetradecane-2,7-dione (DCDD).
the wavelength range of 190–400 nm. For the UV-vis analysis, a wave-length of 215 nm was chosen for quantification of the ε-caprolactamions in acidic solutions. The calibration curve of the intensity at215 nm as a function of the concentration of ε-caprolactam solu-tions was linear in the concentration range of 0.06 to 5 mM, withan accuracy of R2 = 0.9968. ACS reagent-grade HCl, H2SO4, NaCl,CaCl2, and NH4Cl were used as received.
Membrane conductivity measurements.— For the conductivitymeasurements, a thin Nafion 211 membrane (NRE211) was used tominimize the time required to reach equilibrium. Membrane conduc-tivities for pristine and ε-caprolactam-exchanged NRE211 membraneswere determined at different relative humidity (RH) (i.e., 10, 20, 30,40, 50, 60, 70, 80, 90, and 95%) by applying DC currents at a cell tem-perature of 80◦C. A potentiostat (model PAR273) with a four-probeconductivity BT-112 Teflon-based cell (Beckktech LLC) was utilizedfor the measurements. The cell was equilibrated with a 300 sccm flowof N2 at 80◦C and 90% RH for 1 h using a Scribner 890E test stationthat was calibrated for both flow and humidity. The RH was increasedfrom 20% to 95%, and the membrane conductivity was measuredwith a hold time of 1 h at each RH to assure equilibrium conditions.Three cycles from low to high RH were performed to assess the repro-ducibility. A VAISALA dew-point chamber was attached at the outletof the conductivity cell to confirm the dew-point temperature of theoutlet gases relative to those set by the test station. No conductivitychanges were observed over three cycles of RH change; we thereforeconcluded that the exchange percentage did not change during theconductivity measurements.
ATR-IR analyses.— We prepared fresh samples of ε-caprolactam-exchanged membranes, N115 (3.0 × 3.0 cm2) by soaking the mem-brane in a mixture of 5 mN ε-caprolactam and 10 mN H2SO4 (1:2).The percent exchange of the proton sites was approximately 30% ofthe IEC on the basis of the previously described isotherm experiments.The sample was rinsed with DI water to remove any residue and thendried with a nitrogen gas purge at room temperature for 30 minutes.The attenuated total reflectance-Infrared spectroscopy (ATR-IR) spec-tra were collected on a spectrometer (Nicolet 670) equipped with adetector (Spectratech). The average number of scans per spectrumwas 100. Each spectrum was recorded from 4000 to 800 cm−1. Wealso investigated the solutions of ε-caprolactam and ε-caproic acidextracted from the N115 membranes using 99.8 wt% methanol toobserve any change in the peaks related to the chemical structureof Nafion. The ε-caprolactam and ε-caproic acid spectra in methanolwere also compared as references.
Water uptake measurement.— With the objective of comparingwater uptake for Nafion membrane, three pieces of NRE212 and N117(0.9 × 4.25 cm) were placed as a sandwich in the Beckktech cell. Thecell is equilibrated with a 300 sccm flow of H2 at various temperatures(30, 50, 80, 90◦C) and 90% RH for 1 h using a Scribner 890E PEMFCtest station. The humidity was changed from low (20%) RH to high(95%) RH. After hold of 2 h for each RH to assure equilibriumconditions, we disassembled the cell, weighed the 3 piece sandwich,and calculated the mass of water uptake.
RDE measurements.— Carbon (Vulcan XC-72R)-supported45.5 wt% Pt (Tanaka, Pt loading 0.02 mg/cm2) was dispersed in iso-propyl alcohol (IPA) and DI water in the presence of 20 wt% Nafionionomer (vs. Pt). The Pt catalyst ink was mixed and ultrasonicallydispersed for approximately 20 minutes before being dropped onto aglassy carbon ring disk electrode (0.2475 cm2). This Pt/C electrodeon glassy carbon is the working electrode whereas a mesh attachedPt wire was used as a counter electrode. The electrochemical analysiswas performed using a PAR model 263A potentiostat and a mercurysulfate electrode as the reference electrode; 0.1 M perchloric acid so-lution (HClO4) was used as the electrolyte. All of the potentials arereferenced to the reversible hydrogen electrode (RHE) unless other-wise stated. For the high-temperature (73◦C) rotating disk electrode(RDE) experiment, a heating jacket was wrapped around a 3-neckflask that included the HClO4 electrolyte solution and a special RDEtip suitable for high temperatures (Pine Instrument). The electrolytewas purged with pure nitrogen for a minimum of 30 minutes before(and during) the experiments. The electrode was initially subjected toa cleaning procedure that entailed 100 cycles from 0 to 1.2 V at a scanrate of 100 mV/s and a rotation rate of 2500 rpm. Additionally, whilethe ε-caprolactam was being injected into the electrolyte, the potentialof the WE was maintained at 0.4 V at 2500 rpm to avoid oxidation oforganic compounds at higher potentials. For ammonia-gas-infusionRDE experiments, 997 ppm of ammonia gas balanced in N2 was in-troduced to the electrolyte through a mass flow controller (MFC).Additional details of the calculation of the amount of ammonia fed tothe system are presented in Appendix A.
In situ single-cell tests.— Membrane electrode assemblies (MEAs,50 cm2) provided by GM were used for a single-cell infusion test atdifferent cell temperatures (50◦C and 80◦C). The Pt loading for theanode and cathode were 0.05 mg/cm2 and 0.4 mg/cm2, respectively.To assure the same water content in the Nafion membrane, the inletRHs were fixed at 50% on both the anode and cathode during constant-current operation at 10 A. The ε-caprolactam was fed into the cell onthe cathode via a nebulizer and a micro-syringe peristaltic pump. Theε-caprolactam was mixed with dry air gas and the relative humiditywas controlled by the flow rate of the ε-caprolactam solution. Thecell voltage and the high-frequency resistance (HFR) were recordedduring the infusion of ε-caprolactam at 10 A. Cyclic voltammograms(CVs) were also recorded to quantify the effects on the Pt/C electrode.
Results and Discussion
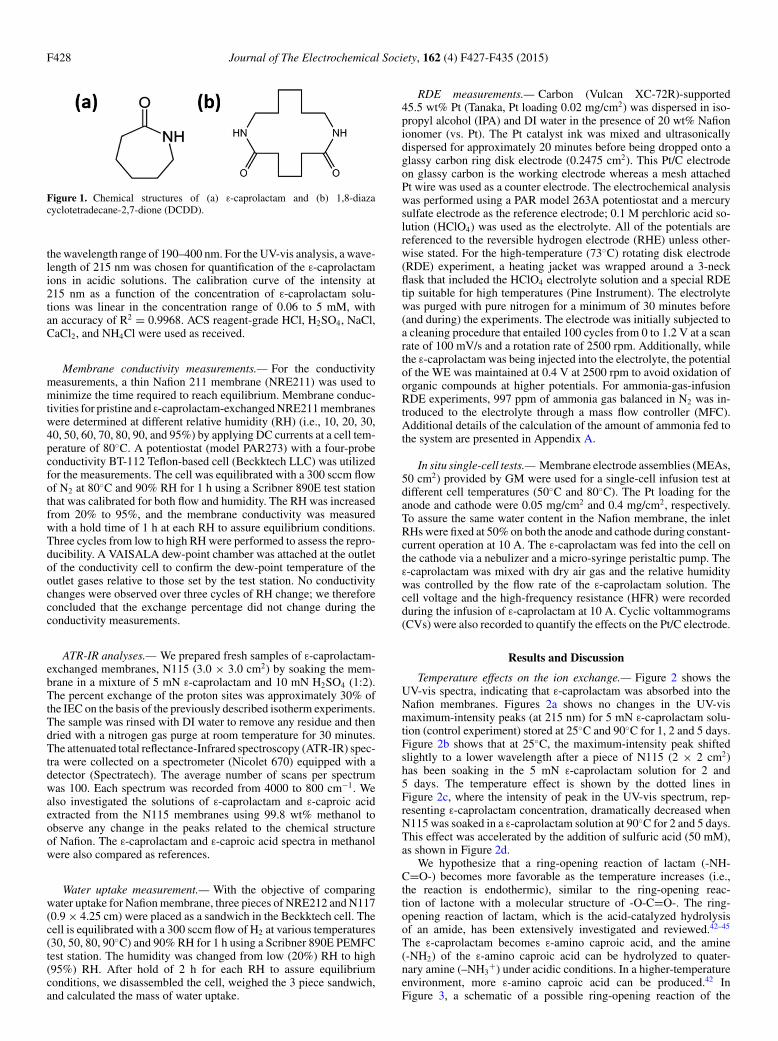
Temperature effects on the ion exchange.— Figure 2 shows theUV-vis spectra, indicating that ε-caprolactam was absorbed into theNafion membranes. Figures 2a shows no changes in the UV-vismaximum-intensity peaks (at 215 nm) for 5 mN ε-caprolactam solu-tion (control experiment) stored at 25◦C and 90◦C for 1, 2 and 5 days.Figure 2b shows that at 25◦C, the maximum-intensity peak shiftedslightly to a lower wavelength after a piece of N115 (2 × 2 cm2)has been soaking in the 5 mN ε-caprolactam solution for 2 and5 days. The temperature effect is shown by the dotted lines inFigure 2c, where the intensity of peak in the UV-vis spectrum, rep-resenting ε-caprolactam concentration, dramatically decreased whenN115 was soaked in a ε-caprolactam solution at 90◦C for 2 and 5 days.This effect was accelerated by the addition of sulfuric acid (50 mM),as shown in Figure 2d.
We hypothesize that a ring-opening reaction of lactam (-NH-C=O-) becomes more favorable as the temperature increases (i.e.,the reaction is endothermic), similar to the ring-opening reac-tion of lactone with a molecular structure of -O-C=O-. The ring-opening reaction of lactam, which is the acid-catalyzed hydrolysisof an amide, has been extensively investigated and reviewed.42–45
The ε-caprolactam becomes ε-amino caproic acid, and the amine(-NH2) of the ε-amino caproic acid can be hydrolyzed to quater-nary amine (–NH3
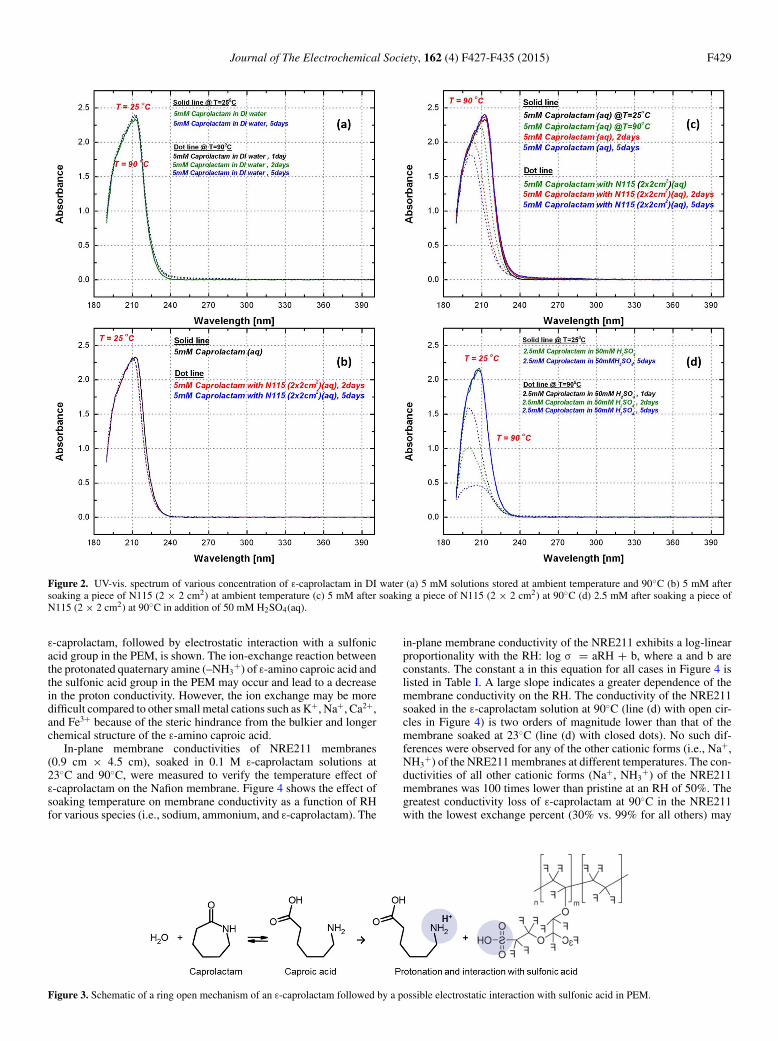
+) under acidic conditions. In a higher-temperatureenvironment, more ε-amino caproic acid can be produced.42 InFigure 3, a schematic of a possible ring-opening reaction of the
Journal of The Electrochemical Society, 162 (4) F427-F435 (2015) F429
Figure 2. UV-vis. spectrum of various concentration of ε-caprolactam in DI water (a) 5 mM solutions stored at ambient temperature and 90◦C (b) 5 mM aftersoaking a piece of N115 (2 × 2 cm2) at ambient temperature (c) 5 mM after soaking a piece of N115 (2 × 2 cm2) at 90◦C (d) 2.5 mM after soaking a piece ofN115 (2 × 2 cm2) at 90◦C in addition of 50 mM H2SO4(aq).
ε-caprolactam, followed by electrostatic interaction with a sulfonicacid group in the PEM, is shown. The ion-exchange reaction betweenthe protonated quaternary amine (–NH3
+) of ε-amino caproic acid andthe sulfonic acid group in the PEM may occur and lead to a decreasein the proton conductivity. However, the ion exchange may be moredifficult compared to other small metal cations such as K+, Na+, Ca2+,and Fe3+ because of the steric hindrance from the bulkier and longerchemical structure of the ε-amino caproic acid.
In-plane membrane conductivities of NRE211 membranes(0.9 cm × 4.5 cm), soaked in 0.1 M ε-caprolactam solutions at23◦C and 90◦C, were measured to verify the temperature effect ofε-caprolactam on the Nafion membrane. Figure 4 shows the effect ofsoaking temperature on membrane conductivity as a function of RHfor various species (i.e., sodium, ammonium, and ε-caprolactam). The
in-plane membrane conductivity of the NRE211 exhibits a log-linearproportionality with the RH: log σ = aRH + b, where a and b areconstants. The constant a in this equation for all cases in Figure 4 islisted in Table I. A large slope indicates a greater dependence of themembrane conductivity on the RH. The conductivity of the NRE211soaked in the ε-caprolactam solution at 90◦C (line (d) with open cir-cles in Figure 4) is two orders of magnitude lower than that of themembrane soaked at 23◦C (line (d) with closed dots). No such dif-ferences were observed for any of the other cationic forms (i.e., Na+,NH3
+) of the NRE211 membranes at different temperatures. The con-ductivities of all other cationic forms (Na+, NH3
+) of the NRE211membranes was 100 times lower than pristine at an RH of 50%. Thegreatest conductivity loss of ε-caprolactam at 90◦C in the NRE211with the lowest exchange percent (30% vs. 99% for all others) may
Figure 3. Schematic of a ring open mechanism of an ε-caprolactam followed by a possible electrostatic interaction with sulfonic acid in PEM.

F430 Journal of The Electrochemical Society, 162 (4) F427-F435 (2015)
Figure 4. Effect of soaking temperature on NRE211 conductivity as a functionof RH for various contaminants: (a) pristine (b) sodium (c) ammonium (d) ε-caprolactam: closed and open dots represent ambient temperature and 90◦Csoaks, respectively.
result from the steric hindrance of the ε-amino caproic acid or theε-caprolactam.
In our previous aniline study31,35, we compared, as a function ofRH, the water contents in N117 membranes with the same acid sitesexchanged with aniline and sodium. The water contents of the aniline-exchanged N117 membranes were 100 times lower than those of thesodium-exchanged N117 membranes. We attributed the lower watercontent to the steric hindrance caused by the size of the species andto the hydrophobic functionality of the aniline.
For the temperature effect on the hydrolysis of ε-caprolactam, onecan use the data in Table II to calculate the equilibrium constants forthe partition between the closed ring and open ring of ε-caprolactam.The �Hrxn value for the open ring reaction of ε-caprolactam wascalculated to be 8.85 kJ/mol (endothermic reaction) on the basis ofthe values in Table II. The K90◦C/K25◦C ratio for the ring opening is2.0 when calculated according to the Van’t Hoff equation in equa-tion 1. Notably, the Gibbs free energy in Table II is positive for bothtemperatures because �H > 0, -T�S < 0 indicates an unfavorable en-thalpy change (i.e., an endothermic reaction) and a favorable entropychange (i.e., an increase in disorder as a result of the ring-openingreaction).
ln
(K2
K1
)= −�Hr xn
R
(1
T2− 1
T1
)[1]
K = exp
(−G
RT
)= exp
[(S − H/T )
R
][2]
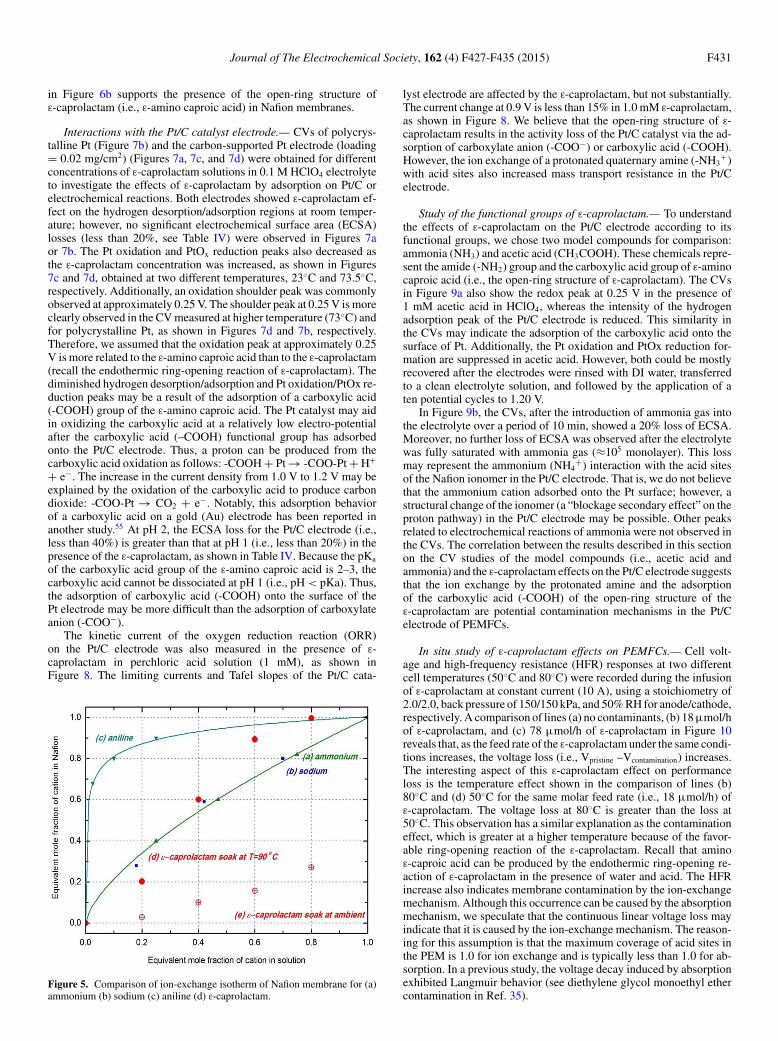
In Figure 5, the isotherm of Nafion membranes for ε-caprolactamat 90◦C indicated a higher affinity toward the PEM relative to othersingle-charged cations such as Na+ and NH3
+ when the mole fractionof ε-caprolactam in solution exceeded 0.4. The similarity between thechemical structures of the Nafion membranes under acidic conditionsand the carboxylic acid (-COOH) group of ε-amino caproic acid isone reason for the higher affinity of ε-caprolactam toward the PEM at90◦C. The larger size of ε-caprolactam might be another reason for its
Table I. Slopes (constant a in the equation log(σ) = aRH + b) ofmembrane conductivity as a function of RH for NRE211 in thepresence of various species.
(d) ε-caprolactam ε-caprolactam(a) Pristine (b) Na (c) NH3 (23◦C) (90◦C)
0.0188 ± 0.002 0.0277 0.0311 0.0267 0.0493
higher affinity given that potassium ion (K+) has a higher affinity forthe PEM than does sodium (Na+) because of the larger radius, and thussmaller hydration radius, of potassium.47–49 The isotherm of Nafionmembranes for ε-caprolactam at ambient temperature, however, indi-cated a lower affinity for the PEM. The difference in affinities of theε-caprolactam toward the PEM at different temperatures may indicatea temperature effect on the ring-opening reaction.
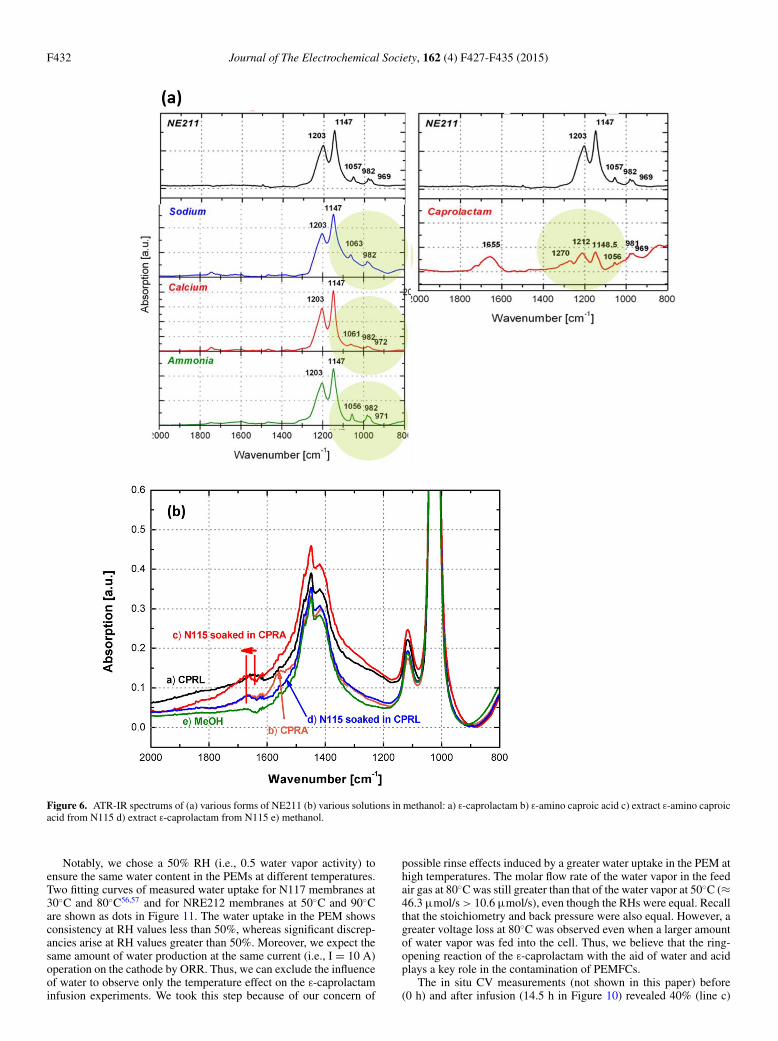
ATR-IR studies for ε-caprolactam-absorbed Nafion membranes.—As shown in Figure 6a, the ATR-IR spectrum of the ε-caprolactam-absorbed membrane shows a shift of the SO3
− stretching peak at1057 cm−1 because of the electrostatic interactions with the sulfonicgroup (R-SO3
−). This shift is also observed in the spectra of othercationic forms of Nafion membranes. This behavior is attributed toa decrease in the polarization of the sulfonic group (R-SO3
−) bythe protonated quaternary amine group.50–54 The 1600–1700 cm−1
region shows the broadly overlapped C=O stretching peaks of ketone(1750–1680 cm−1), carboxylic acid (1780–1710 cm−1), amide (1670–1650 cm−1), and asymmetric carbonyl (1655 cm−1) vibrations, whichsupport the presence of the protonated ε-caprolactam in the membrane.Whether the chemical structure is closed-ring or open-ring cannot beclearly determined. Notably, however, the spectra of aliphatic long-chain carboxylic acids exhibit bands in the range of 1345–1180 cm−1
in the solid phase, and the number of weak bands is related to the lengthof the chain.54 Here, three weak bands are observed in the 1300–1100 cm−1 region of the spectrum for the ε-caprolactam-absorbedmembrane, which could represent 6 carbon atoms of the aliphatic ε-amino carboxylic acid. For acids with an even number of carbon atomsin the solid phase, the number of bands observed in this region equalshalf the number of carbon atoms; i.e., ε-amino caproic acid contains 6carbon atoms, which may be revealed by the 3 weak bands in the rangeof 1345–1180 cm−1.54 Details of the assigned peaks of the ATR-IRspectra for the ε-caprolactam-absorbed Nafion membranes are shownin Table III.
To verify the chemical structure of the absorbed ε-caprolactamin the previously described membrane, the ε-caprolactam was ex-tracted by dissolving the membrane in a methanol solution, fol-lowed by ATR-IR measurements. For reference, ATR-IR spectra of1 mM ε-caprolactam and ε-amino caproic acid in methanol werealso compared, as shown in Figure 6b. In the band region of 1650–1630 cm−1, the spectrum of the solution of the ε-caprolactam dis-solved in methanol (line (a)) showed N-H and C=O stretching vi-bration peaks. A shift of the band peaks to the 1690–1655 cm−1
region was observed for the sample solutions (lines (b), (c), and (d)),which is attributed to the C=O stretching and vibration bands ofthe aliphatic carboxylic acid. This peak shift in the region of 1690–1630 cm−1 was observed in the spectra of all of the sample so-lutions (lines (b), (c), (d)), with the exception of the spectrum ofthe ε-caprolactam solution dissolved in methanol (line (a)). Thus,we believe that the peak shift in the region of 1690–1630 cm−1
Table II. Kinetic constants of ε-caprolactam for ring opening reaction.44
Kinetic constants of the rate equation G [kJ/mol]
Reaction A [kg/mol2 · hr] E [kJ/mol] H [kJ/mol] S [kJ/mol · K] 23◦C 90◦C
Ring opening 1.69E+06 88.09 8.85 –0.033 18.59 20.83
Journal of The Electrochemical Society, 162 (4) F427-F435 (2015) F431
in Figure 6b supports the presence of the open-ring structure ofε-caprolactam (i.e., ε-amino caproic acid) in Nafion membranes.
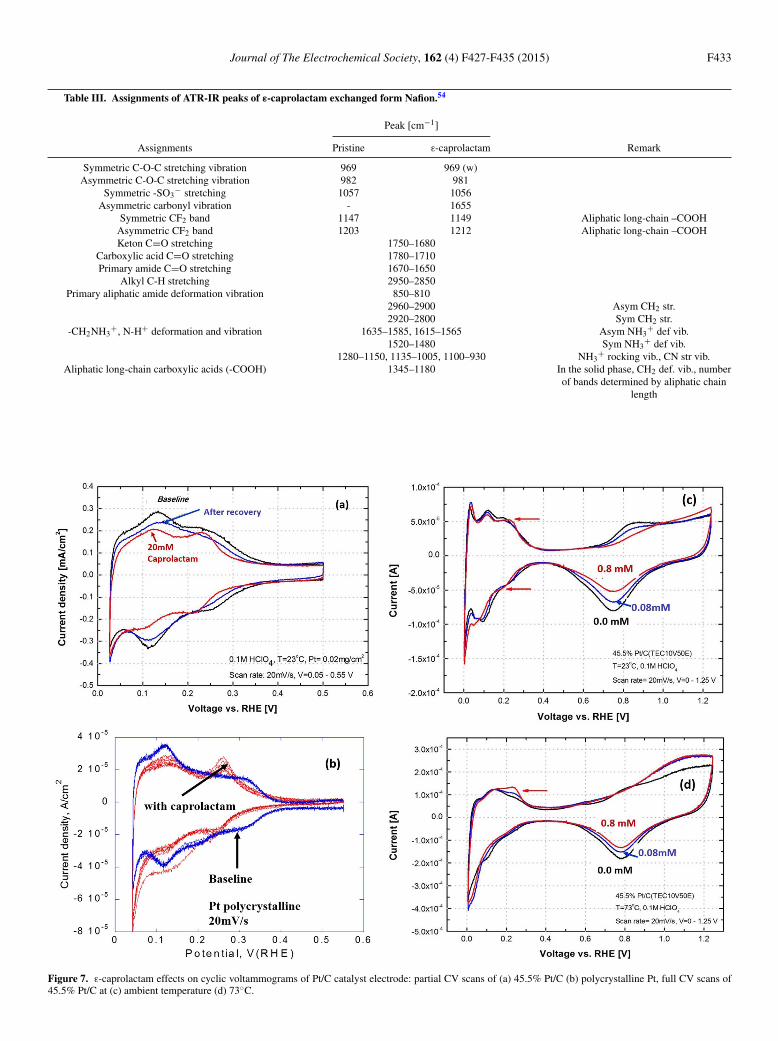
Interactions with the Pt/C catalyst electrode.— CVs of polycrys-talline Pt (Figure 7b) and the carbon-supported Pt electrode (loading= 0.02 mg/cm2) (Figures 7a, 7c, and 7d) were obtained for differentconcentrations of ε-caprolactam solutions in 0.1 M HClO4 electrolyteto investigate the effects of ε-caprolactam by adsorption on Pt/C orelectrochemical reactions. Both electrodes showed ε-caprolactam ef-fect on the hydrogen desorption/adsorption regions at room temper-ature; however, no significant electrochemical surface area (ECSA)losses (less than 20%, see Table IV) were observed in Figures 7aor 7b. The Pt oxidation and PtOx reduction peaks also decreased asthe ε-caprolactam concentration was increased, as shown in Figures7c and 7d, obtained at two different temperatures, 23◦C and 73.5◦C,respectively. Additionally, an oxidation shoulder peak was commonlyobserved at approximately 0.25 V. The shoulder peak at 0.25 V is moreclearly observed in the CV measured at higher temperature (73◦C) andfor polycrystalline Pt, as shown in Figures 7d and 7b, respectively.Therefore, we assumed that the oxidation peak at approximately 0.25V is more related to the ε-amino caproic acid than to the ε-caprolactam(recall the endothermic ring-opening reaction of ε-caprolactam). Thediminished hydrogen desorption/adsorption and Pt oxidation/PtOx re-duction peaks may be a result of the adsorption of a carboxylic acid(-COOH) group of the ε-amino caproic acid. The Pt catalyst may aidin oxidizing the carboxylic acid at a relatively low electro-potentialafter the carboxylic acid (–COOH) functional group has adsorbedonto the Pt/C electrode. Thus, a proton can be produced from thecarboxylic acid oxidation as follows: -COOH + Pt → -COO-Pt + H+
+ e−. The increase in the current density from 1.0 V to 1.2 V may beexplained by the oxidation of the carboxylic acid to produce carbondioxide: -COO-Pt → CO2 + e−. Notably, this adsorption behaviorof a carboxylic acid on a gold (Au) electrode has been reported inanother study.55 At pH 2, the ECSA loss for the Pt/C electrode (i.e.,less than 40%) is greater than that at pH 1 (i.e., less than 20%) in thepresence of the ε-caprolactam, as shown in Table IV. Because the pKa
of the carboxylic acid group of the ε-amino caproic acid is 2–3, thecarboxylic acid cannot be dissociated at pH 1 (i.e., pH < pKa). Thus,the adsorption of carboxylic acid (-COOH) onto the surface of thePt electrode may be more difficult than the adsorption of carboxylateanion (-COO−).
The kinetic current of the oxygen reduction reaction (ORR)on the Pt/C electrode was also measured in the presence of ε-caprolactam in perchloric acid solution (1 mM), as shown inFigure 8. The limiting currents and Tafel slopes of the Pt/C cata-
Figure 5. Comparison of ion-exchange isotherm of Nafion membrane for (a)ammonium (b) sodium (c) aniline (d) ε-caprolactam.
lyst electrode are affected by the ε-caprolactam, but not substantially.The current change at 0.9 V is less than 15% in 1.0 mM ε-caprolactam,as shown in Figure 8. We believe that the open-ring structure of ε-caprolactam results in the activity loss of the Pt/C catalyst via the ad-sorption of carboxylate anion (-COO−) or carboxylic acid (-COOH).However, the ion exchange of a protonated quaternary amine (-NH3
+)with acid sites also increased mass transport resistance in the Pt/Celectrode.
Study of the functional groups of ε-caprolactam.— To understandthe effects of ε-caprolactam on the Pt/C electrode according to itsfunctional groups, we chose two model compounds for comparison:ammonia (NH3) and acetic acid (CH3COOH). These chemicals repre-sent the amide (-NH2) group and the carboxylic acid group of ε-aminocaproic acid (i.e., the open-ring structure of ε-caprolactam). The CVsin Figure 9a also show the redox peak at 0.25 V in the presence of1 mM acetic acid in HClO4, whereas the intensity of the hydrogenadsorption peak of the Pt/C electrode is reduced. This similarity inthe CVs may indicate the adsorption of the carboxylic acid onto thesurface of Pt. Additionally, the Pt oxidation and PtOx reduction for-mation are suppressed in acetic acid. However, both could be mostlyrecovered after the electrodes were rinsed with DI water, transferredto a clean electrolyte solution, and followed by the application of aten potential cycles to 1.20 V.
In Figure 9b, the CVs, after the introduction of ammonia gas intothe electrolyte over a period of 10 min, showed a 20% loss of ECSA.Moreover, no further loss of ECSA was observed after the electrolytewas fully saturated with ammonia gas (≈105 monolayer). This lossmay represent the ammonium (NH4
+) interaction with the acid sitesof the Nafion ionomer in the Pt/C electrode. That is, we do not believethat the ammonium cation adsorbed onto the Pt surface; however, astructural change of the ionomer (a “blockage secondary effect” on theproton pathway) in the Pt/C electrode may be possible. Other peaksrelated to electrochemical reactions of ammonia were not observed inthe CVs. The correlation between the results described in this sectionon the CV studies of the model compounds (i.e., acetic acid andammonia) and the ε-caprolactam effects on the Pt/C electrode suggeststhat the ion exchange by the protonated amine and the adsorptionof the carboxylic acid (-COOH) of the open-ring structure of theε-caprolactam are potential contamination mechanisms in the Pt/Celectrode of PEMFCs.
In situ study of ε-caprolactam effects on PEMFCs.— Cell volt-age and high-frequency resistance (HFR) responses at two differentcell temperatures (50◦C and 80◦C) were recorded during the infusionof ε-caprolactam at constant current (10 A), using a stoichiometry of2.0/2.0, back pressure of 150/150 kPa, and 50% RH for anode/cathode,respectively. A comparison of lines (a) no contaminants, (b) 18 μmol/hof ε-caprolactam, and (c) 78 μmol/h of ε-caprolactam in Figure 10reveals that, as the feed rate of the ε-caprolactam under the same condi-tions increases, the voltage loss (i.e., Vpristine –Vcontamination) increases.The interesting aspect of this ε-caprolactam effect on performanceloss is the temperature effect shown in the comparison of lines (b)80◦C and (d) 50◦C for the same molar feed rate (i.e., 18 μmol/h) ofε-caprolactam. The voltage loss at 80◦C is greater than the loss at50◦C. This observation has a similar explanation as the contaminationeffect, which is greater at a higher temperature because of the favor-able ring-opening reaction of the ε-caprolactam. Recall that aminoε-caproic acid can be produced by the endothermic ring-opening re-action of ε-caprolactam in the presence of water and acid. The HFRincrease also indicates membrane contamination by the ion-exchangemechanism. Although this occurrence can be caused by the absorptionmechanism, we speculate that the continuous linear voltage loss mayindicate that it is caused by the ion-exchange mechanism. The reason-ing for this assumption is that the maximum coverage of acid sites inthe PEM is 1.0 for ion exchange and is typically less than 1.0 for ab-sorption. In a previous study, the voltage decay induced by absorptionexhibited Langmuir behavior (see diethylene glycol monoethyl ethercontamination in Ref. 35).
F432 Journal of The Electrochemical Society, 162 (4) F427-F435 (2015)
Figure 6. ATR-IR spectrums of (a) various forms of NE211 (b) various solutions in methanol: a) ε-caprolactam b) ε-amino caproic acid c) extract ε-amino caproicacid from N115 d) extract ε-caprolactam from N115 e) methanol.
Notably, we chose a 50% RH (i.e., 0.5 water vapor activity) toensure the same water content in the PEMs at different temperatures.Two fitting curves of measured water uptake for N117 membranes at30◦C and 80◦C56,57 and for NRE212 membranes at 50◦C and 90◦Care shown as dots in Figure 11. The water uptake in the PEM showsconsistency at RH values less than 50%, whereas significant discrep-ancies arise at RH values greater than 50%. Moreover, we expect thesame amount of water production at the same current (i.e., I = 10 A)operation on the cathode by ORR. Thus, we can exclude the influenceof water to observe only the temperature effect on the ε-caprolactaminfusion experiments. We took this step because of our concern of
possible rinse effects induced by a greater water uptake in the PEM athigh temperatures. The molar flow rate of the water vapor in the feedair gas at 80◦C was still greater than that of the water vapor at 50◦C (≈46.3 μmol/s > 10.6 μmol/s), even though the RHs were equal. Recallthat the stoichiometry and back pressure were also equal. However, agreater voltage loss at 80◦C was observed even when a larger amountof water vapor was fed into the cell. Thus, we believe that the ring-opening reaction of the ε-caprolactam with the aid of water and acidplays a key role in the contamination of PEMFCs.
The in situ CV measurements (not shown in this paper) before(0 h) and after infusion (14.5 h in Figure 10) revealed 40% (line c)
Journal of The Electrochemical Society, 162 (4) F427-F435 (2015) F433
Table III. Assignments of ATR-IR peaks of ε-caprolactam exchanged form Nafion.54
Peak [cm−1]
Assignments Pristine ε-caprolactam Remark
Symmetric C-O-C stretching vibration 969 969 (w)Asymmetric C-O-C stretching vibration 982 981
Symmetric -SO3− stretching 1057 1056
Asymmetric carbonyl vibration - 1655Symmetric CF2 band 1147 1149 Aliphatic long-chain –COOH
Asymmetric CF2 band 1203 1212 Aliphatic long-chain –COOHKeton C=O stretching 1750–1680
Carboxylic acid C=O stretching 1780–1710Primary amide C=O stretching 1670–1650
Alkyl C-H stretching 2950–2850Primary aliphatic amide deformation vibration 850–810
2960–2900 Asym CH2 str.2920–2800 Sym CH2 str.
-CH2NH3+, N-H+ deformation and vibration 1635–1585, 1615–1565 Asym NH3
+ def vib.1520–1480 Sym NH3
+ def vib.1280–1150, 1135–1005, 1100–930 NH3
+ rocking vib., CN str vib.Aliphatic long-chain carboxylic acids (-COOH) 1345–1180 In the solid phase, CH2 def. vib., number
of bands determined by aliphatic chainlength
Figure 7. ε-caprolactam effects on cyclic voltammograms of Pt/C catalyst electrode: partial CV scans of (a) 45.5% Pt/C (b) polycrystalline Pt, full CV scans of45.5% Pt/C at (c) ambient temperature (d) 73◦C.

F434 Journal of The Electrochemical Society, 162 (4) F427-F435 (2015)
Table IV. Comparison of ECSA loss of Pt/C electrode at differentpH in the presence of ε-caprolactam in ex-situ RDE experiments:T = 23◦C, Pt loading = 0.02 mg/cm2.
ECSA �ECSA ECSA �ECSA[m2/g] [%] [m2/g] [%]
Concentration [mM] pH = 1 pH = 2
0 61.2 0 62.7 00.008 55.7 9.0 - -0.04 55.0 10.1 51.8 17.40.08 53.6 12.4 47.1 24.90.2 52.3 14.5 41.9 33.20.4 51.5 15.8 38.0 39.40.8 50.3 17.8 - -
Figure 8. Oxygen reduction reaction curve for 45.5% Pt/C catalyst in the (a)absence and (b) presence of 1.0 mM ε-caprolactam.
Figure 9. Partial CV scans of Pt/C catalyst electrode in the presence of aceticacid (CH3COOH), ammonia (NH3).
Figure 10. In-situ iR-corrected cell voltage and HFR responses at 80◦C duringε-caprolactam infusion in a PEMFC: (a) no ε-caprolactam (b) ε-caprolactamfeed rate = 18 μmol/h (c) 78 μmol/h (d) 18 μmol/h at 50◦C.
Figure 11. Water uptake plots for Nafion membranes at various temperaturesand humidity (a) N117 at 30◦C (b) N117 at 80◦C (c) NRE212 at 50◦C (d)NRE212 at 90◦C.
and 27% (line d) reductions in the ECSA, respectively, at 80◦C. TheECSA loss measured in situ is more comparable to the CV resultsmeasured ex situ at pH 2 rather than those measured at pH 1 (see0.04 mM and 0.2 mM in Table IV). This comparison between ex situand in situ CVs suggests that carboxylate anion (-COO−) may be themain chemical structure of the amino ε-caproic acid rather than thecarboxylic acid (-COOH) in PEMFCs.
Conclusions
The effects of ε-caprolactam on PEMFCs were investigated to un-derstand the contamination mechanisms. The membrane isothermsindicated a higher affinity of ε-caprolactam toward the PEM at90◦C, but a lower affinity at ambient temperature. Greater mem-brane conductivity loss was also observed at higher temperatures.A possible explanation of this temperature effect is the endother-mic ring-opening reaction of the amide bond (-NHCO-) of the cyclicε-caprolactam. UV-vis and ATR-IR analyses supported the pres-ence of ε-caprolactam in its open-ring structure in the PEM. TheECSA and kinetic current for the ORR of the Pt/C catalyst werealso investigated and were observed to decrease upon contamina-tion by the ε-caprolactam. By comparison of the CVs of ammo-nia and acetic acid, we confirmed the adsorption of carboxylic acid(-COOH) or carboxylate anion (-COO−) onto the surface of the Pt
Journal of The Electrochemical Society, 162 (4) F427-F435 (2015) F435
catalyst. Additionally, their effects on the Pt/C electrode were deter-mined to be more severe at pH 2 than at pH 1. Finally, a comparison ofin situ voltage losses at 80◦C and 50◦C also revealed temperature ef-fects, especially in the PEM, as a result of the dramatic increase in theHFR. The voltage response for the ε-caprolactam infusion exhibited alinear, continuous decay, indicating that the ion-exchange mechanismwas occurring as opposed to the absorption phenomenon.
Acknowledgments
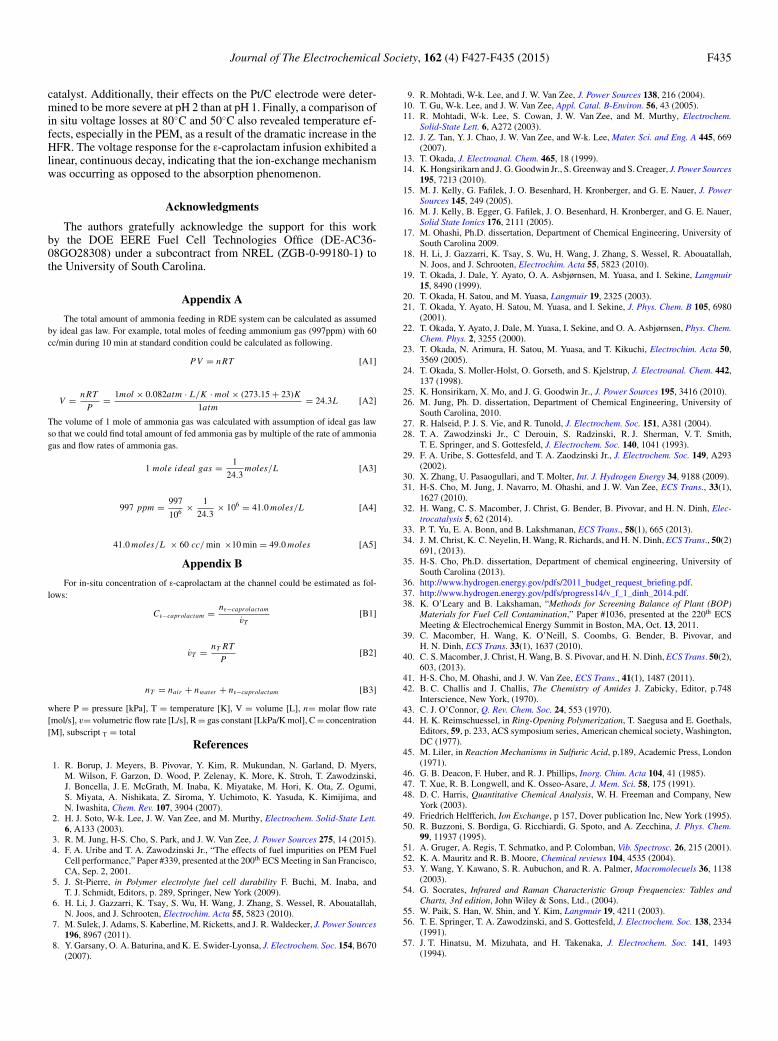
The authors gratefully acknowledge the support for this workby the DOE EERE Fuel Cell Technologies Office (DE-AC36-08GO28308) under a subcontract from NREL (ZGB-0-99180-1) tothe University of South Carolina.
Appendix A
The total amount of ammonia feeding in RDE system can be calculated as assumedby ideal gas law. For example, total moles of feeding ammonium gas (997ppm) with 60cc/min during 10 min at standard condition could be calculated as following.
PV = n RT [A1]
V = n RT
P= 1mol × 0.082atm · L/K · mol × (273.15 + 23)K
1atm= 24.3L [A2]
The volume of 1 mole of ammonia gas was calculated with assumption of ideal gas lawso that we could find total amount of fed ammonia gas by multiple of the rate of ammoniagas and flow rates of ammonia gas.
1 mole ideal gas = 1
24.3moles/L [A3]
997 ppm = 997
106 × 1
24.3× 106 = 41.0 moles/L [A4]
41.0 moles/L × 60 cc/ min ×10 min = 49.0 moles [A5]
Appendix B
For in-situ concentration of ε-caprolactam at the channel could be estimated as fol-lows:
Cε−caprolactam = nε−caprolactam
v̇T[B1]
v̇T = nT RT
P[B2]
nT = nair + nwater + nε−caprolactam [B3]
where P = pressure [kPa], T = temperature [K], V = volume [L], n= molar flow rate[mol/s], v= volumetric flow rate [L/s], R = gas constant [LkPa/K mol], C = concentration[M], subscript T = total
References
1. R. Borup, J. Meyers, B. Pivovar, Y. Kim, R. Mukundan, N. Garland, D. Myers,M. Wilson, F. Garzon, D. Wood, P. Zelenay, K. More, K. Stroh, T. Zawodzinski,J. Boncella, J. E. McGrath, M. Inaba, K. Miyatake, M. Hori, K. Ota, Z. Ogumi,S. Miyata, A. Nishikata, Z. Siroma, Y. Uchimoto, K. Yasuda, K. Kimijima, andN. Iwashita, Chem. Rev. 107, 3904 (2007).
2. H. J. Soto, W-k. Lee, J. W. Van Zee, and M. Murthy, Electrochem. Solid-State Lett.6, A133 (2003).
3. R. M. Jung, H-S. Cho, S. Park, and J. W. Van Zee, J. Power Sources 275, 14 (2015).4. F. A. Uribe and T. A. Zawodzinski Jr., “The effects of fuel impurities on PEM Fuel
Cell performance,” Paper #339, presented at the 200th ECS Meeting in San Francisco,CA, Sep. 2, 2001.
5. J. St-Pierre, in Polymer electrolyte fuel cell durability F. Buchi, M. Inaba, andT. J. Schmidt, Editors, p. 289, Springer, New York (2009).
6. H. Li, J. Gazzarri, K. Tsay, S. Wu, H. Wang, J. Zhang, S. Wessel, R. Abouatallah,N. Joos, and J. Schrooten, Electrochim. Acta 55, 5823 (2010).
7. M. Sulek, J. Adams, S. Kaberline, M. Ricketts, and J. R. Waldecker, J. Power Sources196, 8967 (2011).
8. Y. Garsany, O. A. Baturina, and K. E. Swider-Lyonsa, J. Electrochem. Soc. 154, B670(2007).
9. R. Mohtadi, W-k. Lee, and J. W. Van Zee, J. Power Sources 138, 216 (2004).10. T. Gu, W-k. Lee, and J. W. Van Zee, Appl. Catal. B-Environ. 56, 43 (2005).11. R. Mohtadi, W-k. Lee, S. Cowan, J. W. Van Zee, and M. Murthy, Electrochem.
Solid-State Lett. 6, A272 (2003).12. J. Z. Tan, Y. J. Chao, J. W. Van Zee, and W-k. Lee, Mater. Sci. and Eng. A 445, 669
(2007).13. T. Okada, J. Electroanal. Chem. 465, 18 (1999).14. K. Hongsirikarn and J. G. Goodwin Jr., S. Greenway and S. Creager, J. Power Sources
195, 7213 (2010).15. M. J. Kelly, G. Fafilek, J. O. Besenhard, H. Kronberger, and G. E. Nauer, J. Power
Sources 145, 249 (2005).16. M. J. Kelly, B. Egger, G. Fafilek, J. O. Besenhard, H. Kronberger, and G. E. Nauer,
Solid State Ionics 176, 2111 (2005).17. M. Ohashi, Ph.D. dissertation, Department of Chemical Engineering, University of
South Carolina 2009.18. H. Li, J. Gazzarri, K. Tsay, S. Wu, H. Wang, J. Zhang, S. Wessel, R. Abouatallah,
N. Joos, and J. Schrooten, Electrochim. Acta 55, 5823 (2010).19. T. Okada, J. Dale, Y. Ayato, O. A. Asbjørnsen, M. Yuasa, and I. Sekine, Langmuir
15, 8490 (1999).20. T. Okada, H. Satou, and M. Yuasa, Langmuir 19, 2325 (2003).21. T. Okada, Y. Ayato, H. Satou, M. Yuasa, and I. Sekine, J. Phys. Chem. B 105, 6980
(2001).22. T. Okada, Y. Ayato, J. Dale, M. Yuasa, I. Sekine, and O. A. Asbjørnsen, Phys. Chem.
Chem. Phys. 2, 3255 (2000).23. T. Okada, N. Arimura, H. Satou, M. Yuasa, and T. Kikuchi, Electrochim. Acta 50,
3569 (2005).24. T. Okada, S. Moller-Holst, O. Gorseth, and S. Kjelstrup, J. Electroanal. Chem. 442,
137 (1998).25. K. Honsirikarn, X. Mo, and J. G. Goodwin Jr., J. Power Sources 195, 3416 (2010).26. M. Jung, Ph. D. dissertation, Department of Chemical Engineering, University of
South Carolina, 2010.27. R. Halseid, P. J. S. Vie, and R. Tunold, J. Electrochem. Soc. 151, A381 (2004).28. T. A. Zawodzinski Jr., C Derouin, S. Radzinski, R. J. Sherman, V. T. Smith,
T. E. Springer, and S. Gottesfeld, J. Electrochem. Soc. 140, 1041 (1993).29. F. A. Uribe, S. Gottesfeld, and T. A. Zaodzinski Jr., J. Electrochem. Soc. 149, A293
(2002).30. X. Zhang, U. Pasaogullari, and T. Molter, Int. J. Hydrogen Energy 34, 9188 (2009).31. H-S. Cho, M. Jung, J. Navarro, M. Ohashi, and J. W. Van Zee, ECS Trans., 33(1),
1627 (2010).32. H. Wang, C. S. Macomber, J. Christ, G. Bender, B. Pivovar, and H. N. Dinh, Elec-
trocatalysis 5, 62 (2014).33. P. T. Yu, E. A. Bonn, and B. Lakshmanan, ECS Trans., 58(1), 665 (2013).34. J. M. Christ, K. C. Neyelin, H. Wang, R. Richards, and H. N. Dinh, ECS Trans., 50(2)
691, (2013).35. H-S. Cho, Ph.D. dissertation, Department of chemical engineering, University of
South Carolina (2013).36. http://www.hydrogen.energy.gov/pdfs/2011_budget_request_briefing.pdf.37. http://www.hydrogen.energy.gov/pdfs/progress14/v_f_1_dinh_2014.pdf.38. K. O’Leary and B. Lakshaman, “Methods for Screening Balance of Plant (BOP)
Materials for Fuel Cell Contamination,” Paper #1036, presented at the 220th ECSMeeting & Electrochemical Energy Summit in Boston, MA, Oct. 13, 2011.
39. C. Macomber, H. Wang, K. O’Neill, S. Coombs, G. Bender, B. Pivovar, andH. N. Dinh, ECS Trans. 33(1), 1637 (2010).
40. C. S. Macomber, J. Christ, H. Wang, B. S. Pivovar, and H. N. Dinh, ECS Trans. 50(2),603, (2013).
41. H-S. Cho, M. Ohashi, and J. W. Van Zee, ECS Trans., 41(1), 1487 (2011).42. B. C. Challis and J. Challis, The Chemistry of Amides J. Zabicky, Editor, p.748
Interscience, New York, (1970).43. C. J. O’Connor, Q. Rev. Chem. Soc. 24, 553 (1970).44. H. K. Reimschuessel, in Ring-Opening Polymerization, T. Saegusa and E. Goethals,
Editors, 59, p. 233, ACS symposium series, American chemical society, Washington,DC (1977).
45. M. Liler, in Reaction Mechanisms in Sulfuric Acid, p.189, Academic Press, London(1971).
46. G. B. Deacon, F. Huber, and R. J. Phillips, Inorg. Chim. Acta 104, 41 (1985).47. T. Xue, R. B. Longwell, and K. Osseo-Asare, J. Mem. Sci. 58, 175 (1991).48. D. C. Harris, Quantitative Chemical Analysis, W. H. Freeman and Company, New
York (2003).49. Friedrich Helfferich, Ion Exchange, p 157, Dover publication Inc, New York (1995).50. R. Buzzoni, S. Bordiga, G. Ricchiardi, G. Spoto, and A. Zecchina, J. Phys. Chem.
99, 11937 (1995).51. A. Gruger, A. Regis, T. Schmatko, and P. Colomban, Vib. Spectrosc. 26, 215 (2001).52. K. A. Mauritz and R. B. Moore, Chemical reviews 104, 4535 (2004).53. Y. Wang, Y. Kawano, S. R. Aubuchon, and R. A. Palmer, Macromolecuels 36, 1138
(2003).54. G. Socrates, Infrared and Raman Characteristic Group Frequencies: Tables and
Charts, 3rd edition, John Wiley & Sons, Ltd., (2004).55. W. Paik, S. Han, W. Shin, and Y. Kim, Langmuir 19, 4211 (2003).56. T. E. Springer, T. A. Zawodzinski, and S. Gottesfeld, J. Electrochem. Soc. 138, 2334
(1991).57. J. T. Hinatsu, M. Mizuhata, and H. Takenaka, J. Electrochem. Soc. 141, 1493
(1994).