the connecticut economic digest · o2 the connecticut economic digest july 2010 connecticut ......
TRANSCRIPT

THE CONNECTICUT
ECONOMIC DIGESTJULY 2010
July 2010
Economic Indicators of Employment ........................................ 4 on the Overall Economy ......................... 5 Individual Data Items ......................... 6-8Comparative Regional Data .............. 9Economic Indicator Trends ....... 10-11Business & Economic News .......... 15Business and Employment ChangesAnnounced in the News Media ...... 19Labor Market Areas: Nonfarm Employment .................... 12-17 Sea. Adj. Nonfarm Employment ..........14 Labor Force ............................................ 18 Hours and Earnings .............................. 19Cities and Towns: Labor Force ...................................... 20-21 Housing Permits .................................... 22Technical Notes ............................... 23At a Glance ....................................... 24
State’s Housing TroublesContinued in 2009 ........... 1-2, 5
CT Personal Income PullsThrough in First Quarter ....... 3
IN THIS ISSUE...
In May...Nonfarm Employment Connecticut..................... 1,622,800 Change over month ........... +0.32% Change over year ................. -0.5%
United States .............. 130,570,000 Change over month ........... +0.33% Change over year ................. -0.4%
Unemployment Rate Connecticut............................. 8.9% United States .......................... 9.7%
Consumer Price Index United States ......................... 218.2 Change over year .................... 2.0%
Vol.15 No.7 A joint publication of the Connecticut Department of Labor & the Connecticut Department of Economic and Community Development
By Kolie Sun, Senior Research Analyst, DECD
State’State’State’State’State’s Housing Ts Housing Ts Housing Ts Housing Ts Housing TrrrrroublesoublesoublesoublesoublesContinued in 2009Continued in 2009Continued in 2009Continued in 2009Continued in 2009
T he Connecticut and U.S.economies experienced
financial turmoil that began in thefall of 2008 and continued into theGreat Recession of 2009. Nearly allsectors felt the adverse impacts ofthe recession, which resulted inhigher unemployment, decliningpersonal income and corporaterevenues and weakened consumerconfidence. The housing sector is amajor contributor to the economicturmoil in 2009, as this analysis ofthe state’s residential permit activi-ties, home prices and foreclosureswill clearly show.
Housing Production According to 2009 revisedhousing permit data from theCensus Bureau, Connecticut mu-nicipalities authorized 3,786 newsingle and multi-family housingunits, the lowest level of authoriza-tion in several decades. This repre-sents a 27.5 percent decline incomparison to the 5,220 unitsauthorized in 2008 and 68.1 percentdecline from 11,885 units in 2005.
In 2009, Norwalk led all municipali-ties with 448 units, followed byDanbury with 259 units and Norwichwith 181 units. In contrast,Bridgewater, North Haven andRoxbury did not register any newresidential permits. At the countylevel, Fairfield and Hartford countiescombined accounted for more thanhalf (53.1 percent) of the totalhousing units permitted in 2009 (Seechart below). Multi-family units comprisednearly 32 percent of housing unitspermitted in 2009. Both Fairfield andNew London counties had a higherconcentration (55 percent and 36percent) of multi-family dwellingunits authorized than the state level.Litchfield and Windham countiesauthorized no multi-family housingunits in 2009. Based on the responses to theDepartment of Economic and Com-munity Development (DECD) annualdemolition survey for all towns andcities, to which 87 percent of themunicipalities responded (or 147towns), 1,219 demolition permits
CT Housing Units Authorized, 1960 - 2009
0
5,000
10,000
15,000
20,000
25,000
30,000
1960 1970 1980 1990 2000

THE CONNECTICUT ECONOMIC DIGEST2 July 2010
ConnecticutDepartment of Labor
Connecticut Departmentof Economic andCommunity Development
THE CONNECTICUT
The Connecticut Economic Digest ispublished monthly by the ConnecticutDepartment of Labor, Office of Research andthe Connecticut Department of Economic andCommunity Development. Its purpose is toregularly provide users with a comprehensivesource for the most current, up-to-date dataavailable on the workforce and economy of thestate, within perspectives of the region andnation.
The annual subscription is $50. Sendsubscription requests to: The ConnecticutEconomic Digest, Connecticut Department ofLabor, Office of Research, 200 Folly BrookBoulevard, Wethersfield, CT 06109-1114.Make checks payable to the ConnecticutDepartment of Labor. Back issues are $4 percopy. The Digest can be accessed free ofcharge from the DOL Web site. Articles fromThe Connecticut Economic Digest may bereprinted if the source is credited. Please sendcopies of the reprinted material to the ManagingEditor. The views expressed by the authorsare theirs alone and may not reflect those ofthe DOL or DECD.
Managing Editor: Jungmin Charles Joo
We would like to acknowledge the contributionsof many DOL Research and DECD staff andRob Damroth (CCT) to the publication of theDigest.
Joan McDonald, CommissionerRonald Angelo, Deputy Commissioner
Stan McMillen, Ph.D., Managing Economist505 Hudson StreetHartford, CT 06106-2502Phone: (860) 270-8000Fax: (860) 270-8200E-Mail: [email protected]: http://www.decd.org
Linda L. Agnew, Acting Commissioner
Andrew Condon, Ph.D., DirectorOffice of Research200 Folly Brook BoulevardWethersfield, CT 06109-1114Phone: (860) 263-6275Fax: (860) 263-6263E-Mail: [email protected]: http://www.ctdol.state.ct.us/lmi
ECONOMIC DIGEST
--Continued on page 5--
were issued in 2009. As a result, thenet gain (that is permits less demoli-tions) of 2,567 authorizations bringthe state’s housing stock estimate to1,452,007 units in 2009 if authoriza-tions materialized into production. Overall, the U.S. experienced a35.6 percent permit decline in 2009from 2008. New York State experi-enced the largest percentage de-crease of permit activity, followed byNevada and Illinois with 64.5 per-cent, 54.5 percent, and 51.8 percentrespectively. Two states, Alaska andNorth Dakota, posted gains of 1.7percent and 12.8 percent. Connecti-cut fared better than the nation interms of permit decline and ranked24th in the country according to theCensus Bureau.
Home Sales and Prices The U.S. housing slump thatcontinued into 2009 resulted infewer sales and lower prices. Thereare mixed signals in the marketreflecting the near term future ofhome sales. The first-timehomebuyer tax credit incentiveprogram and historically low mort-gage rates triggered more homepurchases, thereby preventing thereal estate market from contractingfurther. However, the federalgovernment has cut back on itssupport of the mortgage market andFreddie Mac and Fannie Mae aresupposed to pick up the slack. Alarge number of ARM resets on loanswritten in 2005 and 2006 will putfurther stress on certainhomeowners. The number of Connecticutsingle-family home sales has been onthe decline since 2005, according tothe Warren Group data. Between2007 and 2008, the housing marketexperienced a 23.0 percent decreasein home sales. There were 24,401single-family homes sold in 2009—a1.9 percent decline from 24,863single-family units sold in 2008.This suggests the housing marketmight be showing signs of a modestrebound. The median home sale price inConnecticut peaked at $295,000 in2007 and has declined since. TheConnecticut single-family medianhome sales price fell to $240,500 in2009, a 10.1 percent decrease from$267,500 in 2008. Housing Market Index (HMI)1published by National Association ofHome Builders (NAHB) also pointed
to how dire U.S. housing market wasin 2009. DECD averaged themonthly ratings to yearly numbersfrom the period of 1985 to 2009.The annual HMI rating of 15 is thelowest level since 1985. The Prudential ConnecticutRealty market report shows thehealth of the real estate industry isgauged by the “inventory supplytime.” That means, the relationshipbetween the number of homescurrently on the market and howlong it takes on average to sell thoseproperties. During a recession,properties remain longer on themarket. On average, single-familyhomes remained 136 days on themarket in 2009, five days longerthan in previous year. It took 16days longer for condominiums to sellin 2009 than in 2008.
Delinquencies and Foreclosures In 2009, as the economy wors-ened and unemployment rose, moreand more households were not ableto pay their monthly mortgages ontime. Many went into delinquencyand foreclosure. The 2009 report fromRealtyTrac.com showed that U.S.properties with filings2 increased ata significant 21.2 percent ratecompared to 2008, while one inevery 45 housing units received atleast one foreclosure filing duringthe period. Connecticut performedbetter than the nation with a 10.2percent decrease in the number ofproperties with filings from 2008 to2009, with one in 73 housing unitsfacing foreclosure. Although theConnecticut foreclosure rate showedsome improvement, it is 65 percenthigher than it was in 2007. Lis Pendens and ForeclosureDeed3 filings are the two mostcommon measures to track fore-closed homes. In Connecticut, thenumber of Lis Pendens increased67.8 percent from 14,629 in 2008 to24,544 in 2009. In absolute num-bers, New Haven County had themost properties subject to foreclo-sure (7,114). Following wereFairfield County at 6,984 andHartford County with 4,853. Fore-closure Deed filings trended upwardby 5.4 percent to 5,090 filings in2009 from 4,828 filings in 2008. According to the MortgageBankers Association’s NationalDelinquency Survey, more than 15

THE CONNECTICUT ECONOMIC DIGEST 3July 2010
By Lincoln S. Dyer, Economist and Matthew Krzyzek, CCT Economist, DOLCT Personal Income Pulls Through in First QuarterCT Personal Income Pulls Through in First QuarterCT Personal Income Pulls Through in First QuarterCT Personal Income Pulls Through in First QuarterCT Personal Income Pulls Through in First Quarter
C onnecticut personal incomegrowth at 0.6% trailed
national personal income growth of0.9% and New England incomegrowth of 0.8% in the first quarterof 2010. Personal income of$193.037 billion (current dollars,quarterly annualized rate) was thesecond consecutive quarterlyincrease, after increasing 0.3% inthe fourth quarter of 2009, accord-ing to the Bureau of EconomicAnalysis (BEA). Comparable andadjacent states like New York(0.9%), New Jersey (0.8%), Massa-chusetts (0.7%), Maryland (0.8%),Pennsylvania (0.8%) and RhodeIsland (0.9%) all experiencedslightly faster growth than Con-necticut during the first quarter.Connecticut ranked 44th by state,in the lowest quintile, in thisquarter’s personal income growth. From the same quarter a yearago, Connecticut total personalincome grew 1.6% (see chart), whilethe United States posted 1.9%growth and New England rose2.3%. This is an improvement forConnecticut compared to the 2.6%annual decline that was measuredin the fourth quarter of 2009.Annual personal income growthrates in the same correspondingstates were New York (4.3%), NewJersey (2.1%), Massachusetts(2.3%), Maryland (2.7%), Pennsyl-
vania (2.3%), and Rhode Island(3.2%). The inflation rate wasestimated at 2.4% over this sametime period. On the face of it, it appears theAmerican Recovery and Reinvest-ment Act (ARRA) transfer receiptsbolstered the first quarter’s per-sonal income in the state and thenation as a whole. In fact, thenation added $113.5 billion inpersonal income to transfer re-ceipts from ARRA, resulting in a0.1 percent stimulus contributionto U.S. personal income growth inthe first quarter. Consequently,transfer receipts grew $736 millionof Connecticut’s $1.242 billionpersonal income, outpacing thetwo other core components ofpersonal income growth, netearnings by place of work (+$597million), and dividends, interest,and rent, which had a decline of$91 million. Moreover, Connecticutpersonal income transfer receiptswere funded by ARRA at an annualrate of $1.457 billion. However,this ARRA funding for Connecticutwas down from the estimated$1.548 billion of ARRA annual ratefunding received in the fourthquarter of 2009. In effect, ARRAfunding had a zero contribution tothe state’s personal income gainsin the first quarter, according toBEA. Federal government stimulus
effects on the states, and Connecti-cut in particular, may be runningits course. Wage and salary disbursements(+$460 million) largely supportedthe net earnings by place of workcontribution (+$597 million) to thefirst quarter’s personal incomegrowth. This is a validating sign forthe start of a discernible employ-ment recovery in the state. Rightnow, Connecticut nonfarm employ-ment appears to have bottomed outin the fourth quarter of 2009. Thehealth care/social assistance andmanufacturing industry sectorsprovided the largest boost toearnings income from industry.Meanwhile the shrinking construc-tion and real estate sectors contin-ued to partially negate the recover-ing earnings observed in almost allother major industry sectors.Farming and utilities were excep-tions that saw slight declines thisquarter. The wildcard dividends,interest, and rent, a key componentof Connecticut personal income,declined $91 million. While noseparate breakout of this propertyincome component is available atthe state level, at the national levelit was noted that “declines individends offset rises in interestand rental income.” Connecticutconceivably experienced a similartrend from property income, onlymagnified because of larger stockmarket exposure. Despite the relatively softgrowth in Connecticut’s personalincome in the first quarter of 2010,Connecticut still likely leads allstates in overall per capita personalincome. For 2009, Connecticut’sper capita personal income was$54,397, a decline of 3.3% from2008. The last two quarters ofpersonal income growth indicate apotentially positive trend for Con-necticut in the ensuing quarters of2010. It is very encouraging thatpersonal income growth in Con-necticut materialized even with adiminishing stimulus contributionfrom the American Recovery andReinvestment Act.
Connecticut Personal Income: Year-Over-Year Quarterly Annualized Percent Change, 1Q 2000 to 1Q 2010 (Current Dollars)
-5%-4%-3%-2%-1%0%1%2%3%4%5%6%7%8%9%
10%
1Q2000
1Q2001
1Q2002
1Q2003
1Q2004
1Q2005
1Q2006
1Q2007
1Q2008
1Q2009
1Q2010
YOY Quarterly Annualized % Chg
4 per. Mov. Avg. (YOY QuarterlyAnnualized % Chg)

THE CONNECTICUT ECONOMIC DIGEST4 July 2010
EMPLOYMENT INDICATORS
The distance from peak to trough, indicated by the shaded areas, measures the duration of an employment cycle recession. The vertical scale in bothcharts is an index with 1992=100. Source: Connecticut Department of Economic and Community Development
National Recovery Fragile, Connecticut's Prospects Improve
By Stan McMillen, Ph.D. , Managing Economist, DECD, (860) 270-8166. Mark Prisloe, Associate Economist, DECD, provides researchassistance. Professors Pami Dua and Stephen M. Miller, in cooperation with Anirvan Banerji at the Economic Cycle Research Institutedeveloped the leading and coincident employment indexes. The views expressed herein are the author's own and do not necessarilyrepresent those of the Connecticut Department of Labor or the Connecticut Department of Economic and Community Development.Components of the indexes are described in the Technical Notes on page 23.
LEADING INDEX COINCIDENT INDEX
60
70
80
90
100
110
120
70 75 80 85 90 95 00 05 1070
80
90
100
110
120
130
70 75 80 85 90 95 00 05 10
Peak12/69
Trough10/71
Peak05/74
Trough11/75
Peak03/80
Trough01/83
Peak04/88
Trough02/92
Peak07/2000
Trough04/2003
The National Outlook Total nonfarm payroll employmentgrew by 431,000 in May, reflecting thehiring of 411,000 temporary employeesto work on Census 2010. Private sectoremployment changed little (+41,000).The unemployment rate declined to 9.7%in May. However, according to theBureau of Labor Statistics (BLS), thenumber of unemployed persons was15.0 million and its broader measure oflabor underutilization (U-6) for the U.S.,at 16.6%, was higher than it was in Maya year ago (15.9%). Moreover, thenumber of long-term unemployed(jobless for 27 or more weeks) personswas unchanged at 6.8 million making upalmost half (46.0%) of all unemployedpersons. Meanwhile, the Bureau ofEconomic Analysis revised downwardthe nation’s real gross domestic productthat had increased 5.6% in Q4 2009 from3.2% to 3.0% for Q1 2010. Sluggishretail sales and a faltering stock marketsuggest the national recovery is stillfragile and uneven.
Connecticut The DECD-ECRI Connecticutcoincident employment index is ameasure of contemporaneous activityand decreased from 103.7 in April 2009to 102.3 in April 2010. Total employment(from the household survey) declinedyear-over-year (YOY) in April by 6,808persons (-0.4%). Nonfarm employment(from the employer survey) declined by16,600 jobs (-1.0%) YOY. The totalunemployment rate rose to 9.0%compared to 8.0% a year ago. Each ofthese variables negatively influenced the
YOY change in this index. The 4.56%insured unemployment rate declined0.25 percentage point YOY in April,showing the first improvement since therecession began in March 2008 andhaving a positive impact on the YOYchange in this index. On a month-over-month (MOM)basis, the April 2010 coincident employ-ment index increased to 102.3 from102.1 in March. This index’s downwardmomentum or current 12-month movingaverage growth rate (-0.1%) was thesmallest since April 2008 and is apositive sign. Total employment de-creased in April by 200 persons (0.04%)slightly, reversing three consecutivemonthly gains. This contributed nega-tively to the MOM change in this index.However, the insured unemployment ratethat decreased from 4.59% in March to4.56% in April 2010, nonfarm employ-ment that increased by 500 jobs (0.03%)MOM, and the total unemployment ratethat decreased in April by 0.2 percentagepoint to 9.0% contributed positively to theMOM change in this index. The DECD-ECRI Connecticut leadingemployment index that estimates futureeconomic activity increased from 111.3 ayear ago to 115.9 in April 2010. Themanufacturing sector that lost 5,600 jobs(-3.2%) and construction that lost 3,600jobs (-6.7%) YOY had a negativeinfluence on the YOY change in thisindex. Both manufacturing averageweekly hours that increased from 38.2 ayear ago to 39.9 and constructionaverage weekly hours that increasedfrom 35.4 last April to 36.6 in April 2010had a positive influence on the index.
Other positive contributors were shortduration unemployment that decreasedfrom 2.55% to 2.38% YOY, Moody’s Baabond rate that improved from 8.14% ayear ago to 6.25% and initial claims thatdecreased by 20.3% to 23,401 in April2010. Housing permits that rose 0.7%from 318 units last April to 320 units inApril 2010 had a positive influence. TheHartford Help-Wanted Index wasunchanged from a year ago at 2 in April2010. On a month-over-month basis,Connecticut’s leading employment indexincreased from 115.0 in March 2010 to115.9 in April. Most components werepositive contributors to the MOM changein this index including Moody’s Baa bondrate that declined by 0.02 percentagepoint from 6.27% to 6.25%, averageweekly hours in construction that were upfrom 35.7 to 36.6, initial claims forunemployment insurance that decreasedfrom 27,356 to 23,401 (-14.5%), state-wide housing permits that rose from 297to 320, and a the short duration unem-ployment rate that decreased from 2.53%to 2.38%. Only average weekly hours inmanufacturing, at 39.9 and the help-wanted index at 2 on an MOM basiswere unchanged and had neutral effects. Despite the sluggish and fragilenational recovery, Connecticut’s pros-pects improved in April 2010. The firstpost-recession turnaround in the insuredunemployment rate, a component of thecoincident index, and the continuingimprovement of several components ofthe leading employment index signalpotential improvement.

THE CONNECTICUT ECONOMIC DIGEST 5July 2010
GENERAL ECONOMIC INDICATORS
Sources: *The Connecticut Economy, University of Connecticut **Farmington Bank ***Federal Reserve Bank of Philadelphia
The Connecticut Economy's General Drift Indicators are composite measures of the four-quarter change in three coincident (Connecticut Manufacturing ProductionIndex, nonfarm employment, and real personal income) and four leading (housing permits, manufacturing average weekly hours, Hartford help-wanted advertising, andinitial unemployment claims) economic variables, and are indexed so 1986 = 100.
The Farmington Bank Business Barometer is a measure of overall economic growth in the state of Connecticut that is derived from non-manufacturing employment, realdisposable personal income, and manufacturing production.
The Philadelphia Fed’s Coincident Index summarizes current economic condition by using four coincident variables: nonfarm payroll employment, average hoursworked in manufacturing, the unemployment rate, and wage and salary disbursements deflated by the consumer price index (U.S. city average).
--Continued from page 2--
1Q 1Q CHANGE 4Q(Seasonally adjusted) 2010 2009 NO. % 2009Employment Indexes (1992=100)* Leading 115.1 111.6 3.5 3.1 114.3 Coincident 102.0 105.6 -3.6 -3.4 102.0General Drift Indicator (1986=100)* Leading 104.2 100.5 3.7 3.7 103.5 Coincident 105.8 109.6 -3.8 -3.5 105.8Farmington Bank Business Barometer (1992=100)** 117.9 120.8 -2.9 -2.4 119.0
Philadelphia Fed's Coincident Index (July 1992=100)*** MAY MAY APR(Not seasonally adjusted) 2010 2009 2010 Connecticut 155.0 153.8 1.2 0.8 154.2 United States 158.6 157.7 0.9 0.6 157.7
percent of Connecticut subprimeloans were in some phase of foreclo-sure in 2009, five times higher thanin 2006, and at its highest level since1998. Nearly two percent of primeloan mortgage holders went intoforeclosure in 2009. This can beexplained by more people being outof work for a longer period of time,expiring unemployment benefits, andjobs that are few and difficult to find,causing hardship and delinquency inpayments.
Housing Affordability In addition to the trends andaspects of Connecticut’s privatesector housing market in 2009, thereare other dimensions to the overallstatewide housing picture, includinghousing affordability. The “Partnership for StrongCommunities” compiles data fromvarious sources, concerning statis-tics significant to affordable housingand homelessness, specific toConnecticut. The Partnership, anarm of the Melville Charitable Trust,“coordinates housing policy develop-ment and advocacy, convenes electedofficials, community leaders, busi-ness executives and others toadvance solutions to homelessness,affordable housing, and the creationof vibrant neighborhoods.” ThePartnership promotes affordablerentals, shapes housing legislation,
and educates about housing prob-lems and solutions.4
The Partnership defines “afford-able” housing as units that cost nomore than 30-40 percent of house-hold income. The “housing wage” isthe amount a person must earnworking fulltime to be able to affordfair market rent on a two-bedroomunit without paying more than 30percent on rent. In 2009, Connecti-cut statewide “housing wage” was$21.60 while the estimated meanrenter wage was $17.58. Thestatewide two-bedroom housingwage was 123 percent of that of atypical renter’s wage.
Conclusion The performance of the 2009Connecticut housing market will godown in history as one of the worstin decades. A significant anddramatic decline in permit activity, acontinued fall in home sales, consid-erably lower median home salesprices, with ongoing mortgagedelinquencies and increasingforeclosures characterized anunfortunate state of affairs in lastyear’s housing market. Tax incen-tives undoubtedly helped preventfurther deterioration of the market. Looking forward, there are fewreasons to believe in a robustrecovery in the housing market. Aslow-down in the rate of housing
sales declines and mortgage foreclo-sures, as well as the extension of thehome buyer tax credit into 2010 areamong the few signs that this year’smarket may see some improvement.
______________________1 HMI is a weighted, seasonally adjusted statisticderived from ratings for present single family sales,single family sales in the next six months, andbuyers traffic. The HMI is published by the NationalAssociation of Home Builders (NAHB) and is basedon a monthly survey sent to NAHB members, whoare asked to rate general economic and housingmarket conditions. The first two components aremeasured on a scale of “good,” “fair,” and “poor,”and the last one on a scale of “high,” “average,” and“low.” A rating of 50 indicates that the number ofpositive, or good, responses received from thebuilders is about the same as the number ofnegative, or poor, responses. Ratings higher than50 indicate more positive, or good, responses.
2 RealtyTrac’s report incorporates documents filed inall three phases of foreclosure: Default — Notice ofDefault (NOD) and Lis Pendens (LIS); Auction —Notice of Trustee Sale and Notice of ForeclosureSale (NTS and NFS); and Real Estate Owned, orREO properties (that have been foreclosed on andrepurchased by a bank). If more than oneforeclosure document is received for a propertyduring the year, only the most recent filing iscounted in the report.
3 Lis Pendens filings indicate a pending actionagainst the property owner. It is not a guarantee ofpre-foreclosure activity. Foreclosure Deeds filingdefines as the deeds transfer title to the lender afterthe mortgage is foreclosed. The Warren Group©captures two types of foreclosure deeds – StrictForeclosures and Committee Deeds
4 Partnership for Strong Communities, “Housing andHomelessness: The Facts,” Updated March 5, 2010.http://www.lyceumcenter.org/images/stories/Reports/housing_and_homelessness_facts.pdf

THE CONNECTICUT ECONOMIC DIGEST6 July 2010
EMPLOYMENT BY INDUSTRY SECTOR
INCOME
Initial claims for unem-ployment insurance fell
from a year ago.
UNEMPLOYMENT
The production workerweekly earnings rose
over the year.
MANUFACTURING ACTIVITY
ECONOMIC INDICATORSTotal nonfarm
employment decreasedover the year.
Personal income for thirdquarter 2010 is
forecasted to increase 1.7percent from a year
earlier.
Source: Connecticut Department of Labor * Includes Native American tribal government employment
Sources: Connecticut Department of Labor; U.S. Bureau of Labor Statistics
Sources: Connecticut Department of Labor; U.S. Department of Energy*Latest two months are forecasted.
Source: Bureau of Economic Analysis: March 2010 release*Forecasted by Connecticut Department of Labor
(Seasonally adjusted) 3Q* 3Q CHANGE 2Q*(Annualized; $ Millions) 2010 2009 NO. % 2010Personal Income $194,534 $191,318 3,216 1.7 $192,802UI Covered Wages $92,498 $92,016 482 0.5 $91,567
MAY MAY CHANGE APR MAR(Not seasonally adjusted) 2010 2009 NO. % 2010 2010Average Weekly Hours 41.5 40.3 1.2 3.0 41.4 --Average Hourly Earnings 23.47 23.01 0.46 2.0 23.20 --Average Weekly Earnings 974.01 927.30 46.71 5.0 960.48 --CT Mfg. Production Index (2000=100) 92.8 102.2 -9.5 -9.3 88.3 91.8 Production Worker Hours (000s) 4,183 4,149 34 0.8 4,173 -- Industrial Electricity Sales (mil kWh)* 307 363 -56.1 -15.5 287 304
MAY MAY CHANGE APR(Seasonally adjusted; 000s) 2010 2009 NO. % 2010TOTAL NONFARM 1,622.8 1,630.8 -8.0 -0.5 1,617.6 Natural Res & Mining (NSA) 0.7 0.7 0.0 0.0 0.6 Construction 50.9 54.7 -3.8 -6.9 52.2 Manufacturing 168.2 172.7 -4.5 -2.6 168.0 Trade, Transportation & Utilities 288.3 294.2 -5.9 -2.0 288.5 Information 33.8 35.1 -1.3 -3.7 34.1 Financial Activities 133.4 137.9 -4.5 -3.3 134.4 Professional and Business Services 187.5 188.7 -1.2 -0.6 184.7 Educational and Health Services 308.1 301.2 6.9 2.3 306.0 Leisure and Hospitality Services 140.3 134.3 6.0 4.5 142.9 Other Services 59.7 61.2 -1.5 -2.5 60.1 Government* 251.9 250.1 1.8 0.7 246.1
STATE
MAY MAY CHANGE APR(Seasonally adjusted) 2010 2009 NO. % 2010Unemployment Rate, resident (%) 8.9 8.2 0.7 --- 9.0Labor Force, resident (000s) 1,897.2 1,892.0 5.2 0.3 1,903.9 Employed (000s) 1,728.1 1,736.9 -8.8 -0.5 1,732.4 Unemployed (000s) 169.1 155.2 13.9 9.0 171.5Average Weekly Initial Claims 5,448 6,949 -1,502 -21.6 5,333Avg. Insured Unemp. Rate (%) 4.45 5.36 -0.91 --- 4.37
2Q09-1Q10 2Q08-1Q09 3Q08-2Q09U-6 Unemployment Rate (%) 15.0 11.3 3.7 --- 12.4

THE CONNECTICUT ECONOMIC DIGEST 7July 2010
TOURISM AND TRAVEL
ECONOMIC INDICATORSBUSINESS ACTIVITY New auto registrations
increased over the year.
Gaming slots fell over theyear.
BUSINESS STARTS AND TERMINATIONS Net business formation, asmeasured by starts minusstops registered with theDepartment of Labor, wasdown over the year.
Total revenues were up from ayear ago.
STATE REVENUES
Sources: Connecticut Department of Economic and Community Development; U.S. Department of Energy,Energy Information Administration; Connecticut Department of Revenue Services; F.W. Dodge;Connecticut Department of Motor Vehicles; Connecticut Department of Transportation, Bureau ofAviation and Ports
* Estimated by the Bureau of the Census
Sources: Connecticut Secretary of the State; Connecticut Department of Labor* Revised methodology applied back to 1996; 3-months total
MAY MAY % % (Millions of dollars) 2010 2009 CHG CURRENT PRIOR CHGTOTAL ALL REVENUES* 623.7 600.0 4.0 5,815.9 5,523.8 5.3 Corporate Tax 16.4 16.7 -1.8 268.1 245.8 9.1 Personal Income Tax 335.4 318.4 5.3 3,355.8 3,182.4 5.4 Real Estate Conv. Tax 8.5 5.3 60.4 34.1 27.8 22.7 Sales & Use Tax 157.5 166.5 -5.4 1,217.6 1,240.3 -1.8 Indian Gaming Payments** 31.4 33.0 -4.9 149.6 154.3 -3.1
YEAR TO DATE
Sources: Connecticut Department of Revenue Services; Division of Special Revenue*Includes all sources of revenue; Only selected sources are displayed; Most July receipts arecredited to the prior fiscal year and are not shown. **See page 23 for explanation.
Sources: Connecticut Department of Transportation, Bureau of Aviation and Ports; ConnecticutCommission on Culture and Tourism; Division of Special Revenue
*See page 23 for explanation **The Connecticut Economy, University of Connecticut***Due to state budget cuts CT Info Centers suspended some services causing a drop in visitors.
Y/Y % YEAR TO DATE % MONTH LEVEL CHG CURRENT PRIOR CHG
Info Center Visitors*** MAY 2010 30,250 -11.1 96,088 114,474 -16.1Major Attraction Visitors MAY 2010 150,712 2.7 497,362 562,581 -11.6Air Passenger Count MAY 2010 NA NA NA NA NAIndian Gaming Slots (Mil.$)* MAY 2010 1,493 -6.5 7,041 7,216 -2.4Travel and Tourism Index** 1Q 2010 --- -6.7 --- --- ---
Y/Y % %MO/QTR LEVEL CHG CURRENT PRIOR CHG
STARTS Secretary of the State MAY 2010 NA NA NA NA NA Department of Labor* 4Q2009 1,126 -18.3 6,150 7,596 -19.0TERMINATIONS Secretary of the State MAY 2010 NA NA NA NA NA Department of Labor* 4Q2009 2,080 -31.5 7,005 8,596 -18.5
YEAR TO DATE
STATE
Y/Y % YEAR TO DATE % MONTH LEVEL CHG CURRENT PRIOR CHG
New Housing Permits* MAY 2010 256 8.0 1,694 1,092 55.1Electricity Sales (mil kWh) MAR 2010 2,444 -1.9 7,768 7,974 -2.6Construction Contracts Index (1980=100) MAY 2010 370.8 -2.9 --- --- ---New Auto Registrations MAY 2010 12,688 12.9 57,978 54,976 5.5Air Cargo Tons MAY 2010 NA NA NA NA NAExports (Bil. $) 1Q 2010 3.71 4.7 3.71 3.54 4.7S&P 500: Monthly Close MAY 2010 1,089.41 18.5 --- --- ---

THE CONNECTICUT ECONOMIC DIGEST8 July 2010
CONSUMER NEWS
EMPLOYMENT COST INDEXCompensation cost for thenation rose 1.6 percent
over the year.
Conventional mortgagefell to 4.89 percent over
the month.
INTEREST RATES
ECONOMIC INDICATORS
U.S. inflation rateincreased 2.0 percent
over the year.
Source: U.S. Department of Labor, Bureau of Labor Statistics
Sources: U.S. Department of Labor, Bureau of Labor Statistics; The Conference Board*Change over prior monthly or quarterly period**The Boston CPI can be used as a proxy for New England and is measured every other month.
Sources: Federal Reserve; Federal Home Loan Mortgage Corp.
MAY APR MAY(Percent) 2010 2010 2009Prime 3.25 3.25 3.25Federal Funds 0.20 0.20 0.183 Month Treasury Bill 0.16 0.16 0.186 Month Treasury Bill 0.22 0.24 0.301 Year Treasury Note 0.37 0.45 0.503 Year Treasury Note 1.32 1.64 1.395 Year Treasury Note 2.18 2.58 2.137 Year Treasury Note 2.86 3.28 2.8110 Year Treasury Note 3.42 3.85 3.2920 Year Treasury Note 4.11 4.53 4.22Conventional Mortgage 4.89 5.10 4.86
Seasonally Adjusted Not Seasonally AdjustedPrivate Industry Workers MAR DEC 3-Mo MAR MAR 12-Mo(Dec. 2005 = 100) 2010 2009 % Chg 2010 2009 % ChgUNITED STATES TOTAL 111.1 110.4 0.6 111.1 109.3 1.6 Wages and Salaries 111.4 111.0 0.4 111.4 109.8 1.5 Benefit Costs 110.4 108.9 1.4 110.4 108.2 2.0
NORTHEAST TOTAL --- --- --- 111.8 109.8 1.8 Wages and Salaries --- --- --- 111.7 109.9 1.6
STATE
(Not seasonally adjusted) MO/QTR LEVEL Y/Y P/P*CONSUMER PRICES CPI-U (1982-84=100) U.S. City Average MAY 2010 218.2 2.0 0.1 Purchasing Power of $ (1982-84=$1.00) MAY 2010 $0.458 -2.0 -0.1 Northeast Region MAY 2010 234.1 2.6 0.2 NY-Northern NJ-Long Island MAY 2010 241.1 2.2 0.2 Boston-Brockton-Nashua** MAY 2010 238.1 2.7 0.0 CPI-W (1982-84=100) U.S. City Average MAY 2010 214.1 2.5 0.0
% CHANGE

THE CONNECTICUT ECONOMIC DIGEST 9July 2010
UNEMPLOYMENT RATES
LABOR FORCE
NONFARM EMPLOYMENT
Three states showed adecrease in its unem-ployment rate over theyear.
Three states in theregion gained jobs overthe year.
Six of nine states postedincreases in the laborforce from last year.
COMPARATIVE REGIONAL DATA
Source: U.S. Department of Labor, Bureau of Labor Statistics
Source: U.S. Department of Labor, Bureau of Labor Statistics
Source: U.S. Department of Labor, Bureau of Labor Statistics
MAY MAY CHANGE APR(Seasonally adjusted; 000s) 2010 2009 NO. % 2010Connecticut 1,622.8 1,630.8 -8.0 -0.5 1,617.6Maine 589.9 598.2 -8.3 -1.4 585.9Massachusetts 3,182.4 3,180.2 2.2 0.1 3,166.6New Hampshire 628.8 625.8 3.0 0.5 625.7New Jersey 3,867.3 3,900.6 -33.3 -0.9 3,859.7New York 8,557.8 8,573.5 -15.7 -0.2 8,536.8Pennsylvania 5,625.9 5,620.2 5.7 0.1 5,606.4Rhode Island 451.8 460.6 -8.8 -1.9 448.6Vermont 293.3 297.6 -4.3 -1.4 293.3United States 130,570.0 131,155.0 -585.0 -0.4 130,139.0
MAY MAY CHANGE APR(Seasonally adjusted; 000s) 2010 2009 NO. % 2010Connecticut 1,897.2 1,892.0 5.2 0.3 1,903.9Maine 702.5 703.9 -1.4 -0.2 705.0Massachusetts 3,486.4 3,475.0 11.4 0.3 3,488.2New Hampshire 744.7 742.6 2.1 0.3 747.3New Jersey 4,568.1 4,546.5 21.6 0.5 4,571.0New York 9,693.8 9,729.5 -35.7 -0.4 9,681.0Pennsylvania 6,463.2 6,419.2 44.0 0.7 6,471.0Rhode Island 579.0 563.6 15.4 2.7 579.3Vermont 360.9 360.9 0.0 0.0 362.1United States 154,393.0 154,956.0 -563.0 -0.4 154,715.0
MAY MAY APR(Seasonally adjusted) 2010 2009 CHANGE 2010Connecticut 8.9 8.2 0.7 9.0Maine 8.0 8.2 -0.2 8.1Massachusetts 9.2 8.2 1.0 9.2New Hampshire 6.4 6.3 0.1 6.7New Jersey 9.7 9.2 0.5 9.8New York 8.3 8.4 -0.1 8.4Pennsylvania 9.1 8.0 1.1 9.0Rhode Island 12.3 10.7 1.6 12.5Vermont 6.2 7.3 -1.1 6.4United States 9.7 9.4 0.3 9.9
STATE

THE CONNECTICUT ECONOMIC DIGEST10 July 2010
ECONOMIC INDICATOR TRENDSSTATE
NONFARM EMPLOYMENT (Seasonally adjusted) Month 2008 2009 2010
Jan 1,709.7 1,662.9 1,611.3
Feb 1,709.3 1,655.6 1,611.5
Mar 1,711.5 1,645.1 1,614.0
Apr 1,709.5 1,631.1 1,617.6May 1,709.1 1,630.8 1,622.8
Jun 1,706.1 1,623.2
Jul 1,699.8 1,618.6
Aug 1,698.7 1,615.0
Sep 1,693.8 1,613.6
Oct 1,688.2 1,617.2
Nov 1,680.9 1,610.7
Dec 1,671.8 1,608.1
UNEMPLOYMENT RATE (Seasonally adjusted) Month 2008 2009 2010
Jan 4.9 7.1 9.0
Feb 4.9 7.4 9.1
Mar 5.0 7.7 9.2
Apr 5.1 8.0 9.0
May 5.3 8.2 8.9
Jun 5.5 8.4
Jul 5.6 8.5
Aug 5.8 8.6
Sep 6.0 8.6
Oct 6.1 8.7
Nov 6.4 8.7
Dec 6.7 8.8
LABOR FORCE (Seasonally adjusted) Month 2008 2009 2010
Jan 1,861.7 1,882.9 1,897.3
Feb 1,862.5 1,885.4 1,905.6
Mar 1,863.1 1,888.1 1,907.8
Apr 1,864.2 1,890.5 1,903.9
May 1,865.9 1,892.0 1,897.2
Jun 1,868.3 1,892.8
Jul 1,871.0 1,892.8
Aug 1,873.6 1,892.4
Sep 1,875.9 1,891.9
Oct 1,877.7 1,891.4
Nov 1,879.2 1,890.9
Dec 1,880.8 1,890.3
AVERAGE WEEKLY INITIAL CLAIMS (Seasonally adjusted) Month 2008 2009 2010
Jan 4,149 6,538 5,611
Feb 4,219 6,858 5,460
Mar 4,291 7,510 6,154
Apr 4,323 6,750 5,333
May 4,613 6,949 5,448
Jun 4,772 6,706
Jul 4,678 6,626
Aug 5,954 6,679
Sep 5,719 6,444
Oct 5,849 5,988
Nov 6,139 5,635
Dec 5,506 5,006
1.0
3.0
5.0
7.0
9.0
11.0
96 97 98 99 00 01 02 03 04 05 06 07 08 09 10
Per
cent
1,500
1,540
1,580
1,620
1,660
1,700
1,740
96 97 98 99 00 01 02 03 04 05 06 07 08 09 10
Tho
usan
ds
2,000
3,000
4,000
5,000
6,000
7,000
8,000
96 97 98 99 00 01 02 03 04 05 06 07 08 09 10
1,700
1,740
1,780
1,820
1,860
1,900
1,940
96 97 98 99 00 01 02 03 04 05 06 07 08 09 10
Tho
usan
ds

THE CONNECTICUT ECONOMIC DIGEST 11July 2010
ECONOMIC INDICATOR TRENDS STATE
REAL AVG MANUFACTURING HOURLY EARNINGS (Not seasonally adjusted)* Month 2008 2009 2010
Jan $10.24 $10.76 $10.88
Feb $10.18 $10.70 $10.93
Mar $10.11 $10.95 $10.80
Apr $10.01 $11.08 $10.84May $9.85 $11.02 $10.96
Jun $9.87 $10.98
Jul $9.96 $11.08
Aug $10.03 $11.20
Sep $10.10 $11.06
Oct $10.27 $10.96
Nov $10.51 $11.05
Dec $10.72 $11.09
AVG MANUFACTURING WEEKLY HOURS (Not seasonally adjusted) Month 2008 2009 2010
Jan 42.4 41.9 41.4
Feb 42.2 41.3 41.0
Mar 42.6 41.3 41.6
Apr 42.5 39.5 41.4
May 42.6 40.3 41.5
Jun 42.6 40.6
Jul 42.4 40.6
Aug 42.4 40.5
Sep 42.7 40.8
Oct 42.3 40.8
Nov 41.9 41.3
Dec 41.7 41.3
CT MANUFACTURING PRODUCTION INDEX (Not seasonally adjusted) Month 2008 2009 2010
Jan 94.5 96.3 88.8
Feb 115.9 91.5 87.1
Mar 117.2 88.8 91.8
Apr 116.4 94.7 88.3
May 110.1 102.2 92.8
Jun 114.5 93.0
Jul 112.9 111.2
Aug 125.8 95.1
Sep 128.3 93.7
Oct 120.7 91.5
Nov 102.9 87.2
Dec 91.0 87.9
SECRETARY OF STATE'S NET BUSINESS STARTS (12-mo.mov.avg) Month 2008 2009 2010
Jan 1,625 1,168 1,041
Feb 1,607 1,122 1,050
Mar 1,605 1,086 1,043
Apr 1,556 1,035
May 1,512 1,005
Jun 1,472 985
Jul 1,444 973
Aug 1,412 968
Sep 1,384 966
Oct 1,366 973
Nov 1,292 1,009
Dec 1,228 1,028
38
39
40
41
42
43
44
96 97 98 99 00 01 02 03 04 05 06 07 08 09 10
8.0
8.5
9.0
9.5
10.0
10.5
11.0
11.5
96 97 98 99 00 01 02 03 04 05 06 07 08 09 10
1982
-84
Dol
lars
80
90
100
110
120
130
140
150
97 98 99 00 01 02 03 04 05 06 07 08 09 10
2000
=10
0
500
700
900
1,100
1,300
1,500
1,700
1,900
96 97 98 99 00 01 02 03 04 05 06 07 08 09 10

THE CONNECTICUT ECONOMIC DIGEST12 July 2010
Not Seasonally Adjusted
MAY MAY CHANGE APR2010 2009 NO. % 2010
TOTAL NONFARM EMPLOYMENT…………… 1,631,700 1,639,400 -7,700 -0.5 1,615,200TOTAL PRIVATE………………………………… 1,375,800 1,384,500 -8,700 -0.6 1,364,500 GOODS PRODUCING INDUSTRIES………… 219,700 228,500 -8,800 -3.9 218,100 CONSTRUCTION, NAT. RES. & MINING.…… 52,000 56,200 -4,200 -7.5 50,700 MANUFACTURING…………………………… 167,700 172,300 -4,600 -2.7 167,400 Durable Goods………………………………… 129,300 132,900 -3,600 -2.7 128,700 Fabricated Metal……………………………… 28,300 29,600 -1,300 -4.4 28,400 Machinery…………………………………… 15,500 16,300 -800 -4.9 15,400 Computer and Electronic Product………… 12,900 13,400 -500 -3.7 13,000 Transportation Equipment . . . . . . . . . . . . . . 42,500 43,200 -700 -1.6 42,300 Aerospace Product and Parts…………… 30,400 31,500 -1,100 -3.5 30,100 Non-Durable Goods………………………… 38,400 39,400 -1,000 -2.5 38,700 Chemical……………………………………… 12,400 13,100 -700 -5.3 12,500 SERVICE PROVIDING INDUSTRIES………… 1,412,000 1,410,900 1,100 0.1 1,397,100 TRADE, TRANSPORTATION, UTILITIES….. 287,800 293,300 -5,500 -1.9 285,200 Wholesale Trade……………………………… 61,900 65,100 -3,200 -4.9 62,200 Retail Trade…………………………………… 178,600 177,200 1,400 0.8 175,700 Motor Vehicle and Parts Dealers…………… 19,200 19,200 0 0.0 19,100 Building Material……………………………… 15,200 15,300 -100 -0.7 14,600 Food and Beverage Stores………………… 41,500 40,800 700 1.7 41,000 General Merchandise Stores……………… 24,600 25,100 -500 -2.0 24,300 Transportation, Warehousing, & Utilities…… 47,300 51,000 -3,700 -7.3 47,300 Utilities………………………………………… 8,400 8,600 -200 -2.3 8,500 Transportation and Warehousing………… 38,900 42,400 -3,500 -8.3 38,800 INFORMATION………………………………… 33,700 35,000 -1,300 -3.7 34,000 Telecommunications………………………… 11,700 12,200 -500 -4.1 11,800 FINANCIAL ACTIVITIES……………………… 133,500 137,400 -3,900 -2.8 134,000 Finance and Insurance……………………… 114,900 118,200 -3,300 -2.8 115,600 Credit Intermediation………………………… 26,900 27,900 -1,000 -3.6 27,200 Securities and Commodity Contracts……… 21,900 21,600 300 1.4 21,800 Insurance Carriers & Related Activities…… 61,600 64,300 -2,700 -4.2 62,100 Real Estate and Rental and Leasing……… 18,600 19,200 -600 -3.1 18,400 PROFESSIONAL & BUSINESS SERVICES 188,300 189,200 -900 -0.5 185,100 Professional, Scientific……………………… 83,100 86,800 -3,700 -4.3 83,300 Legal Services……………………………… 12,900 13,400 -500 -3.7 13,000 Computer Systems Design………………… 19,700 20,600 -900 -4.4 19,700 Management of Companies………………… 25,000 25,600 -600 -2.3 24,900 Administrative and Support………………… 80,200 76,800 3,400 4.4 76,900 Employment Services……………………… 24,300 21,200 3,100 14.6 23,100 EDUCATIONAL AND HEALTH SERVICES 309,200 301,800 7,400 2.5 309,100 Educational Services………………………… 60,400 57,800 2,600 4.5 61,300 Health Care and Social Assistance………… 248,800 244,000 4,800 2.0 247,800 Hospitals……………………………………… 60,400 60,400 0 0.0 60,500 Nursing & Residential Care Facilities……… 61,700 60,600 1,100 1.8 61,400 Social Assistance…………………………… 46,000 44,900 1,100 2.4 45,500 LEISURE AND HOSPITALITY………………… 143,800 138,000 5,800 4.2 139,100 Arts, Entertainment, and Recreation………… 25,300 25,400 -100 -0.4 23,700 Accommodation and Food Services………… 118,500 112,600 5,900 5.2 115,400 Food Serv., Restaurants, Drinking Places… 107,400 101,700 5,700 5.6 104,700 OTHER SERVICES…………………………… 59,800 61,300 -1,500 -2.4 59,900 GOVERNMENT ………………………………… 255,900 254,900 1,000 0.4 250,700 Federal Government………………………… 24,800 19,900 4,900 24.6 20,000 State Government……………………………. 66,600 69,400 -2,800 -4.0 68,700 Local Government**…………………………… 164,500 165,600 -1,100 -0.7 162,000
CONNECTICUT
NONFARM EMPLOYMENT ESTIMATES
Current month’s data are preliminary. Prior months’ data have been revised. All data are benchmarked to March 2009. *Total excludes workers idled due to labor-management disputes. **Includes Indian tribal government employment.
STATE

THE CONNECTICUT ECONOMIC DIGEST 13July 2010
Not Seasonally Adjusted
MAY MAY CHANGE APR2010 2009 NO. % 2010
TOTAL NONFARM EMPLOYMENT…………… 65,400 66,000 -600 -0.9 64,600TOTAL PRIVATE………………………………… 55,400 57,500 -2,100 -3.7 54,600 GOODS PRODUCING INDUSTRIES………… 11,000 11,700 -700 -6.0 10,900 SERVICE PROVIDING INDUSTRIES………… 54,400 54,300 100 0.2 53,700 TRADE, TRANSPORTATION, UTILITIES….. 14,400 14,700 -300 -2.0 14,000 Retail Trade…………………………………… 10,700 11,000 -300 -2.7 10,500 PROFESSIONAL & BUSINESS SERVICES 7,000 7,400 -400 -5.4 6,900 LEISURE AND HOSPITALITY………………… 5,100 5,400 -300 -5.6 5,000 GOVERNMENT ………………………………… 10,000 8,500 1,500 17.6 10,000 Federal………………………………………… 600 600 0 0.0 600 State & Local…………………………………… 9,400 7,900 1,500 19.0 9,400
Not Seasonally Adjusted
MAY MAY CHANGE APR2010 2009 NO. % 2010
TOTAL NONFARM EMPLOYMENT…………… 400,600 400,900 -300 -0.1 395,700TOTAL PRIVATE………………………………… 351,300 352,500 -1,200 -0.3 348,100 GOODS PRODUCING INDUSTRIES………… 46,700 49,500 -2,800 -5.7 46,500 CONSTRUCTION, NAT. RES. & MINING.…… 11,200 12,500 -1,300 -10.4 11,000 MANUFACTURING…………………………… 35,500 37,000 -1,500 -4.1 35,500 Durable Goods………………………………… 27,500 28,300 -800 -2.8 27,400 SERVICE PROVIDING INDUSTRIES………… 353,900 351,400 2,500 0.7 349,200 TRADE, TRANSPORTATION, UTILITIES….. 70,400 70,900 -500 -0.7 69,100 Wholesale Trade……………………………… 13,800 13,900 -100 -0.7 13,700 Retail Trade…………………………………… 46,100 46,400 -300 -0.6 45,000 Transportation, Warehousing, & Utilities…… 10,500 10,600 -100 -0.9 10,400 INFORMATION………………………………… 11,000 11,400 -400 -3.5 11,100 FINANCIAL ACTIVITIES……………………… 42,200 42,900 -700 -1.6 42,400 Finance and Insurance……………………… 36,600 36,700 -100 -0.3 36,600 PROFESSIONAL & BUSINESS SERVICES 62,100 63,000 -900 -1.4 61,400 EDUCATIONAL AND HEALTH SERVICES 67,500 64,600 2,900 4.5 67,800 Health Care and Social Assistance………… 55,500 54,400 1,100 2.0 55,300 LEISURE AND HOSPITALITY………………… 35,300 33,900 1,400 4.1 33,800 Accommodation and Food Services………… 26,000 25,200 800 3.2 25,300 OTHER SERVICES…………………………… 16,100 16,300 -200 -1.2 16,000 GOVERNMENT ………………………………… 49,300 48,400 900 1.9 47,600 Federal………………………………………… 4,600 3,200 1,400 43.8 3,300 State & Local…………………………………… 44,700 45,200 -500 -1.1 44,300
DANBURY LMA
BRIDGEPORT -STAMFORD LMA
NONFARM EMPLOYMENT ESTIMATES
Current month’s data are preliminary. Prior months’ data have been revised. All data are benchmarked to March 2009. *Total excludes workers idled due to labor-management disputes.
For further information on the Bridgeport-Stamford Labor Market Area contact Arthur Famiglietti at (860) 263-6297.
For further information on the Danbury Labor Market Area contact Arthur Famiglietti at (860) 263-6297.
LMA
THE CONNECTICUT ECONOMIC DIGEST14 July 2010
Not Seasonally Adjusted
MAY MAY CHANGE APR2010 2009 NO. % 2010
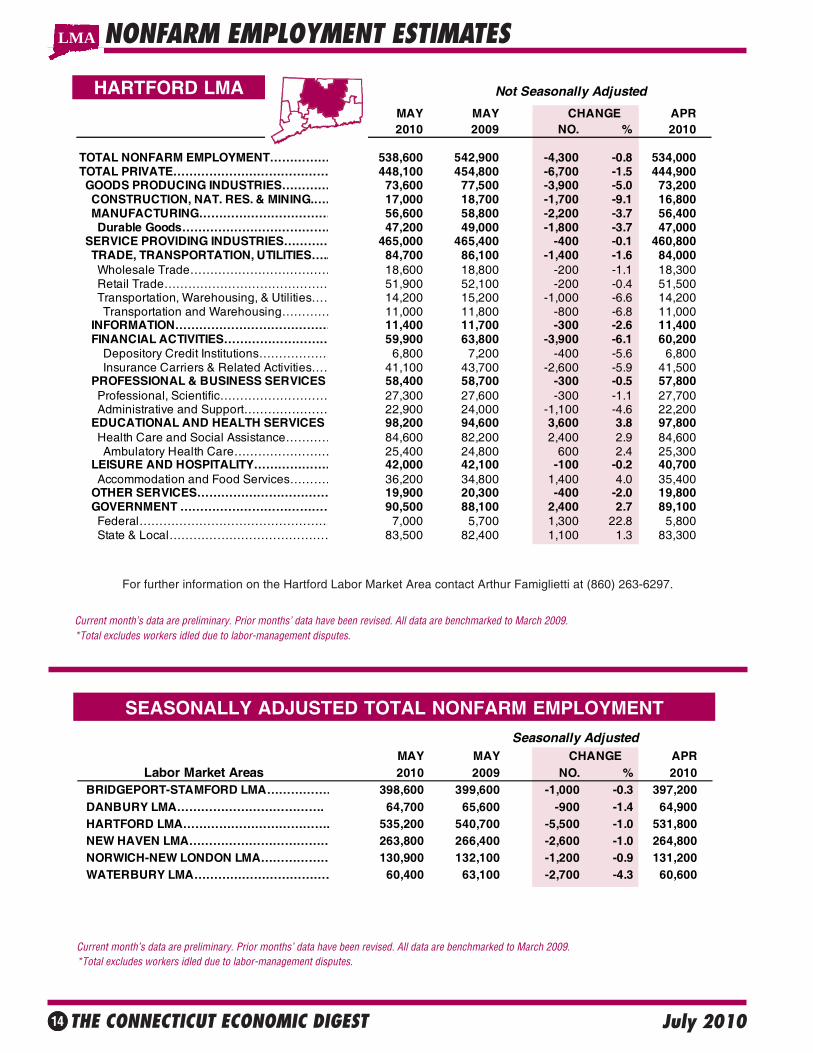
TOTAL NONFARM EMPLOYMENT…………… 538,600 542,900 -4,300 -0.8 534,000TOTAL PRIVATE………………………………… 448,100 454,800 -6,700 -1.5 444,900 GOODS PRODUCING INDUSTRIES………… 73,600 77,500 -3,900 -5.0 73,200 CONSTRUCTION, NAT. RES. & MINING.…… 17,000 18,700 -1,700 -9.1 16,800 MANUFACTURING…………………………… 56,600 58,800 -2,200 -3.7 56,400 Durable Goods………………………………… 47,200 49,000 -1,800 -3.7 47,000 SERVICE PROVIDING INDUSTRIES………… 465,000 465,400 -400 -0.1 460,800 TRADE, TRANSPORTATION, UTILITIES….. 84,700 86,100 -1,400 -1.6 84,000 Wholesale Trade……………………………… 18,600 18,800 -200 -1.1 18,300 Retail Trade…………………………………… 51,900 52,100 -200 -0.4 51,500 Transportation, Warehousing, & Utilities…… 14,200 15,200 -1,000 -6.6 14,200 Transportation and Warehousing………… 11,000 11,800 -800 -6.8 11,000 INFORMATION………………………………… 11,400 11,700 -300 -2.6 11,400 FINANCIAL ACTIVITIES……………………… 59,900 63,800 -3,900 -6.1 60,200 Depository Credit Institutions……………… 6,800 7,200 -400 -5.6 6,800 Insurance Carriers & Related Activities…… 41,100 43,700 -2,600 -5.9 41,500 PROFESSIONAL & BUSINESS SERVICES 58,400 58,700 -300 -0.5 57,800 Professional, Scientific……………………… 27,300 27,600 -300 -1.1 27,700 Administrative and Support………………… 22,900 24,000 -1,100 -4.6 22,200 EDUCATIONAL AND HEALTH SERVICES 98,200 94,600 3,600 3.8 97,800 Health Care and Social Assistance………… 84,600 82,200 2,400 2.9 84,600 Ambulatory Health Care…………………… 25,400 24,800 600 2.4 25,300 LEISURE AND HOSPITALITY………………… 42,000 42,100 -100 -0.2 40,700 Accommodation and Food Services………… 36,200 34,800 1,400 4.0 35,400 OTHER SERVICES…………………………… 19,900 20,300 -400 -2.0 19,800 GOVERNMENT ………………………………… 90,500 88,100 2,400 2.7 89,100 Federal………………………………………… 7,000 5,700 1,300 22.8 5,800 State & Local…………………………………… 83,500 82,400 1,100 1.3 83,300
HARTFORD LMA
NONFARM EMPLOYMENT ESTIMATES
Current month’s data are preliminary. Prior months’ data have been revised. All data are benchmarked to March 2009. *Total excludes workers idled due to labor-management disputes.
For further information on the Hartford Labor Market Area contact Arthur Famiglietti at (860) 263-6297.
LMA
SEASONALLY ADJUSTED TOTAL NONFARM EMPLOYMENT
Current month’s data are preliminary. Prior months’ data have been revised. All data are benchmarked to March 2009. *Total excludes workers idled due to labor-management disputes.
Seasonally AdjustedMAY MAY CHANGE APR
Labor Market Areas 2010 2009 NO. % 2010 BRIDGEPORT-STAMFORD LMA……………… 398,600 399,600 -1,000 -0.3 397,200 DANBURY LMA………………………………. 64,700 65,600 -900 -1.4 64,900 HARTFORD LMA………………………………. 535,200 540,700 -5,500 -1.0 531,800 NEW HAVEN LMA……………………………… 263,800 266,400 -2,600 -1.0 264,800 NORWICH-NEW LONDON LMA……………… 130,900 132,100 -1,200 -0.9 131,200 WATERBURY LMA……………………………… 60,400 63,100 -2,700 -4.3 60,600

THE CONNECTICUT ECONOMIC DIGEST 15July 2010
Not Seasonally Adjusted
MAY MAY CHANGE APR2010 2009 NO. % 2010
TOTAL NONFARM EMPLOYMENT…………… 265,300 268,700 -3,400 -1.3 265,600 TOTAL PRIVATE………………………………… 230,800 233,000 -2,200 -0.9 231,700 GOODS PRODUCING INDUSTRIES………… 36,000 37,900 -1,900 -5.0 35,900 CONSTRUCTION, NAT. RES. & MINING.…… 9,300 9,800 -500 -5.1 9,100 MANUFACTURING…………………………… 26,700 28,100 -1,400 -5.0 26,800 Durable Goods………………………………… 19,500 20,400 -900 -4.4 19,500 SERVICE PROVIDING INDUSTRIES………… 229,300 230,800 -1,500 -0.6 229,700 TRADE, TRANSPORTATION, UTILITIES….. 48,400 48,300 100 0.2 47,900 Wholesale Trade……………………………… 11,400 11,500 -100 -0.9 11,300 Retail Trade…………………………………… 28,700 28,200 500 1.8 28,400 Transportation, Warehousing, & Utilities…… 8,300 8,600 -300 -3.5 8,200 INFORMATION………………………………… 6,200 6,800 -600 -8.8 6,100 FINANCIAL ACTIVITIES……………………… 12,100 12,400 -300 -2.4 12,100 Finance and Insurance……………………… 8,900 9,100 -200 -2.2 8,900 PROFESSIONAL & BUSINESS SERVICES 24,000 23,600 400 1.7 23,800 Administrative and Support………………… 10,200 10,800 -600 -5.6 10,100 EDUCATIONAL AND HEALTH SERVICES 71,600 71,300 300 0.4 73,600 Educational Services………………………… 26,100 26,000 100 0.4 28,200 Health Care and Social Assistance………… 45,500 45,300 200 0.4 45,400 LEISURE AND HOSPITALITY………………… 21,900 22,100 -200 -0.9 21,700 Accommodation and Food Services………… 19,000 19,100 -100 -0.5 18,500 OTHER SERVICES…………………………… 10,600 10,600 0 0.0 10,600 GOVERNMENT ………………………………… 34,500 35,700 -1,200 -3.4 33,900 Federal………………………………………… 5,100 5,100 0 0.0 4,800 State & Local…………………………………… 29,400 30,600 -1,200 -3.9 29,100
NEW HAVEN LMA
NONFARM EMPLOYMENT ESTIMATES
Current month’s data are preliminary. Prior months’ data have been revised. All data are benchmarked to March 2009. *Total excludes workers idled due to labor-management disputes. **Value less than 50
For further information on the New Haven Labor Market Area contact Joseph Slepski at (860) 263-6278.
BUSINESS AND ECONOMIC NEWS
LMA
Summertime school enrollment and employment among teensMore than half (53.0 percent) of teens aged 16 to 19 years were enrolled in school sometime during the summer of2009, a percentage close to 3 times higher than it was in 1989 (19.4 percent). Over the same period, the employ-ment-population ratio for 16- to 19-year-olds declined from 57.0 percent to 32.9 percent. Teens who are enrolled inschool are much less likely to hold jobs in the summer than are youths who are not enrolled. The employment-population ratio for enrolled youths was 25.5 percent in summer 2009, compared with 41.3 percent for nonenrolledyouths. In addition to higher summertime enrollment rates, a second possible reason for lower employment-population ratios among teens is that students are facing greater academic demands and pressures than in the past,which, together with the desire to achieve, may incline them toward placing greater emphasis on academics than onworking. The recent declines in summer employment rates among teens have been large and unprecedented, andhave occurred across all major demographic groups. These data are from the Current Population Survey. To learnmore, see "The Early 2000s: a period of declining teen summer employment rates," (PDF) in the Monthly LaborReview, May 2010 issue.
Source: The Editor’s Desk, Bureau of Labor Statistics, June 2, 2010

THE CONNECTICUT ECONOMIC DIGEST16 July 2010
Not Seasonally Adjusted
MAY MAY CHANGE APR 2010 2009 NO. % 2010
TOTAL NONFARM EMPLOYMENT…………… 60,600 63,500 -2,900 -4.6 60,800TOTAL PRIVATE………………………………… 51,400 53,500 -2,100 -3.9 51,300 GOODS PRODUCING INDUSTRIES………… 9,700 10,300 -600 -5.8 9,600 CONSTRUCTION, NAT. RES. & MINING.…… 2,300 2,300 0 0.0 2,200 MANUFACTURING…………………………… 7,400 8,000 -600 -7.5 7,400 SERVICE PROVIDING INDUSTRIES………… 50,900 53,200 -2,300 -4.3 51,200 TRADE, TRANSPORTATION, UTILITIES….. 12,100 12,400 -300 -2.4 12,100 Wholesale Trade……………………………… 2,000 2,100 -100 -4.8 2,000 Retail Trade…………………………………… 8,300 8,400 -100 -1.2 8,300 Transportation, Warehousing, & Utilities…… 1,800 1,900 -100 -5.3 1,800 INFORMATION………………………………… 700 700 0 0.0 700 FINANCIAL ACTIVITIES……………………… 1,900 2,100 -200 -9.5 2,000 PROFESSIONAL & BUSINESS SERVICES 4,200 4,900 -700 -14.3 4,200 EDUCATIONAL AND HEALTH SERVICES 15,400 15,200 200 1.3 15,400 Health Care and Social Assistance………… 14,100 13,900 200 1.4 14,000 LEISURE AND HOSPITALITY………………… 5,500 5,500 0 0.0 5,400 OTHER SERVICES…………………………… 1,900 2,400 -500 -20.8 1,900 GOVERNMENT ………………………………… 9,200 10,000 -800 -8.0 9,500 Federal………………………………………… 500 500 0 0.0 500 State & Local…………………………………… 8,700 9,500 -800 -8.4 9,000
Not Seasonally Adjusted
MAY MAY CHANGE APR2010 2009 NO. % 2010
TOTAL NONFARM EMPLOYMENT…………… 131,800 132,800 -1,000 -0.8 130,200TOTAL PRIVATE………………………………… 93,500 93,700 -200 -0.2 92,400 GOODS PRODUCING INDUSTRIES………… 18,100 18,500 -400 -2.2 18,100 CONSTRUCTION, NAT. RES. & MINING.…… 3,300 3,500 -200 -5.7 3,200 MANUFACTURING…………………………… 14,800 15,000 -200 -1.3 14,900 Durable Goods………………………………… 10,600 10,600 0 0.0 10,600 Non-Durable Goods………………………… 4,200 4,400 -200 -4.5 4,300 SERVICE PROVIDING INDUSTRIES………… 113,700 114,300 -600 -0.5 112,100 TRADE, TRANSPORTATION, UTILITIES….. 22,600 22,300 300 1.3 22,400 Wholesale Trade……………………………… 2,400 2,500 -100 -4.0 2,400 Retail Trade…………………………………… 15,300 14,800 500 3.4 15,000 Transportation, Warehousing, & Utilities…… 4,900 5,000 -100 -2.0 5,000 INFORMATION………………………………… 1,700 1,700 0 0.0 1,700 FINANCIAL ACTIVITIES……………………… 3,100 3,100 0 0.0 3,100 PROFESSIONAL & BUSINESS SERVICES 9,400 9,600 -200 -2.1 9,300 EDUCATIONAL AND HEALTH SERVICES 20,300 20,000 300 1.5 20,300 Health Care and Social Assistance………… 17,400 17,200 200 1.2 17,300 LEISURE AND HOSPITALITY………………… 15,000 15,000 0 0.0 14,200 Accommodation and Food Services………… 12,800 12,600 200 1.6 12,300 Food Serv., Restaurants, Drinking Places… 11,000 10,700 300 2.8 10,700 OTHER SERVICES…………………………… 3,300 3,500 -200 -5.7 3,300 GOVERNMENT ………………………………… 38,300 39,100 -800 -2.0 37,800 Federal………………………………………… 3,100 2,700 400 14.8 2,900 State & Local**………………………………… 35,200 36,400 -1,200 -3.3 34,900
NORWICH - NEWLONDON LMA
Current month’s data are preliminary. Prior months’ data have been revised. All data are benchmarked to March 2009. *Total excludes workers idled due to labor-management disputes. **Includes Indian tribal government employment.
For further information on the Norwich-New London Labor Market Area contact Lincoln Dyer at (860) 263-6292.
For further information on the Waterbury Labor Market Area contact Joseph Slepski at (860) 263-6278.
NONFARM EMPLOYMENT ESTIMATES
WATERBURY LMA
LMA

THE CONNECTICUT ECONOMIC DIGEST 17July 2010
Not Seasonally Adjusted
MAY MAY CHANGE APR 2010 2009 NO. % 2010
TOTAL NONFARM EMPLOYMENT ENFIELD LMA…………………………………… 46,700 46,300 400 0.9 46,600 TORRINGTON LMA……………………………… 35,700 36,100 -400 -1.1 34,600 WILLIMANTIC - DANIELSON LMA…………… 35,700 36,600 -900 -2.5 35,100
NONFARM EMPLOYMENT ESTIMATES
NOTE: More industry detail data is available for the State and its nine labor market areas at: http://www.ctdol.state.ct.us/lmi/202/covered.htm. The data published there differ from the data in the preced-ing tables in that they are developed from a near-universe count of Connecticut employment covered bythe unemployment insurance (UI) program, while the data here is sample-based. The data drawn fromthe UI program does not contain estimates of employment not covered by unemployment insurance,and is lagged several months behind the current employment estimates presented here.
SMALLER LMAS
Current month’s data are preliminary. Prior months’ data have been revised. All data are benchmarked to March 2009. *Total excludes workers idled due to labor-management disputes.
SPRINGFIELD, MA-CTNECTA*
* New England City and Town Area
LMA
Not Seasonally Adjusted
MAY MAY CHANGE APR2010 2009 NO. % 2010
TOTAL NONFARM EMPLOYMENT…………… 280,700 289,300 -8,600 -3.0 278,900TOTAL PRIVATE………………………………… 230,200 238,700 -8,500 -3.6 228,900 GOODS PRODUCING INDUSTRIES………… 38,200 41,700 -3,500 -8.4 37,600 CONSTRUCTION, NAT. RES. & MINING.…… 8,700 9,400 -700 -7.4 8,100 MANUFACTURING…………………………… 29,500 32,300 -2,800 -8.7 29,500 Durable Goods………………………………… 19,300 21,000 -1,700 -8.1 19,300 Non-Durable Goods………………………… 10,200 11,300 -1,100 -9.7 10,200 SERVICE PROVIDING INDUSTRIES………… 242,500 247,600 -5,100 -2.1 241,300 TRADE, TRANSPORTATION, UTILITIES….. 54,800 56,500 -1,700 -3.0 54,300 Wholesale Trade……………………………… 10,400 10,800 -400 -3.7 10,400 Retail Trade…………………………………… 32,500 33,200 -700 -2.1 32,100 Transportation, Warehousing, & Utilities…… 11,900 12,500 -600 -4.8 11,800 INFORMATION………………………………… 3,900 4,100 -200 -4.9 3,900 FINANCIAL ACTIVITIES……………………… 16,500 16,800 -300 -1.8 16,500 Finance and Insurance……………………… 13,100 13,100 0 0.0 13,100 Insurance Carriers & Related Activities…… 8,100 8,300 -200 -2.4 8,100 PROFESSIONAL & BUSINESS SERVICES 20,400 21,600 -1,200 -5.6 20,700 EDUCATIONAL AND HEALTH SERVICES 58,200 58,600 -400 -0.7 58,800 Educational Services………………………… 12,700 13,200 -500 -3.8 13,200 Health Care and Social Assistance………… 45,500 45,400 100 0.2 45,600 LEISURE AND HOSPITALITY………………… 27,100 28,200 -1,100 -3.9 26,000 OTHER SERVICES…………………………… 11,100 11,200 -100 -0.9 11,100 GOVERNMENT ………………………………… 50,500 50,600 -100 -0.2 50,000 Federal………………………………………… 7,200 6,600 600 9.1 6,500 State & Local…………………………………… 43,300 44,000 -700 -1.6 43,500

THE CONNECTICUT ECONOMIC DIGEST18 July 2010
LABOR FORCE ESTIMATES
Current month’s data are preliminary. Prior months’ data have been revised. All data are benchmarked to March 2009.
EMPLOYMENT MAY MAY CHANGE APR(Not seasonally adjusted) STATUS 2010 2009 NO. % 2010
CONNECTICUT Civilian Labor Force 1,887,600 1,891,300 -3,700 -0.2 1,879,800Employed 1,721,900 1,738,600 -16,700 -1.0 1,719,700
Unemployed 165,700 152,700 13,000 8.5 160,100Unemployment Rate 8.8 8.1 0.7 --- 8.5
BRIDGEPORT - STAMFORD LMA Civilian Labor Force 478,700 477,700 1,000 0.2 475,700Employed 439,900 440,800 -900 -0.2 438,000
Unemployed 38,800 37,000 1,800 4.9 37,600Unemployment Rate 8.1 7.7 0.4 --- 7.9
DANBURY LMA Civilian Labor Force 91,400 92,000 -600 -0.7 90,600Employed 84,700 85,400 -700 -0.8 84,200
Unemployed 6,700 6,600 100 1.5 6,300Unemployment Rate 7.4 7.2 0.2 --- 7.0
ENFIELD LMA Civilian Labor Force 49,500 50,500 -1,000 -2.0 49,800Employed 45,300 46,500 -1,200 -2.6 45,300
Unemployed 4,200 3,900 300 7.7 4,400Unemployment Rate 8.6 7.8 0.8 --- 8.9
HARTFORD LMA Civilian Labor Force 598,400 598,600 -200 0.0 595,600Employed 545,200 550,000 -4,800 -0.9 544,600
Unemployed 53,200 48,600 4,600 9.5 51,000Unemployment Rate 8.9 8.1 0.8 --- 8.6
NEW HAVEN LMA Civilian Labor Force 314,600 314,600 0 0.0 314,900Employed 286,200 289,300 -3,100 -1.1 287,700
Unemployed 28,400 25,300 3,100 12.3 27,200Unemployment Rate 9.0 8.0 1.0 --- 8.6
NORWICH - NEW LONDON LMA Civilian Labor Force 154,100 154,100 0 0.0 153,400Employed 141,200 142,300 -1,100 -0.8 140,600
Unemployed 13,000 11,800 1,200 10.2 12,800Unemployment Rate 8.4 7.7 0.7 --- 8.3
TORRINGTON LMA Civilian Labor Force 54,700 55,600 -900 -1.6 54,400Employed 50,000 51,300 -1,300 -2.5 49,700
Unemployed 4,700 4,400 300 6.8 4,700Unemployment Rate 8.5 7.9 0.6 --- 8.6
WATERBURY LMA Civilian Labor Force 100,400 101,900 -1,500 -1.5 100,800Employed 88,500 91,000 -2,500 -2.7 89,100
Unemployed 11,900 10,900 1,000 9.2 11,800Unemployment Rate 11.8 10.7 1.1 --- 11.7
WILLIMANTIC-DANIELSON LMA Civilian Labor Force 59,100 59,500 -400 -0.7 58,600Employed 53,200 54,200 -1,000 -1.8 52,800
Unemployed 5,900 5,300 600 11.3 5,700Unemployment Rate 10.0 8.9 1.1 --- 9.8
UNITED STATES Civilian Labor Force 153,866,000 154,336,000 -470,000 -0.3 153,911,000Employed 139,497,000 140,363,000 -866,000 -0.6 139,302,000
Unemployed 14,369,000 13,973,000 396,000 2.8 14,609,000Unemployment Rate 9.3 9.1 0.2 --- 9.5
LMA

THE CONNECTICUT ECONOMIC DIGEST 19July 2010
HOURS AND EARNINGS
Current month’s data are preliminary. Prior months’ data have been revised. All data are benchmarked to March 2009.
BUSINESS AND EMPLOYMENT CHANGES ANNOUNCED IN THE NEWS MEDIA
In May 2010, Sandella’s Flatbread Café opened in Stamford with a staff of 15. Urgent Care of Brookfield hasopened, employing 12 medical professionals. Wallingford is readying for the opening of Connecticut’s first Sonicrestaurant which will hire 100 workers. AT&T plans to hire 80 salespeople. Dolce Hair Salon in Waterbury hasrelocated and expanded the payroll by 13. A Burger, Shakes & Fries restaurant will open in Darien with 10 employ-ees. ING of Windsor is looking to fill 44 job openings. LongHorn Steakhouse has opened in Manchester with 80workers. Phillips & Lambert LLC, a dental practice, opened an office in Brookfield with 12 employees.
In May 2010, it was announced that West Rock Health Care Center, a nursing home in New Haven with 68 workers,will be closing down.
Business & Employment Changes Announced in the News Media lists start-ups, expansions, staff reductions, and layoffs reportedby the media, both current and future. The report provides company name, the number of workers involved, date of the action, theprincipal product or service of the company, a brief synopsis of the action, and the source and date of the media article. Thispublication is available in both HTML and PDF formats at the Connecticut Department of Labor Web site, http://www.ctdol.state.ct.us/lmi/busemp.htm.
LMA
AVG WEEKLY EARNINGS AVG WEEKLY HOURS AVG HOURLY EARNINGSMAY CHG APR MAY CHG APR MAY CHG APR
(Not seasonally adjusted) 2010 2009 Y/Y 2010 2010 2009 Y/Y 2010 2010 2009 Y/Y 2010
MANUFACTURING $974.01 $927.30 $46.70 $960.48 41.5 40.3 1.2 41.4 $23.47 $23.01 $0.46 $23.20 DURABLE GOODS 1,013.09 974.45 38.64 1,004.00 41.3 40.2 1.1 41.3 24.53 24.24 0.29 24.31 NON-DUR. GOODS 854.34 782.95 71.39 834.00 41.9 40.4 1.5 41.7 20.39 19.38 1.01 20.00CONSTRUCTION 1,000.22 998.40 1.82 984.40 37.1 39.0 -1.9 36.8 26.96 25.60 1.36 26.75
STATEWIDETOTAL PRIVATE 962.81 912.57 50.24 947.05 33.7 33.1 0.6 33.3 28.57 27.57 1.00 28.44GOODS PRODUCING 1,163.37 1,126.39 36.98 1,149.50 39.0 37.9 1.1 38.9 29.83 29.72 0.11 29.55
Construction 1,065.77 1,044.20 21.57 1,062.52 36.7 36.6 0.1 36.5 29.04 28.53 0.51 29.11 Manufacturing 1,198.60 1,155.20 43.40 1,178.08 39.9 38.7 1.2 39.8 30.04 29.85 0.19 29.60SERVICE PROVIDING 925.08 871.65 53.43 907.40 32.7 32.2 0.5 32.2 28.29 27.07 1.22 28.18 Trade, Transp., Utilities 778.41 750.07 28.35 741.11 33.8 33.5 0.3 33.1 23.03 22.39 0.64 22.39 Financial Activities 1,565.75 1,470.06 95.69 1,509.18 37.2 35.5 1.7 36.2 42.09 41.41 0.68 41.69 Prof. & Business Serv. 1,012.92 1,017.40 -4.48 1,003.34 34.5 33.5 1.0 34.0 29.36 30.37 -1.01 29.51 Education & Health Ser. 795.60 787.12 8.49 787.66 30.6 30.1 0.5 30.4 26.00 26.15 -0.15 25.91 Leisure & Hospitality 400.81 398.03 2.78 401.74 26.3 26.5 -0.2 26.5 15.24 15.02 0.22 15.16 Other Services 647.18 647.53 -0.34 634.27 29.1 29.5 -0.4 28.7 22.24 21.95 0.29 22.10
LABOR MARKET AREAS: TOTAL PRIVATE Bridgeport-Stamford 1,023.31 1,043.08 -19.77 1,001.88 33.3 33.4 -0.1 33.0 30.73 31.23 -0.50 30.36 Danbury 989.05 873.39 115.65 968.44 35.9 33.8 2.1 35.5 27.55 25.84 1.71 27.28 Hartford 1,058.61 1,012.74 45.87 1,050.02 35.8 34.4 1.4 35.2 29.57 29.44 0.13 29.83 New Haven 861.00 823.15 37.85 841.10 32.8 32.6 0.2 32.5 26.25 25.25 1.00 25.88 Norwich-New London 679.84 662.72 17.12 673.89 31.3 30.4 0.9 31.3 21.72 21.80 -0.08 21.53 Waterbury 778.22 721.44 56.78 749.66 33.4 32.6 0.8 33.2 23.30 22.13 1.17 22.58
ALL EMPLOYEE
PRODUCTION WORKER

THE CONNECTICUT ECONOMIC DIGEST20 July 2010
LABOR FORCE ESTIMATES BY TOWN
MAY 2010(By Place of Residence - Not Seasonally Adjusted)
The civilian labor force comprises all state residents age 16 years and older classified as employed or unemployed in accordance with criteria described below.Excluded are members of the military and persons in institutions (correctional and mental health, for example).
The employed are all persons who did any work as paid employees or in their own business during the survey week, or who have worked 15 hours or more asunpaid workers in an enterprise operated by a family member. Persons temporarily absent from a job because of illness, bad weather, strike or for personalreasons are also counted as employed whether they were paid by their employer or were seeking other jobs.
The unemployed are all persons who did not work, but were available for work during the survey week (except for temporary illness) and made specific efforts tofind a job in the prior four weeks. Persons waiting to be recalled to a job from which they had been laid off need not be looking for work to be classified asunemployed.
LABOR FORCE CONCEPTS
Town
LMA/TOWNS LABOR FORCE EMPLOYED UNEMPLOYED % LMA/TOWNS LABOR FORCE EMPLOYED UNEMPLOYED %BRIDGEPORT-STAMFORD HARTFORD cont....
478,677 439,864 38,813 8.1 Canton 5,933 5,477 456 7.7Ansonia 10,165 9,117 1,048 10.3 Colchester 8,987 8,339 648 7.2Bridgeport 64,343 56,043 8,300 12.9 Columbia 3,109 2,872 237 7.6Darien 9,183 8,647 536 5.8 Coventry 7,137 6,607 530 7.4Derby 7,030 6,323 707 10.1 Cromwell 8,016 7,377 639 8.0Easton 3,748 3,508 240 6.4 East Granby 3,022 2,815 207 6.8Fairfield 28,728 26,564 2,164 7.5 East Haddam 5,265 4,903 362 6.9Greenwich 30,553 28,670 1,883 6.2 East Hampton 7,256 6,652 604 8.3Milford 33,149 30,314 2,835 8.6 East Hartford 26,142 23,131 3,011 11.5Monroe 10,663 9,930 733 6.9 Ellington 8,970 8,351 619 6.9New Canaan 9,033 8,475 558 6.2 Farmington 13,206 12,268 938 7.1Newtown 14,366 13,448 918 6.4 Glastonbury 18,539 17,362 1,177 6.3Norwalk 48,725 45,180 3,545 7.3 Granby 6,413 6,000 413 6.4Oxford 7,599 7,098 501 6.6 Haddam 5,007 4,680 327 6.5Redding 4,695 4,418 277 5.9 Hartford 50,909 43,283 7,626 15.0Ridgefield 11,823 11,114 709 6.0 Hartland 1,227 1,137 90 7.3Seymour 9,475 8,638 837 8.8 Harwinton 3,173 2,970 203 6.4Shelton 23,300 21,537 1,763 7.6 Hebron 5,586 5,201 385 6.9Southbury 9,266 8,573 693 7.5 Lebanon 4,400 4,076 324 7.4Stamford 67,526 62,550 4,976 7.4 Manchester 33,167 30,304 2,863 8.6Stratford 26,224 23,847 2,377 9.1 Mansfield 13,209 12,247 962 7.3Trumbull 18,008 16,693 1,315 7.3 Marlborough 3,706 3,451 255 6.9Weston 4,922 4,654 268 5.4 Middlefield 2,407 2,230 177 7.4Westport 12,868 12,060 808 6.3 Middletown 27,280 25,109 2,171 8.0Wilton 8,377 7,837 540 6.4 New Britain 35,722 31,293 4,429 12.4Woodbridge 4,909 4,626 283 5.8 New Hartford 3,871 3,569 302 7.8
Newington 17,038 15,663 1,375 8.1DANBURY 91,444 84,711 6,733 7.4 Plainville 10,311 9,361 950 9.2Bethel 10,765 9,956 809 7.5 Plymouth 7,001 6,264 737 10.5Bridgewater 1,027 959 68 6.6 Portland 5,463 5,040 423 7.7Brookfield 9,215 8,555 660 7.2 Rocky Hill 10,934 10,145 789 7.2Danbury 44,575 41,212 3,363 7.5 Simsbury 12,212 11,449 763 6.2New Fairfield 7,527 6,986 541 7.2 Southington 24,732 22,782 1,950 7.9New Milford 16,202 15,042 1,160 7.2 South Windsor 15,004 13,971 1,033 6.9Sherman 2,135 2,002 133 6.2 Stafford 7,009 6,358 651 9.3
Thomaston 4,648 4,245 403 8.7ENFIELD 49,532 45,297 4,235 8.6 Tolland 8,490 7,960 530 6.2East Windsor 6,409 5,805 604 9.4 Union 482 449 33 6.8Enfield 23,765 21,711 2,054 8.6 Vernon 17,880 16,352 1,528 8.5Somers 4,778 4,357 421 8.8 West Hartford 29,729 27,362 2,367 8.0Suffield 7,458 6,927 531 7.1 Wethersfield 13,488 12,343 1,145 8.5Windsor Locks 7,123 6,498 625 8.8 Willington 3,890 3,652 238 6.1
Windsor 16,577 15,162 1,415 8.5HARTFORD 598,435 545,234 53,201 8.9Andover 2,005 1,863 142 7.1Ashford 2,676 2,490 186 7.0Avon 9,326 8,760 566 6.1Barkhamsted 2,257 2,072 185 8.2Berlin 11,654 10,790 864 7.4Bloomfield 10,484 9,374 1,110 10.6Bolton 3,084 2,869 215 7.0Bristol 34,942 31,680 3,262 9.3Burlington 5,460 5,074 386 7.1
All Labor Market Areas(LMAs) in Connecticut except three are federally-designated areas for developing labor statistics. For the sake of simplicity, the federal Bridgeport-Stamford-Norwalk NECTA is referred to in Connecticut DOL publications as the 'Bridgeport-Stamford LMA', and the Hartford-West Hartford-East Hartford NECTA is referred to as the 'Hartford LMA'. The Bureau of Labor Statistics has identified 17 towns in the northwest part of the State as a separate area for reporting labor force data. For the convenience of our data users, these towns are included in the Torrington LMA. For the same purpuse, five towns which are part of the Springfield, MA area are published as the 'Enfield LMA'. Similarly the towns of Putnam, Thompson and Woodstock (part of the Worcester, MA area), plus four towns estimated separately are included in the Willimantic-Danielson LMA.

THE CONNECTICUT ECONOMIC DIGEST 21July 2010
LABOR FORCE ESTIMATES BY TOWN
The unemployment rate represents the number unemployed as a percent of the civilian labor force.
With the exception of those persons temporarily absent from a job or waiting to be recalled to one, persons with no job and who are not actively looking for oneare counted as "not in the labor force".
Over the course of a year, the size of the labor force and the levels of employment undergo fluctuations due to such seasonal events as changes in weather,reduced or expanded production, harvests, major holidays and the opening and closing of schools. Because these seasonal events follow a regular pattern eachyear, their influence on statistical trends can be eliminated by adjusting the monthly statistics. Seasonal Adjustment makes it easier to observe cyclical and othernonseasonal developments.
(By Place of Residence - Not Seasonally Adjusted)
MAY 2010
LABOR FORCE CONCEPTS (Continued)
Town
LMA/TOWNS LABOR FORCE EMPLOYED UNEMPLOYED % LMA/TOWNS LABOR FORCE EMPLOYED UNEMPLOYED %NEW HAVEN 314,640 286,213 28,427 9.0 TORRINGTON 54,698 50,030 4,668 8.5Bethany 3,167 2,953 214 6.8 Bethlehem 2,001 1,869 132 6.6Branford 17,470 16,167 1,303 7.5 Canaan 611 562 49 8.0Cheshire 14,802 13,762 1,040 7.0 Colebrook 809 773 36 4.4Chester 2,281 2,132 149 6.5 Cornwall 825 775 50 6.1Clinton 8,059 7,422 637 7.9 Goshen 1,654 1,531 123 7.4Deep River 2,601 2,407 194 7.5 Kent 1,572 1,481 91 5.8Durham 4,325 4,078 247 5.7 Litchfield 4,376 4,047 329 7.5East Haven 16,471 14,839 1,632 9.9 Morris 1,287 1,182 105 8.2Essex 3,822 3,570 252 6.6 Norfolk 928 872 56 6.0Guilford 13,069 12,260 809 6.2 North Canaan 1,730 1,591 139 8.0Hamden 31,139 28,613 2,526 8.1 Roxbury 1,358 1,278 80 5.9Killingworth 3,646 3,407 239 6.6 Salisbury 1,929 1,813 116 6.0Madison 10,152 9,515 637 6.3 Sharon 1,545 1,453 92 6.0Meriden 32,483 28,895 3,588 11.0 Torrington 19,869 17,800 2,069 10.4New Haven 57,108 49,959 7,149 12.5 Warren 739 695 44 6.0North Branford 8,411 7,806 605 7.2 Washington 1,924 1,796 128 6.7North Haven 13,271 12,277 994 7.5 Winchester 6,046 5,429 617 10.2Old Saybrook 5,536 5,141 395 7.1 Woodbury 5,495 5,084 411 7.5Orange 7,251 6,805 446 6.2Wallingford 25,737 23,668 2,069 8.0 WATERBURY 100,430 88,533 11,897 11.8Westbrook 3,750 3,463 287 7.7 Beacon Falls 3,308 2,993 315 9.5West Haven 30,089 27,072 3,017 10.0 Middlebury 3,853 3,581 272 7.1
Naugatuck 17,069 15,195 1,874 11.0*NORWICH-NEW LONDON Prospect 5,236 4,776 460 8.8
140,693 128,850 11,843 8.4 Waterbury 49,962 42,929 7,033 14.1Bozrah 1,521 1,399 122 8.0 Watertown 12,026 10,939 1,087 9.0Canterbury 3,341 3,035 306 9.2 Wolcott 8,976 8,120 856 9.5East Lyme 10,148 9,427 721 7.1Franklin 1,213 1,120 93 7.7 WILLIMANTIC-DANIELSONGriswold 7,457 6,781 676 9.1 59,066 53,174 5,892 10.0Groton 19,558 17,808 1,750 8.9 Brooklyn 3,952 3,582 370 9.4Ledyard 8,752 8,113 639 7.3 Chaplin 1,500 1,392 108 7.2Lisbon 2,628 2,434 194 7.4 Eastford 1,030 955 75 7.3Lyme 1,173 1,091 82 7.0 Hampton 1,294 1,170 124 9.6Montville 11,214 10,293 921 8.2 Killingly 9,699 8,657 1,042 10.7New London 14,093 12,587 1,506 10.7 Plainfield 8,504 7,586 918 10.8No. Stonington 3,375 3,128 247 7.3 Pomfret 2,309 2,101 208 9.0Norwich 21,325 19,270 2,055 9.6 Putnam 5,248 4,740 508 9.7Old Lyme 4,260 3,986 274 6.4 Scotland 1,010 961 49 4.9Preston 2,966 2,737 229 7.7 Sterling 2,133 1,924 209 9.8Salem 2,657 2,495 162 6.1 Thompson 5,509 4,869 640 11.6Sprague 1,886 1,677 209 11.1 Windham 12,183 10,902 1,281 10.5Stonington 10,735 10,075 660 6.1 Woodstock 4,694 4,335 359 7.6Voluntown 1,696 1,521 175 10.3Waterford 10,695 9,871 824 7.7
*Connecticut portion only. For whole NECTA, including Rhode Island town, see below. Not Seasonally Adjusted:NORWICH-NEW LONDON CONNECTICUT 1,887,600 1,721,900 165,700 8.8
154,143 141,153 12,990 8.4 UNITED STATES 153,866,000 139,497,000 14,369,000 9.3Westerly, RI 13,450 12,303 1,147 8.5Labor Force estimates are prepared following statistical procedures developed Seasonally Adjusted:by the U.S. Department of Labor, Bureau of Labor Statistics. CONNECTICUT 1,897,200 1,728,100 169,100 8.9
UNITED STATES 154,393,000 139,420,000 14,973,000 9.7

THE CONNECTICUT ECONOMIC DIGEST22 July 2010
HOUSING PERMIT ACTIVITY BY TOWN
For further information on the housing permit data, contact Kolie Sun of DECD at (860) 270-8167.
TOWN MAY YR TO DATE TOWN MAY YR TO DATE TOWN MAY YR TO DATE2010 2010 2009 2010 2010 2009 2010 2010 2009
Andover 0 0 1 Griswold na na na Preston 1 1 2Ansonia 0 3 0 Groton 4 13 9 Prospect na na naAshford 0 1 3 Guilford 1 6 8 Putnam 2 6 6Avon 1 7 6 Haddam 2 12 5 Redding na na naBarkhamsted na na na Hamden 0 9 5 Ridgefield 2 4 3Beacon Falls na na na Hampton 1 3 2 Rocky Hill 2 6 5Berlin 5 20 25 Hartford 0 14 5 Roxbury na na naBethany na na na Hartland na na na Salem 2 5 1Bethel 5 25 10 Harwinton 1 3 3 Salisbury na na naBethlehem na na na Hebron na na na Scotland 0 0 0
Bloomfield na na na Kent 0 1 3 Seymour 2 8 8Bolton 1 6 2 Killingly 2 18 8 Sharon 1 4 2Bozrah 1 1 0 Killingworth na na na Shelton 2 6 7Branford na na na Lebanon 1 1 3 Sherman na na naBridgeport 0 14 19 Ledyard 1 3 1 Simsbury 2 6 2Bridgewater na na na Lisbon 0 1 1 Somers 1 5 5Bristol 1 14 7 Litchfield na na na South Windsor 2 6 10Brookfield na na na Lyme 0 0 0 Southbury 0 1 1Brooklyn 0 9 6 Madison 0 2 5 Southington 8 43 16Burlington 1 11 7 Manchester 1 13 5 Sprague 0 2 4
Canaan 0 0 0 Mansfield 2 8 7 Stafford na na naCanterbury 0 5 1 Marlborough 0 2 1 Stamford 1 15 10Canton 1 6 4 Meriden 1 5 10 Sterling na na naChaplin 0 0 0 Middlebury na na na Stonington 2 10 3Cheshire 5 19 1 Middlefield 4 4 0 Stratford 3 10 5Chester na na na Middletown 8 31 30 Suffield 1 5 4Clinton 2 3 1 Milford 2 29 30 Thomaston na na naColchester 4 16 2 Monroe 0 3 1 Thompson na na naColebrook 0 0 0 Montville 1 23 9 Tolland 2 3 3Columbia 1 2 3 Morris 0 1 0 Torrington 1 3 1
Cornwall 0 0 1 Naugatuck 1 2 6 Trumbull 0 3 0Coventry 2 13 8 New Britain na na na Union 0 2 1Cromwell 2 9 8 New Canaan 0 5 0 Vernon 5 33 6Danbury 15 59 121 New Fairfield na na na Voluntown 0 0 1Darien na na na New Hartford 0 3 3 Wallingford 6 38 11Deep River 0 2 2 New Haven 3 10 4 Warren 0 0 1Derby na na na New London 2 11 9 Washington na na naDurham 0 3 4 New Milford 0 2 5 Waterbury 6 17 14East Granby 0 1 5 Newington 1 2 3 Waterford 1 5 6East Haddam 2 11 2 Newtown 4 5 5 Watertown 4 13 9
East Hampton 2 8 4 Norfolk 0 1 1 West Hartford 2 5 16East Hartford na na na North Branford na na na West Haven na na naEast Haven 1 2 2 North Canaan 1 1 1 Westbrook 1 4 5East Lyme 1 13 5 North Haven 0 3 0 Weston na na naEast Windsor 11 37 6 North Stonington 1 1 1 Westport 6 21 6Eastford 0 0 0 Norwalk 9 15 187 Wethersfield na na naEaston 0 0 2 Norwich 1 20 83 Willington 0 1 0Ellington 4 15 14 Old Lyme na na na Wilton na na naEnfield na na na Old Saybrook 3 5 5 Winchester 0 1 3Essex 1 3 4 Orange na na na Windham 3 7 4
Fairfield 4 11 10 Oxford 4 13 13 Windsor na na naFarmington 2 10 7 Plainfield 0 7 5 Windsor Locks na na naFranklin 0 29 0 Plainville 1 10 5 Wolcott 1 6 6Glastonbury 5 19 7 Plymouth 0 3 0 Woodbridge na na naGoshen 1 5 8 Pomfret 0 1 1 Woodbury 1 3 3Granby 1 2 1 Portland 1 7 2 Woodstock 1 2 2Greenwich 9 41 30
Town

THE CONNECTICUT ECONOMIC DIGEST 23July 2010
TECHNICAL NOTESBUSINESS STARTS AND TERMINATIONSRegistrations and terminations of business entities as recorded with the Secretary of the State and the Connecticut Department of Labor (DOL)are an indication of new business formation and activity. DOL business starts include new employers which have become liable for unemploy-ment insurance taxes during the quarter, as well as new establishments opened by existing employers. DOL business terminations are thoseaccounts discontinued due to inactivity (no employees) or business closure, and accounts for individual business establishments that are closedby still active employers. The Secretary of the State registrations include limited liability companies, limited liability partnerships, and foreign-owned (out-of-state) and domestic-owned (in-state) corporations.
CONSUMER PRICE INDEXThe Consumer Price Index (CPI), computed and published by the U.S. Bureau of Labor Statistics, is a measure of the average change in pricesover time in a fixed market basket of goods and services. It is based on prices of food, clothing, shelter, fuels, transportation fares, charges fordoctors’ and dentists’ services, drugs and other goods and services that people buy for their day-to-day living. The Northeast region is comprisedof the New England states, New York, New Jersey and Pennsylvania.
EMPLOYMENT COST INDEXThe Employment Cost Index (ECI) covers both wages and salaries and employer costs for employee benefits for all occupations and establish-ments in both the private nonfarm sector and state and local government. The ECI measures employers’ labor costs free from the influences ofemployment shifts among industries and occupations. The base period for all data is June 1989 when the ECI is 100.
HOURS AND EARNINGS ESTIMATESProduction worker earnings and hours estimates include full- and part-time employees working within manufacturing industries. Hours workedand earnings data are computed based on payroll figures for the week including the 12th of the month. Average hourly earnings are affected bysuch factors as premium pay for overtime and shift differential as well as changes in basic hourly and incentive rates of pay. Average weeklyearnings are the product of weekly hours worked and hourly earnings. These data are developed in cooperation with the U.S. Department ofLabor, Bureau of Labor Statistics.
INDIAN GAMING DATAIndian Gaming Payments are amounts received by the State as a result of the slot compact with the two Federally recognized tribes in Connecti-cut, which calls for 25 percent of net slot receipts to be remitted to the State. Indian Gaming Slots are the total net revenues from slot machinesonly received by the two Federally recognized Indian tribes.
INITIAL CLAIMSAverage weekly initial claims are calculated by dividing the total number of new claims for unemployment insurance received in the month bythe number of weeks in the month. A minor change in methodology took effect with data published in the March 1997 issue of the DIGEST.Data have been revised back to January 1980.
INSURED UNEMPLOYMENT RATEPrimarily a measure of unemployment insurance program activity, the insured unemployment rate is the 13-week average of the number ofpeople claiming unemployment benefits divided by the number of workers covered by the unemployment insurance system.
LABOR FORCE ESTIMATESLabor force estimates are a measure of the work status of people who live in Connecticut. Prepared under the direction of the U.S. Bureau ofLabor Statistics, the statewide estimates are the product of a signal-plus noise model, which uses results from the Current Population Survey(CPS), a monthly survey of Connecticut households, counts of claimants for unemployment benefits, and establishment employment estimates.Beginning with the publication of January 2005 data, an improved methodology is being used to develop labor force estimates, by whichmonthly state model-based employment and unemployment estimates are controlled to add to the national CPS levels. This will ensure thatnational economic events are reflected in the state estimates, and it will significantly reduce end-of-year revisions. (For more information, pleasesee the Connecticut Economic Digest, December 2004 issue.) Labor force data, reflecting persons employed by place of residence, are notdirectly comparable to the place-of-work industry employment series. In the labor force estimates, workers involved in labor disputes arecounted as employed. The labor force data also includes agricultural workers, unpaid family workers, domestics and the self-employed. Becauseof these conceptual differences, total labor force employment is almost always different from nonfarm wage and salary employment.
LABOR MARKET AREASAll Labor Market Areas (LMAs) in Connecticut except three are federally-designated areas for developing labor statistics. For the sake ofsimplicity, the federal Bridgeport-Norwalk-Stamford Metropolitan Statistical Area (MSA) is referred to in Connecticut Department of Laborpublications as the Bridgeport-Stamford LMA, and the Hartford-West Hartford-East Hartford MSA is called the Hartford LMA. The Bureau ofLabor Statistics has identified the 17 towns in the in the northwestern part of the state as a separate area for reporting labor force data. For theconvenience of our data users, data for these towns are included in the Torrington LMA. For the same purpose, data for the towns of EastWindsor, Enfield, Somers, Suffield and Windsor Locks, which are officially part of the Springfield MSA, are published as the Enfield LMA.Similarly, the towns of Putnam, Thompson and Woodstock - part of the Worcester MSA - are included in the Willimantic-Danielson LMA. Also,data for Westerly, Rhode Island are included in the Norwich-New London LMA. Industry employment and labor force data estimates containedin Connecticut Department of Labor publications are prepared following the same statistical procedures developed by the U.S. Department ofLabor, Bureau of Labor Statistics, whether for federally designated or state-determined areas.
LEADING AND COINCIDENT EMPLOYMENT INDICESThe leading employment index is a composite of six individual largely employment-related series -- the average workweek of manufacturingproduction and construction workers, Hartford help-wanted advertising index, short-duration (less than 15 weeks) unemployment rate, initialclaims for unemployment insurance, total housing permits, and Moody's BAA corporate bond yield. While not employment-sector variables,housing permits are closely related to construction employment and the corporate bond yield adds important information about the movementin interest rates. The coincident employment index is a composite indicator of four individual employment-related series -- the total unemploy-ment rate, nonfarm employment (employer survey), total employment (state residents employed measured by a household survey), and theinsured unemployment rate. All data are seasonally adjusted and come from the Connecticut Labor Department, the Federal Reserve Bank ofBoston, and the Board of Governors of the Federal Reserve System.
NONFARM EMPLOYMENT ESTIMATESNonfarm employment estimates are derived from a survey of businesses to measure jobs by industry. The estimates include all full- and part-time wage and salary employees who worked during or received pay for the pay period which includes the 12th of the month. Excluded fromthese estimates are proprietors, self-employed workers, private household employees and unpaid family workers. In some cases, due to spaceconstraints, all industry estimates are not shown. Call (860) 263-6275 for a more comprehensive breakout of nonfarm employment estimates.These data are developed in cooperation with the U.S. Department of Labor, Bureau of Labor Statistics.
UI COVERED WAGESUI covered wages is the total amount paid to those employees who are covered under the Connecticut’s Unemployment Insurance (UI) law forservices performed during the quarter. The fluctuations in the 1992-93 period reflect the effect of the changes in the tax law and the massiverestructuring in the state’s economy.

ECONOMIC INDICATORS AT A GLANCE
Leading Employment Index .......... +4.1Coincident Employment Index ....... -1.4Leading General Drift Indicator ..... +3.7Coincident General Drift Indicator . -3.5Farmington Bank Bus. Barometer . -2.4Phil. Fed’s CT Coincident Index .... +0.8
Total Nonfarm Employment ........... -0.5
Unemployment Rate ..................... +0.7* Labor Force ................................... +0.3 Employed ........................................ -0.5 Unemployed .................................. +9.0
Average Weekly Initial Claims ...... -21.6Avg Insured Unempl. Rate .......... -0.91*U-6 Unemployment Rate .............. +3.7*
Average Weekly Hours, Mfg .......... +3.0Average Hourly Earnings, Mfg ...... +2.0Average Weekly Earnings, Mfg ..... +5.0CT Mfg. Production Index ............... -9.3 Production Worker Hours ............... +0.8 Industrial Electricity Sales ............. -15.5
Personal Income ............................ +1.7UI Covered Wages ......................... +0.5
Business Activity New Housing Permits .................... +8.0 Electricity Sales............................... -1.9 Construction Contracts Index .......... -2.9 New Auto Registrations ................ +12.9 Air Cargo Tons ................................. NA Exports .......................................... +4.7 S&P 500: Monthly Close .............. +18.5
Business Starts Secretary of the State ...................... NA Dept. of Labor ............................... -18.3
Business Terminations Secretary of the State ...................... NA Dept. of Labor ............................... -31.5
State Revenues .............................. +4.0 Corporate Tax .................................. -1.8 Personal Income Tax ...................... +5.3 Real Estate Conveyance Tax ........ +60.4 Sales & Use Tax .............................. -5.4 Indian Gaming Payments ................. -4.9
Tourism and Travel Info Center Visitors ....................... -11.1 Attraction Visitors ........................... +2.7 Air Passenger Count ........................ NA Indian Gaming Slots ........................ -6.5 Travel and Tourism Index ............... -6.7
Employment Cost Index (U.S.) Total .............................................. +1.6 Wages & Salaries .......................... +1.5 Benefit Costs ................................. +2.0
Consumer Prices U.S. City Average .......................... +2.0 Northeast Region ........................... +2.6 NY-NJ-Long Island......................... +2.2 Boston-Brockton-Nashua ............... +2.7
Interest Rates Prime ............................................ 0.00* Conventional Mortgage ............... +0.03*
Mailing address:
Connecticut Economic DigestConnecticut Department of Labor
Office of Research200 Folly Brook Boulevard
Wethersfield, CT 06109-1114
THE CONNECTICUT ECONOMIC DIGEST
*Percentage point change; **Less than 0.05 percent; NA = Not Available
The Connecticut Economic Digest is available on the internet at:
http://www.ctdol.state.ct.us/lmi
July 2010
(Percent change from prior year; see pages 5-8 for reference months or quarters)
THE CONNECTICUT
A joint publication of The Connecticut Departments of Labor and Economic and Community Development
ECONOMIC DIGEST
If you wish to have your name removed from our mailing list, pleasecheck here and return this page (or a photocopy) to the address at left.
If your address has changed, please check here, make the necessarychanges to your address label and return this page to the address at left.
If you receive more than one copy of this publication, please checkhere and return this page from the duplicate copy to the address at left.
NEED A COPY OF THE CONNECTICUT ECONOMIC DIGEST?
To receive a staple-bound, color copy of the Digest each month,please download the subscription order form athttp://www.ctdol.state.ct.us/lmi/misc/ctdigest.htm
For further information, please call the Office of Research at (860)263-6290, or send an e-mail to [email protected].