the composite index: a divergence analysis …aeroinvest.com/composite_index.pdf · 14-period rsi...
TRANSCRIPT

The Composite Index/Brown/2015 October 2015
THE COMPOSITE INDEX: A DIVERGENCE ANALYSIS STUDY
A thesis submitted in fulfillment of the requirements for the certification
MASTER OF FINANCIAL ANALYSIS (MFTA)
By
CONSTANCE M. BROWN, CMT OCTOBER 2015
ABSTRACT Asset managers often use normalized oscillators such as Wells Wilder’s Relative Strength Index
(RSI)1 and Gerald Appel’s Moving Average Convergence/Divergence Oscillator (MACD) 2 to
enhance their fundamental metrics. Normalized oscillators travel in a fixed range between zero
and 100. The expectation is that these normalized oscillators will display a divergence away from
the developing price trend in order to warn of an approaching trend reversal. However, a common
problem in Global Equity Indexes is that the RSI oscillator frequently fails to show any
divergence. As a result there is no warning in long horizon trends of a major price reversal up or
down.
This paper will demonstrate how imbedding a Momentum formula within the Relative
Strength Index will significantly improve the trend reversal signal and timing characteristics of
this oscillator. The method has benefits for shorter-horizon traders as well.
ii

The Composite Index/Brown/2015 October 2015
LIBRARY OF CONGRESS
Copyright United States Copyright Office
Brown, Constance M.
Type of Work: Computer File Registration Number / Date: TX0005244690 / 1999-05-19
Application Title: Computer index computer program code. Title: Computer program code for the Composite Index / Constance M. Brown
Date of Creation: 1996
iii
Copyright© by
CONSTANCE M. BROWN
2015

The Composite Index/Brown/2015
October 2015
ACKNOWLEDGEMENTS I would like to take this opportunity to thank the mentors that gave me the skills to enjoy
nearly 30 years longevity in this industry. When it is a love and passion you never view the
analysis of global markets as work. How do you do justice to the people who guided you to
such a career? I believe the answer is in the quality of your work, the time you re-invest to train
others, and then the joy it brings to watch as they too develop their own career paths.
Manny Stoller was my boss and first mentor. If there is anyone whom I must
acknowledge for the Composite Index3; it is Manny. He was on the 105th floor of the North
Tower and took me in as a total novice when no one would help. With grace he heard endless
questions asked of him and then he asked follow-up questions that forced me to think, explore,
and grow in my abilities. The Composite Index was the answer to such a question. Telerate’s
TeleTrac system was a DOS based program limited to 8 fixed postage stamp sized frames.
When I wanted to add a 9th window, it was Manny who said you must learn how to combine
and imbed formulas to solve the problem. The result was imbedding Momentum within RSI and
discovering a solution that far exceeded the original problem. The resulting formula I personally
installed into the computer of an RSI specialist, who then tried to reintroduce it as his own. The
lesson for all is to keep careful records of your own work, Copyright new findings, (it has a 4
year wait period to allow for outside claims), then record in public how you intend it to be used
and the methodology of how it was developed.
iv

The Composite Index/Brown/2015
October 2015
George Lane taught me a valuable survival lesson that applies today. He said the single
greatest mistake a trader can make is buy too large a home that adds stress. The stress about
consistent payments will change your trading skills to such an extent; you jeopardize your very
roots. So live where you can be happy if you never make a trade for an entire year. It has been
invaluable advice and made the tough years always more manageable.
Joe DiNapoli taught me the risk management skills that bought me the time needed to
learn. He said there are three critical factors; experience, skill, and risk management. When you
begin the only element you can hold onto for your survival is risk management. Joe introduced
me to the concept of Fibonacci confluence and taught me stop placement. While my methods
evolved with time and experience, it is the use of confluence targets that allowed me to enjoy a
long career.
Bruce Kamich, CMT has always offered an invitation and a patient ear to listen and offer
guidance whenever I was in New York. It was Bruce who signed my CMT certification when
he was the President. I have always respected his skill and warm encouragement.
Bob Prechter, CMT I can still see clearly when we first met. I was attending a monthly
MTA meeting in New York City in the mid-1980s. I was a “groupie”. I hung around after the
meeting asking tons of stupid questions when Bob asked, “Would you like to join us for
dinner?” I kept pinching myself as the table began to fill with the giants I had only known
through FNN.(pre-CNBC) Bob Prechter, John Murphy, Ralph Acampora, Manny Stoller, Steve
Nison, Bruce Kamich and John Brooks. That single dinner ignited a passion that still carries on
today.
v

The Composite Index/Brown/2015
October 2015
I want to thank Rolf Wetzer, Ph.D., President of IFTA. Rolf gave me the much needed
push to move forward and develop the current work behind this paper. He also clearly stated the
methodology was most critical. Therefore, greater effort and focus was made to be transparent
and detailed about the testing criteria. The result includes a finding that was unconsciously used
for many years as a trader, but was never consciously defined until now.
I would also like to thank Tim Every and Akhil Patel, advanced professional traders, for
their time to review the draft copy. One always needs knowledgeable readers to show where a
clarification is needed. Readers who develop systems will want more on the divergence signal
itself within Market-Analyst software. Components of that tool will be proprietary such as the
filtering and sensitivity code. For this reason there is no further discussion about the code itself.
Please contact Market-Analyst for questions about their software.
vi

The Composite Index/Brown/2015
October 2015
Page 23
TABLE OF CONTENTS
Page
ABSTRACT…………………………………………………………………….. ii
ACKNOWLEDGEMENTS…………………………………………………… iv
LIST OF FIGURES………………………………………………………….. viii
LIST OF TABLES………………………………………………………………ix
1 INTRODUCTION………………………………………………….
1.1 Composite Index Oscillator ………………………………………1
1.2 Composite Index Formula………………………………………..…2
2 METHODOLOGY
2.1 Divergence Analysis…………………………………………….…3
3 RESULTS………………………………………….…………...….6
4. DISCUSSION……………………………….……………………17
5. CONCLUSION…………………………………………………. 21
6. REFERENCES ………………………………………………… 22
vii
The Composite Index/Brown/2015
October 2015
LIST OF FIGURES
Page
Figure 1 German Dax 1984 to 2015 ……….………………………...………………..…….. 6
Figure 2 French CAC 40 Index 1990 to 2015 ……………………………………….………. 7
Figure 3 China Shanghai Composite 1995 to 2015 …..…………………..……………....……8
Figure 4 Dow Jones Industrial Average 1981 to 2015……………………..……….…. ........ 10
Figure 5 Dow Jones Industrial Average 1951 to 1982………………………………………. . 10 Figure 6 Dow Jones Industrial Average 1919 to 1951……………………..……….…. ......... 11 Figure 7 10-Year U.S. Gov’t Bond Yields 1990 to 2015…………………..……….…. ......... 13
Figure 8 10-Year U.S. Gov’t Bond Yields 1966 to 1990…………………..……….…. ......... 14 Figure 9 10-Year Japanese Gov’t Bond (Floor Only – TSE) 1966 to 1990….……….…........ 15 Figure 10 EURUSD May 2011 to August 2015…………………..……….…. ....................... 18 Figure 11 German Dax 1986 to 2015 (Composite with MACD)…………..……….…. ......... 19 Figure 12 German Dax (left) and DJIA (right) Showing Divergence Tool Settings in Market-Analyst 8…………..……….…. .................................................................................. 20
viii

The Composite Index/Brown/2015
October 2015
LIST OF TABLES
Page
Table 1 German DAX ……………………………………..…..……………………..…….. 3, 7
Table 2 French CAC 40……………………..………………………………………………. 8
Table 3 China Shanghai Composite ………………….………………………………....……9
Table 4 Dow Jones Industrial Average ….…………….………..……….…………………. 11
Table 5 10-Year US Government Note…………………………………… ............................. 14 Table 6 10-Year Japanese Government Bond……………………..……….…. ....................... 16
ix

The Composite Index/Brown/2015
October 2015
INTRODUCTION 1.1 COMPOSITE INDEX OSCILLATOR
The Composite Index 3 oscillator was developed by Connie Brown under the guidance
of Manny Stoller. The problem we faced several decades ago is still present today; the Relative
Strength Index, as developed by Welles Wilder 2, does not develop oscillator divergences
against long-horizon price data. The failure to display divergence signals against price is costly
for asset managers as major trend reversals can occur without any warning from this widely
relied upon indicator.
The Market Technician Association’s Journal of Technical Analysis (Winter 1993-
Spring 1994; 42: p45) published The Derivative Oscillator: A New Approach for an Old
Problem by Connie Brown.4 This early work introduced a triple smoothed derivative of RSI
plotted as a histogram. The formula imbedded a smoothed short 3-period RSI within a standard
14-period RSI as developed by Welles Wilder. The character of the Derivative Oscillator was
found to provide less noise and more clearly defined amplitude signals to aid the development
of Elliott Wave Principle interpretations. The results found the simple histogram was free
ranged and the first maximum extremes mapped with third-of-third wave positions. The
divergence amplitude mapped to the fifth wave positions. This was repeatable. However, the
conventional 14-period RSI did not display any divergence at similar pivot points.
From this work in 1991, Manny Stoller of Cantor Fitzgerald asked me to develop this
concept further by imbedding other formulas into the oscillator in an effort to find a possible
solution for the divergence problem we clearly observed within the RSI.
1

The Composite Index/Brown/2015
October 2015
The Composite Index oscillator is the solution to this RSI divergence problem for asset
managers and traders. The Composite Index against the RSI is tested with the long horizon
price data of the German Dax, French CAC 40 Index, China Shanghai Composite Index, Dow
Jones Industrial Average, 10-Year U.S. Government Bond Yields, and the 10-Year Japanese
Government Bonds.
1.2 COMPOSITE INDEX FORMULA
The Composite Index formula is as follows; (Omega TradeStation format)1:
Plot1(RSIMO9+RSI3,"Plot1");
Plot2(average((plot1),13),"Plot2");
Plot3(average((plot1),33),"Plot3");
The function RSIMO9 is written; RSIMO9 = MOMENTUM(RSI(CLOSE,14),9)
The second function is written RSI3=AVERAGE(RSI(CLOSE,3),3)
This paper excludes the moving averages in ‘Plot2’ and ‘Plot3’ so that the Composite Index
formula, with the imbedded Momentum formula, can be studied in-depth against the conventional
14-period RSI oscillator. Momentum is a simple comparison. The embedded 9-period Momentum
in the Composite Index, is the comparison between the most recent 14-period RSI value to the RSI
value from 9 periods earlier. By imbedding Momentum into the RSI formula it allows the RSI to
have a free range travel and is not limited to the normalized range of zero to 100.
1 The Composite Index is now a standard tool in Market-Analyst. Bloomberg will add it by request. It is also now in the public domain for eSignal and CQG.
2

The Composite Index/Brown/2015
October 2015
METHODOLOGY
2.1 DIVERGENCE ANALYSIS
TABLE 1. German DAX – Divergence Analysis Test Criteria
Divergence is determined by applying a linear regression test. A 6-bar linear regression
comparison is made between the Composite Index and RSI by the Market-Analyst6 tool called
‘Divergence (DIV)’. TABLE 1 shows how column ‘A’ will record the signal date when
divergence is identified by Market-Analyst software. The settings have to be changed from the
default comparison between the oscillator and the price data so that the comparison occurs
between the Composite Index and RSI. (Figure 12)
Cell (D:7) in TABLE 1 records the number of indicator periods that are used for each
linear regression test. Column D records a ‘Buy’ signal when the Composite Index has a
positive divergence to RSI. A ‘Sell’ signal occurs when the Composite Index has a negative
divergence to RSI.
3

The Composite Index/Brown/2015
October 2015
A 6-bar linear regression setting is a minimum. The program will examine the 7th value and
elongate the highlight box on the chart as long as the divergence continues.
When divergence between the Composite Index and RSI is identified, it would be
undesirable if the signal should fall within a trending price swing. Price swings are drawn on the
price data by using an analysis tool called the ‘Percent Swing Overlay’ (PCSC). Two conditions
must be met before the trending swing can be reversed.
The first condition is when ‘Bars= 3’. A swing reversal condition is ‘True’ only after a
minimum 3-bar reversal. In a 2-month bar chart a swing reversal can only occur after a 6-month
period that is a desirable holding period for most fund managers. Equity Indexes all required a 3-
bar reversal. U.S. Treasury Note Yields and Japanese Government Bonds required “Bars” to be set
at ‘1’ as the next test was found to be more important.
The second condition for a price swing reversal to occur is the retracement percentage
minimum. When ‘Percent’ equals 9.0, as was used in all the equity indexes tested, it means if the
start of the swing is a high; 9 percent is calculated by High – (High x 0.09). If the prior swing
length equals $100 then there must be at least a $9 retracement to trigger a new swing. The swing
is the blue and green line drawn through the price data in all Figures connecting swing low to high
or high to low. When the divergence signal between oscillators develops at a price low, Low +
(Low x 0.09) is used for a 9 percent reversal. Column E will record the price high (H) or low (L)
nearest the actual divergence signal. A divergence signal must occur within 2 bars of a new price
swing. If the signal occurs later it is marked as a ‘failed’ signal.
Column “B” in Table 1 records the price range of the swing preceding the divergence
signal that is used to calculate the retracement percentage.
4

The Composite Index/Brown/2015
October 2015
As it is undesirable to have a divergence signal that immediately fails when prices break
through the signal price, Column F was added called: ‘# Bars (after pivot) Swing H/L Exceeded.
Cell (F:7) in TABLE 1 shows (> H/L3?). A tool in Market-Analyst 8 called ‘Pivot Labels’ will
count how many bars forward will develop before that specific pivot high (H) or pivot low (L) is
exceeded. A divergence signal will ‘fail’ in this test if the buy price is exceed or the sell price is
penetrated to the downside after 3 bars or less. Figure 1 is a 2-month German Dax bar chart with
Pivot Labels. Within Figure 1 a horizontal line has been drawn between the pivot label showing
‘H44’ on March 1, 2000, and the price high on July 1, 2007. This is an example to show how the
pivot price was exceeded 44 bars later. Each swing will have a pivot label. If column F shows
‘active’ the price pivot has not been retraced or broken by the market.
Column G in all the Tables will record the price move after the divergence signal. Column
H will record the percentage retracement following the divergence signal as compared to the price
range of the prior swing in Column B. Column G will be red, denoting a failure, if the percent
retracement is less than 35.0%. The 35% value was consciously selected to be under the common
Fibonacci retracement ratio of 38.2%. The last Column ‘I’ will show a ‘failed’ label if any of the
divergence tests are found not to be true. When all the criteria has been met as described for
columns C, F, and H, the label ‘passed’ will be found in the results column for the signal in
Column I. Failed signals will also have comments on the bottom right of each table to clarify the
tests that triggered a ‘failed’ result.
5

The Composite Index/Brown/2015
October 2015
RESULTS
These results summarize my findings of the divergence study. Each market tested will
have a chart or charts to show the divergence signals extracted by Market-Analyst’s linear
regression formula over the dates in question. The charts are always followed by summarized
supporting tables. This section only displays the results of the Composite Index study and the
interpretation will be found in the next section called “Discussion’.
FIGURE 1. German DAX – 2-month Bar Chart with Linear Regression Divergences, Pivot Labels, and Percent Swing Overlay. (1984 – 2015)
6

The Composite Index/Brown/2015
October 2015
TABLE 1. German DAX
From 1984 to 2015 the German Dax triggered 5 divergence signals in the 2-month bar chart. Four
signals were “Sell” signals and one was a “Buy” signal. One signal remains open as the signal
remains active in current markets. The four closed signals all had a “passed’ result.
FIGURE 2. French CAC 40 Index – 2-month Bar Chart with Linear Regression Divergences, Pivot Labels, and Percent Swing Overlay. (1990 – 2015)
7

The Composite Index/Brown/2015
October 2015
TABLE 2. French CAC 40 Index – 2-month Bar Chart Divergence Signal Analysis From 1990 to 2015 the French CAC 40 Index triggered 5 divergence signals in a 2-month bar chart.
Three signals were ‘Sell’ signals and two were ‘Buy’ signals. One signal remains open as the signal remains
active in current markets. Of the four closed signals, three passed and one failed because the divergence
signal was trigger in the middle of a long horizon swing.
FIGURE 3. China – Shanghai Composite monthly Bar Chart with Linear Regression Divergences, Pivot Labels, and Percent Swing Overlay. (1995 - 2015)
8

The Composite Index/Brown/2015
October 2015
TABLE 3. China Shanghai Composite Index – monthly Bar Chart Divergence Signal Analysis
From 1995 to 2015 the China Shanghai Composite Index triggered seven divergence signals in a
monthly bar chart. Of the seven signals four were ‘Buy’ signals and three were ‘Sell’ signals. The
most recent ‘Sell’ signal remains open as the signal remains active. Five divergence signals passed.
One failed because the percentage retracement did not met the trend retracement criteria of greater
than 35%. The retracement was 30.46 percent. A monthly bar chart was used due to the limited
historical data for this market.
9

The Composite Index/Brown/2015
October 2015
FIGURE 4. Dow Jones Industrial Average – 2-month Bar Chart with Linear Regression Divergences, Pivot Labels, and Percent Swing Overlay. (1981 – 2015)
FIGURE 5. Dow Jones Industrial Average – 2-month Bar Chart with Linear Regression Divergences, Pivot Labels, and Percent Swing Overlay. (1951 – 1982)
10
The Composite Index/Brown/2015
October 2015
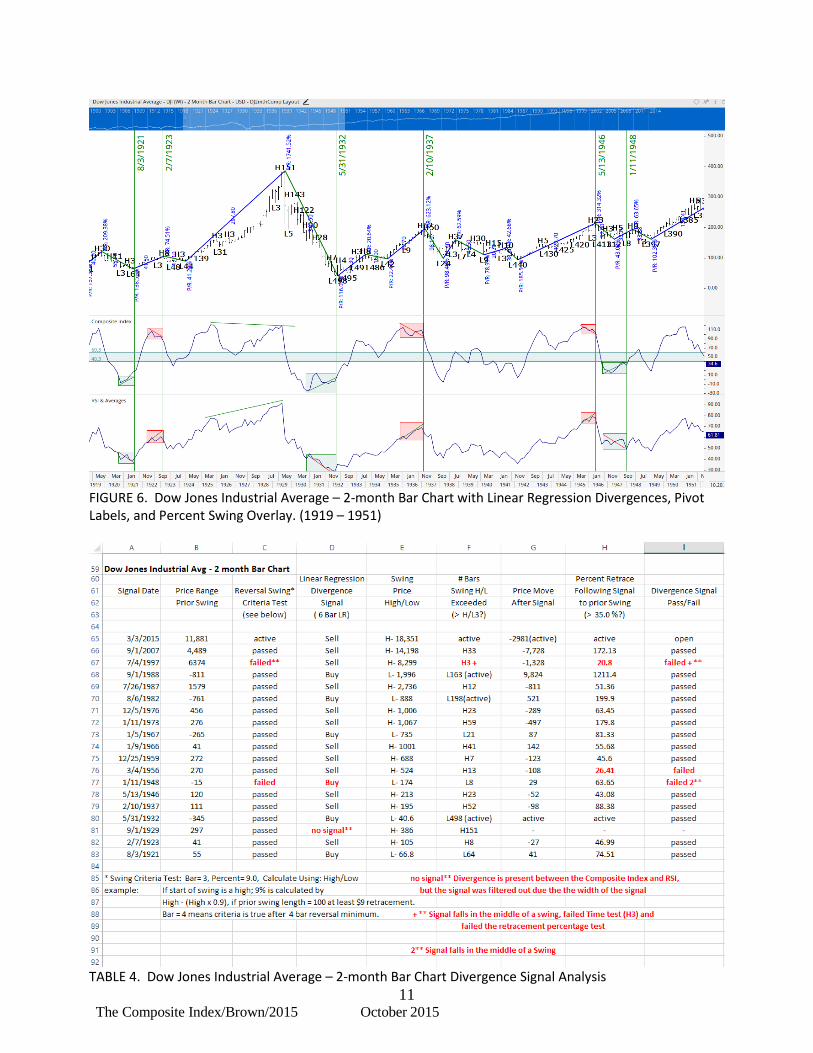
FIGURE 6. Dow Jones Industrial Average – 2-month Bar Chart with Linear Regression Divergences, Pivot Labels, and Percent Swing Overlay. (1919 – 1951)
TABLE 4. Dow Jones Industrial Average – 2-month Bar Chart Divergence Signal Analysis
11

The Composite Index/Brown/2015
October 2015
From 1919 to 2015 the Dow Jones Industrial Average triggered eighteen divergence signals in a 2-
month bar chart. Of the eighteen signals, six were ‘Buy’ signals, and twelve were ‘Sell’ signals.
The most recent ‘Sell’ signal remains open as the signal remains active. Fourteen divergence
signals passed. Three signals failed. One signal failed for multiple reasons. The signal on July 4,
1997 failed because it was triggered further than the 2 bar minimum after a swing reversal. It also
failed because the price high was exceeded 3 bars later when the criteria was set to a 3 bar
minimum. The sell signal lead to a 20.8 percent decline and did not met the 35% retracement
minimum of the previous swing. The signal on 1/11/1948 followed too late after the start of the
new swing, though the signal did yield a 63.65 percent retracement of the prior swing.
Because of the historic price high of September 1, 1929, this date was added to Table 4.
Figure 6 shows a hand drawn divergence signal recording a divergence into this date, but a filter
was established within the Composite Index of 40 to 60. This means any value in the linear
regression that falls within this band is filtered out and regression starts a new count. Therefore a
result of ‘no signal’ is in Column D for this date because the Composite falls to this filtered range.
This was done to filter any signal that had an exceptionally long divergence pattern and the filter
acted as a time variable within the regression test. This filter was only applied to the DJIA.
12

The Composite Index/Brown/2015
October 2015
FIGURE 7. 10-Year U.S. Treasury Note Yields – 2-month Bar Chart with Linear Regression Divergences, Pivot Labels, and Percent Swing Overlay. (1990 - 2015)
13

The Composite Index/Brown/2015
October 2015
Figure 8. 10-Year U.S. Treasury Note Yields – 2-month Bar Chart with Linear Regression Divergences, Pivot Labels, and Percent Swing Overlay. (1966 - 1990)
TABLE 5. 10-Year U.S. Treasury Note Yields – 2-month Bar Chart Divergence Signal Analysis
14

The Composite Index/Brown/2015
October 2015
From 1966 to 2015 there were seven divergence signals in a 2-month 10-Year U.S. Treasury Note Yields bar
chart. Three signals were ‘Sell’ signals and four were ‘Buy’ signals. All seven signals produced percentage
retracements greater than 35% relative to the prior swing preceding the divergence signal.
FIGURE 9. 10-Year Japanese Gov’t Bond (Floor Only) TSE - monthly Bar Chart and Percent Swing Overlay. (1992 - 2015) (Divergences visually determined.)
15

The Composite Index/Brown/2015
October 2015
TABLE 6. 10-Year Japanese Gov’t Bond (Floor Only) TSE – monthly Bar Chart Divergence Signal Analysis During the writing of this paper numerous observations were made during the Beta testing period
of the software that led to changes. When the monthly Japanese Government Bond (JGB) market
was tested the Divergence tool was not the same as the markets tested in Figures 1 through 8.
Therefore these results are added for information purposes only and will not be considered in the
discussion or conclusion sections. The divergence signals were determined visually by comparing
where the Composite Index diverged from the RSI. However the signal still had to be near a swing
pivot and exceed a 35% retracement of the prior swing.
From 1992 to 2015 there were six divergence signals. Four were ‘Sell’ signals and two
were ‘Buy’ signals in the JGB monthly bar chart. Only one divergence signal failed as it
developed within a trending price swing and the price was exceeded two bars later.
16

The Composite Index/Brown/2015
October 2015
DISCUSSION
While the results are very favorable for the Composite Index compared to the RSI, this
study is going to immediately raise a question for the reader who is in a trading environment.
‘Does the Composite Index provide divergence signals when the RSI does not in other markets
and in other time frames? The author is a global Equity Index specialist. It has only been used in
financial markets and specifically with financial futures contracts for trading. Experience has
shown that the Composite Index can be used within long horizon and short horizon time frames.
However, charts displaying long horizon Government Treasury market data will find that the
Composite Index will have more frequent and timely divergences if the oscillator is applied to
yields. Though traders will find it of value in treasury futures markets in shorter horizon charts of
weekly and shorter intervals because the trends are more distinctive in these shorter time periods.
Intraday signals of divergence have been observed for nearly 30 years on S&P500 futures.
In this market the Composite Index has had extensive real-time use.
Consider Figure 10 showing the EURUSD in a 2-day bar chart. The divergence signals
between the Composite Index and RSI have been marked in Figure 10. The favored time period is
a 2 or 3-day bar chart because this interval is favored by Gann analysts. The 2 or 3-day bar chart
will help develop Elliott wave interpretations. But always pair the signal with a longer period
chart, such as a 2-day against a weekly chart, or a weekly against a monthly chart. The time ratio
of 1:4 is used for intraday comparisons. As example a 240-minute chart against a 60-minute
chart. When both charts show divergence signals there is a very high probability of a near trend
reversal.
17

The Composite Index/Brown/2015
October 2015
The Composite Index can be used alone under price data as that is the same divergence
pattern. It does not have to be a comparison between the RSI and Composite Index to generate the
divergence signal.
FIGURE 10. EURUSD – 2-day Bar Chart with Pivot Labels and Divergence Signals between Composite Index and RSI. (including simple moving average on the oscillators)
Because the Composite Index can oscillate freely to an unrestricted amplitude high or
low, it is important to draw horizontal lines on the oscillator when these extremes have occurred.
Historic extremes in the DJIA, such as the start of World War I, World War II, 2008, move the
Composite Index to new extreme lows, but then the DJIA used these prior panic extremes as
meaningful support levels before launching new rallies.
18

The Composite Index/Brown/2015
October 2015
The Composite Index can be used for developing Elliott Wave Principle5 patterns. The
Composite Index will form the maximum displacement at a third-of-third Elliott wave. The
divergence comes with the fifth of a third wave. A second divergence with the third oscillator
peak at the final fifth wave. This has been a major help for the author for many years.
Many investors and traders couple RSI with MACD. The purpose and expectation for
this is to use the faster oscillating RSI against the longer MACD to improve timing. However,
the failure of RSI to develop divergence signals at critical junctions is a problem for them.
FIGURE 11. German Dax 2-mth Bar Chart with Composite Index and 5/25/5 MACD Consider the German DAX 2-month bar chart in Figure 11. The Composite Index has
19

The Composite Index/Brown/2015
October 2015
replaced the RSI that is normally plotted over the MACD. In Figure 11 a 5/25/5 period MACD is
being used.
The Composite Index may offer a stronger pairing with MACD due to the ability of the
oscillator to form divergence signals where the RSI consistently showed a problem exists.
FIGURE 12. 2-month German Dax (left) and 2-month DJIA (right) displaying the final Divergence tool in Market-Analyst.
Figure 12 shows a long-horizon 2-month bar chart again for the German DAX and DJIA.
One of the lessons learned from this study was divergence does not always have to be a comparison
between diverging oscillator peaks. Consider the sharp price drop in the DJIA in 2008. Market-
Analyst in this final version of the Divergence tool is able to define divergences when a sharp ‘V’
pattern develops. In hindsight, the author has always recognized this to be a form of divergence,
but never had the tools to present the pattern in a provable way. Sharp ‘V’ bottoms or tops in the
Composite Index versus the conventional ‘W’s and ‘M’s in the RSI should be read as divergence
between these oscillators because the RSI is lagging.
20

The Composite Index/Brown/2015
October 2015
CONCLUSION
The conclusion that should first be made is that the Relative Strength Index displayed a
serious problem across six markets in long-horizon charts by failing to develop a divergence
signal forty-two times (excluding the six additional JGB’s signals). In most cases the failure to
provide a warning signal in this study was followed by a major price trend reversal that would
have been extremely costly for asset managers.
The Composite Index triggered 17 ‘Buy’ signals and ‘25’ Sell signals for a total 42
divergences against the RSI. It can be suggested that anyone currently using RSI would benefit
from adding the Composite Index to their screen. Four signals remained open today because the
market has neither triggered a pass or fail result, though the current markets after these signals
have experienced corrections. Thirty-three signals passed while only 5 failed. The Composite
Index showed an exceptional performance in the long-term horizon of monthly or 2-month bar
charts.
21

The Composite Index/Brown/2015
October 2015
REFERENCES 1 Wilder, Welles J., New Concepts in Technical Trading Systems, 1978, 2 Appel, Gerald., Technical Analysis: Power Tools for Active Investors, 2005, page 165 3 Brown, Constance M., Technical Analysis for the Trading Professional, Second Edition McGraw-Hill, 2012, page 369 4 The Market Technician Association’s Journal of Technical Analysis (Winter 1993-Spring 1994; 42: p45) The Derivative Oscillator: A New Approach for an Old Problem by Connie Brown. A copy of this paper can be downloaded from www.aeroinvest.com/books.htm 5 Frost, A.J., and Prechter, Robert R., Elliott Wave Principle: Key to Market Behavior, 2005 6 Market-Analyst Software, Version 8 is available from http://www.mav7.com/
22