the complementary between technology and human … · the complementary between technology and...
TRANSCRIPT

The Complementary between Technology and Human Capital inthe Early Phase of Industrialization ∗
Raphael Franck† and Oded Galor‡
This Version: April 16th, 2015
Abstract
The research explores the effect of industrialization on human capital formation. Ex-ploiting exogenous regional variations in the adoption of steam engines across France,the study establishes that in contrast to conventional wisdom that views early industri-alization as a predominantly deskilling process, the industrial revolution was conducivefor human capital formation, generating broad increases in literacy rates and educationattainment.
Keywords: Capital-Skill Complementarity, Economic Growth, Industrialization, HumanCapital, Steam Engine.
JEL classification: N33, N34, O14, O33.
∗We thank Mario Carillo, Pedro Dal Bo, Martin Fiszbein, Gregory Casey, Marc Klemp, Stelios Michalopoulos,Assaf Sarid, Yannai Spitzer and David Weil for helpful discussions. We thank Guillaume Daudin for sharing his datawith us.
†Department of Economics, Bar-Ilan University, 52900 Ramat Gan, Israel & Marie Curie Fellow at the Departmentof Economics at Brown University. Tel: 972-3-531-8935, Fax: 972-3-738-4034, [email protected]
‡Herbert H. Goldberger Professor of Economics, Brown University, Department of Economics, 64 Waterman St,Providence RI 02912 USA. Oded [email protected].

1 Introduction
While it is widely recognized that technology-skill complementarity has characterized the nature of
technology in advanced stages of development, the predominant view has been that the industrial
revolution in its early phases has largely been a deskilling process (Mokyr, 1993; Goldin and Katz,
1998; Acemoglu, 2002). This deeply entrenched view of the nature of the industrial revolution
has been based on anecdotal evidence that has focused nearly exclusively on the adverse effect
of factories and the assembly line on artisans.1 Indeed, the industrial revolution was associated
with the destruction of these old skills. Nevertheless, as has been the case in any technological
revolution that is associated with creative destruction, it is not implausible that the industrial
technology generated a demand for new skills while rendering existing ones obsolete.
The research explores the effect of industrialization on human capital formation. In contrast
to conventional wisdom that views early industrialization as a predominantly deskilling process,
the study establishes that the industrial revolution was conducive to human capital formation,
generating broad increases in literacy rates and education attainment. The research therefore lends
further credence to the emerging view that human capital was instrumental in the transition from
stagnation to growth (Galor, 2011).2
The study utilizes French regional data from the first half of the 19th century to explore the
impact of the adoption of industrial technology on human capital formation. It establishes that
regions which industrialized earlier experienced a larger human capital formation. Nevertheless,
the observed relationship between industrialization and human capital formation may reflect the
persistent effect of pre-industrial characteristics (e.g., economic, institutional and cultural forces)
on the joint evolution of industrialization and human capital formation. Thus, the research exploits
exogenous regional variations in the adoption of steam engines across France to assess the effect of
industrialization on human capital formation.3
In light of the use of the steam engine in the early phase of industrialization (Mokyr, 1990;
Bresnahan and Trajtenberg, 1995; Rosenberg and Trajtenberg, 2004), the study exploits the his-
torical evidence regarding the regional diffusion of the steam engine (Ballot, 1923; See, 1925; Leon,
1976) to identify the impact of regional variations in the number of steam engines in 1839-1847 on
human capital formation. Specifically, it exploits the distances between the administrative center of
each French department and Fresnes-sur-Escaut, where a steam engine was first used for industrial
1This deeply entrenched view regarded literacy as largely a cultural skill or a hierarchical symbol with a limitedrole in the production process in the first stage of industrialization (Mitch, 1992).
2Squicciarini and Voigtlander (2016) explore the effect of the distribution of human capital on the process ofindustrialization and establish that the upper tail of the human capital distribution was conductive to the industrialrevolution in France in the post-1750 period.
3A steam engine was first employed for industrial purposes in a coal mine near Wolverhampton (England) in1712. In the two decades that followed, steam engines were gradually used in different parts of continental Europe.See Mokyr (1990, p.85).
1

purpose in 1732, as exogenous source of variations in industrialization across France.4
The study establishes that the number of steam engines in industrial production in the 1839-
1847 period had a positive and significant impact on the formation of human capital in the early
stages of the industrial revolution. A larger number of steam engines in a given department in
1839-1847 had a positive and significant effect on the number of teachers in 1840 and 1863, on the
share of pupils in the population in 1840 and 1863, as well as on the share of literate conscripts
(i.e., 20-year old men who had to report for military service) over the 1847-1856 and 1859-1868
periods.
The results of the empirical analysis are robust to the inclusion of a wide array of exogenous
confounding geographical and institutional characteristics, as well as for pre-industrial develop-
ment, which may have contributed to the relationship between industrialization and human capital
formation. First, the study accounts for the potentially confounding impact of exogenous geo-
graphical characteristics of each French department on the relationship between industrialization
and investments in education. It captures the potential effect of these geographical factors on the
profitability of the adoption of the steam engine and the pace of its regional diffusion, as well as
on productivity and human capital formation, as a by-product of the rise in income rather than
as an outcome of technology-skill complementarity. Second, the analysis captures the potentially
confounding effects of the location of departments (i.e., latitude, border departments, maritime
departments, and the distance to Paris) on the diffusion of the steam engine and the diffusion of
development (i.e., income and education). Third, the study accounts for the differential level of
development across France in the pre-industrial era that may have had a joint impact on the process
of industrialization and the formation of human capital. In particular, it takes into account the
potentially confounding effect of the persistence of pre-industrial development and the persistence
of pre-industrial literacy rates.
The remainder of this article is as follows. Section 2 provides an overview of schooling and
literacy in the process of industrialization in France. Section 3 presents our data. Section 4 discusses
our empirical strategy. Section 5 presents our main results and Section 6 our robustness checks.
Section 7 provides concluding remarks.
2 Schooling and Literacy in the Process of Industrialization in
France
France was one of the first countries to industrialize in Europe in the 18th century and its indus-
trialization continued during the 19th century. However, by 1914, its living standards remained
4As established below, the diffusion of the steam engines across the French departments, i.e., the administrativedivisions of the French territory created in 1790, is orthogonal to the distances between each department and Paris,the capital and economic center of the country.
2

below those of England and it had been overtaken by Germany as the leading industrial country
in continental Europe. The slower path of industrialization in France has been attributed to the
consequences of the French Revolution (e.g., wars, legal reforms and land redistribution), the pat-
terns of domestic and foreign investment, cultural preferences for public services, as well as the
comparative advantage of France in agriculture vis-a-vis England and Germany (Levy-Leboyer and
Bourguignon, 1990; Grantham, 1997; Crouzet, 2003).
2.1 Schooling in France before and during the industrial revolution
Prior to the French Revolution in 1789, the provision of education in the contemporary French
territory was predominantly left to the Catholic Church, reflecting the limited control of the cen-
tral government and the lack of linguistic unity across the country (Weber, 1976). However, the
evolution of state capacity, national identity, and linguistic uniformity over the centuries intensified
the involvement of the state in the provision of education while diminishing the role of the church
during the 19th century.
2.1.1 Education Prior to the French Revolution
Until the rise of Protestantism in the 16 century, the Catholic Church provided education primarily
for the privileged members of society.(Rouche, 2003). However, the spread of Protestantism, and
the rise in the emphasis on literacy as a means to understand the Holy Scripture, had altered
the attitude of the Catholic Church with respect to the provision of education. The Catholic
educational system had progressively become intertwined with its mission of salvation. Several
religious orders viewed education as their principal mission. The Jesuits had gradually focused
their efforts on the education of children from the aristocratic classes while the Freres des Ecoles
Chretiennes (Brothers of Christian Schools) led by Jean-Baptiste de la Salle (1651-1719) sought
to provide free education to the masses. Moreover, female religious communities (e.g., Ursulines,
Filles de la Charite) provided schooling for girls (Lebrun et al., 2003).
The nature of the education provided by the Church over this period was not subjected to
interference from the central government. In fact, except for the universities which were controlled
by the State from the late 16th century, the various Catholic orders had built an education system
which was independent from the French kings.5 However, the monopoly of the Church in the
provision of education ended abruptly during the French Revolution in 1789.
5Nevertheless, some conflicts over the nature of schooling took place between the Jesuits and the Universities aswell as between various religious Congregations. In particular, the Jesuits were expelled by King Louis XV in 1764and their school network was overtaken by the Oratorians.
3

2.1.2 Education in the Aftermath of the French Revolution
The transformation of the French society during the Revolution in 1789 affected the provision of
education as well. In particular, article 22 of the Declaration of the Rights of Man and of the
Citizen in 1793 explicitly stated that education is a universal right. Nevertheless, the Constitution
of First French Republic (1792-1799) did not underline the role of state-funded secular education.
The demise of the Catholic Church (e.g., the confiscation of its property and the imprisonment and
execution of priests) during the French Revolution devastated its ability to remain the provider of
education, but secular education was nevertheless slow to emerge (Godechot, 1951; Tackett, 1986).
The rise of Napoleon Bonaparte to power (1799-1815) and his interest in maintaining the
relationship with Rome, permitted the Church to regain a prominent position in the provision of
education.6 In particular, according to the education decree of the 17th of March 1808, primary
schooling and teachers training was entirely left to the care of the Freres des Ecoles Chretiennes and
school curriculum was conformed to the teachings of the Catholic Church. However this decree also
created a secular body – the Universite – that was placed in charge with public (secular) education
and contributed to the decline in the Church’s influence in the education system throughout the
19th century (Mayeur, 2003).
After Napoleon’s fall in 1815 and the accession to power of King Louis XVIII (1815-1824),
from the senior branch of the Bourbon family, strengthened initially the educational monopoly of
the Church. In particular, the 29 February 1816 law required local priests to certify the morality
of primary school teachers. However after the 1827 parliamentary election of a more liberal gov-
ernment, primary school teachers were placed under the authority of the Universite, against the
wishes of the Church.
The 1830 Revolution which overthrew King Charles X (1824-1830), Louis XVIII’s brother
and successor, installed King Louis-Philippe I (1830-1848), from the cadet Orleans branch of the
Bourbon family and put in power members of the liberal bourgeoisie who were rather hostile to
the Catholic Church. This led Catholics to lobby for an educational network of their own outside
the control of the State, under the guise of ”freedom of education”. Ultimately, Francois Guizot,
King Louis-Philippe I’s Prime Minister, enacted the 28 June 1833 law which reshaped schooling
in France and enabled the Church to organize its own private education system. In addition,
the Church retained its influence over the curriculum of public schools (e.g., religious instruction
remained mandatory while the Freres des Ecoles Chretiennes were often employed as teachers in
public schools). The organization of secondary schooling became the main point of contention
between the Church and its opponents and it was only after the fall of Louis-Philippe I in 1848 and
the establishment of the Second Republic (1848-1851) that the Church was allowed to organize its
6This state of affairs suited Napoleon Bonaparte because the Concordat (the 1801 treaty which he had signedwith Pope Pius VII and which structured the relationship between the French State and the Church), provided himcontrol over the appointment of bishops.
4
own network of secondary schools while obtaining subsidies from the State and local governments
(15 March 1850 law enacted by Education minister Alfred de Falloux). Moreover towns were not
obliged to fund a public primary school if there was already a private (i.e., Catholic) school in their
jurisdiction, and teachers had to fulfill the religious duties prescribed by the Church (27 August
1851 regulation). Victory Duruy, the education minister of Napoleon III (1851-1870) after 1863,
attempted to counter the decline in public schooling, initiating a conflict between Catholics and
secular politicians which would reach its climax after the establishment of the Third Republic.
2.1.3 Education From the Establishment of the Third Republic to World War I
Following the demise of the Napoleon III’s Empire in 1870 and the establishment of Third Republic
(1875-1940), France became divided between Republicans and Monarchists. The latter received
most of their support from the Catholics who were hostile to the Republic whom they associated
with the persecutions during the 1789 Revolution. This political stance was shared by the clergy
and the laity, as well as by intransigent and liberal Catholics alike. But the Catholic opposition to
the Republic was matched by the Republicans’ hostility to the Church and their determination to
turn France into a more secular society (Franck, 2015).7 In particular, in an attempt to crowd out
Catholic schooling, in the 1880-1890 period the Republicans increased public spending on primary
schooling and in 1881 and 1882 they promoted free, secular and mandatory education until age
13.8 However enrollment in Catholic schools, especially in primary schools for girls, remained high
(Mayeur, 1979).
At the turn of the 20th century, the Republicans realized that their attempt to crowd out
the schooling system of the Church had failed and used their legal power to renew their attacks.
They passed the 1 July 1901 law which, de facto, prevented monks and nuns from teaching, thereby
forcing many Catholic schools to close. Four years later, the Republicans separated Church and
State Franck (2010): the French state protected freedom of conscience but stopped recognizing
official religions and ended subsidies to religious groups. In theory, Catholic schools had become
private institutions outside the scope of the French government’s reach. In practice, however, the
Republicans wanted to control the curricula of Catholic schools. This would be the main point of
contention between Republicans and Catholics until WWI. Thus the bishops’ opposition in 1909 to
the imposition by the State of governmental manuals led Republicans to rally around the ”defense
of secular education”. They passed additional laws pertaining to public schooling attendance and
7For instance, the 27 July 1882 law relegalized divorce.8Before the 20 June 1881 law, all parents but the poorest ones who wanted to enroll their children in school
had to pay fees called retribution scolaire which had been established by the 3 Brumaire An IV (25 October 1795)law. The 20 June 1881 law reestablished free education, which had been first instituted by decrees of the Conventionduring the French Revolution but had been reversed by the 3 Brumaire An IV law. It should be noted that by the1870s, the retribution scolaire only remained significant in rural areas and had been replaced by local taxes in urbanareas.
5

enabled prosecutions against priests who instructed parents not to enroll their children in state-
funded secular schools. Political debates dealing with private religious and public secular schooling
have periodically resurfaced in France after World War I. However they did not stir passions as in
the 1870-1914 period.
2.2 Literacy Rates in France
No data
6.27 - 7.59
7.60 - 15.15
15.16 - 22.13
22.14 - 37.16
37.17 - 64.25
A. Literacy rates in 1686-1690.
No data
5.24 - 14.45
14.46 - 24.78
24.79 - 35.26
35.27 - 66.97
66.98 - 92.18
B. Literacy rates in 1786-1790.
No data
13.35 - 23.36
23.37 - 35.02
35.02 - 47.34
47.34 - 69.45
69.46 - 96.28
C. Literacy rates in 1816-1820.
Note: Literacy is captured by the share of grooms who signed their marriage license during each period.
Figure 1: Pre-industrial literacy rates of French departments
The evolution of literacy and its distribution across French department is rather notable in the
course of industrialization. In 1686-1690, prior to the onset of the industrial revolution in France,
25.9% of grooms could sign their names, reflecting substantial variations in literacy across France
as depicted in Panel A of Figure 1.9 In particular, literacy rates were higher in the regions in the
North and East of France.10
Literacy rates had steadily increased in the subsequent century and 42% of grooms could sign
their names in 1786-1790 and 50.61% in 1816-1820, in spite of the Revolutionary and Napoleonic
wars. As depicted in Panels B and C of Figure 1 regional variations across France remained and
the domination of the Northern and the Eastern regions persisted. However, literacy rates in some
departments had evolved faster than in others, notably in the South (e.g., Aveyron) and the South
East along the Mediterranean Sea (Bouches du Rhone, Var). Moreover, the potential association
between industrialization and literacy is rather apparent. In particular, Aveyron, Bouches du
Rhone and Var were among the most industrialized departments in the South of France.
The increase in literacy rates continued throughout the 19th century and French conscripts
9Data on literacy in France before the mid-19th century is scarce and incomplete. There is however data on thenumber of Frenchmen who could sign their marriage license in 1686-1690, 1786-1790 and 1816-1820 (Furet and Ozouf,1977).
10For a discussion of the cultural, religious and economic factors which potentially explained the regional differencesin the share of literate grooms, see notably Furet and Ozouf (1977); Grew and Harrigan (1991); Diebolt et al. (2005)
6

who could read an write (i.e., 20-year old men reporting for military service in the department
where their father lived) had increased from 54.27% in 1838 to 84.83% in 1881. Thus, a significant
fraction of French were literate even before the adoption of the 1881-1882 laws on mandatory and
free public schooling (Diebolt et al., 2005).
3 Data and Main Variables
This section examines the evolution of industrialization and human capital formation across the
85 mainland French departments, based on the administrative division of France in the 1839-1847
period, accounting for the geographical and the institutional characteristics of these regions. The
initial partition of the French territory in 1790 was designed to ensure that the travel distance
by horse from any location within the department to the main administrative center would not
exceed one day. The initial territory of each department was therefore orthogonal to the pre-
industrial wealth levels and literacy rates while the subsequent minor changes in the borders of
some departments reflected political forces rather than the effect of industrialization, the adoption
of the steam engine and human capital formation. Table A.1 reports the descriptive statistics for
the variables in the empirical analysis across these departments.
3.1 Measures of human capital
The study explores the effect of industrialization on the evolution of human capital in the early
stages of the industrial revolution. It takes advantage of the industrial survey conducted between
1839 and 1847 to assess the short-run impact of industrialization across France on several indicators
of human capital accumulation.
3.1.1 Teachers and pupils
The impact of early industrialization on human capital during the early phase of the industrial
revolution is assessed by the effect of the differential level of industrialization across France on the
number of teachers and pupils in each department.
First, the research examines the effect of industrialization on the number of teachers in each
department. Surveys undertaken in 1840 and 1863 by the French bureau of statistics (Statistique
Generale de la France) indicate that the average number of teachers per department rose from 742
in 1840 to 1243 in 1863. The surveys also show that there was considerable variation in the number
of teachers across departments.
Second, the study explores the impact of industrialization on the number of pupils enrolled
in primary school of each department (per 10,000 inhabitants). Surveys carried out in 1840 and
7

1863 by the French bureau of statistics (Statistique Generale de la France) show that the average
number of pupils in each department (per 10,000 inhabitants) grew from 874 in 1840 to 1179 in
1863, with substantial variation in the number of pupils across France.
3.1.2 Literacy
The impact of early industrialization on literacy during the first phase of the industrial revolution
is captured by its effect on the share of French army conscripts (i.e., 20-year-old men who reported
for military service in the department where their father lived) who could read and write. The
analysis focuses on the share of literate conscripts over the 1859-1868 decade, i.e., individuals who
were born between 1839 (when the industrial survey began) and 1848 (a year after the survey was
completed).11 As reported in Table A.1, 74.0% of the French conscripts were literate over the
1859-1868 period.
3.2 Steam Engines
0 - 10
11 - 18
19 - 39
40 - 565
Fresnes sur Escaut
Figure 2: The distribution of the number of steam engines across departments in mainland France, 1839-1847.
11As a robustness check, Appendix C explores the impact of industrialization on the literacy rate of Frenchconscripts over the 1847-1856 decade: these 20-year old men were born between 1827 and 1836 (i.e., a year beforethe industrial survey began).
8

The research explores the effect of the introduction of industrial technology on human capital.
In light of the pivotal role played by the steam engine during the first industrial revolution, it
exploits variations in the industrial use of the steam engine across France. Specifically, the analysis
focuses on the number of steam engines used in each French department as reported in the industrial
survey carried out by the French bureau of statistics (Statistique Generale de la France) between
1839 and 1847 (see Chanut et al. (2000) for a discussion.)
As shown in Figure 2, and analyzed further in the discussion of the identification strategy in
Section 4, the distribution of the steam engines across French departments in 1839-1847 suggests a
regional pattern of diffusion from Fresnes-sur-Escaut (in the Nord department, at the northern tip
of continental France) where the first steam engine in France was introduced in 1732. The largest
number of steam engines was indeed in the northern part of France. There were fewer in the east
and in the south-east, and even less so in the south-west.12
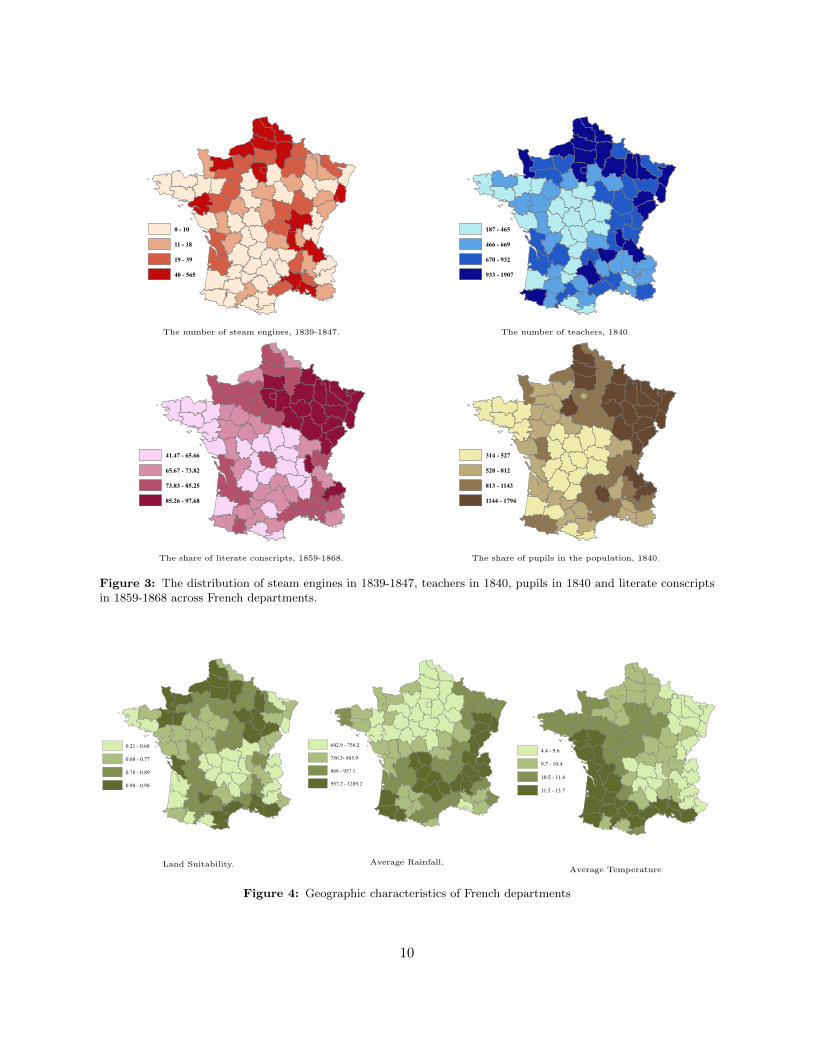
The distribution of steam engines in 1839-1847, teachers in 1840, pupils in 1840 and literate
conscripts in 1859-1868 across French departments is depicted in Figure 3.
3.3 Confounding Characteristics of the Departments
The empirical analysis accounts for observable exogenous confounding geographical and institu-
tional characteristics of each department, as well as for their pre-industrial development, which
may have contributed to the relationship between industrialization and human capital formation.
Geography may have impacted agricultural productivity as well as the pace of industrialization,
and thus income per capita and investments in education. Institutions may have affected jointly
the process of industrialization and the increase in literacy. Besides, geographical and institutional
factors may have affected human capital indirectly by governing the speed of the diffusion of steam
engines across departments. Finally, pre-industrial development may have affected the onset of
industrialization and may have had an independent persistent effect on human capital formation.
3.3.1 Geographic characteristics
The empirical analysis takes into account for the potentially confounding impact of the exogenous
geographic characteristics of each French department (Figure 4) on the relationship between indus-
trialization and human capital. Specifically, it captures the potential effect of these geographical
factors on the profitability of the adoption of the steam engine, on the pace of its regional diffusion
and thus, on human capital accumulation during the first stages of the industrial revolution.
12Seven departments had no steam engine in 1839-1847 (i.e., Cantal, Cotes-du-Nord, Creuse, Hautes-Alpes, Haute-Loire, Lot and Pyrenees-Orientales). In regressions which are available upon request, potential anomalies associatedwith these departments, and in particular regarding the distance of these departments from the threshold level ofdevelopment that permits the adoption of steam engines, are accounted for by the introduction of a dummy variablethat singles them out. The introduction of this dummy variable does not modify the results which are reported below.
9
0 - 10
11 - 18
19 - 39
40 - 565
The number of steam engines, 1839-1847.
187 - 465
466 - 669
670 - 932
933 - 1907
The number of teachers, 1840.
41.47 - 65.66
65.67 - 73.82
73.83 - 85.25
85.26 - 97.68
The share of literate conscripts, 1859-1868.
314 - 527
528 - 812
813 - 1143
1144 - 1794
The share of pupils in the population, 1840.
Figure 3: The distribution of steam engines in 1839-1847, teachers in 1840, pupils in 1840 and literate conscriptsin 1859-1868 across French departments.
0.21 - 0.68
0.68 - 0.77
0.78 - 0.89
0.90 - 0.98
Land Suitability.
642.9 - 756.2
756.3- 865.9
866 - 957.1
957.2 - 1289.2
Average Rainfall.
4.4 - 9.6
9.7 - 10.4
10.5 - 11.4
11.5 - 13.7
Average Temperature
Figure 4: Geographic characteristics of French departments
10

First, the study accounts for climatic and soil characteristics of each department (i.e., land
suitability, average temperature, average rainfall, and latitude (Ramankutty et al., 2002)) that
could have affected natural land productivity and therefore, the feasibility and profitability of the
transition to the industrial stage of development, as well as income per capita and human capital
in each department.
Second, the analysis captures the confounding effect of the location of each department on
the diffusion of development from nearby regions or countries, as well as its effect on the regional
diffusion of the steam engine. Namely, it accounts for the effect of the latitude of each depart-
ment, border departments (i.e., positioned along the border with Belgium, Luxembourg, Germany,
Switzerland, Italy and Spain), and maritime departments (i.e., positioned along the sea shore of
France) on the pace of this diffusion process.
Finally, the research accounts for the potential differential effects of international trade on
process of development as well as on the adoption the steam engine. In particular, it captures by
the potential effect of maritime departments (i.e., those departments that are positioned along the
sea shore of France), via trade, on the diffusion of the steam engine and thus economic development
as well as its direct effect on human capital formation over this time period.
3.3.2 Institutional characteristics
Since the empirical analysis focuses on the impact of variations in the adoption of the steam engine
on human capital formation across French departments, it ensures that institutional factors which
were unique to France as a whole over this time period are not the source of the differential pattern
of human capital across these regions. Nevertheless, one region of France over this time period
had a unique exposure to institutional characteristics that may have contributed to the observed
relationship between industrialization and literacy.
The emergence of state centralization in France and the concentration of political power in
Paris before the industrial revolution may have had a differential impact on the political culture
and economic prosperity in Paris and its suburbs (i.e., Seine, Seine-et-Marne and Seine-et-Oise).
Hence, the analysis includes a dummy variable for these three departments to control for their
potential confounding effects on the observed relationship between industrialization and human
capital. Moreover, the analysis accounts for the effect of the aerial distance between the adminis-
trative center of each department and Paris, thus capturing the potential decline in the reach of the
central government in regions at a greater distance from Paris as well as the diminished potential
diffusion of development into these regions.
11

11000 - 15000
16000 - 55000
56000 - 134000
510000
A. Urban population in 1700.
University
B. Universities in 1700.
Figure 5: Urban population and universities in 1700
3.3.3 Pre-industrial development
The empirical analysis accounts for the potentially confounding effects of the level of development in
the pre-industrial period. The differential level of development across France in the pre-industrial
era may have indeed affected jointly the process of development and human capital formation.
Namely, it may have affected the adoption of the steam engine and it may have generated, inde-
pendently, a persistent investment on education. First, the early level of development, as captured
by the degree of urbanization (i.e., population of urban centers with more than 10,000 inhabitants)
in each French department in 1700 as shown in Panel A of Figure 5 (Lepetit, 1994), may have
persisted independently of the process of industrialization.13 Second, the number of universities in
1700 in each department as shown in Panel B of Figure 5 (Bosker et al., 2013) may have affected
the adoption of the steam engine while contributing to human capital formation independently of
the process of industrialization. Third, early literacy rates, as captured by the share of grooms who
could sign their marriage license over the 1686-1690, 1786-1790 and 1816-1820 periods as mapped
in Figure 1 (Furet and Ozouf, 1977),14 may have affected the adoption of the steam engine while
contributing to human capital accumulation independently of the process of industrialization.
13As we discuss below in Section 6, the qualitative analysis remains intact if the potential effect of past populationdensity is accounted for.
14Some observations are missing for these variables. For the 1686-1690 period, there are no observations forAveyron, Bas-Rhin, Dordogne, Indre-et-Loire, Lot, Lozere, Haut-Rhin, Lot, Seine and Vendee. For the 1786-1790period, observations are missing for for Bas-Rhin, Dordogne, Haut-Rhin, Lot, Seine and Vendee. For the 1816-1820period, observations are missing for Bas-Rhin, Dordogne, Haut-Rhin, Lot, Morbihan, Seine and Vendee.
12

4 Empirical Methodology
4.1 Empirical strategy
The observed relationship between industrialization and human capital is not necessarily a causal
one. It may reflect the impact of economic development on the process of industrialization as well
as the influence of institutional, geographical, cultural and human capital characteristics on the
joint process of industrialization and human capital accumulation. In light of the endogeneity of
industrialization and human capital formation, this research exploits exogenous regional variations
in the adoption of the steam engine across France to establish the causal effect of industrialization
on human capital.
The identification strategy is motivated by the historical account of the gradual regional
diffusion of the steam engine in France during the 18th and 19th century (Ballot, 1923; See, 1925;
Leon, 1976).15 Considering the positive association between industrialization and the use of the
steam engine (Mokyr, 1990; Bresnahan and Trajtenberg, 1995; Rosenberg and Trajtenberg, 2004),
the study takes advantage of the regional diffusion of the steam engine to identify the effect of
local variations in the intensity of the use of the steam engine during the 1839-1847 period on the
process of development. In particular, it exploits the distances between each French department
and Fresnes-sur-Escaut (in the Nord department), where the first commercial application of the
steam engine across France was made in 1732, as an instrument for the use of the steam engines in
1839-1847.16
Consistent with the diffusion hypothesis, the second steam engine in France that was utilized
for commercial purposes was operated in 1737 in the mines of Anzin, also in the Nord department,
less than 10 km away from Fresnes-sur-Escaut. Furthermore, in the subsequent decades till the
1789 French Revolution the commercial use of the steam engine expanded predominantly to the
nearby northern and north-western regions. Nevertheless, at the onset of the French revolution
in 1789, steam engines were less widespread in France than in England. A few additional steam
engines were introduced until the fall of the Napoleonic Empire in 1815, notably in Saint-Quentin
in 1803 and in Mulhouse in 1812, but it is only after 1815 that the diffusion of steam engines in
France accelerated (See, 1925; Leon, 1976).
Nevertheless, in light of the confounding effects of geographic, institutional and demographic
characteristics on the pace of technological diffusion, as well as on the process of development, in
order to mitigate the potential effect of unobserved heterogeneity, the econometric model accounts
for a wide range of these characteristics (altitude, latitude, rainfall, land suitability, maritime and
15There was also a regional pattern in the diffusion of steam engines in England (Kanefsky and Robey, 1980;Nuvolari et al., 2011) and in the USA (Atack, 1979).
16This steam engine was used to pump water in an ordinary mine of Fresnes-sur-Escaut. It is unclear whetherPierre Mathieu, the owner of the mine, built the engine himself after a trip in England or employed an Englishmanfor this purpose (Ballot, 1923, p.385).
13

border departments, Paris and its suburbs, the distance to Paris).
Table 1: The geographical diffusion of the steam engine
(1) (2) (3) (4) (5) (6) (7) (8) (9)OLS OLS OLS OLS OLS OLS OLS OLS OLS
Number of Steam Engines
Distance to Fresnes -0.00273*** -0.00472** -0.00686*** -0.0108*** -0.00985*** -0.0109*** -0.00861*** -0.00814***[0.000597] [0.00218] [0.00227] [0.00278] [0.00301] [0.00257] [0.00260] [0.00255]
Distance to Paris -0.0004 0.0062** 0.0058** 0.0063** 0.0047* 0.0052**[0.0026] [0.0026] [0.0028] [0.0026] [0.0025] [0.0025]
Average Rainfall 0.0669 -0.00845 -0.296 -0.589 -0.777 -0.349 0.522 0.424[0.897] [0.935] [0.950] [0.844] [0.886] [0.890] [0.858] [0.949]
Average Temperature 2.617*** 2.232** 1.278 2.625** 2.463* 2.549** 2.506** 2.448**[0.919] [1.088] [1.089] [1.094] [1.245] [1.063] [0.968] [1.069]
Latitude -7.922 -17.58 9.876 -14.19 -13.88 -13.81 -10.12 -7.378[9.404] [10.60] [9.785] [10.77] [11.50] [10.60] [9.952] [9.958]
Land Suitability 0.308 0.226 0.748 0.0532 0.253 -0.000914 0.0170 0.125[0.557] [0.579] [0.578] [0.556] [0.586] [0.537] [0.539] [0.563]
Maritime Department 0.764** 0.405 0.436 0.404 0.397 0.228 0.0539[0.348] [0.408] [0.396] [0.438] [0.404] [0.344] [0.382]
Border Department 0.251 0.301 -0.183 -0.369 -0.268 -0.0425 -0.310[0.339] [0.424] [0.369] [0.371] [0.367] [0.329] [0.314]
Paris and Suburbs 0.00659 0.328 0.551 0.0655 0.500 0.341 0.411[0.601] [0.658] [0.661] [0.794] [0.607] [0.409] [0.554]
Grooms who Signed their Marriage License, 1786-1790 0.301 0.363[0.749] [0.686]
University 0.497 0.547*[0.353] [0.311]
Urban Population in 1700 0.256*** 0.229**[0.0749] [0.0930]
Adjusted R2 0.188 0.271 0.299 0.217 0.333 0.330 0.346 0.411 0.422Observations 85 85 85 85 85 79 85 85 79
Note: The dependent variable and the explanatory variables except the dummies are in logarithm. The aerial distances are measured in kilometers.
Robust standard errors are reported in brackets. *** indicates significance at the 1%-level, ** indicates significance at the 5%-level, * indicates
significance at the 10%-level.
NORD
PAS-DE-CALAIS
AISNESOMME
ARDENNES
OISEMARNE
SEINE
SEINE-INFERIEURE
SEINE-ET-OISE
MEUSE
SEINE-ET-MARNE
EUREMOSELLE
AUBE
EURE-ET-LOIR
MEURTHE
HAUTE-MARNE
YONNE
LOIRET
CALVADOS
VOSGES
ORNE
LOIR-ET-CHER
COTE-D'OR
BAS-RHIN
SARTHEHAUTE-SAONE
MANCHE
HAUT-RHIN
CHER
NIEVRE
DOUBSINDRE-ET-LOIRE
MAYENNEINDRE
ALLIER
JURA
MAINE-ET-LOIRE
ILLE-ET-VILAINE
SAONE-ET-LOIRE
AINVIENNE
CREUSECOTES-DU-NORD
LOIRE-INFERIEURE
PUY-DE-DOMERHONE
HAUTE-VIENNE
DEUX-SEVRES
MORBIHAN
VENDEE
LOIRE
CHARENTE
CHARENTE-INFERIEURE
CORREZE
HAUTE-LOIRE
ISERE
CANTAL
DROME
FINISTEREDORDOGNE
ARDECHE
LOZERE
HAUTES-ALPESLOT
AVEYRON
GIRONDE
VAUCLUSE
LOT-ET-GARONNE
TARN
BASSES-ALPES
TARN-ET-GARONNE
GARD
HERAULT
HAUTE-GARONNE
GERS
LANDES
VAR (SAUF GRASSE 39-47)
BOUCHES-DU-RHONE
AUDEHAUTES-PYRENEES
ARIEGE
BASSES-PYRENEES
PYRENEES-ORIENTALES
-4-2
02
4N
umbe
r of
Ste
am E
ngin
es (
log)
-400 -200 0 200 400Distance to Fresnes
coef = -.00273029, (robust) se = .00059658, t = -4.58
A. Unconditional.
NORD
PAS-DE-CALAISARDENNES
LANDES
MARNE
SOMMEVAR (SAUF GRASSE 39-47)
RHONE
BOUCHES-DU-RHONE
AISNE
MOSELLE
GARD
HERAULT
HAUTE-LOIREAUDE
VOSGES
VAUCLUSE
LOIRE
AUBE
HAUTE-MARNE
DROME
PUY-DE-DOME
TARN
ALLIER
HAUTE-SAONE
ARDECHE
SAONE-ET-LOIREHAUT-RHIN
LOZERE
AIN
GERS
OISE
GIRONDE
CANTAL
COTE-D'OR
CREUSE
YONNE
TARN-ET-GARONNE
SEINE
SEINE-ET-MARNE
LOT-ET-GARONNE
ISERE
CORREZE
MEURTHE
MEUSEDORDOGNEBAS-RHIN
SEINE-ET-OISE
HAUTE-VIENNE
INDRE
NIEVRE
AVEYRON
CHERINDRE-ET-LOIRE
HAUTE-GARONNE
LOTPYRENEES-ORIENTALES
LOIRET
LOIR-ET-CHER
CHARENTE-INFERIEURECHARENTE
EURE-ET-LOIR
SEINE-INFERIEURE
VIENNE
ARIEGE
BASSES-ALPES
SARTHE
MAINE-ET-LOIRE
EURE
VENDEE
DOUBS
HAUTES-ALPESHAUTES-PYRENEES
DEUX-SEVRES
BASSES-PYRENEES
JURA
CALVADOS
LOIRE-INFERIEURE
MANCHE
ORNE
MAYENNE
MORBIHAN
COTES-DU-NORD
ILLE-ET-VILAINEFINISTERE
-4-2
02
4N
umbe
r of
Ste
am E
ngin
es (
log)
-150 -100 -50 0 50 100Distance to Fresnes
coef = -.01077814, (robust) se = .00277807, t = -3.88
B. Conditional on geography and institutions.
NORD
PAS-DE-CALAIS
ARDENNES
LANDES
AISNE
SOMMEVAR (SAUF GRASSE 39-47)
MARNERHONE
AIN
LOIRE
SAONE-ET-LOIRE
DROME
HAUTE-MARNE
BOUCHES-DU-RHONE
VAUCLUSE
AUDE
ALLIER
HAUTE-SAONE
CREUSE
HERAULT
VOSGES
ARDECHE
HAUTE-LOIRE
SEINE-ET-MARNE
NIEVRE
YONNE
TARN
CANTAL
PUY-DE-DOME
MOSELLE
GARD
GERS
PYRENEES-ORIENTALES
INDRE
AUBE
LOZERE
CORREZE
ISERE
OISECOTE-D'OR
AVEYRON
TARN-ET-GARONNEMEUSEGIRONDE
VIENNE
CHER
LOT-ET-GARONNE
ARIEGE
HAUTE-VIENNE
CHARENTESEINE-ET-OISE
BASSES-ALPES
HAUTE-GARONNE
MANCHE
INDRE-ET-LOIRE
MEURTHE
LOIR-ET-CHER
LOIRET
MAINE-ET-LOIRESARTHE
EURE-ET-LOIR
DEUX-SEVRESEURE
HAUTES-PYRENEES
SEINE-INFERIEURE
CHARENTE-INFERIEUREHAUTES-ALPES
LOIRE-INFERIEURE
COTES-DU-NORD
JURA
DOUBS
BASSES-PYRENEES
CALVADOS
MORBIHAN
MAYENNE
ILLE-ET-VILAINE
ORNE
FINISTERE
-2-1
01
23
Num
ber
of S
team
Eng
ines
(lo
g)
-150 -100 -50 0 50 100Distance to Fresnes
coef = -.00814005, (robust) se = .00255256, t = -3.19
C. Conditional on all controls.
Figure 6: The effect of the distance from Fresnes-sur-Escaut on the number of steam engines in 1839-1847
Note: These figures depict the partial regression line for the effect of the distance from Fresnes-sur-Escaut on the number of
steam engines in each French department in 1839-1847. Panel A presents the unconditional relationship while Panel B reports
the relationship which controls for geographic and institutional characteristics, as well as for pre-industrial development. Thus,
the x- and y-axes in Panels A, B and C plot the residuals obtained from regressing steam engine intensity and the distance
from Fresnes-sur-Escaut, respectively with and without the aforementioned set of covariates.
Indeed, in line with the historical account, the distribution of steam engines across French
departments, as reported in the 1839-1847 industrial survey, is indicative of a local diffusion process
from Fresnes-sur-Escaut. As reported in Column 1 of Table 1 and shown in Panel A of Figure 6,
14

there is a highly significant negative correlation between the distance from Fresnes-sur-Escaut to
the administrative center of each department and the number of steam engines in the department.
But as discussed in Section 2.3, pre-industrial development and a wide range of confounding ge-
ographical and institutional characteristics could have contributed to the adoption of the steam
engine. Reassuringly, the unconditional negative relationship between the distance to Fresnes-sur-
Escaut and the number of steam engines remains highly significant and is larger in absolute value
when exogenous confounding geographical controls i.e., land suitability, latitude, rainfall and tem-
perature (Column 2), as well as institutional factors and pre-industrial development (Column 3),
are accounted for. Importantly, the diffusion pattern of steam engines is not significantly corre-
lated with the distance between Paris and the administrative center of each department when the
distance from Fresnes-sur-Escaut to each department’s administrative center is excluded from the
analysis (Column 4). Moreover, Column 5 of Table 1 and Panel B of Figure 6 indicate that there
is still a highly significant negative correlation between the distance from Fresnes-sur-Escaut to
the administrative center of each department and the intensity of the use of steam engines in the
department when the distance to Paris is included. Specifically, a 100-km increase in the distance
from Fresnes-sur-Escaut is associated with a 1.08 point decrease in the log of the number of steam
engines in a given department, relative to the log of the average number of steam engines per
department which is equal to 1.47. This means that, for two departments located at the 25th per-
centile (326.69 km) and 75th percentile (658.56 km) away from Fresnes, the 331.87 km difference
leads to a 3.58 point decrease in the log of the number of steam engines (i.e., a decrease of 36
engines, relative to a sample mean of 29.2 and a standard deviation of 66.1).
Finally, the findings suggest that pre-industrial economic and human development, which is
captured by the degree of urbanization in each department in 1700, the share of grooms who could
sign their marriage license in 1786-1790, and the number of universities in 1700 had a persistent
positive and significant association with the adoption of the steam engine (Columns (6)-(9) of Table
1 and Panel C of Figure 6).17 Nevertheless these pre-industrial characteristics have no qualitative
impact on the negative association between the distance from Fresnes-sur-Escaut and the number
of steam engines.
Moreover, the highly significant negative correlation between the number of steam engines
in each department and the distance from Fresnes-sur-Escaut to the administrative center of each
department is robust to the inclusion of an additional set of confounding geographical, demographic
and institutional characteristics, as well as to the forces of pre-industrial development, which as
discussed in section 5, may have contributed to the relationship between industrialization and
economic development. As established in Table B.1 in Appendix B, these confounding factors,
which could be largely viewed as endogenous to the adoption of the steam engine and are thus not
17As established in Table B.1, the qualitative results are unaffected if the share of grooms in the 1686-1690 and1816-1820 periods is used instead.
15

part of the baseline analysis, do not affect the qualitative results.
Table 2: The determinants of the diffusion of the steam engine: the insignificance of distancesfrom other major cities
(1) (2) (3) (4) (5) (6)OLS OLS OLS OLS OLS OLS
Number of Steam Engines
Distance to Fresnes -0.00273*** -0.00327*** -0.00271*** -0.00367*** -0.00268*** -0.00197**[0.000597] [0.000739] [0.000582] [0.00122] [0.000805] [0.000866]
Distance to Marseille -0.000768[0.000959]
Distance to Lyon 0.000159[0.000993]
Distance to Rouen 0.00115[0.00142]
Distance to Mulhouse -0.000115[0.000838]
Distance to Bordeaux 0.00150[0.00106]
Adjusted R2 0.188 0.186 0.178 0.184 0.178 0.201Observations 85 85 85 85 85 85
Note: The dependent variable is in logarithm. The aerial distances are measured in kilometers. Robust standard errors are reported in brackets.
*** indicates significance at the 1%-level, ** indicates significance at the 5%-level, * indicates significance at the 10%-level.
Table 3: The determinants of the diffusion of the steam engine: the insignificance of distancesfrom other major French cities measured in travel weeks
(1) (2) (3) (4) (5) (6) (7)OLS OLS OLS OLS OLS OLS OLS
Number of Steam Engines
Distance from Fresnes (weeks of travel) -2.858*** -3.828*** -2.772*** -3.077*** -2.834*** -2.944*** -2.655***[0.680] [1.117] [0.661] [0.756] [0.741] [0.823] [0.844]
Distance from Paris (weeks of travel) 1.314[1.242]
Distance from Marseille (weeks of travel) 0.489[0.686]
Distance from Lyon (weeks of travel) 0.558[0.700]
Distance from Rouen (weeks of travel) -0.0485[0.738]
Distance from Mulhouse (weeks of travel) 0.129[0.531]
Distance from Bordeaux (weeks of travel) 0.302[0.577]
Adjusted R2 0.147 0.146 0.144 0.145 0.137 0.137 0.139Observations 85 85 85 85 85 85 85
Note: The dependent variable is in logarithm. Robust standard errors are reported in brackets. *** indicates significance at the 1%-level, **
indicates significance at the 5%-level, * indicates significance at the 10%-level.
The validity of the aerial distance from Fresnes-sur-Escaut as an instrumental variable for the
number of steam engines across France is enhanced by two supplementary robustness checks. First,
in Table 2, distances between each department and major centers of economic power in 1839-1847
are shown to be uncorrelated with the number of steam engines over this period. Specifically con-
ditional on the distance from Fresnes-sur-Escaut, distances between each department and Marseille
and Lyon (the second and third largest cities in France), Rouen (a major harbor in the north-west
where the steam engine was introduced in 1796), Mulhouse (a major city in the east where the steam
16
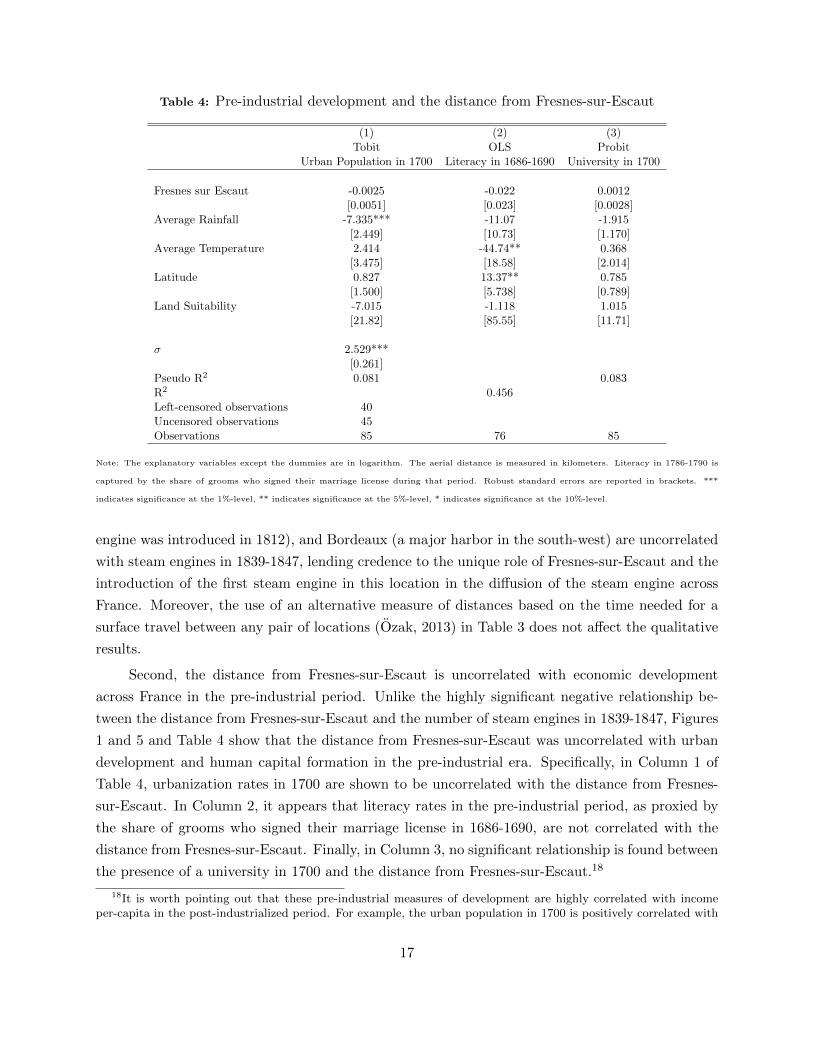
Table 4: Pre-industrial development and the distance from Fresnes-sur-Escaut
(1) (2) (3)Tobit OLS Probit
Urban Population in 1700 Literacy in 1686-1690 University in 1700
Fresnes sur Escaut -0.0025 -0.022 0.0012[0.0051] [0.023] [0.0028]
Average Rainfall -7.335*** -11.07 -1.915[2.449] [10.73] [1.170]
Average Temperature 2.414 -44.74** 0.368[3.475] [18.58] [2.014]
Latitude 0.827 13.37** 0.785[1.500] [5.738] [0.789]
Land Suitability -7.015 -1.118 1.015[21.82] [85.55] [11.71]
σ 2.529***[0.261]
Pseudo R2 0.081 0.083R2 0.456Left-censored observations 40Uncensored observations 45Observations 85 76 85
Note: The explanatory variables except the dummies are in logarithm. The aerial distance is measured in kilometers. Literacy in 1786-1790 is
captured by the share of grooms who signed their marriage license during that period. Robust standard errors are reported in brackets. ***
indicates significance at the 1%-level, ** indicates significance at the 5%-level, * indicates significance at the 10%-level.
engine was introduced in 1812), and Bordeaux (a major harbor in the south-west) are uncorrelated
with steam engines in 1839-1847, lending credence to the unique role of Fresnes-sur-Escaut and the
introduction of the first steam engine in this location in the diffusion of the steam engine across
France. Moreover, the use of an alternative measure of distances based on the time needed for a
surface travel between any pair of locations (Ozak, 2013) in Table 3 does not affect the qualitative
results.
Second, the distance from Fresnes-sur-Escaut is uncorrelated with economic development
across France in the pre-industrial period. Unlike the highly significant negative relationship be-
tween the distance from Fresnes-sur-Escaut and the number of steam engines in 1839-1847, Figures
1 and 5 and Table 4 show that the distance from Fresnes-sur-Escaut was uncorrelated with urban
development and human capital formation in the pre-industrial era. Specifically, in Column 1 of
Table 4, urbanization rates in 1700 are shown to be uncorrelated with the distance from Fresnes-
sur-Escaut. In Column 2, it appears that literacy rates in the pre-industrial period, as proxied by
the share of grooms who signed their marriage license in 1686-1690, are not correlated with the
distance from Fresnes-sur-Escaut. Finally, in Column 3, no significant relationship is found between
the presence of a university in 1700 and the distance from Fresnes-sur-Escaut.18
18It is worth pointing out that these pre-industrial measures of development are highly correlated with incomeper-capita in the post-industrialized period. For example, the urban population in 1700 is positively correlated with
17

4.2 Empirical Model
The effect of industrialization on the process of development is estimated using 2SLS. The second
stage provides a cross-section estimate of the relationship between the number of steam engines in
each department in 1839-1847 to measures of human capital formation at different points in time;
Yit = α+ βEi + X′iω + εit, (1)
where Yit represents a measure of human capital in department i in year t, E i is the log of the
number of steam engines in department i in 1839-1847, X′i is a vector of geographical, institutional
and pre-industrial economic characteristics of department i and εit is an i.i.d. error term for
department i in year t.
In the first stage, E i, the log of the number of steam engines in department i in 1839-1847
is instrumented by D i, the aerial distance (in kilometers) between Fresnes-sur-Escaut and the
administrative center of department i ;
Ei = δ1Di + X′iδ2 + µi, (2)
where X′i is the same vector of geographical, institutional and pre-industrial economic characteris-
tics of department i used in the second stage, and µi is an error term for department i.
5 Industrialization and Human Capital Formation
The study examines the effect of the number of steam engines in the 1839-1847 period on human
capital formation in the short-run. As established in Tables 5 - 9, and in line with the proposed
hypothesis, the early phase of the industrialization process was conducive to human capital accu-
mulation.
5.1 The effect of industrialization on the number of teachers
The relationship between industrialization and the number of teachers in 1840 and 1863 is presented
in Tables 5 and 6. As shown in Column (1), unconditionally, the number of steam engines in
industrial production in 1839-1847 had a positive and significant association at the 1% level with
the number of teachers in 1840 and 1863. This relationship remains positive, mostly smaller in
magnitude but with the same level of statistical significance, once one progressively accounts for the
confounding effects of exogenous geographical factors (Column (2)), institutional factors (Column
(3)) and pre-industrial characteristics (Columns (4)-(7)). Finally, mitigating the effect of omitted
all our measures of GDP per capita in 1872 (0.451), 1901 (0.293), 1930 (0.551) and 2001-2010 (0.517).
18

Table 5: The effect of industrialization on the number of teachers in 1840
(1) (2) (3) (4) (5) (6) (7) (8) (9) (10) (11) (12)OLS OLS OLS OLS OLS OLS OLS IV IV IV IV IV
Teachers, 1840
Number of Steam Engines 117.6*** 125.0*** 115.0*** 115.6*** 112.6*** 95.82*** 102.8*** 247.6*** 250.4*** 247.3*** 260.7*** 269.0***[24.51] [25.45] [26.02] [29.68] [23.87] [29.74] [31.34] [60.58] [67.55] [59.43] [75.67] [78.62]
Average Rainfall 648.1*** 647.8*** 594.1** 669.7*** 786.0*** 686.3** 687.1*** 697.6*** 678.9*** 622.9** 578.0**[197.0] [206.5] [251.7] [214.3] [220.2] [267.0] [225.2] [256.0] [226.3] [242.8] [268.6]
Average Temperature -782.9*** -1,001*** -869.8** -1,006*** -955.9*** -845.0** -1,171*** -1,095*** -1,167*** -1,197*** -1,143***[221.1] [333.0] [421.9] [332.2] [316.7] [408.6] [298.0] [360.0] [299.7] [313.0] [384.4]
Latitude 730.4 2,099 1,484 2,181 2,184 1,706 788.9 502.0 771.3 709.9 10.99[807.8] [1,860] [1,974] [1,861] [1,717] [2,038] [2,149] [2,208] [2,183] [2,256] [2,419]
Land Suitability 284.4** 346.3** 264.4 343.7** 336.6** 261.5 247.1 172.3 248.9 248.7 184.1[122.4] [131.6] [171.6] [130.9] [130.9] [170.8] [158.0] [187.8] [155.7] [162.2] [189.8]
Maritime Department 118.4 129.3 115.8 98.61 109.8 64.63 83.13 66.06 72.38 116.3[72.66] [80.83] [75.04] [72.07] [93.18] [98.54] [106.3] [98.26] [97.45] [104.8]
Border Department -2.378 -30.72 -9.072 9.326 -22.22 -42.35 -25.90 -39.58 -49.08 -22.28[98.96] [100.8] [104.1] [95.83] [108.5] [96.32] [94.03] [99.02] [100.5] [101.9]
Distance to Paris 0.518 0.422 0.519 0.482 0.437 0.566 0.448 0.565 0.584 0.385[0.530] [0.557] [0.531] [0.505] [0.583] [0.588] [0.608] [0.589] [0.605] [0.640]
Paris and Suburbs 421.7** 265.6 417.5*** 405.4*** 292.7 378.2*** 306.0*** 380.1*** 384.6*** 264.6**[162.2] [181.0] [157.3] [131.5] [175.7] [111.7] [110.6] [111.5] [121.5] [128.6]
Grooms who Signed their Marriage License, 1786-1790 206.3 198.4 81.97 64.48[220.3] [225.2] [216.6] [213.7]
University 46.28 9.731 -16.64 -73.72[83.34] [100.8] [86.88] [107.1]
Urban Population in 1700 34.96 22.62 -16.54 -24.39[23.76] [26.04] [29.83] [31.27]
Adjusted R2 0.194 0.386 0.427 0.414 0.422 0.440 0.404Observations 85 85 85 79 85 85 79 85 79 85 85 79
First stage: the instrumented variable is Number of Steam Engines
Distance to Fresnes -0.0108*** -0.00985*** -0.0109*** -0.00861*** -0.00814***[0.00278] [0.00301] [0.00257] [0.00260] [0.00255]
F-stat (1st stage) 15.052 10.695 17.925 10.970 10.170
Note: The explanatory variables except the dummies are in logarithm. The aerial distances are measured in kilometers. Robust standard errors are
reported in brackets. *** indicates significance at the 1%-level, ** indicates significance at the 5%-level, * indicates significance at the 10%-level.
variables on the observed relationship, the IV estimations in Columns (8)-(12) suggest that the
number of steam engines in 1839-1847 had a positive and highly significant impact on the number
of teachers in 1840 and 1863, accounting for the confounding effects of geographical, institutional,
and demographic characteristics.19
The regressions in Tables 5 and 6 also account for a large number of confounding geographical
and institutional factors, which are discussed above in Section 2.3. First, the climatic and soil
characteristics of each department (i.e., land suitability, average temperature, average rainfall, and
latitude) could have affected natural land productivity and therefore the feasibility and profitability
of the transition to the industrial stage of development, as well as the evolution of income per capita
and its potential direct on human capital formation in each department.
Second, the location of departments (i.e., latitude, border departments, maritime departments
and departments at a greater distance from the concentration of political power in Paris) could
have affected the diffusion of the steam engine and human capital formation. However, most of
these factors appear orthogonal to the evolution of human capital, except for the dummy variable
for Paris and its suburbs which has a positive and nearly systematically significant correlation with
19The F-statistic in the first stage is equal to 15.052 in the absence of pre-industrial controls. Furthermore, the IVcoefficient in each specification is larger than the OLS coefficient, which can probably be attributed to measurementerror in the explanatory variable – the number of steam engines.
19

Table 6: The effect of industrialization on the number of teachers in 1863
(1) (2) (3) (4) (5) (6) (7) (8) (9) (10) (11) (12)OLS OLS OLS OLS OLS OLS OLS IV IV IV IV IV
Teachers, 1863
Number of Steam Engines 271.7*** 266.2*** 249.4*** 248.2*** 231.6*** 193.5*** 222.1*** 424.0*** 467.2*** 429.2*** 392.8*** 498.0***[49.41] [46.14] [39.76] [35.10] [33.13] [37.35] [34.78] [86.89] [91.46] [88.46] [113.4] [120.4]
Average Rainfall 374.7 653.4** 719.7** 815.0*** 1,056*** 891.2** 705.1** 887.8** 828.4*** 859.0** 711.5*[401.6] [260.2] [293.0] [254.9] [378.0] [350.9] [322.2] [373.2] [321.6] [416.1] [410.8]
Average Temperature -276.3 -761.5** -1,013** -800.6** -629.3* -950.5** -984.5** -1,379*** -1,036*** -921.0** -1,445***[277.8] [378.4] [419.1] [346.4] [338.1] [392.7] [392.1] [458.6] [381.7] [400.0] [504.8]
Latitude 1,803* 3,172 3,334 3,780* 3,419* 3,964* 1,447 1,739 1,712 1,637 1,150[1,016] [2,307] [2,343] [2,192] [1,949] [2,344] [2,852] [2,951] [2,876] [2,717] [3,302]
Land Suitability 9.620 167.9 241.3 148.9 139.6 227.4 37.39 91.56 9.896 33.43 98.91[193.6] [173.6] [163.0] [162.5] [157.4] [151.6] [205.0] [218.2] [198.4] [189.4] [237.7]
Maritime Department 200.2* 247.7** 180.9 142.6 203.0* 129.5 172.7 108.0 110.9 213.8[102.7] [108.2] [112.2] [99.31] [110.9] [132.0] [147.8] [140.1] [125.1] [144.6]
Border Department -101.6 -80.13 -151.1 -67.50 -79.86 -154.2 -72.30 -195.9 -138.1 -79.98[116.2] [130.8] [106.3] [117.4] [127.8] [120.3] [116.4] [120.1] [125.3] [127.0]
Distance to Paris 0.716 0.707 0.719 0.611 0.782 0.778 0.749 0.787 0.734 0.694[0.668] [0.697] [0.691] [0.638] [0.706] [0.801] [0.871] [0.823] [0.783] [0.909]
Paris and Suburbs 1,403 350.5*** 1,372 1,356 407.5*** 1,346 416.1** 1,317* 1,330* 361.0**[945.3] [95.20] [856.4] [827.1] [113.5] [840.1] [184.0] [767.3] [791.7] [178.8]
Grooms who Signed their Marriage License, 1786-1790 -142.4 -127.6 -344.5 -349.9[222.9] [219.4] [264.6] [283.2]
University 342.2** 83.03 249.9 -55.52[161.7] [115.0] [176.4] [155.5]
Urban Population in 1700 101.9** 36.86 39.65 -41.19[47.89] [30.45] [63.23] [50.12]
Adjusted R2 0.341 0.342 0.482 0.568 0.523 0.532 0.573Observations 85 85 85 79 85 85 79 85 79 85 85 79
First stage: the instrumented variable is Number of Steam Engines
Distance to Fresnes -0.0108*** -0.00985*** -0.0109*** -0.00861*** -0.00814***[0.00278] [0.00301] [0.00257] [0.00260] [0.00255]
F-stat (1st stage) 15.052 10.695 17.925 10.970 10.170
Note: The explanatory variables except the dummies are in logarithm. The aerial distances are measured in kilometers. Robust standard errors are
reported in brackets. *** indicates significance at the 1%-level, ** indicates significance at the 5%-level, * indicates significance at the 10%-level.
the number of teachers in the OLS and IV regressions in Tables 5 and 6.
Third, the regressions in Tables 5 and 6 take into account the potentially confounding effects
of the level of human capital and economic development in the pre-industrial period, as captured
by the share of grooms who could sign their marriage license over the 1786-1790 period, the degree
of urbanization in each department in 1700 and the number of universities in 1700.20 The findings
suggest that pre-industrial human capital and development (and the characteristics that may have
fostered them) had no significant impact on the number of teachers in 1840 and 1863.
Fourth, the IV estimates in Column (12) of Tables 5 and 6 suggest that the presence of steam
engines had large quantitative effects on the number of teachers in primary schools: a one-percent
increase in the number of steam engines in a department in 1839-1847 increased the number of
teachers in the primary schools by 269.0 in 1840 and 498.0 in 1863. Hence the 675 percent increase
in the number of steam engines in 1839-1847 due to a movement from the 25th percentile (i.e., 4
engines) to the 75th percentile (i.e., 31 engines) would lead to an increase in the number of teachers
of 1816 in 1840 and 3362 in 1863 (relative to a sample mean of 742 in 1840 and 1243 in 1863).
Finally, the association between the number of steam engines and the number of teachers
in 1840 and 1863 is not affected by spatial correlation as established in Tables 7 and D.2 in the
20As established in Table B.2, the qualitative results are unaffected if the share of grooms in the 1686-1690 and1816-1820 periods is used instead.
20
Appendix.
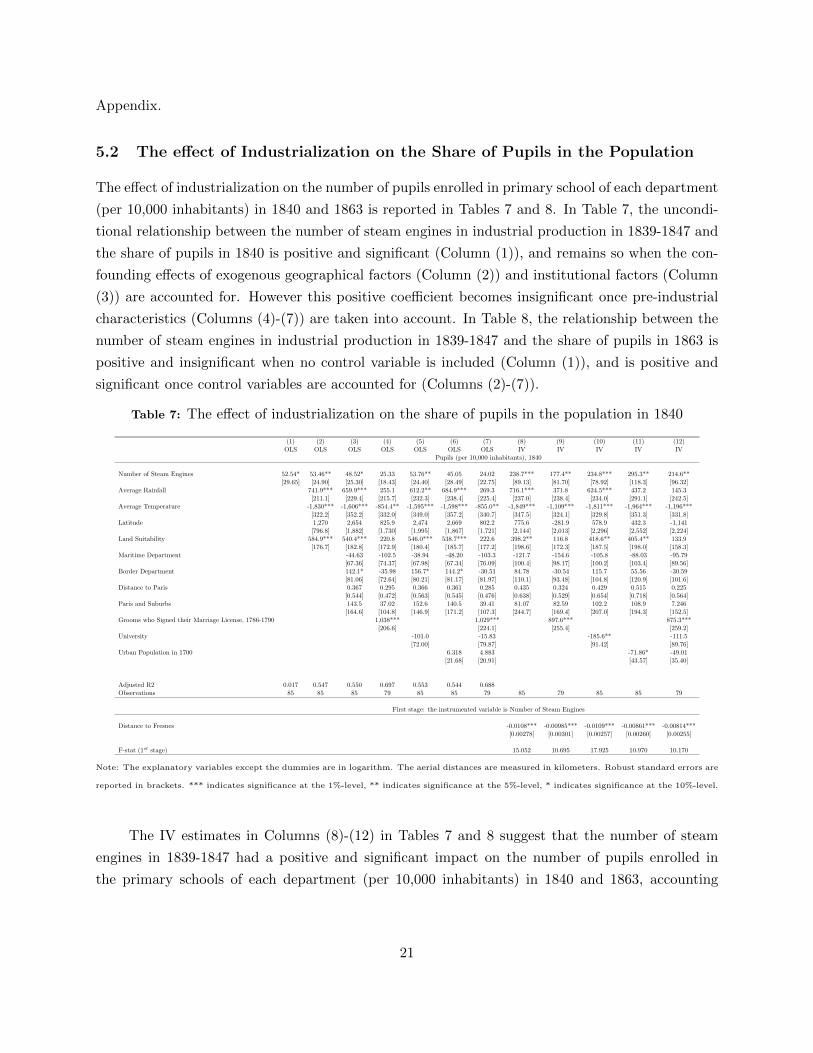
5.2 The effect of Industrialization on the Share of Pupils in the Population
The effect of industrialization on the number of pupils enrolled in primary school of each department
(per 10,000 inhabitants) in 1840 and 1863 is reported in Tables 7 and 8. In Table 7, the uncondi-
tional relationship between the number of steam engines in industrial production in 1839-1847 and
the share of pupils in 1840 is positive and significant (Column (1)), and remains so when the con-
founding effects of exogenous geographical factors (Column (2)) and institutional factors (Column
(3)) are accounted for. However this positive coefficient becomes insignificant once pre-industrial
characteristics (Columns (4)-(7)) are taken into account. In Table 8, the relationship between the
number of steam engines in industrial production in 1839-1847 and the share of pupils in 1863 is
positive and insignificant when no control variable is included (Column (1)), and is positive and
significant once control variables are accounted for (Columns (2)-(7)).
Table 7: The effect of industrialization on the share of pupils in the population in 1840
(1) (2) (3) (4) (5) (6) (7) (8) (9) (10) (11) (12)OLS OLS OLS OLS OLS OLS OLS IV IV IV IV IV
Pupils (per 10,000 inhabitants), 1840
Number of Steam Engines 52.54* 53.46** 48.52* 25.33 53.76** 45.05 24.02 238.7*** 177.4** 234.8*** 295.3** 214.6**[29.65] [24.90] [25.30] [18.43] [24.40] [28.49] [22.75] [89.13] [81.70] [78.92] [118.3] [96.32]
Average Rainfall 741.9*** 659.9*** 255.1 612.2** 684.9*** 269.3 716.1*** 371.8 624.5*** 437.2 145.3[211.1] [229.4] [215.7] [232.3] [238.4] [225.4] [237.0] [238.4] [234.0] [291.1] [242.5]
Average Temperature -1,830*** -1,606*** -854.4** -1,595*** -1,598*** -855.0** -1,849*** -1,109*** -1,811*** -1,964*** -1,196***[322.2] [352.2] [332.0] [349.0] [357.2] [340.7] [347.5] [324.1] [329.8] [351.3] [331.8]
Latitude 1,270 2,654 825.9 2,474 2,669 802.2 775.6 -281.9 578.9 432.3 -1,141[796.8] [1,882] [1,730] [1,995] [1,867] [1,721] [2,144] [2,013] [2,296] [2,552] [2,224]
Land Suitability 584.9*** 540.4*** 220.8 546.0*** 538.7*** 222.6 398.2** 116.8 418.6** 405.4** 133.9[176.7] [182.8] [172.9] [180.4] [185.7] [177.2] [198.6] [172.3] [187.5] [198.0] [158.3]
Maritime Department -44.63 -102.5 -38.94 -48.20 -103.3 -121.7 -154.6 -105.8 -88.03 -95.79[67.36] [74.37] [67.98] [67.34] [76.09] [100.4] [98.17] [100.2] [103.4] [89.56]
Border Department 142.1* -35.98 156.7* 144.2* -30.51 84.78 -30.54 115.7 55.56 -30.59[81.06] [72.64] [80.21] [81.17] [81.97] [110.1] [93.48] [104.8] [120.9] [101.6]
Distance to Paris 0.367 0.295 0.366 0.361 0.285 0.435 0.324 0.429 0.515 0.225[0.544] [0.472] [0.563] [0.545] [0.476] [0.638] [0.529] [0.654] [0.718] [0.564]
Paris and Suburbs 143.5 37.02 152.6 140.5 39.41 81.07 82.59 102.2 108.9 7.246[164.6] [104.8] [146.9] [171.2] [107.3] [244.7] [169.4] [207.0] [194.3] [152.5]
Grooms who Signed their Marriage License, 1786-1790 1,038*** 1,029*** 897.6*** 875.3***[206.6] [224.1] [255.4] [259.2]
University -101.0 -15.83 -185.6** -111.5[72.00] [79.87] [91.42] [89.76]
Urban Population in 1700 6.318 4.883 -71.86* -49.01[21.68] [20.91] [43.57] [35.40]
Adjusted R2 0.017 0.547 0.550 0.697 0.553 0.544 0.688Observations 85 85 85 79 85 85 79 85 79 85 85 79
First stage: the instrumented variable is Number of Steam Engines
Distance to Fresnes -0.0108*** -0.00985*** -0.0109*** -0.00861*** -0.00814***[0.00278] [0.00301] [0.00257] [0.00260] [0.00255]
F-stat (1st stage) 15.052 10.695 17.925 10.970 10.170
Note: The explanatory variables except the dummies are in logarithm. The aerial distances are measured in kilometers. Robust standard errors are
reported in brackets. *** indicates significance at the 1%-level, ** indicates significance at the 5%-level, * indicates significance at the 10%-level.
The IV estimates in Columns (8)-(12) in Tables 7 and 8 suggest that the number of steam
engines in 1839-1847 had a positive and significant impact on the number of pupils enrolled in
the primary schools of each department (per 10,000 inhabitants) in 1840 and 1863, accounting
21

Table 8: The effect of industrialization on the share of pupils in the population in 1863
(1) (2) (3) (4) (5) (6) (7) (8) (9) (10) (11) (12)OLS OLS OLS OLS OLS OLS OLS IV IV IV IV IV
Pupils (per 10,000 inhabitants), 1863
Number of Steam Engines 36.83 41.17** 38.63** 28.20* 39.61** 48.21** 35.54* 160.6*** 137.9** 159.0*** 215.4*** 185.1**[23.26] [18.82] [18.09] [16.60] [17.96] [19.59] [18.80] [49.33] [54.65] [45.76] [72.44] [74.24]
Average Rainfall 538.4*** 549.7*** 361.5* 540.7*** 480.7** 292.2 585.7*** 445.7** 548.9*** 315.1 194.9[153.2] [163.9] [181.7] [168.4] [188.1] [213.7] [168.9] [197.3] [171.3] [224.1] [229.7]
Average Temperature -1,365*** -1,252*** -888.8*** -1,250*** -1,274*** -892.7*** -1,407*** -1,072*** -1,392*** -1,519*** -1,160***[248.6] [266.9] [254.3] [267.4] [259.5] [246.6] [259.8] [272.2] [253.4] [249.1] [268.0]
Latitude 797.8 76.79 -1,262 43.21 34.46 -1,232 -1,127 -2,061 -1,207 -1,460 -2,758[599.8] [1,449] [1,307] [1,490] [1,535] [1,366] [1,574] [1,494] [1,663] [1,962] [1,731]
Land Suitability 412.1*** 382.6*** 229.0* 383.6*** 387.4*** 223.7* 291.4** 154.0 299.6** 298.3** 154.0[133.6] [133.4] [133.2] [133.5] [129.4] [129.6] [135.8] [129.9] [130.2] [130.3] [116.1]
Maritime Department 18.02 -3.492 19.09 27.89 3.562 -31.38 -41.06 -24.97 1.279 9.428[48.56] [52.17] [49.69] [50.42] [50.89] [71.84] [72.70] [72.86] [76.11] [68.55]
Border Department 94.11* 1.947 96.84* 88.26 -18.56 57.36 5.872 69.80 29.02 -18.62[55.72] [55.47] [57.26] [57.11] [64.38] [73.50] [66.45] [73.29] [84.56] [79.89]
Distance to Paris -0.262 -0.411 -0.262 -0.244 -0.380 -0.219 -0.390 -0.221 -0.141 -0.427[0.435] [0.395] [0.443] [0.452] [0.401] [0.481] [0.438] [0.494] [0.553] [0.468]
Paris and Suburbs -0.573 19.92 1.128 7.556 5.668 -40.57 52.78 -32.07 -13.57 -19.58[167.0] [120.0] [164.0] [150.4] [115.9] [218.1] [177.0] [202.1] [164.2] [156.7]
Grooms who Signed their Marriage License, 1786-1790 497.7*** 530.5*** 396.4** 410.0**[146.1] [158.8] [176.3] [189.3]
University -18.88 51.61 -74.65 -23.51[54.04] [58.28] [73.83] [76.11]
Urban Population in 1700 -17.46 -21.74 -69.70** -64.05**[17.75] [18.88] [32.96] [30.72]
Adjusted R2 0.015 0.555 0.543 0.608 0.538 0.544 0.608Observations 85 85 85 79 85 85 79 85 79 85 85 79
First stage: the instrumented variable is Number of Steam Engines
Distance to Fresnes -0.0108*** -0.00985*** -0.0109*** -0.00861*** -0.00814***[0.00278] [0.00301] [0.00257] [0.00260] [0.00255]
F-stat (1st stage) 15.052 10.695 17.925 10.970 10.170
Note: The explanatory variables except the dummies are in logarithm. The aerial distances are measured in kilometers. Robust standard errors are
reported in brackets. *** indicates significance at the 1%-level, ** indicates significance at the 5%-level, * indicates significance at the 10%-level.
for the confounding effects of geographical, institutional and pre-industrial characteristics.21 This
positive effect appears to diminish between 1840 and 1863. In addition, in the IV regressions in
Tables 7 and 8, there is a strongly positive and significant association between early literacy, as
captured by the share of grooms who signed their marriage license in 1786-1790, and the number of
pupils.22 However the number of universities and the urban population in 1700 are negatively, and
in some regressions significantly, correlated with the enrollment of pupils. The other characteristics
of departments, i.e., latitude, land suitability, border departments, maritime departments as well as
the distance to Paris, are shown to have no effect on the enrollment of pupils in the IV regressions.
Overall, the IV estimates in Column (12) of Tables 7 and 8 suggest that a one-percent increase
in the number of steam engines in a department in 1839-1847 increased the number of pupils in
enrolled in the primary schools (per 10,000 inhabitants) by 215 in 1840 and 185 in 1863. As such,
if a department had increased its number steam engines in 1839-1847 from the 25th percentile (i.e.,
4 engines) to the 75th percentile (i.e., 31 engines), this 675 percent increase in the number of steam
engines would lead to an increase in the number of pupils of 1449 in 1840 and 1249 in 1863 (relative
21The F-statistic in the first stage is equal to 15.052. Furthermore, the IV coefficient in each specification is largerthan the OLS coefficient, which can probably be attributed to measurement error in the explanatory variable – thenumber of steam engines.
22As established in Table B.2, the qualitative results are not affected if the share of grooms in the 1686-1690 and1816-1820 periods is used instead.
22
to sample mean of 874 in 1840 and 1179 in 1863, per 10,000 inhabitants).
Finally, the association between intensity of the steam engines and the number of pupils
enrolled in primary school of each department (per 10,000 inhabitants) in 1840 and 1863 is not
affected by spatial correlation as shown in Tables D.3 and D.4 in Appendix D.
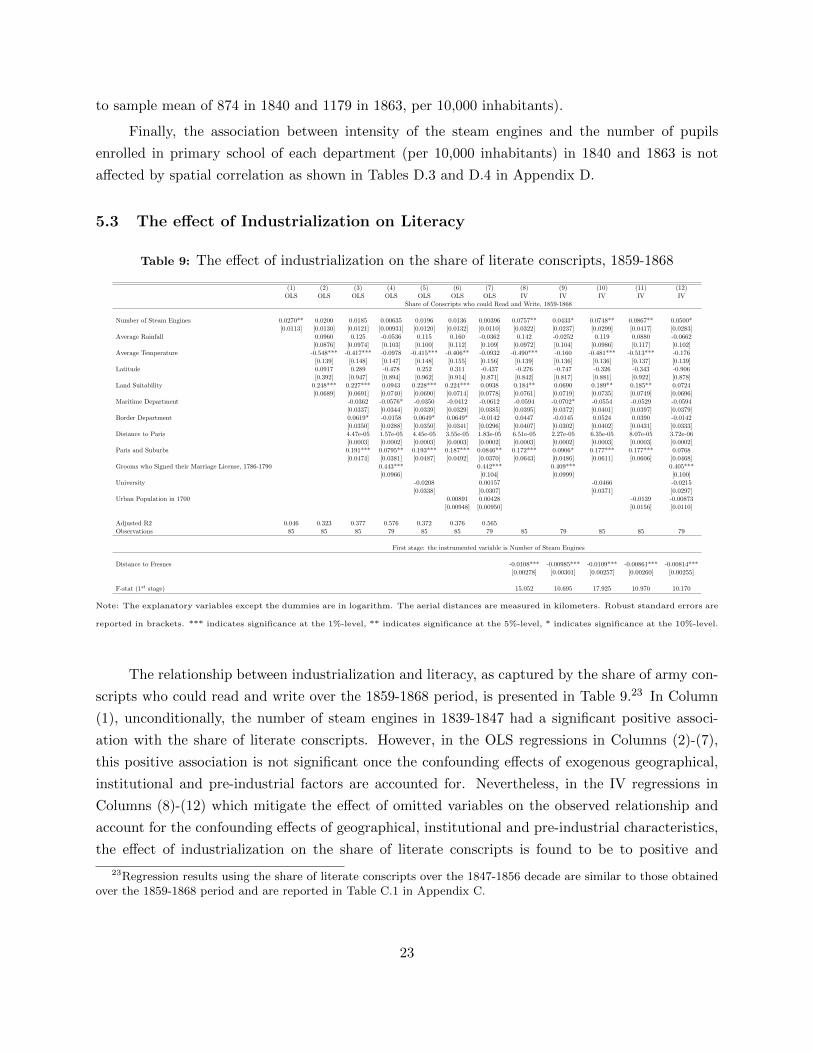
5.3 The effect of Industrialization on Literacy
Table 9: The effect of industrialization on the share of literate conscripts, 1859-1868
(1) (2) (3) (4) (5) (6) (7) (8) (9) (10) (11) (12)OLS OLS OLS OLS OLS OLS OLS IV IV IV IV IV
Share of Conscripts who could Read and Write, 1859-1868
Number of Steam Engines 0.0270** 0.0200 0.0185 0.00635 0.0196 0.0136 0.00396 0.0757** 0.0433* 0.0748** 0.0867** 0.0500*[0.0113] [0.0130] [0.0121] [0.00931] [0.0120] [0.0132] [0.0110] [0.0322] [0.0237] [0.0299] [0.0417] [0.0283]
Average Rainfall 0.0960 0.125 -0.0536 0.115 0.160 -0.0362 0.142 -0.0252 0.119 0.0880 -0.0662[0.0876] [0.0974] [0.103] [0.100] [0.112] [0.109] [0.0972] [0.104] [0.0986] [0.117] [0.102]
Average Temperature -0.548*** -0.417*** -0.0978 -0.415*** -0.406** -0.0932 -0.490*** -0.160 -0.481*** -0.513*** -0.176[0.139] [0.148] [0.147] [0.148] [0.155] [0.156] [0.139] [0.136] [0.136] [0.137] [0.139]
Latitude 0.0917 0.289 -0.478 0.252 0.311 -0.437 -0.276 -0.747 -0.326 -0.343 -0.906[0.392] [0.947] [0.894] [0.962] [0.914] [0.871] [0.842] [0.817] [0.881] [0.922] [0.878]
Land Suitability 0.248*** 0.227*** 0.0943 0.228*** 0.224*** 0.0938 0.184** 0.0690 0.189** 0.185** 0.0724[0.0689] [0.0691] [0.0740] [0.0690] [0.0714] [0.0778] [0.0761] [0.0719] [0.0735] [0.0749] [0.0696]
Maritime Department -0.0362 -0.0576* -0.0350 -0.0412 -0.0612 -0.0594 -0.0702* -0.0554 -0.0529 -0.0594[0.0337] [0.0344] [0.0339] [0.0329] [0.0385] [0.0395] [0.0372] [0.0401] [0.0397] [0.0379]
Border Department 0.0619* -0.0158 0.0649* 0.0649* -0.0142 0.0447 -0.0145 0.0524 0.0390 -0.0142[0.0350] [0.0288] [0.0350] [0.0341] [0.0296] [0.0407] [0.0302] [0.0402] [0.0431] [0.0333]
Distance to Paris 4.47e-05 1.57e-05 4.45e-05 3.55e-05 1.83e-05 6.51e-05 2.27e-05 6.35e-05 8.07e-05 3.72e-06[0.0003] [0.0002] [0.0003] [0.0003] [0.0002] [0.0003] [0.0002] [0.0003] [0.0003] [0.0002]
Paris and Suburbs 0.191*** 0.0795** 0.193*** 0.187*** 0.0846** 0.172*** 0.0906* 0.177*** 0.177*** 0.0768[0.0474] [0.0381] [0.0487] [0.0492] [0.0370] [0.0643] [0.0486] [0.0611] [0.0606] [0.0468]
Grooms who Signed their Marriage License, 1786-1790 0.443*** 0.442*** 0.409*** 0.405***[0.0966] [0.104] [0.0999] [0.100]
University -0.0208 0.00157 -0.0466 -0.0215[0.0338] [0.0307] [0.0371] [0.0297]
Urban Population in 1700 0.00891 0.00428 -0.0139 -0.00873[0.00948] [0.00950] [0.0156] [0.0110]
Adjusted R2 0.046 0.323 0.377 0.576 0.372 0.376 0.565Observations 85 85 85 79 85 85 79 85 79 85 85 79
First stage: the instrumented variable is Number of Steam Engines
Distance to Fresnes -0.0108*** -0.00985*** -0.0109*** -0.00861*** -0.00814***[0.00278] [0.00301] [0.00257] [0.00260] [0.00255]
F-stat (1st stage) 15.052 10.695 17.925 10.970 10.170
Note: The explanatory variables except the dummies are in logarithm. The aerial distances are measured in kilometers. Robust standard errors are
reported in brackets. *** indicates significance at the 1%-level, ** indicates significance at the 5%-level, * indicates significance at the 10%-level.
The relationship between industrialization and literacy, as captured by the share of army con-
scripts who could read and write over the 1859-1868 period, is presented in Table 9.23 In Column
(1), unconditionally, the number of steam engines in 1839-1847 had a significant positive associ-
ation with the share of literate conscripts. However, in the OLS regressions in Columns (2)-(7),
this positive association is not significant once the confounding effects of exogenous geographical,
institutional and pre-industrial factors are accounted for. Nevertheless, in the IV regressions in
Columns (8)-(12) which mitigate the effect of omitted variables on the observed relationship and
account for the confounding effects of geographical, institutional and pre-industrial characteristics,
the effect of industrialization on the share of literate conscripts is found to be to positive and
23Regression results using the share of literate conscripts over the 1847-1856 decade are similar to those obtainedover the 1859-1868 period and are reported in Table C.1 in Appendix C.
23

significant.24
Moreover, the regressions in Table 9 account for the impact of confounding geographical and
institutional factors. In some of the IV regressions in Columns (8)-(12) of Table 9, land suitability
had a significant positive association with the share of literate conscripts while temperature had a
significant negative relationship, but the coefficients are only significant when the share of grooms
who could sign their marriage license in 1786-1790 is excluded from the regressions.25 In addition,
the variables which control for the location of departments (i.e., latitude, border departments,
maritime departments, departments at a greater distance from the concentration of political power
in Paris) and pre-industrial development (the number of universities and urban population in 1700)
appear orthogonal to industrialization and literacy. As could be expected, the dummy variable for
Paris and its suburbs, as well as the share of grooms who could sign their marriage license in 1786-
1790, are significantly and positively associated with the share of literate conscripts in 1859-1868.
All in all, the IV estimate in Column (12) of Table 9 indicates that a one-percent increase in the
number of steam engines in a department in 1839-1847 increased the share of literate conscripts
in 1859-1868 by 0.05 percentage point. As such, if a department had increased its number steam
engines in 1839-1847 from the 25th percentile (i.e., 4 engines) to the 75th percentile (i.e., 31 engines),
this 675 percent increase in the number of steam engines would lead to a 33.75 percentage point
increase in the share of literate conscripts in 1859-1868 (relative to sample mean of 73.57 per cent
and a standard deviation of 14.96).
Finally, as established in Table D.5 in Appendix D, the association between the number of
steam engines and the share of literate conscripts is not affected by spatial correlation.
6 Robustness analysis
6.1 Endogenous confounding factors
This subsection examines the robustness of the baseline analysis to the inclusion of additional
confounding geographical, demographic, institutional and pre-industrial characteristics, which may
have contributed to the relationship between industrialization and economic development. These
confounding factors could be viewed as endogenous to the adoption of the steam engine and are
thus not part of the baseline analysis.26
In what follows, the analysis focuses on the potential impact of these confounding factors
24The F-statistic in the first stage is equal to 15.052. Furthermore, the IV coefficient in each specification is largerthan the OLS coefficient, which can probably be attributed to measurement error in the independent variable – thenumber of steam engines.
25As shown in Table B.2, the qualitative results are not affected if the share of grooms in the 1686-1690 and1816-1820 periods is used instead.
26Some of these characteristics could be viewed as “bad controls”(Angrist and Pischke, 2009).
24

on the baseline IV regressions in Tables 5 to 9, where the dependent variables are the number of
teachers in 1840 and 1863, the share of pupils in the population in 1840 and 1863, and the share
of literate conscripts over the 1859-1868 period.
6.1.1 Access to waterways
The number of steam engines in a department could have been affected by its trade potential,
as proxied by the presence of rivers and of their main tributaries within the perimeter of the
department. Using data on the paths of the Rhine, Loire, Meuse, Rhone, Seine and Garonne rivers
as well as of their major tributaries (Dordogne, Charente and Escaut), Table B.3 establishes that a
direct access to a river path, and thus to a major port, has no qualitative impact on the estimated
effect of industrialization on human capital.
6.1.2 The presence of raw material
The diffusion of the steam engine across French departments could have been impacted by the
presence of raw material required for industrialization. Moreover the wealth generated by this
raw material could have affected human capital. Nevertheless, the effect of industrialization on
1 - 4
5 - 16
17 - 29
30 - 52
A. Forges in 1789.
1 - 4
5 - 16
17 - 29
30 - 79
B. Forges in 1811.
No mine
313 - 2745
2746 - 6509
6510 - 10876
10877 - 49248
C. Area Covered by Mines in each department in 1837.
21 - 58
59 - 104
105 - 168
169 - 732
D. Market Integration in the 1790s.
Figure 7: Early economic development across French departments.
25

18.71 - 38.58
38.58 - 49.51
49.51 - 60.64
60.64 - 1033.91
A. Population Density in 1801
19.94 - 40.48
40.48 - 52.30
52.30 - 63.82
63.82 - 1032.35
B. Population Density in 1821.
Figure 8: Population Density in 1801 and 1821
human capital in the first stages of the industrial revolution remains nearly intact, economically
and statistically, when the number of iron forges in 1789 and 1811 (Panels A and B of Figure 7)
in each department (Woronoff, 1997) are accounted for in Table B.4 or when the area covered by
coal mines in 1837 (Panel C of Figure 7) in each department is taken into account in Table B.5.
6.1.3 Early economic integration
Human capital and the number of steam engines across France could have been affected by the
early degree of economic integration of each department into the French economy. However, Table
B.6 in Appendix B shows that the degree of market integration of each department, as proxied
by the number of its external suppliers in the 1790s and graphed in Panel D of Figure 7, has no
qualitative impact on the effect of industrialization on human capital in the early phase of the
industrial revolution.
6.1.4 Population density
In light of the historical evidence that steam engines were more likely to be located in urban
centers (Rosenberg and Trajtenberg, 2004), it is plausible that the potentially endogenous level of
population density could have been a factor in the adoption of the steam engine and in the formation
of human capital, and could have thus contributed to the relationship between industrialization and
human capital formation. Reassuringly, as reported in Table B.7 in Appendix B, population density
in each French department in 1801 and 1821 (as shown in Figure 8 has no qualitative impact on
the estimated effects and the statistical significance of industrialization on human capital.27
27The Tarn-et-Garonne department was established in 1812 from parts of Aveyron, Gers, Haute-Garonne, Lot andLot-et-Garonne. Thefore, we lose one observation when population density in 1801 is included in the analysis.
26

6.1.5 Past level of fertility
Human capital formation and the number of steam engines across France could have been affected
by differential fertility patterns across French departments (reflecting cultural characteristics as well
as economic incentives). In particular, conditional on pre-industrial levels of economic and human
capital development, departments in which fertility was higher prior to the 1839-1847 industrial
survey may have had characteristics that enhanced fertility and lowered the level of investment in
human capital (Galor, 2011). However, as reported in Table B.8, although the level of fertility in
1806 has the predicted negative effect on the various measures of human capital formation in the
post-1840 period, it has no qualitative impact on the estimated effect of industrialization on human
capital formation.28
6.2 Alternative measure of human capital: school buildings
This subsection explores the robustness of the baseline analysis to an alternative proxy of human
capital formation, i.e., school buildings. The analysis examines the effect of industrialization on
the number of school buildings per commune (the lowest administrative division of the French
territory) in each department. Surveys carried out in 1850 and 1863 indicate that the average
number of school buildings per commune increased from 1.88 in 1850 to 2.19 in 1863, with large
variations in the number of school buildings across departments.29 Since the 1850 and 1863 surveys
do not provide information on the size of the school buildings and the number of classrooms, this
variable can be viewed as a slightly imprecise measure of human capital formation.
The relationship between industrialization and the number of school buildings in 1850 and
1863 is presented in Tables B.9 and B.10. In Column (1) of both Tables, the unconditional OLS
estimate between the number of steam engines in industrial production in 1839-1847 and the number
of school buildings in 1840 and 1863 is positive but insignificant. This relationship remains positive
and becomes mostly significant once the confounding effects of exogenous geographical factors
(Column (2)), institutional factors (Column (3)) and pre-industrial characteristics (Columns (4)-
(7)) are taken into account. Finally, in the IV estimations in Columns (8)-(12) which accounts for
the confounding effects of geographical, institutional, and demographic characteristics, the number
of steam engines in 1839-1847 is found to have a positive and mostly significant impact on the
number of school buildings in 1840 and 1863. The IV estimates in Column (12) of Tables B.9 and
6 suggest that a one-percent increase in the number of steam engines in a department in 1839-
1847 increased the number of primary schools by 0.317 in 1840 and 0.334 in 1863. As such, if a
department had increased its number of steam engines in 1839-1847 from the 25th percentile (4) to
281806 is the earliest year for which the level of fertility is available across French departments (Bonneuil, 1997).Accounting for fertility in subsequent years, including the ones contemporaneous to the survey, does not affect theresults.
29French communes had been compelled by law to host at least one school building in their jurisdiction since 1833.
27
the 75th percentile (31), this 675 percent increase in the number of steam engines would increase
the number of school buildings by 2.14 in 1840 and 2.25 in 1863 (relative to a sample mean of 1.88
and a standard deviation of 1.34 in 1840 and a mean of 2.19 and a standard deviation of 2.56 in
1863). 30
Moreover, in the IV regressions in Tables B.9 and B.10, there is a positive and significant
association between the distance to Paris and the number of school buildings. There is also a neg-
ative and significant correlation between border departments and the number of school buildings.
However other characteristics of departments such as latitude, land suitability, maritime depart-
ments, as well as pre-industrial human capital and economic development, do not have any effect
on school buildings in the IV regressions.
7 Concluding remarks
The research explores the effect of industrialization on human capital formation. Exploiting exoge-
nous regional variations in the adoption of steam engines across France, the study establishes that
in contrast to conventional wisdom that views early industrialization as a predominantly deskilling
process, the industrial revolution was conducive for human capital formation, generating broad
increases in literacy rates and education attainment.
In particular, the study established that during the first phase of industrialization in France,
a French department that would have experienced an increase in the number steam engines from
the 25th percentile to the 75th percentile of the distribution (during the 1839-1847 period), would
have witness: (i) a 34 percentage point increase in the share of literate conscripts in 1859-1868,
relative to sample mean of 74%, (ii) an additional 1249 pupils (per 10000 inhabitants) relative to
a sample mean of 1179, and (iii) an additional the number of teachers of 3362 in 1863, relative to
a sample mean of 1243.
The research thus lends further credence to the emerging view that human capital was instru-
mental in the process of industrialization, governing the pace of the transition from stagnation to
growth and comparative economic development across the world.
30The F-statistic in the first stage is equal to 15.052 in the absence of pre-industrial controls. Furthermore, the IVcoefficient in each specification is larger than the OLS coefficient, which can probably be attributed to measurementerror in the explanatory variable – the number of steam engines.
28
References
Acemoglu, Daron (2002), ‘Technical change, inequality and labor market’, Journal of Economic Literature
40(1), 7–72.
Angrist, Joshua D. and Jorn-Steffen Pischke (2009), Mostly Harmless Econometrics: An Empiricist’s Com-
panion, Princeton University Press, Princeton, NJ.
Atack, Jeremy (1979), ‘Fact in fiction? Relative in costs of steam and water power: a simulation approach’,
Explorations in Economic History 16(10), 409–437.
Ballot, Charles (1923), L’Introduction du Machinisme dans l’Industrie Francaise, Slatkine Reprints (1978),
Geneva.
Bonneuil, Noel (1997), Transformation of the French Demographic Landscape, 1806-1906, Clarendon Press,
Oxford, UK.
Bosker, Maarten, Eltjo Buringh and Jan Luiten van Zanden (2013), ‘From Baghdad to London: unravel-
ling urban development in Europe and the Arab world 800-1800’, Review of Economics and Statistics
95(4), 1418–1437.
Bresnahan, Timothy F. and Manuel Trajtenberg (1995), ‘General purpose technologies: engines of growth?’,
Journal of Econometrics 65(1), 83–108.
Chanut, Jean-Marie, Jean Heffer, Jacques Mairesse and Gilles Postel-Vinay (2000), LIndustrie Francaise au
Milieu du 19e Siecle. Les enquetes de la Statistique Generale de la France, EHESS, Paris.
Conley, Timothy G. (1999), ‘GMM estimation with cross sectional dependence’, Journal of Econometrics
92(1), 1–45.
Crouzet, Francois (2003), ‘The historiography of French economic growth in the nineteenth century’, Eco-
nomic History Review 62(2), 215242.
Daudin, Guillaume (2010), ‘Domestic trade and market size in late eighteenth-century France’, Journal of
Economic History 70(3), 716–743.
Diebolt, Claude, Magali Jaoul and Gilles San Martino (2005), ‘Le mythe de Ferry: une analyse cliometrique’,
Revue d’economie politique 115(4), 471–497.
Franck, Raphael (2010), ‘Economic growth and the separation of church and state: The french case’, Eco-
nomic Inquiry 48(4), 841–859.
Franck, Raphael (2015), ‘The political consequences of income shocks: explaining the consolidation of democ-
racy in France’, Review of Economics and Statistics 00(00), 00–00.
Furet, Francois and Jacques Ozouf (1977), Lire et ecrire. Lalphabetisation des Francais de Calvin a Judes
Ferry, Editions de Minuit, Paris, France.
Galor, Oded (2011), Unified Growth Theory, Princeton University Press, Princeton, NJ.
Godechot, Jacques (1951), Les institutions de la France sous la Revolution et l’Empire, Presses Universitaires
de France, Paris, France.
Goldin, Claudia and Lawrence F. Katz (1998), ‘The origins of technology-skill complementary’, Quarterly
Journal of Economics 113(3), 693–732.
Grantham, George (1997), ‘The french cliometric revolution: a survey of cliometric contributions to french
economic history’, European Review of Economic History 1, 353–405.
Grew, Raymond and Patrick J. Harrigan (1991), School, State, and Society: The Growth of Elementary
Schooling in Nineteenth-Century France–A Quantitative Analysis, University of Michigan Press, Ann Ar-
bor, MI.
29

Kanefsky, John and John Robey (1980), ‘Steam engines in 18th-century Britain: a quantitative assessment’,
Technology and Culture 21(2), 161–186.
Lebrun, Francois, Jean Queniart and Marc Venard (2003), Histoire generale de l’enseignement et de
l’education en France: de Gutempberg aux Lumieres (1480-1789), Perrin - Collection Tempus, Paris,
France.
Leon, Pierre (1976), L’affermissement du phenomene d’industrialisation, in F.Braudel and E.Labrousse, eds,
‘Histoire economique et sociale de la France, vol. 3’, PUF, Paris, pp. 475–616.
Lepetit, Bernard (1994), The Pre-Industrial Urban System: France, 1740-1840, Cambridge University Press,
Cambridge, UK.
Levy-Leboyer, Maurice and Francois Bourguignon (1990), The French Economy in the Nineteenth Century,
Cambridge University Press, Cambridge, UK.
Mayeur, Francoise (1979), L’education des filles en France au XIXe siecle, Hachette, Paris.
Mayeur, Francoise (2003), Histoire generale de l’enseignement et de l’education en France: De la Revolution
a l’Ecole Republicaine (1789-1930), Perrin - Collection Tempus, Paris, France.
Mitch, David F. (1992), The rise of popular literacy in Victorian England: the influence of private choice
and public policy, University of Pennsylvania Press, Philadelphia, PA.
Mokyr, Joel (1990), The Lever of Riches, Oxford University Press, Oxford, U.K.
Mokyr, Joel (1993), The new economic history and the industrial revolution, in J.Mokyr, ed., ‘The British
Industrial Revolution: An Economic Perspective’, Westview Press, Boulder, CO, p. 1131.
Nuvolari, Alessandro, Bart Verspagen and Nick von Tunzelmann (2011), ‘Steam engines in 18th-century
Britain: a quantitative assessment’, Cliometrica 21(5), 291–321.
Ozak, Omer (2013), Distance to the technological frontier and economic development. Southern Methodist
University Working Paper.
Ramankutty, Navin, Jonathan A. Foley, John Norman and Kevin McSweeney (2002), ‘The global distribu-
tion of cultivable lands: current patterns and sensitivity to possible climate change’, Global Ecology and
Biogeography 11(5), 377 392.
Rosenberg, Nathan and Manuel Trajtenberg (2004), ‘A general purpose technology at work: the Corliss
steam engine in the late nineteenth-century United States’, Journal of Economic History 64(1), 1–39.
Rouche, Michel (2003), Histoire generale de l’enseignement et de l’education en France: des origines la
renaissance (Ve siecle av. J.-C.- XVe siecle), Perrin - Collection Tempus, Paris, France.
See, Henri (1925), La vie Economique de la France sous la Monarchie Censitaire (1815-1848), Librairie Felix
Alcan, Paris.
Squicciarini, Mara P. and Nico Voigtlander (2016), ‘Human capital and industrialization: evidence from the
age of enlightenment’, Quarterly Journal of Economics 1(1-2), 3–4.
Tackett, Timothy (1986), Religion, revolution, and regional culture in eighteenth-century France: the eccle-
siastical oath of 1791, Princeton University Press, Princeton, NJ.
Weber, Eugen (1976), Peasants into Frenchmen: the Modernization of Rural France, 1870-1914, Stanford
University Press, Stanford, CA.
Woronoff, Denis (1997), Les forges, 1811, in G.Beaur and P.Minard, eds, ‘Atlas de la revolution francaise:
Economie, Vol. 10’, Editions de l’ecole des hautes etudes en sciences sociales, Paris, pp. 99–100.
30

Appendix A. Descriptive Statistics
Table A.1: Descriptive statistics
Obs. Mean Std. Dev. Min. Max.Dependent VariablesTeachers, 1840 85 741.82 347.10 187 1907Teachers, 1863 85 1242.93 612.15 515 4903Pupils Enrolled in Schools (per 10,000 inhabitants), 1840 85 873.94 413.61 314 1794Pupils Enrolled in Schools (per 10,000 inhabitants), 1863 85 1179.01 301.06 641 1909School buildings per Commune, 1850 85 1.88 1.34 1.01 12.22Schools buildings per Commune, 1863 85 2.19 2.56 1.07 24.54Share of Conscripts who could Read and Write, 1847-1856 85 0.63 0.18 0.31 0.96Share of Conscripts who could Read and Write, 1859-1868 85 0.74 0.15 0.41 0.98
Explanatory VariablesNumber of Steam Engines 85 29.20 66.14 0 565Number of Steam Engines per Inhabitant in 1841 85 .00006 .00007 0 .0005Average Rainfall 85 872.23 152.11 642.90 1289.24Average Temperature 85 10.57 1.50 4.60 13.73Latitude 85 46.59 2.12 42.60 50.49Land Suitability 85 0.75 0.18 0.21 0.98Maritime Department 85 0.26 0.44 0 1Border Department 85 0.20 0.40 0 1Distance to Paris 85 353.73 179.53 1 686.79Paris and Suburbs 85 0.04 0.19 0 1Grooms who Signed their Marriage License, 1786-1790 79 0.42 0.24 0.05 0.92University 85 0.19 0.39 0 1Urban Population in 1700 85 21.76 58.96 0 510
Instrumental VariableDistance to Fresnes 85 485.44 216.60 42.88 862.60
Variables for Robustness AnalysisShare of department’s territory covered by mines, 1837 85 0.008 0.015 0.00009 0.086Fertility, 1806 85 0.41 0.11 0.25 0.84Grooms who Signed their Marriage License, 1786-1790 76 25.90 14.87 6.27 64.25Grooms who Signed their Marriage License, 1786-1790 78 50.61 22.14 13.35 96.28Population Density, 1801 84 0.75 1.55 0.19 13.17Population Density, 1821 85 0.85 1.94 0.21 17.15Iron Forges, 1789 85 2.25 8.95 0 52Iron Forges, 1811 85 2.65 11.34 0 79Presence of Iron Forges, 1789 85 0.11 0.31 0 1Presence of Iron Forges, 1811 85 0.11 0.31 0 1Market Integration during the French Revolution 84 134.68 107.44 21 732Rivers and Tributaries 85 0.565 0.498 0 1Distance from London 85 620.71 219.31 242.93 1015.33Distance from Marseille 85 483.10 215.25 1 902.67Distance from Lyon 85 334.58 149.94 1 723.27Distance from Rouen 85 405.74 199.16 1 774.94Distance from Mulhouse 85 456.25 187.92 36.61 853.41Distance from Bordeaux 85 398.27 171.53 1 759.49Distance from Fresnes (weeks of travel) 85 .471 0.185 0.045 0.862Distance from Paris (weeks of travel) 85 0.389 0.168 0.003 0.693Distance from Marseille (weeks of travel) 85 0.509 0.232 0.041 0.999Distance from Lyon (weeks of travel) 85 0.427 .229 0.029 0.960Distance from Mulhouse (weeks of travel) 85 0.641 0.292 0.012 1.126Distance from Rouen (weeks of travel) 85 0.442 0.201 0.022 0.839Distance from Bordeaux (weeks of travel) 85 0.513 0.265 0.002 1.125
31
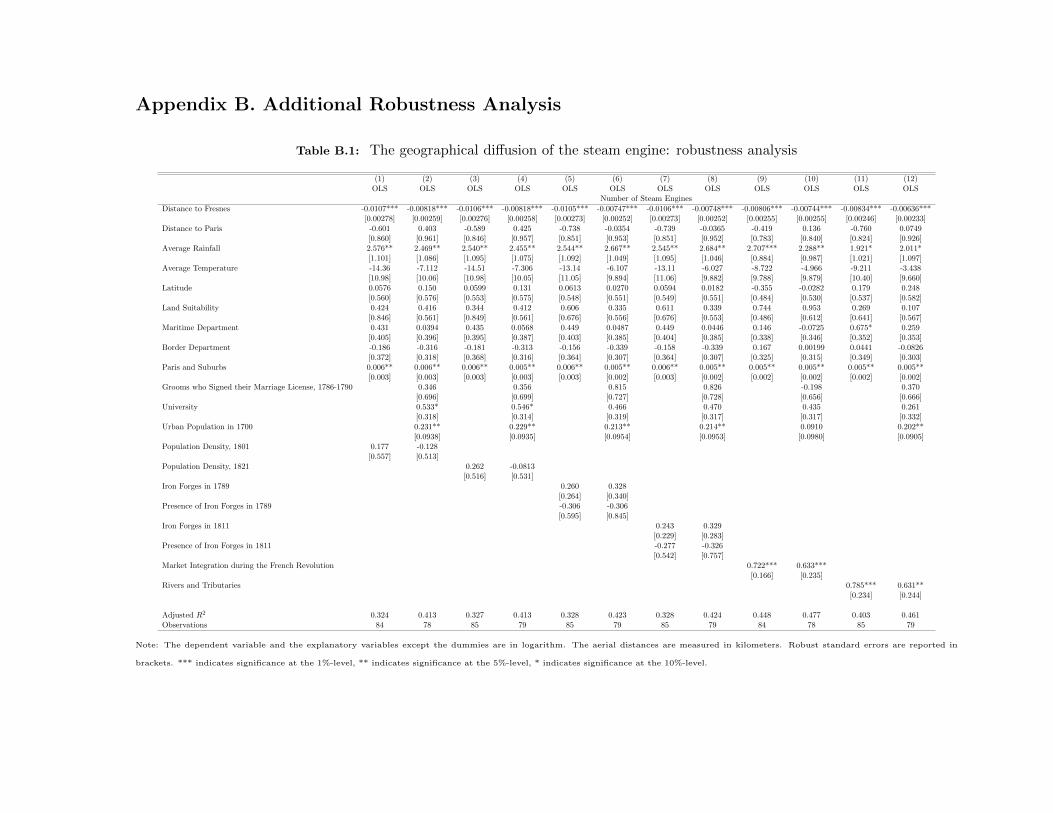
Appendix B. Additional Robustness Analysis
Table B.1: The geographical diffusion of the steam engine: robustness analysis
(1) (2) (3) (4) (5) (6) (7) (8) (9) (10) (11) (12)OLS OLS OLS OLS OLS OLS OLS OLS OLS OLS OLS OLS
Number of Steam Engines
Distance to Fresnes -0.0107*** -0.00818*** -0.0106*** -0.00818*** -0.0105*** -0.00747*** -0.0106*** -0.00748*** -0.00806*** -0.00744*** -0.00834*** -0.00636***[0.00278] [0.00259] [0.00276] [0.00258] [0.00273] [0.00252] [0.00273] [0.00252] [0.00255] [0.00255] [0.00246] [0.00233]
Distance to Paris -0.601 0.403 -0.589 0.425 -0.738 -0.0354 -0.739 -0.0365 -0.419 0.136 -0.760 0.0749[0.860] [0.961] [0.846] [0.957] [0.851] [0.953] [0.851] [0.952] [0.783] [0.840] [0.824] [0.926]
Average Rainfall 2.576** 2.469** 2.540** 2.455** 2.544** 2.667** 2.545** 2.684** 2.707*** 2.288** 1.921* 2.011*[1.101] [1.086] [1.095] [1.075] [1.092] [1.049] [1.095] [1.046] [0.884] [0.987] [1.021] [1.097]
Average Temperature -14.36 -7.112 -14.51 -7.306 -13.14 -6.107 -13.11 -6.027 -8.722 -4.966 -9.211 -3.438[10.98] [10.06] [10.98] [10.05] [11.05] [9.894] [11.06] [9.882] [9.788] [9.879] [10.40] [9.660]
Latitude 0.0576 0.150 0.0599 0.131 0.0613 0.0270 0.0594 0.0182 -0.355 -0.0282 0.179 0.248[0.560] [0.576] [0.553] [0.575] [0.548] [0.551] [0.549] [0.551] [0.484] [0.530] [0.537] [0.582]
Land Suitability 0.424 0.416 0.344 0.412 0.606 0.335 0.611 0.339 0.744 0.953 0.269 0.107[0.846] [0.561] [0.849] [0.561] [0.676] [0.556] [0.676] [0.553] [0.486] [0.612] [0.641] [0.567]
Maritime Department 0.431 0.0394 0.435 0.0568 0.449 0.0487 0.449 0.0446 0.146 -0.0725 0.675* 0.259[0.405] [0.396] [0.395] [0.387] [0.403] [0.385] [0.404] [0.385] [0.338] [0.346] [0.352] [0.353]
Border Department -0.186 -0.316 -0.181 -0.313 -0.156 -0.339 -0.158 -0.339 0.167 0.00199 0.0441 -0.0826[0.372] [0.318] [0.368] [0.316] [0.364] [0.307] [0.364] [0.307] [0.325] [0.315] [0.349] [0.303]
Paris and Suburbs 0.006** 0.006** 0.006** 0.005** 0.006** 0.005** 0.006** 0.005** 0.005** 0.005** 0.005** 0.005**[0.003] [0.003] [0.003] [0.003] [0.003] [0.002] [0.003] [0.002] [0.002] [0.002] [0.002] [0.002]
Grooms who Signed their Marriage License, 1786-1790 0.346 0.356 0.815 0.826 -0.198 0.370[0.696] [0.699] [0.727] [0.728] [0.656] [0.666]
University 0.533* 0.546* 0.466 0.470 0.435 0.261[0.318] [0.314] [0.319] [0.317] [0.317] [0.332]
Urban Population in 1700 0.231** 0.229** 0.213** 0.214** 0.0910 0.202**[0.0938] [0.0935] [0.0954] [0.0953] [0.0980] [0.0905]
Population Density, 1801 0.177 -0.128[0.557] [0.513]
Population Density, 1821 0.262 -0.0813[0.516] [0.531]
Iron Forges in 1789 0.260 0.328[0.264] [0.340]
Presence of Iron Forges in 1789 -0.306 -0.306[0.595] [0.845]
Iron Forges in 1811 0.243 0.329[0.229] [0.283]
Presence of Iron Forges in 1811 -0.277 -0.326[0.542] [0.757]
Market Integration during the French Revolution 0.722*** 0.633***[0.166] [0.235]
Rivers and Tributaries 0.785*** 0.631**[0.234] [0.244]
Adjusted R2 0.324 0.413 0.327 0.413 0.328 0.423 0.328 0.424 0.448 0.477 0.403 0.461Observations 84 78 85 79 85 79 85 79 84 78 85 79
Note: The dependent variable and the explanatory variables except the dummies are in logarithm. The aerial distances are measured in kilometers. Robust standard errors are reported in
brackets. *** indicates significance at the 1%-level, ** indicates significance at the 5%-level, * indicates significance at the 10%-level.

Table B.2: Industrialization and human capital formation, accounting for grooms who could sign their marriage license in 1686-1690 and 1816-1820
(1) (2) (3) (4) (5) (6) (7) (8) (9) (10) (11) (12) (13) (14) (15)IV IV IV IV IV IV IV IV IV IV IV IV IV IV IV
Teachers Teachers Pupils (per 10,000 inhabitants) Pupils (per 10,000 inhabitants) Share of Conscripts who could1840 1863 1840 1863 Read and Write, 1859-1868
Number of Steam Engines 247.6*** 256.9*** 226.8*** 424.0*** 451.7*** 452.5*** 238.7*** 222.0*** 183.0** 160.6*** 156.0*** 133.1** 0.0757** 0.0634*** 0.0369**[60.58] [69.50] [72.09] [86.89] [86.39] [102.9] [89.13] [74.88] [77.15] [49.33] [49.20] [53.49] [0.0322] [0.0195] [0.0173]
Grooms who Signed their Marriage License, 1686-1690 248.7 -493.3 1,124*** 459.5** 0.613***[298.4] [412.9] [355.0] [231.4] [0.0955]
Grooms who Signed their Marriage License, 1816-1820 479.7** -104.3 1,241*** 620.0*** 0.585***[217.3] [331.0] [237.0] [173.8] [0.0671]
Average Rainfall 687.1*** 691.0*** 544.1** 705.1** 627.0** 789.6** 716.1*** 819.4*** 282.5 585.7*** 614.1*** 374.5** 0.142 0.204** -0.0834[225.2] [222.5] [239.7] [322.2] [316.8] [369.4] [237.0] [246.7] [231.7] [168.9] [185.6] [187.6] [0.0972] [0.0962] [0.0993]
Average Temperature -1,171*** -966.7** -801.4** -984.5** -1,261*** -1,202** -1,849*** -1,138*** -910.0*** -1,407*** -1,035*** -924.8*** -0.490*** -0.173 -0.0375[298.0] [402.5] [358.1] [392.1] [459.5] [485.4] [347.5] [367.4] [282.3] [259.8] [285.1] [253.0] [0.139] [0.122] [0.0899]
Latitude 788.9 821.0 -96.64 1,447 1,722 1,425 775.6 497.6 -1,851 -1,127 -1,594 -2,748* -0.276 -0.468 -1.194**[2,149] [2,323] [2,350] [2,852] [2,892] [3,382] [2,144] [2,348] [2,264] [1,574] [1,639] [1,611] [0.842] [0.867] [0.594]
Land Suitability 247.1 122.5 44.54 37.39 22.38 34.53 398.2** 217.0 -39.42 291.4** 198.4 63.07 0.184** 0.104* -0.00709[158.0] [167.9] [181.8] [205.0] [208.4] [243.7] [198.6] [173.5] [151.6] [135.8] [129.9] [120.5] [0.0761] [0.0592] [0.0504]
Maritime Department 64.63 75.97 75.22 129.5 183.1 156.7 -121.7 -182.7* -151.4 -31.38 -55.15 -39.91 -0.0594 -0.0853** -0.0651**[98.54] [109.1] [98.00] [132.0] [149.1] [148.9] [100.4] [108.6] [92.95] [71.84] [77.98] [69.52] [0.0395] [0.0373] [0.0282]
Border Department -42.35 -1.258 -73.93 -154.2 -62.27 -107.0 84.78 57.65 -51.12 57.36 63.20 -13.19 0.0447 0.00822 -0.0291[96.32] [93.97] [94.98] [120.3] [110.9] [115.9] [110.1] [109.0] [91.11] [73.50] [75.23] [62.96] [0.0407] [0.0364] [0.0288]
Distance to Paris 0.566 0.510 0.350 0.778 0.636 0.747 0.435 0.520 -0.0556 -0.219 -0.321 -0.552 6.51e-05 0.000144 -9.99e-05[0.588] [0.636] [0.587] [0.801] [0.875] [0.873] [0.638] [0.643] [0.544] [0.481] [0.488] [0.434] [0.000265] [0.000265] [0.000185]
Paris and Suburbs 378.2*** 290.9*** 193.0* 1,346 370.9** 362.9* 81.07 154.5 -59.30 -40.57 78.02 -28.29 0.172*** 0.121** 0.0245[111.7] [106.5] [109.1] [840.1] [178.3] [185.3] [244.7] [184.9] [221.5] [218.1] [180.8] [202.3] [0.0643] [0.0581] [0.0643]
Observations 85 76 78 85 76 78 85 76 78 85 76 78 85 76 78
First stage: the instrumented variable is Number of Steam Engines
Distance to Fresnes -0.0108*** -0.0101*** -0.00931*** -0.0108*** -0.0101*** -0.00931*** -0.0108*** -0.0101*** -0.00931*** -0.0108*** -0.0101*** -0.00931*** -0.0108*** -0.0101*** -0.00931***[0.00278] [0.00302] [0.00305] [0.00278] [0.00302] [0.00305] [0.00278] [0.00302] [0.00305] [0.00278] [0.00302] [0.00305] [0.00278] [0.00302] [0.00305]
F-stat (1st stage) 15.052 11.175 9.335 15.052 11.175 9.335 15.052 11.175 9.335 15.052 11.175 9.335 15.052 11.175 9.335
Note: The explanatory variables except the dummies are in logarithm. The aerial distances are measured in kilometers. Robust standard errors are reported in brackets. *** indicates significance at the 1%-level, **
indicates significance at the 5%-level, * indicates significance at the 10%-level.
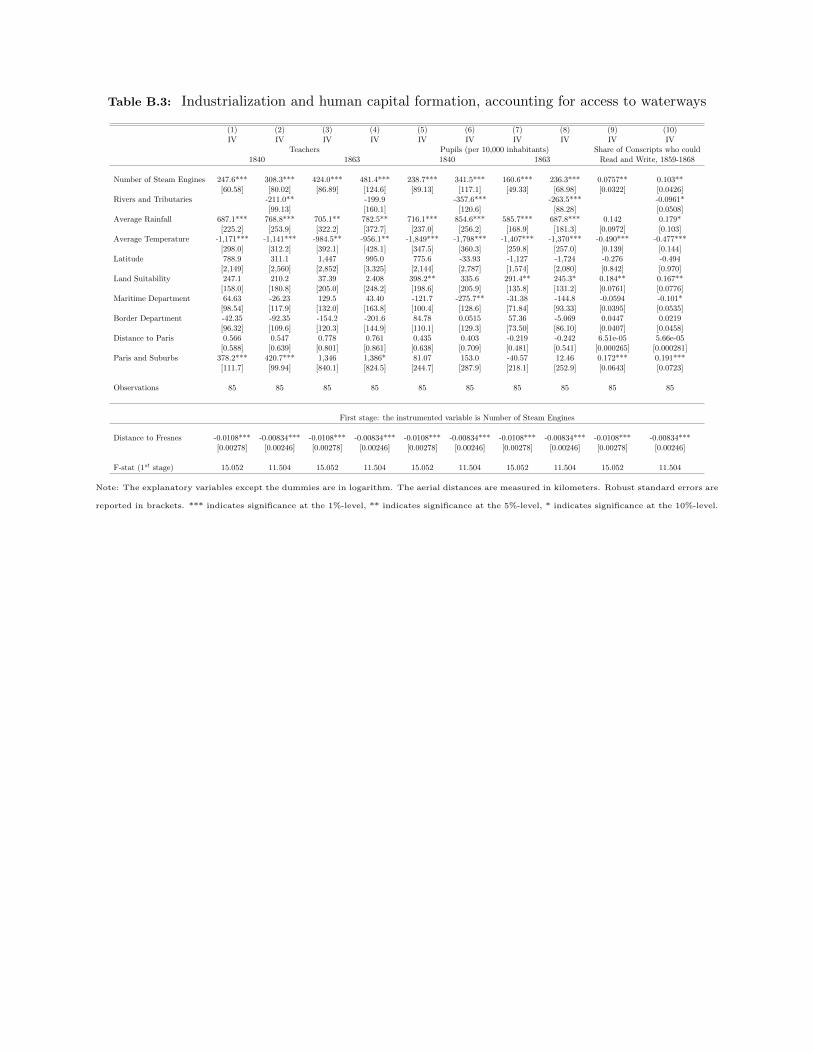
Table B.3: Industrialization and human capital formation, accounting for access to waterways
(1) (2) (3) (4) (5) (6) (7) (8) (9) (10)IV IV IV IV IV IV IV IV IV IV
Teachers Pupils (per 10,000 inhabitants) Share of Conscripts who could1840 1863 1840 1863 Read and Write, 1859-1868
Number of Steam Engines 247.6*** 308.3*** 424.0*** 481.4*** 238.7*** 341.5*** 160.6*** 236.3*** 0.0757** 0.103**[60.58] [80.02] [86.89] [124.6] [89.13] [117.1] [49.33] [68.98] [0.0322] [0.0426]
Rivers and Tributaries -211.0** -199.9 -357.6*** -263.5*** -0.0961*[99.13] [160.1] [120.6] [88.28] [0.0508]
Average Rainfall 687.1*** 768.8*** 705.1** 782.5** 716.1*** 854.6*** 585.7*** 687.8*** 0.142 0.179*[225.2] [253.9] [322.2] [372.7] [237.0] [256.2] [168.9] [181.3] [0.0972] [0.103]
Average Temperature -1,171*** -1,141*** -984.5** -956.1** -1,849*** -1,798*** -1,407*** -1,370*** -0.490*** -0.477***[298.0] [312.2] [392.1] [428.1] [347.5] [360.3] [259.8] [257.0] [0.139] [0.144]
Latitude 788.9 311.1 1,447 995.0 775.6 -33.93 -1,127 -1,724 -0.276 -0.494[2,149] [2,560] [2,852] [3,325] [2,144] [2,787] [1,574] [2,080] [0.842] [0.970]
Land Suitability 247.1 210.2 37.39 2.408 398.2** 335.6 291.4** 245.3* 0.184** 0.167**[158.0] [180.8] [205.0] [248.2] [198.6] [205.9] [135.8] [131.2] [0.0761] [0.0776]
Maritime Department 64.63 -26.23 129.5 43.40 -121.7 -275.7** -31.38 -144.8 -0.0594 -0.101*[98.54] [117.9] [132.0] [163.8] [100.4] [128.6] [71.84] [93.33] [0.0395] [0.0535]
Border Department -42.35 -92.35 -154.2 -201.6 84.78 0.0515 57.36 -5.069 0.0447 0.0219[96.32] [109.6] [120.3] [144.9] [110.1] [129.3] [73.50] [86.10] [0.0407] [0.0458]
Distance to Paris 0.566 0.547 0.778 0.761 0.435 0.403 -0.219 -0.242 6.51e-05 5.66e-05[0.588] [0.639] [0.801] [0.861] [0.638] [0.709] [0.481] [0.541] [0.000265] [0.000281]
Paris and Suburbs 378.2*** 420.7*** 1,346 1,386* 81.07 153.0 -40.57 12.46 0.172*** 0.191***[111.7] [99.94] [840.1] [824.5] [244.7] [287.9] [218.1] [252.9] [0.0643] [0.0723]
Observations 85 85 85 85 85 85 85 85 85 85
First stage: the instrumented variable is Number of Steam Engines
Distance to Fresnes -0.0108*** -0.00834*** -0.0108*** -0.00834*** -0.0108*** -0.00834*** -0.0108*** -0.00834*** -0.0108*** -0.00834***[0.00278] [0.00246] [0.00278] [0.00246] [0.00278] [0.00246] [0.00278] [0.00246] [0.00278] [0.00246]
F-stat (1st stage) 15.052 11.504 15.052 11.504 15.052 11.504 15.052 11.504 15.052 11.504
Note: The explanatory variables except the dummies are in logarithm. The aerial distances are measured in kilometers. Robust standard errors are
reported in brackets. *** indicates significance at the 1%-level, ** indicates significance at the 5%-level, * indicates significance at the 10%-level.
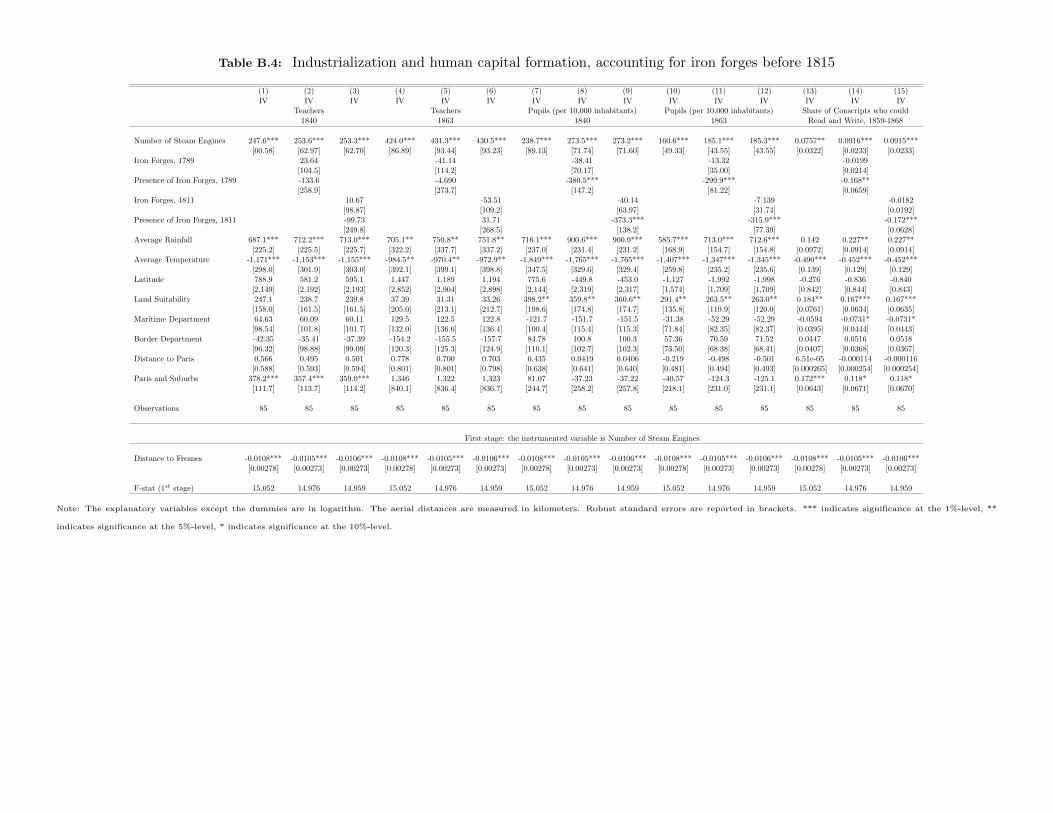
Table B.4: Industrialization and human capital formation, accounting for iron forges before 1815
(1) (2) (3) (4) (5) (6) (7) (8) (9) (10) (11) (12) (13) (14) (15)IV IV IV IV IV IV IV IV IV IV IV IV IV IV IV
Teachers Teachers Pupils (per 10,000 inhabitants) Pupils (per 10,000 inhabitants) Share of Conscripts who could1840 1863 1840 1863 Read and Write, 1859-1868
Number of Steam Engines 247.6*** 253.6*** 253.3*** 424.0*** 431.3*** 430.5*** 238.7*** 273.5*** 273.2*** 160.6*** 185.1*** 185.3*** 0.0757** 0.0916*** 0.0915***[60.58] [62.97] [62.70] [86.89] [93.44] [93.23] [89.13] [71.74] [71.60] [49.33] [43.55] [43.55] [0.0322] [0.0233] [0.0233]
Iron Forges, 1789 23.64 -41.14 -38.41 -13.32 -0.0199[104.5] [114.2] [70.17] [35.00] [0.0214]
Presence of Iron Forges, 1789 -133.6 -4.690 -380.5*** -299.9*** -0.168**[258.9] [273.7] [147.2] [81.22] [0.0659]
Iron Forges, 1811 10.67 -53.51 -40.14 -7.139 -0.0182[98.87] [109.2] [63.97] [31.74] [0.0192]
Presence of Iron Forges, 1811 -99.73 31.71 -373.3*** -315.9*** -0.172***[249.8] [268.5] [138.2] [77.39] [0.0628]
Average Rainfall 687.1*** 712.2*** 713.0*** 705.1** 750.8** 751.8** 716.1*** 900.6*** 900.9*** 585.7*** 713.0*** 712.6*** 0.142 0.227** 0.227**[225.2] [225.5] [225.7] [322.2] [337.7] [337.2] [237.0] [231.4] [231.2] [168.9] [154.7] [154.8] [0.0972] [0.0914] [0.0914]
Average Temperature -1,171*** -1,153*** -1,155*** -984.5** -970.4** -972.9** -1,849*** -1,765*** -1,765*** -1,407*** -1,347*** -1,345*** -0.490*** -0.452*** -0.452***[298.0] [301.9] [303.0] [392.1] [399.1] [398.8] [347.5] [329.6] [329.4] [259.8] [235.2] [235.6] [0.139] [0.129] [0.129]
Latitude 788.9 581.2 595.1 1,447 1,189 1,194 775.6 -449.8 -453.0 -1,127 -1,992 -1,998 -0.276 -0.836 -0.840[2,149] [2,192] [2,193] [2,852] [2,904] [2,898] [2,144] [2,319] [2,317] [1,574] [1,709] [1,709] [0.842] [0.844] [0.843]
Land Suitability 247.1 238.7 239.8 37.39 31.31 33.26 398.2** 359.8** 360.6** 291.4** 263.5** 263.0** 0.184** 0.167*** 0.167***[158.0] [161.5] [161.5] [205.0] [213.1] [212.7] [198.6] [174.8] [174.7] [135.8] [119.9] [120.0] [0.0761] [0.0634] [0.0635]
Maritime Department 64.63 60.09 60.11 129.5 122.5 122.8 -121.7 -151.7 -151.5 -31.38 -52.29 -52.29 -0.0594 -0.0731* -0.0731*[98.54] [101.8] [101.7] [132.0] [136.6] [136.4] [100.4] [115.4] [115.3] [71.84] [82.35] [82.37] [0.0395] [0.0444] [0.0443]
Border Department -42.35 -35.41 -37.39 -154.2 -155.5 -157.7 84.78 100.8 100.3 57.36 70.59 71.52 0.0447 0.0516 0.0518[96.32] [98.88] [99.09] [120.3] [125.3] [124.9] [110.1] [102.7] [102.3] [73.50] [68.38] [68.41] [0.0407] [0.0368] [0.0367]
Distance to Paris 0.566 0.495 0.501 0.778 0.700 0.703 0.435 0.0419 0.0406 -0.219 -0.498 -0.501 6.51e-05 -0.000114 -0.000116[0.588] [0.593] [0.594] [0.801] [0.801] [0.798] [0.638] [0.641] [0.640] [0.481] [0.494] [0.493] [0.000265] [0.000254] [0.000254]
Paris and Suburbs 378.2*** 357.4*** 359.0*** 1,346 1,322 1,323 81.07 -37.23 -37.22 -40.57 -124.3 -125.1 0.172*** 0.118* 0.118*[111.7] [113.7] [114.2] [840.1] [836.4] [836.7] [244.7] [258.2] [257.8] [218.1] [231.0] [231.1] [0.0643] [0.0671] [0.0670]
Observations 85 85 85 85 85 85 85 85 85 85 85 85 85 85 85
First stage: the instrumented variable is Number of Steam Engines
Distance to Fresnes -0.0108*** -0.0105*** -0.0106*** -0.0108*** -0.0105*** -0.0106*** -0.0108*** -0.0105*** -0.0106*** -0.0108*** -0.0105*** -0.0106*** -0.0108*** -0.0105*** -0.0106***[0.00278] [0.00273] [0.00273] [0.00278] [0.00273] [0.00273] [0.00278] [0.00273] [0.00273] [0.00278] [0.00273] [0.00273] [0.00278] [0.00273] [0.00273]
F-stat (1st stage) 15.052 14.976 14.959 15.052 14.976 14.959 15.052 14.976 14.959 15.052 14.976 14.959 15.052 14.976 14.959
Note: The explanatory variables except the dummies are in logarithm. The aerial distances are measured in kilometers. Robust standard errors are reported in brackets. *** indicates significance at the 1%-level, **
indicates significance at the 5%-level, * indicates significance at the 10%-level.

Table B.5: Industrialization and human capital formation, accounting for mines in 1837
(1) (2) (3) (4) (5) (6) (7) (8) (9) (10)IV IV IV IV IV IV IV IV IV IV
Teachers Pupils (per 10,000 inhabitants) Share of Conscripts who could1840 1863 1840 1863 Read and Write, 1859-1868
Number of Steam Engines 247.6*** 308.5*** 424.0*** 475.3*** 238.7*** 370.0*** 160.6*** 228.0*** 0.0757** 0.115***[60.58] [91.10] [86.89] [129.7] [89.13] [115.3] [49.33] [69.46] [0.0322] [0.0408]
Share of department’s territory covered by mines, 1837 -48.04* -40.53 -103.5*** -53.19*** -0.0306***[27.50] [40.59] [31.80] [20.57] [0.0113]
Average Rainfall 687.1*** 651.4*** 705.1** 675.0** 716.1*** 639.3** 585.7*** 546.3*** 0.142 0.119[225.2] [243.7] [322.2] [342.9] [237.0] [284.1] [168.9] [188.9] [0.0972] [0.106]
Average Temperature -1,171*** -1,413*** -984.5** -1,189** -1,849*** -2,372*** -1,407*** -1,676*** -0.490*** -0.645***[298.0] [390.0] [392.1] [507.3] [347.5] [446.5] [259.8] [308.1] [0.139] [0.162]
Latitude 788.9 1,170 1,447 1,769 775.6 1,597 -1,127 -705.3 -0.276 -0.0332[2,149] [2,436] [2,852] [3,117] [2,144] [3,007] [1,574] [2,018] [0.842] [1.069]
Land Suitability 247.1 225.5 37.39 19.22 398.2** 351.8 291.4** 267.5* 0.184** 0.170**[158.0] [181.1] [205.0] [233.3] [198.6] [216.6] [135.8] [139.3] [0.0761] [0.0800]
Maritime Department 64.63 59.53 129.5 125.2 -121.7 -132.7 -31.38 -37.02 -0.0594 -0.0626[98.54] [115.6] [132.0] [143.2] [100.4] [150.7] [71.84] [99.70] [0.0395] [0.0529]
Border Department -42.35 -129.7 -154.2 -227.9 84.78 -103.4 57.36 -39.31 0.0447 -0.0111[96.32] [122.8] [120.3] [164.6] [110.1] [157.7] [73.50] [104.5] [0.0407] [0.0530]
Distance to Paris 0.566 1.047 0.778 1.185 0.435 1.473* -0.219 0.314 6.51e-05 0.000372[0.588] [0.701] [0.801] [0.984] [0.638] [0.875] [0.481] [0.594] [0.000265] [0.000340]
Paris and Suburbs 378.2*** 392.5*** 1,346 1,358 81.07 111.9 -40.57 -24.75 0.172*** 0.181**[111.7] [117.8] [840.1] [853.1] [244.7] [258.9] [218.1] [225.3] [0.0643] [0.0754]
Observations 85 85 85 85 85 85 85 85 85 85
First stage: the instrumented variable is Horse Power of Steam Engines
Distance to Fresnes -0.0108*** -0.00797*** -0.0108*** -0.00797*** -0.0108*** -0.00797*** -0.0108*** -0.00797*** -0.0108*** -0.00797***[0.00278] [0.00227] [0.00278] [0.00227] [0.00278] [0.00227] [0.00278] [0.00227] [0.00278] [0.00227]
F-stat (1st stage) 15.052 12.307 15.052 12.307 15.052 12.307 15.052 12.307 15.052 12.307
Note: The explanatory variables except the dummies are in logarithm. The aerial distances are measured in kilometers. Robust standard errors are
reported in brackets. *** indicates significance at the 1%-level, ** indicates significance at the 5%-level, * indicates significance at the 10%-level.
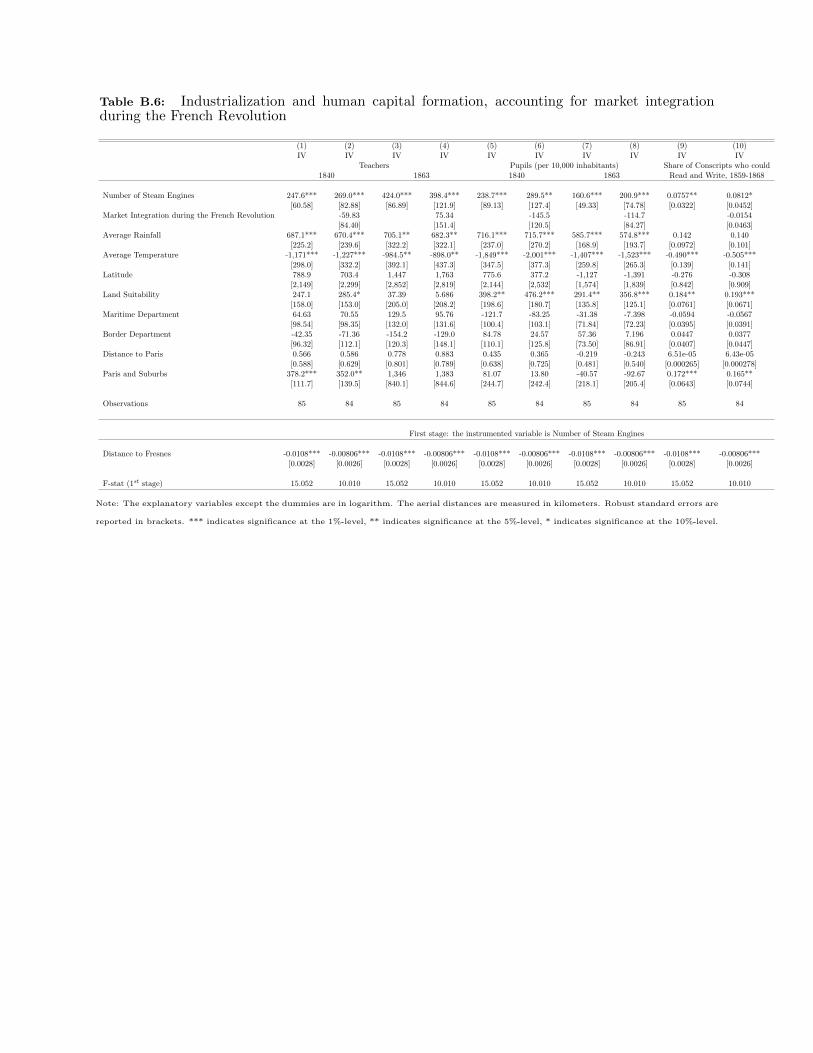
Table B.6: Industrialization and human capital formation, accounting for market integrationduring the French Revolution
(1) (2) (3) (4) (5) (6) (7) (8) (9) (10)IV IV IV IV IV IV IV IV IV IV
Teachers Pupils (per 10,000 inhabitants) Share of Conscripts who could1840 1863 1840 1863 Read and Write, 1859-1868
Number of Steam Engines 247.6*** 269.0*** 424.0*** 398.4*** 238.7*** 289.5** 160.6*** 200.9*** 0.0757** 0.0812*[60.58] [82.88] [86.89] [121.9] [89.13] [127.4] [49.33] [74.78] [0.0322] [0.0452]
Market Integration during the French Revolution -59.83 75.34 -145.5 -114.7 -0.0154[84.40] [151.4] [120.5] [84.27] [0.0463]
Average Rainfall 687.1*** 670.4*** 705.1** 682.3** 716.1*** 715.7*** 585.7*** 574.8*** 0.142 0.140[225.2] [239.6] [322.2] [322.1] [237.0] [270.2] [168.9] [193.7] [0.0972] [0.101]
Average Temperature -1,171*** -1,227*** -984.5** -898.0** -1,849*** -2,001*** -1,407*** -1,523*** -0.490*** -0.505***[298.0] [332.2] [392.1] [437.3] [347.5] [377.3] [259.8] [265.3] [0.139] [0.141]
Latitude 788.9 703.4 1,447 1,763 775.6 377.2 -1,127 -1,391 -0.276 -0.308[2,149] [2,299] [2,852] [2,819] [2,144] [2,532] [1,574] [1,839] [0.842] [0.909]
Land Suitability 247.1 285.4* 37.39 5.686 398.2** 476.2*** 291.4** 356.8*** 0.184** 0.193***[158.0] [153.0] [205.0] [208.2] [198.6] [180.7] [135.8] [125.1] [0.0761] [0.0671]
Maritime Department 64.63 70.55 129.5 95.76 -121.7 -83.25 -31.38 -7.398 -0.0594 -0.0567[98.54] [98.35] [132.0] [131.6] [100.4] [103.1] [71.84] [72.23] [0.0395] [0.0391]
Border Department -42.35 -71.36 -154.2 -129.0 84.78 24.57 57.36 7.196 0.0447 0.0377[96.32] [112.1] [120.3] [148.1] [110.1] [125.8] [73.50] [86.91] [0.0407] [0.0447]
Distance to Paris 0.566 0.586 0.778 0.883 0.435 0.365 -0.219 -0.243 6.51e-05 6.43e-05[0.588] [0.629] [0.801] [0.789] [0.638] [0.725] [0.481] [0.540] [0.000265] [0.000278]
Paris and Suburbs 378.2*** 352.0** 1,346 1,383 81.07 13.80 -40.57 -92.67 0.172*** 0.165**[111.7] [139.5] [840.1] [844.6] [244.7] [242.4] [218.1] [205.4] [0.0643] [0.0744]
Observations 85 84 85 84 85 84 85 84 85 84
First stage: the instrumented variable is Number of Steam Engines
Distance to Fresnes -0.0108*** -0.00806*** -0.0108*** -0.00806*** -0.0108*** -0.00806*** -0.0108*** -0.00806*** -0.0108*** -0.00806***[0.0028] [0.0026] [0.0028] [0.0026] [0.0028] [0.0026] [0.0028] [0.0026] [0.0028] [0.0026]
F-stat (1st stage) 15.052 10.010 15.052 10.010 15.052 10.010 15.052 10.010 15.052 10.010
Note: The explanatory variables except the dummies are in logarithm. The aerial distances are measured in kilometers. Robust standard errors are
reported in brackets. *** indicates significance at the 1%-level, ** indicates significance at the 5%-level, * indicates significance at the 10%-level.
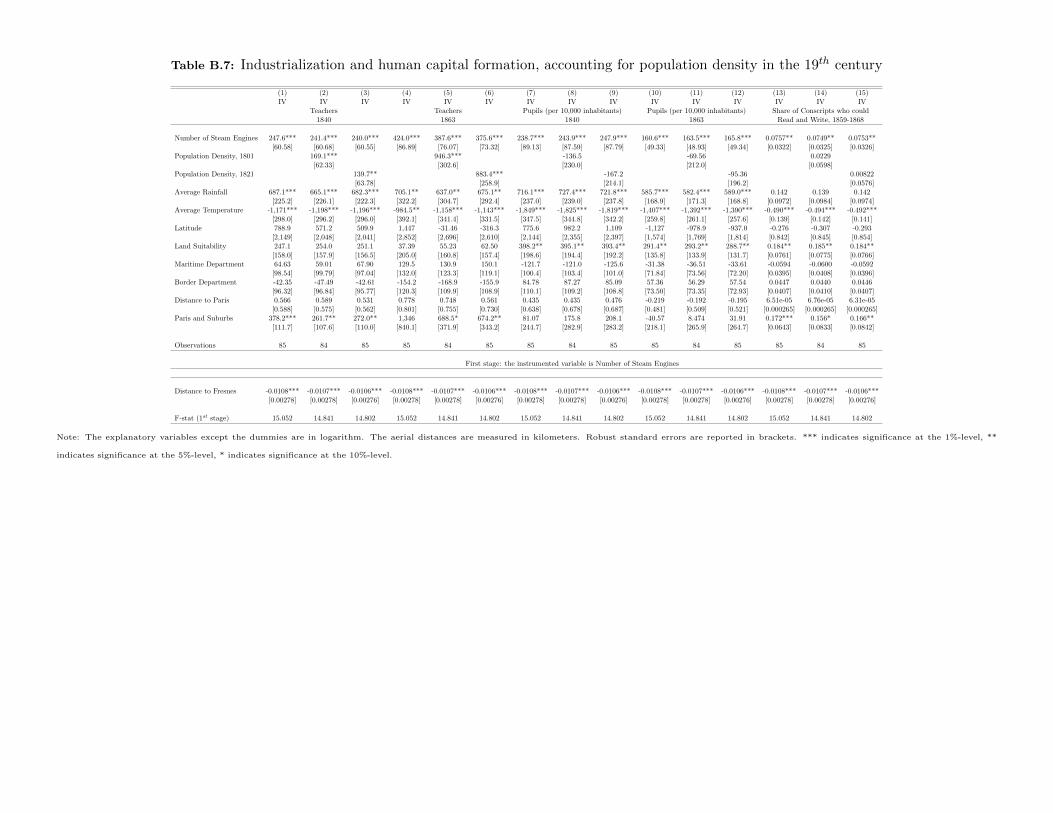
Table B.7: Industrialization and human capital formation, accounting for population density in the 19th century
(1) (2) (3) (4) (5) (6) (7) (8) (9) (10) (11) (12) (13) (14) (15)IV IV IV IV IV IV IV IV IV IV IV IV IV IV IV
Teachers Teachers Pupils (per 10,000 inhabitants) Pupils (per 10,000 inhabitants) Share of Conscripts who could1840 1863 1840 1863 Read and Write, 1859-1868
Number of Steam Engines 247.6*** 241.4*** 240.0*** 424.0*** 387.6*** 375.6*** 238.7*** 243.9*** 247.9*** 160.6*** 163.5*** 165.8*** 0.0757** 0.0749** 0.0753**[60.58] [60.68] [60.55] [86.89] [76.07] [73.32] [89.13] [87.59] [87.79] [49.33] [48.93] [49.34] [0.0322] [0.0325] [0.0326]
Population Density, 1801 169.1*** 946.3*** -136.5 -69.56 0.0229[62.33] [302.6] [230.0] [212.0] [0.0598]
Population Density, 1821 139.7** 883.4*** -167.2 -95.36 0.00822[63.78] [258.9] [214.1] [196.2] [0.0576]
Average Rainfall 687.1*** 665.1*** 682.3*** 705.1** 637.0** 675.1** 716.1*** 727.4*** 721.8*** 585.7*** 582.4*** 589.0*** 0.142 0.139 0.142[225.2] [226.1] [222.3] [322.2] [304.7] [292.4] [237.0] [239.0] [237.8] [168.9] [171.3] [168.8] [0.0972] [0.0984] [0.0974]
Average Temperature -1,171*** -1,198*** -1,196*** -984.5** -1,158*** -1,143*** -1,849*** -1,825*** -1,819*** -1,407*** -1,392*** -1,390*** -0.490*** -0.494*** -0.492***[298.0] [296.2] [296.0] [392.1] [341.4] [331.5] [347.5] [344.8] [342.2] [259.8] [261.1] [257.6] [0.139] [0.142] [0.141]
Latitude 788.9 571.2 509.9 1,447 -31.46 -316.3 775.6 982.2 1,109 -1,127 -978.9 -937.0 -0.276 -0.307 -0.293[2,149] [2,048] [2,041] [2,852] [2,696] [2,610] [2,144] [2,355] [2,397] [1,574] [1,769] [1,814] [0.842] [0.845] [0.854]
Land Suitability 247.1 254.0 251.1 37.39 55.23 62.50 398.2** 395.1** 393.4** 291.4** 293.2** 288.7** 0.184** 0.185** 0.184**[158.0] [157.9] [156.5] [205.0] [160.8] [157.4] [198.6] [194.4] [192.2] [135.8] [133.9] [131.7] [0.0761] [0.0775] [0.0766]
Maritime Department 64.63 59.01 67.90 129.5 130.9 150.1 -121.7 -121.0 -125.6 -31.38 -36.51 -33.61 -0.0594 -0.0600 -0.0592[98.54] [99.79] [97.04] [132.0] [123.3] [119.1] [100.4] [103.4] [101.0] [71.84] [73.56] [72.20] [0.0395] [0.0408] [0.0396]
Border Department -42.35 -47.49 -42.61 -154.2 -168.9 -155.9 84.78 87.27 85.09 57.36 56.29 57.54 0.0447 0.0440 0.0446[96.32] [96.84] [95.77] [120.3] [109.9] [108.9] [110.1] [109.2] [108.8] [73.50] [73.35] [72.93] [0.0407] [0.0410] [0.0407]
Distance to Paris 0.566 0.589 0.531 0.778 0.748 0.561 0.435 0.435 0.476 -0.219 -0.192 -0.195 6.51e-05 6.76e-05 6.31e-05[0.588] [0.575] [0.562] [0.801] [0.755] [0.730] [0.638] [0.678] [0.687] [0.481] [0.509] [0.521] [0.000265] [0.000265] [0.000265]
Paris and Suburbs 378.2*** 261.7** 272.0** 1,346 688.5* 674.2** 81.07 175.8 208.1 -40.57 8.474 31.91 0.172*** 0.156* 0.166**[111.7] [107.6] [110.0] [840.1] [371.9] [343.2] [244.7] [282.9] [283.2] [218.1] [265.9] [264.7] [0.0643] [0.0833] [0.0842]
Observations 85 84 85 85 84 85 85 84 85 85 84 85 85 84 85
First stage: the instrumented variable is Number of Steam Engines
Distance to Fresnes -0.0108*** -0.0107*** -0.0106*** -0.0108*** -0.0107*** -0.0106*** -0.0108*** -0.0107*** -0.0106*** -0.0108*** -0.0107*** -0.0106*** -0.0108*** -0.0107*** -0.0106***[0.00278] [0.00278] [0.00276] [0.00278] [0.00278] [0.00276] [0.00278] [0.00278] [0.00276] [0.00278] [0.00278] [0.00276] [0.00278] [0.00278] [0.00276]
F-stat (1st stage) 15.052 14.841 14.802 15.052 14.841 14.802 15.052 14.841 14.802 15.052 14.841 14.802 15.052 14.841 14.802
Note: The explanatory variables except the dummies are in logarithm. The aerial distances are measured in kilometers. Robust standard errors are reported in brackets. *** indicates significance at the 1%-level, **
indicates significance at the 5%-level, * indicates significance at the 10%-level.
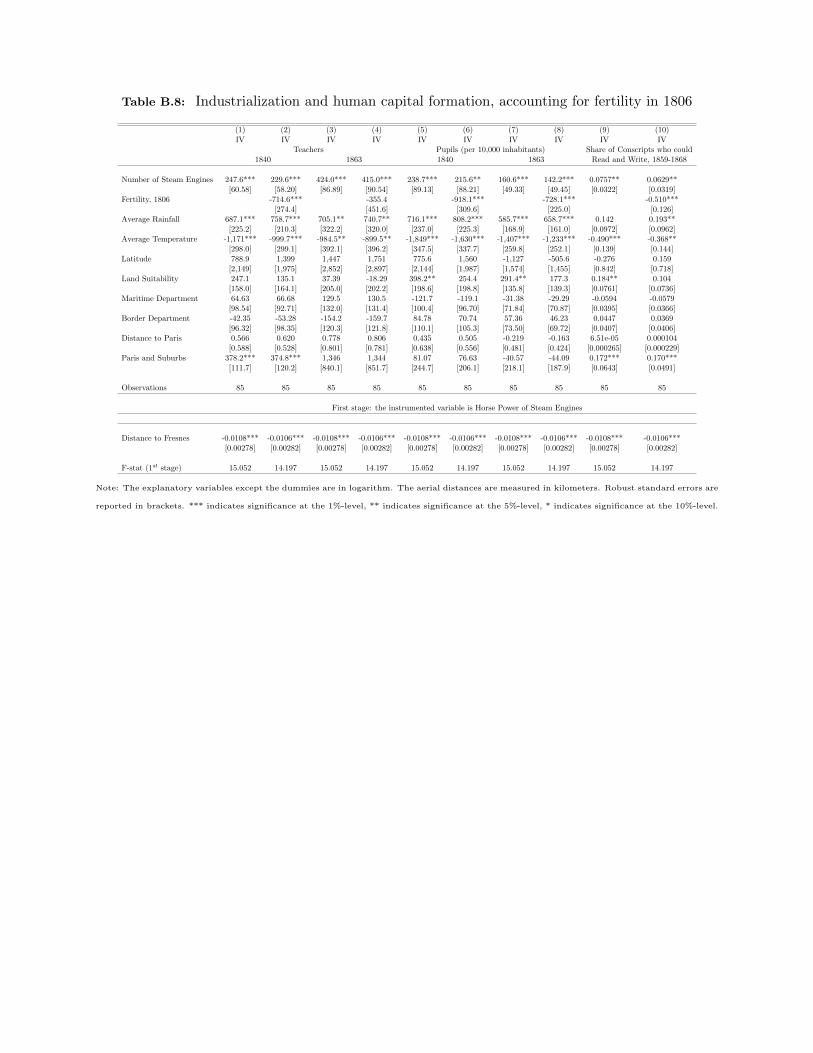
Table B.8: Industrialization and human capital formation, accounting for fertility in 1806
(1) (2) (3) (4) (5) (6) (7) (8) (9) (10)IV IV IV IV IV IV IV IV IV IV
Teachers Pupils (per 10,000 inhabitants) Share of Conscripts who could1840 1863 1840 1863 Read and Write, 1859-1868
Number of Steam Engines 247.6*** 229.6*** 424.0*** 415.0*** 238.7*** 215.6** 160.6*** 142.2*** 0.0757** 0.0629**[60.58] [58.20] [86.89] [90.54] [89.13] [88.21] [49.33] [49.45] [0.0322] [0.0319]
Fertility, 1806 -714.6*** -355.4 -918.1*** -728.1*** -0.510***[274.4] [451.6] [309.6] [225.0] [0.126]
Average Rainfall 687.1*** 758.7*** 705.1** 740.7** 716.1*** 808.2*** 585.7*** 658.7*** 0.142 0.193**[225.2] [210.3] [322.2] [320.0] [237.0] [225.3] [168.9] [161.0] [0.0972] [0.0962]
Average Temperature -1,171*** -999.7*** -984.5** -899.5** -1,849*** -1,630*** -1,407*** -1,233*** -0.490*** -0.368**[298.0] [299.1] [392.1] [396.2] [347.5] [337.7] [259.8] [252.1] [0.139] [0.144]
Latitude 788.9 1,399 1,447 1,751 775.6 1,560 -1,127 -505.6 -0.276 0.159[2,149] [1,975] [2,852] [2,897] [2,144] [1,987] [1,574] [1,455] [0.842] [0.718]
Land Suitability 247.1 135.1 37.39 -18.29 398.2** 254.4 291.4** 177.3 0.184** 0.104[158.0] [164.1] [205.0] [202.2] [198.6] [198.8] [135.8] [139.3] [0.0761] [0.0736]
Maritime Department 64.63 66.68 129.5 130.5 -121.7 -119.1 -31.38 -29.29 -0.0594 -0.0579[98.54] [92.71] [132.0] [131.4] [100.4] [96.70] [71.84] [70.87] [0.0395] [0.0366]
Border Department -42.35 -53.28 -154.2 -159.7 84.78 70.74 57.36 46.23 0.0447 0.0369[96.32] [98.35] [120.3] [121.8] [110.1] [105.3] [73.50] [69.72] [0.0407] [0.0406]
Distance to Paris 0.566 0.620 0.778 0.806 0.435 0.505 -0.219 -0.163 6.51e-05 0.000104[0.588] [0.528] [0.801] [0.781] [0.638] [0.556] [0.481] [0.424] [0.000265] [0.000229]
Paris and Suburbs 378.2*** 374.8*** 1,346 1,344 81.07 76.63 -40.57 -44.09 0.172*** 0.170***[111.7] [120.2] [840.1] [851.7] [244.7] [206.1] [218.1] [187.9] [0.0643] [0.0491]
Observations 85 85 85 85 85 85 85 85 85 85
First stage: the instrumented variable is Horse Power of Steam Engines
Distance to Fresnes -0.0108*** -0.0106*** -0.0108*** -0.0106*** -0.0108*** -0.0106*** -0.0108*** -0.0106*** -0.0108*** -0.0106***[0.00278] [0.00282] [0.00278] [0.00282] [0.00278] [0.00282] [0.00278] [0.00282] [0.00278] [0.00282]
F-stat (1st stage) 15.052 14.197 15.052 14.197 15.052 14.197 15.052 14.197 15.052 14.197
Note: The explanatory variables except the dummies are in logarithm. The aerial distances are measured in kilometers. Robust standard errors are
reported in brackets. *** indicates significance at the 1%-level, ** indicates significance at the 5%-level, * indicates significance at the 10%-level.
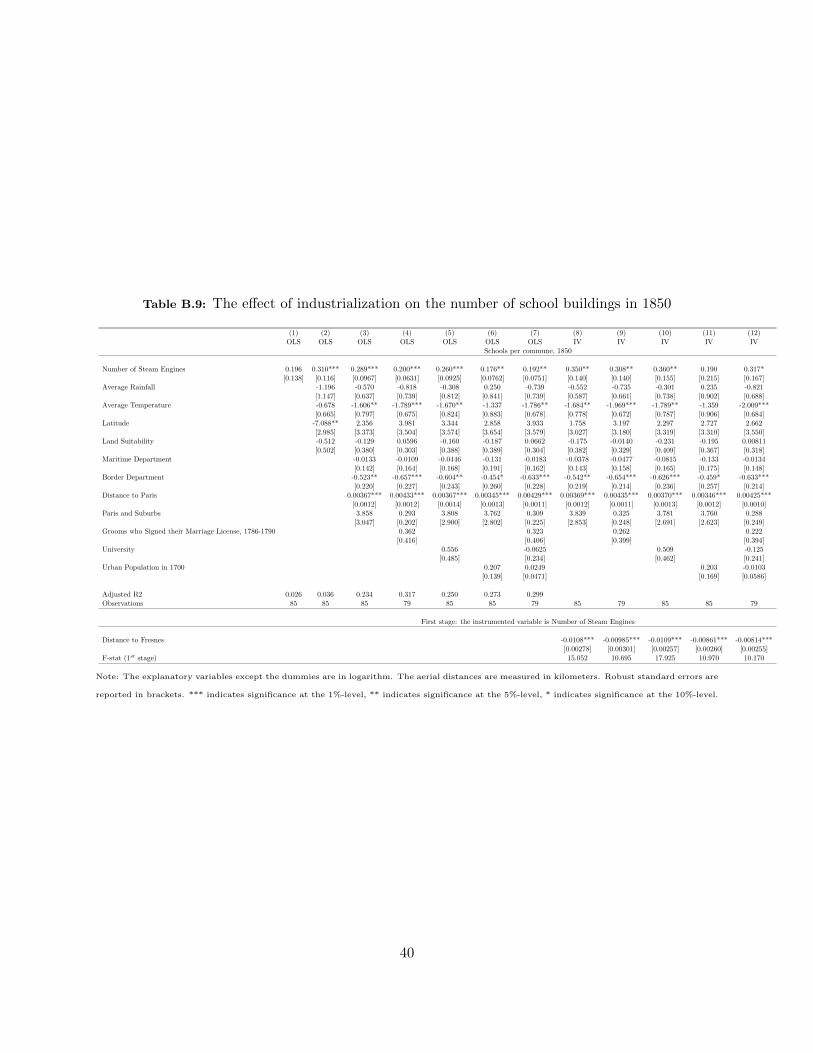
Table B.9: The effect of industrialization on the number of school buildings in 1850
(1) (2) (3) (4) (5) (6) (7) (8) (9) (10) (11) (12)OLS OLS OLS OLS OLS OLS OLS IV IV IV IV IV
Schools per commune, 1850
Number of Steam Engines 0.196 0.310*** 0.289*** 0.200*** 0.260*** 0.176** 0.192** 0.350** 0.308** 0.360** 0.190 0.317*[0.138] [0.116] [0.0967] [0.0631] [0.0925] [0.0762] [0.0751] [0.140] [0.140] [0.155] [0.215] [0.167]
Average Rainfall -1.196 -0.570 -0.818 -0.308 0.250 -0.739 -0.552 -0.735 -0.301 0.235 -0.821[1.147] [0.637] [0.739] [0.812] [0.841] [0.739] [0.587] [0.661] [0.738] [0.902] [0.688]
Average Temperature -0.678 -1.606** -1.789*** -1.670** -1.337 -1.786** -1.684** -1.969*** -1.789** -1.359 -2.009***[0.665] [0.797] [0.675] [0.824] [0.883] [0.678] [0.778] [0.672] [0.787] [0.906] [0.684]
Latitude -7.088** 2.356 3.981 3.344 2.858 3.933 1.758 3.197 2.297 2.727 2.662[2.985] [3.373] [3.504] [3.574] [3.654] [3.579] [3.027] [3.180] [3.319] [3.310] [3.550]
Land Suitability -0.512 -0.129 0.0596 -0.160 -0.187 0.0662 -0.175 -0.0140 -0.231 -0.195 0.00811[0.502] [0.380] [0.303] [0.388] [0.389] [0.304] [0.382] [0.329] [0.409] [0.367] [0.318]
Maritime Department -0.0133 -0.0109 -0.0446 -0.131 -0.0183 -0.0378 -0.0477 -0.0815 -0.133 -0.0134[0.142] [0.164] [0.168] [0.191] [0.162] [0.143] [0.158] [0.165] [0.175] [0.148]
Border Department -0.523** -0.657*** -0.604** -0.454* -0.633*** -0.542** -0.654*** -0.626*** -0.459* -0.633***[0.220] [0.227] [0.243] [0.260] [0.228] [0.219] [0.214] [0.236] [0.257] [0.214]
Distance to Paris 0.00367*** 0.00433*** 0.00367*** 0.00345*** 0.00429*** 0.00369*** 0.00435*** 0.00370*** 0.00346*** 0.00425***[0.0012] [0.0012] [0.0014] [0.0013] [0.0011] [0.0012] [0.0011] [0.0013] [0.0012] [0.0010]
Paris and Suburbs 3.858 0.293 3.808 3.762 0.309 3.839 0.325 3.781 3.760 0.288[3.047] [0.202] [2.900] [2.802] [0.225] [2.853] [0.248] [2.691] [2.623] [0.249]
Grooms who Signed their Marriage License, 1786-1790 0.362 0.323 0.262 0.222[0.416] [0.406] [0.399] [0.394]
University 0.556 -0.0625 0.509 -0.125[0.485] [0.234] [0.462] [0.241]
Urban Population in 1700 0.207 0.0249 0.203 -0.0103[0.139] [0.0471] [0.169] [0.0586]
Adjusted R2 0.026 0.036 0.234 0.317 0.250 0.273 0.299Observations 85 85 85 79 85 85 79 85 79 85 85 79
First stage: the instrumented variable is Number of Steam Engines
Distance to Fresnes -0.0108*** -0.00985*** -0.0109*** -0.00861*** -0.00814***[0.00278] [0.00301] [0.00257] [0.00260] [0.00255]
F-stat (1st stage) 15.052 10.695 17.925 10.970 10.170
Note: The explanatory variables except the dummies are in logarithm. The aerial distances are measured in kilometers. Robust standard errors are
reported in brackets. *** indicates significance at the 1%-level, ** indicates significance at the 5%-level, * indicates significance at the 10%-level.
40
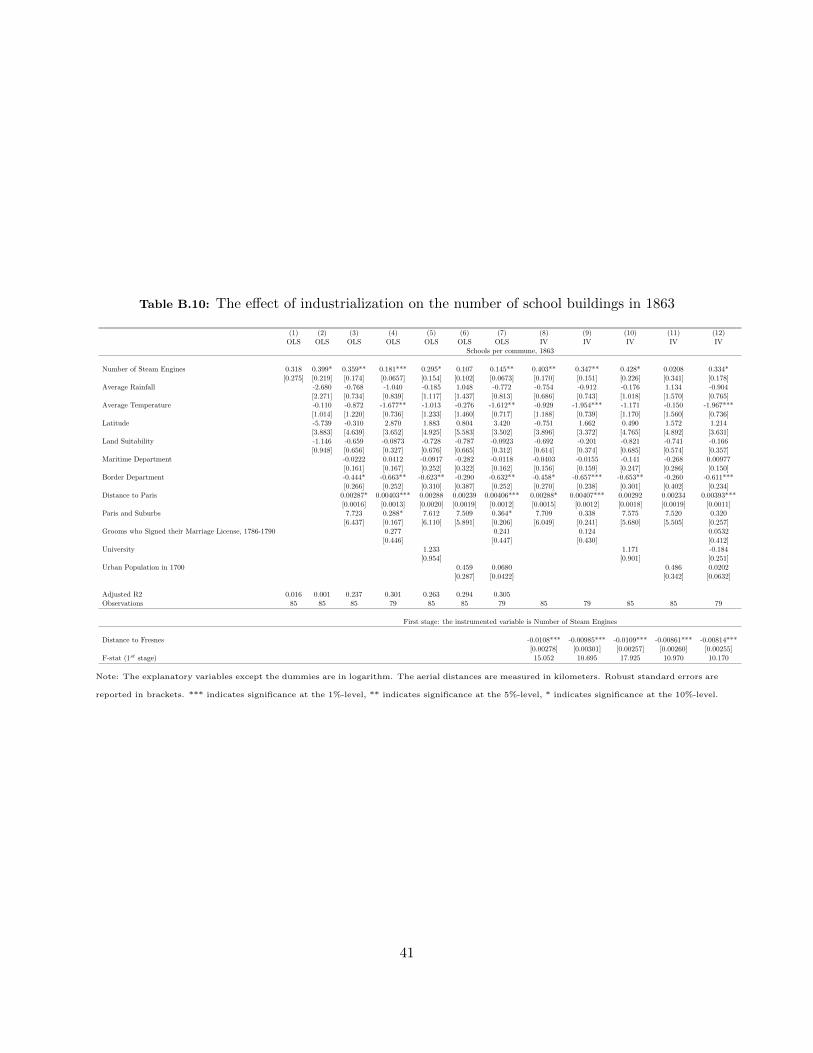
Table B.10: The effect of industrialization on the number of school buildings in 1863
(1) (2) (3) (4) (5) (6) (7) (8) (9) (10) (11) (12)OLS OLS OLS OLS OLS OLS OLS IV IV IV IV IV
Schools per commune, 1863
Number of Steam Engines 0.318 0.399* 0.359** 0.181*** 0.295* 0.107 0.145** 0.403** 0.347** 0.428* 0.0208 0.334*[0.275] [0.219] [0.174] [0.0657] [0.154] [0.102] [0.0673] [0.170] [0.151] [0.226] [0.341] [0.178]
Average Rainfall -2.680 -0.768 -1.040 -0.185 1.048 -0.772 -0.754 -0.912 -0.176 1.134 -0.904[2.271] [0.734] [0.839] [1.117] [1.437] [0.813] [0.686] [0.743] [1.018] [1.570] [0.765]
Average Temperature -0.110 -0.872 -1.677** -1.013 -0.276 -1.612** -0.929 -1.954*** -1.171 -0.150 -1.967***[1.014] [1.220] [0.736] [1.233] [1.460] [0.717] [1.188] [0.739] [1.170] [1.560] [0.736]
Latitude -5.739 -0.310 2.870 1.883 0.804 3.420 -0.751 1.662 0.490 1.572 1.214[3.883] [4.639] [3.652] [4.925] [5.583] [3.502] [3.896] [3.372] [4.765] [4.892] [3.631]
Land Suitability -1.146 -0.659 -0.0873 -0.728 -0.787 -0.0923 -0.692 -0.201 -0.821 -0.741 -0.166[0.948] [0.656] [0.327] [0.676] [0.665] [0.312] [0.614] [0.374] [0.685] [0.574] [0.357]
Maritime Department -0.0222 0.0412 -0.0917 -0.282 -0.0118 -0.0403 -0.0155 -0.141 -0.268 0.00977[0.161] [0.167] [0.252] [0.322] [0.162] [0.156] [0.159] [0.247] [0.286] [0.150]
Border Department -0.444* -0.663** -0.623** -0.290 -0.632** -0.458* -0.657*** -0.653** -0.260 -0.611***[0.266] [0.252] [0.310] [0.387] [0.252] [0.270] [0.238] [0.301] [0.402] [0.234]
Distance to Paris 0.00287* 0.00403*** 0.00288 0.00239 0.00406*** 0.00288* 0.00407*** 0.00292 0.00234 0.00393***[0.0016] [0.0013] [0.0020] [0.0019] [0.0012] [0.0015] [0.0012] [0.0018] [0.0019] [0.0011]
Paris and Suburbs 7.723 0.288* 7.612 7.509 0.364* 7.709 0.338 7.575 7.520 0.320[6.437] [0.167] [6.110] [5.891] [0.206] [6.049] [0.241] [5.680] [5.505] [0.257]
Grooms who Signed their Marriage License, 1786-1790 0.277 0.241 0.124 0.0532[0.446] [0.447] [0.430] [0.412]
University 1.233 1.171 -0.184[0.954] [0.901] [0.251]
Urban Population in 1700 0.459 0.0680 0.486 0.0202[0.287] [0.0422] [0.342] [0.0632]
Adjusted R2 0.016 0.001 0.237 0.301 0.263 0.294 0.305Observations 85 85 85 79 85 85 79 85 79 85 85 79
First stage: the instrumented variable is Number of Steam Engines
Distance to Fresnes -0.0108*** -0.00985*** -0.0109*** -0.00861*** -0.00814***[0.00278] [0.00301] [0.00257] [0.00260] [0.00255]
F-stat (1st stage) 15.052 10.695 17.925 10.970 10.170
Note: The explanatory variables except the dummies are in logarithm. The aerial distances are measured in kilometers. Robust standard errors are
reported in brackets. *** indicates significance at the 1%-level, ** indicates significance at the 5%-level, * indicates significance at the 10%-level.
41

Appendix C. Literacy of Conscripts, 1847-1856
Table C.1: The effect of industrialization on the share of literate conscripts, 1847-1856
(1) (2) (3) (4) (5) (6) (7) (8) (9) (10) (11) (12)OLS OLS OLS OLS OLS OLS OLS IV IV IV IV IV
Share of Conscripts who could Read and Write, 1847-1856
Number of Steam Engines 0.0375*** 0.0280** 0.0242* 0.00926 0.0255** 0.0201 0.00873 0.0909** 0.0546* 0.0897** 0.106** 0.0666*[0.0126] [0.0135] [0.0128] [0.00866] [0.0124] [0.0141] [0.0104] [0.0401] [0.0294] [0.0374] [0.0516] [0.0350]
Average Rainfall 0.178* 0.197* -0.00664 0.186* 0.227* -0.00386 0.217* 0.0282 0.190* 0.142 -0.0415[0.101] [0.108] [0.110] [0.110] [0.118] [0.112] [0.111] [0.113] [0.111] [0.132] [0.114]
Average Temperature -0.633*** -0.495*** -0.131 -0.493*** -0.486*** -0.129 -0.580*** -0.207 -0.569*** -0.612*** -0.233[0.158] [0.170] [0.169] [0.170] [0.175] [0.176] [0.162] [0.156] [0.157] [0.161] [0.159]
Latitude 0.410 0.757 -0.195 0.713 0.775 -0.175 0.0983 -0.526 0.0407 0.00546 -0.766[0.402] [1.030] [0.876] [1.060] [1.005] [0.863] [0.986] [0.831] [1.044] [1.096] [0.899]
Land Suitability 0.284*** 0.262*** 0.114 0.263*** 0.260*** 0.113 0.212** 0.0830 0.218*** 0.214*** 0.0865[0.0756] [0.0754] [0.0800] [0.0753] [0.0774] [0.0828] [0.0841] [0.0781] [0.0811] [0.0826] [0.0738]
Maritime Department -0.0182 -0.0458 -0.0168 -0.0224 -0.0469 -0.0452 -0.0614 -0.0405 -0.0361 -0.0447[0.0389] [0.0372] [0.0393] [0.0385] [0.0414] [0.0460] [0.0418] [0.0466] [0.0468] [0.0418]
Border Department 0.0903** -0.00414 0.0938** 0.0928** -0.00483 0.0702 -0.00252 0.0792* 0.0623 -0.00485[0.0379] [0.0326] [0.0375] [0.0373] [0.0349] [0.0449] [0.0353] [0.0436] [0.0485] [0.0398]
Distance to Paris 9.00e-05 5.04e-05 8.98e-05 8.22e-05 5.37e-05 0.000114 5.91e-05 0.0001 0.000135 3.53e-05[0.0003] [0.0002] [0.0003] [0.0003] [0.0002] [0.0003] [0.0002] [0.0003] [0.0003] [0.0002]
Paris and Suburbs 0.241*** 0.0868** 0.243*** 0.237*** 0.0881** 0.219*** 0.100* 0.225*** 0.226*** 0.0783[0.0588] [0.0421] [0.0623] [0.0571] [0.0404] [0.0732] [0.0598] [0.0737] [0.0734] [0.0543]
Grooms who Signed their Marriage License, 1786-1790 0.520*** 0.522*** 0.478*** 0.475***[0.106] [0.112] [0.111] [0.110]
University -0.0242 0.00424 -0.0542 -0.0248[0.0367] [0.0328] [0.0411] [0.0344]
Urban Population in 1700 0.00746 0.000364 -0.0194 -0.0160[0.00993] [0.00952] [0.0183] [0.0127]
Adjusted R2 0.068 0.384 0.451 0.653 0.446 0.447 0.643Observations 85 85 85 79 85 85 79 85 79 85 85 79
First stage: the instrumented variable is Number of Steam Engines
Distance to Fresnes -0.0108*** -0.00985*** -0.0109*** -0.00861*** -0.00814***[0.00278] [0.00301] [0.00257] [0.00260] [0.00255]
F-stat (1st stage) 15.052 10.695 17.925 10.970 10.170
Note: The explanatory variables except the dummies are in logarithm. The aerial distances are measured in kilometers. Robust standard errors are reported in brackets. *** indicates significance
at the 1%-level, ** indicates significance at the 5%-level, * indicates significance at the 10%-level.

Appendix D. Spatial Correlation
Table D.1: The effect of industrialization on the number of teachers in 1840, accounting for spatial autocorre-lation
(1) (2) (3)
OLS OLS IV
Teachers, 1840
Number of Steam Engines 255.23 119.05 274.98
[3.65]*** [2.95]*** [11.75]***
Average Rainfall 621.81 683.93
[57.00]*** [60.84]***
Average Temperature -1126.26 -1255.02
[70.39]*** [59.88]***
Latitude -273.07 -442.96
[127.54]** [121.65]***
Land Suitability 362.55 234.61
[21.31]*** [22.79]***
Maritime Department 177.30 78.54
[11.20]*** [17.63]***
Border Department 27.91 -37.59
[24.85] [19.33]*
Distance to Paris -0.05 0.34
[0.07] [0.11]***
Paris and Suburbs 354.27 341.96
[20.21]*** [14.62]***
Observations 85 85 85
Note: The table reports spatial Conley (1999) standard errors with a radius of 100km. The explanatory variables except the dummies
are in logarithm. The aerial distances are measured in kilometers. *** indicates significance at the 1%-level, ** indicates significance at the
5%-level, * indicates significance at the 10%-level.
Table D.2: The effect of industrialization on the number of teachers in 1863, accounting for spatial autocorre-lation
(1) (2) (3)OLS OLS IV
Teachers, 1863
Number of Steam Engines 443.63843 255.41 469.00[4.78]*** [9.97]*** [25.62]***
Average Rainfall 614.78 699.88[71.11]*** [86.51]***
Average Temperature -947.11 -1123.50[78.48]*** [100.58]***
Latitude -348.78 -581.49[148.22]** [175.58]***
Land Suitability 192.10 16.83[32.81]*** [40.08]
Maritime Department 287.66 152.38[126.88]*** [26.89]***
Border Department -56.67 -146.39[24.29]** [24.57]***
Distance to Paris -0.12 0.41[0.11] [0.20]**
Paris and Suburbs 1302.87 1286.02[60.43]*** [53.66]***
Observations 85 85 85
Note: The table reports spatial Conley (1999) standard errors with a radius of 100km. The explanatory variables except the dummies are in
logarithm. The aerial distances are measured in kilometers. *** indicates significance at the 1%-level, ** indicates significance at the 5%-level,
* indicates significance at the 10%-level.

Table D.3: The effect of industrialization on the share of pupils in the population in 1840, accounting forspatial autocorrelation
(1) (2) (3)OLS OLS IV
Pupils (per 10,000 inhabitants), 1840
Number of Steam Engines 282.26 52.72 256.51[8.79]*** [7.50]*** [18.90]***
Average Rainfall 632.90 714.09[47.87]*** [44.83]***
Average Temperature -1735.81 -1904.11[109.20]*** [81.49]***
Latitude 196.09 -25.95[125.79] [97.52]
Land Suitability 557.30 390.08[69.04]*** [69.45]***
Maritime Department 16.44 -112.65[28.31] [35.73]***
Border Department 173.48 87.88[22.26]*** [23.97]***
Distance to Paris -0.22 0.29[0.06]*** [0.09]***
Paris and Suburbs 73.57 57.49[20.75]*** [28.48]**
Observations 85 85 85
Note: The table reports spatial Conley (1999) standard errors with a radius of 100km. The explanatory variables except the dummies are in
logarithm. The aerial distances are measured in kilometers. *** indicates significance at the 1%-level, ** indicates significance at the 5%-level,
* indicates significance at the 10%-level.
Table D.4: The effect of industrialization on the share of pupils in the population in 1863, accounting forspatial autocorrelation
(1) (2) (3)OLS OLS IV
Pupils (per 10,000 inhabitants), 1863
Number of Steam Engines 373.50 38.54 135.08[5.40]*** [4.60]*** [11.55]***
Average Rainfall 550.20 588.66[33.56]*** [32.31]***
Average Temperature -1249.10 -1328.82[65.03]*** [49.61]***
Latitude 126.00 20.83[75.24]* [61.42]
Land Suitability 382.23 303.02[40.00]*** [40.80]***
Maritime Department 16.80 -44.34[20.64] [24.71]*
Border Department 93.48 52.93[12.09]*** [13.54]***
Distance to Paris -0.25 -0.01[0.03]*** [0.06]
Paris and Suburbs 0.83 -6.79[15.02] [19.77]
Observations 85 85 85
Note: The table reports spatial Conley (1999) standard errors with a radius of 100km. The explanatory variables except the dummies are in
logarithm. The aerial distances are measured in kilometers. *** indicates significance at the 1%-level, ** indicates significance at the 5%-level,
* indicates significance at the 10%-level.
44

Table D.5: The effect of industrialization on the share of literate conscripts in 1859-1868, accounting for spatialautocorrelation
(1) (2) (3)OLS OLS IVShare of Conscripts who could
Read and Write, 1859-1868
Number of Steam Engines 0.23 0.02 0.07[0.03]*** [0.004]*** [0.01]***
Average Rainfall 0.12 0.14[0.02]*** [0.02]***
Average Temperature -0.42 -0.46[0.04]*** [0.03]***
Latitude 0.23 0.18[0.05]*** [0.04]***
Land Suitability 0.23 0.19[0.02]*** [0.02]***
Maritime Department -0.03 -0.06[0.01]** [0.01]***
Border Department 0.06 0.04[0.01]*** [0.01]***
Distance to Paris 0.00003 0.0001[0.00002] [0.00002]***
Paris and Suburbs 0.19 0.19[0.01]*** [0.01]***
Observations 85 85 85
Note: The table reports spatial Conley (1999) standard errors with a radius of 100km. The explanatory variables except the dummies are in
logarithm. The aerial distances are measured in kilometers. *** indicates significance at the 1%-level, ** indicates significance at the 5%-level,
* indicates significance at the 10%-level.
45

Appendix E. Variable Definitions and Sources
Dependent variables
Teachers.
Teachers, 1840 and 1863. Number of teachers in primary schools. Source: Beaur, Gerard, andBeatrice Marin. 2011. La Statistique Generale de la France Presentation. L’Atelier du Centre derecherches historiques. http:acrh.revues.org/index2891.html.
Pupils.
Pupils, 1840 and 1863. Number of pupils enrolled in primary schools, per 10,000 inhabitants inthe department. Source: Beaur, Gerard, and Beatrice Marin. 2011. La Statistique Generalede la France Presentation. L’Atelier du Centre de recherches historiques. http:acrh.revues.org/index2891.html.
Literate conscripts
Share of literate individuals among conscripts, 1847-1856 and 1859-1868. The average share ofFrench army conscripts, i.e., 20-year-old men who reported for military service in the departmentwhere their father lived, who could read and write, computed over the 1847-1856 and 1859-1868periods. Source: France. Ministere de la guerre (1791-1936) - Compte rendu sur le recrutement del’armee.
School buildings.
Buildings, 1850 and 1863. Number of buildings per commune in each department. Source: Beaur,Gerard, and Beatrice Marin. 2011. La Statistique Generale de la France Presentation. L’Atelierdu Centre de recherches historiques. http:acrh.revues.org/index2891.html.
Explanatory variables
Horse power of steam engines. This variable reports the number of steam Engines in the firms ofeach department, which is computed from the industrial survey carried out by the French govern-ment between 1839 and 1847. See Chanut et al. (2000) for details on the implementation of thissurvey.
Maritime department. This dummy variable takes the value one if a French department bordersthe coastline and zero otherwise.
Border department. This dummy variable takes the value one if a French department borders oneof the foreign countries around France (Belgium, Luxembourg, Germany, Switzerland, Italy andSpain) and zero otherwise.
Distance to Paris. The great circle distance as “the crow flies”from Paris, the capital of France, tothe administrative center of each department. This aerial distance is computed in kilometers.
46

Paris and suburbs. This dummy variable takes the value one for the three departments, i.e., Seine,Seine-et-Marne and Seine-et-Oise, which encompass Paris and its suburbs and zero otherwise.
Alsace-Lorraine. This dummy variable takes the value one for the Bas-Rhin, Haut-Rhin and Moselledepartments and zero otherwise in all the regressions on post-WWI outcomes since these threedepartments were under German rule between 1871 and 1918.
Average rainfall. The average rainfall in cm3, reported at a half-degree resolution by Ramankuttyet al. (2002), across the French departments.
Average temperature. The average temperature (in celsius), reported at a half-degree resolution byRamankutty et al. (2002), across the French departments.
Latitude. The latitude of the centroid of each French department.
Land Suitability The land suitability index, reported at a half-degree resolution by Ramankuttyet al. (2002), across the French departments.
Share of Grooms who Signed their Wedding Licenses, 1786-1790. The share of grooms who signedtheir wedding licenses with their names over the 1786-1790 period (as opposed to those who markedit with a cross). Source: Beaur, Gerard, and Beatrice Marin. 2011. La Statistique Generale dela France Presentation. L’Atelier du Centre de recherches historiques. http:acrh.revues.org/index2891.html.
University. Number of universities in 1700 in each department. Source: Bosker et al. (2013).
Urban population in 1700 (thousand of inhabitants). This variable reports the total population ofthe major urban centers, i.e., with more than 10,000 inhabitants, in each French department in1700 using the data in Lepetit (1994, Appendix B).
Instrumental variable
Distance to Fresnes sur Escaut. The great circle distance as “the crow flies”from Fresnes-sur-Escaut, where the first steam engine was operated in France in 1732, to the administrative centerof each department. This aerial distance is computed in kilometers.
Variables for robustness analysis
Access to Waterways
Rivers and Tributaries. The dummy variable takes the value 1 if at least one of the main Frenchrivers or tributaries (whose total length is above 300 km) crosses a given department. These arethe Rhin, Loire, Meuse, Rhone, Seine, Garonne, Dordogne, Charente and Escaut.
Economic development before 1815
Market integration during the French Revolution. The number of external suppliers for each de-partment in the 1790s for the following categories of products: cotton, hosiery, hardware, misc.production goods, misc. consumption goods, linen and hemp, wool and wool cloth, leather prod-ucts hides and hats, iron, Food items, drinks, paper, wood for industry, fuel (wood and coal).Source: Daudin (2010).
47

Iron forges, 1789 and 1811. The number of iron forges in each department in 1789 and 1811.Source: Woronoff (1997).
Presence of iron forges, 1789 and 1811. The dummy variable takes the value 1 if there was at leastone iron forge in a department in 1789. Source: Woronoff (1997).
Human capital before 1820
Share of Grooms who Signed their Wedding Licenses, 1686-1690 and 1816-1820. The share ofgrooms who signed their wedding licenses with their names over the 1686-1690 and 1816-1820periods (as opposed to those who marked it with a cross). Source: Beaur, Gerard, and BeatriceMarin. 2011. La Statistique Generale de la France Presentation. L’Atelier du Centre de rechercheshistoriques. http:acrh.revues.org/ index2891.html.
Population density
Population density, 1801, 1831 and 1861. Source: Beaur, Gerard, and Beatrice Marin. 2011.La Statistique Generale de la France Presentation. L’Atelier du Centre de recherches historiques.http:acrh.revues.org/index2891.html.
Past level of fertility
Fertility, 1806. Fertility in each department, computed following the methodology of the Coalefertility index. 1806 is the earliest year available. Source: Bonneuil (1997)
Distance to French cities
Distance to Marseille. The great circle distance as “the crow flies”from Marseille to the adminis-trative center of each department. This aerial distance is computed in kilometers.
Distance to Lyon. The great circle distance as “the crow flies”from Lyon to the administrativecenter of each department. This aerial distance is computed in kilometers.
Distance to Rouen.The great circle distance as “the crow flies”from Rouen to the administrativecenter of each department. This aerial distance is computed in kilometers.
Distance to Mulhouse. The great circle distance as “the crow flies”from Mulhouse to the adminis-trative center of each department. This aerial distance is computed in kilometers.
Distance to Bordeaux. The great circle distance as “the crow flies”from Bordeaux to the adminis-trative center of each department. This aerial distance is computed in kilometers.
Distance from Paris (weeks of travel). The time needed for a surface travel from Paris to theadministrative center of each department measured in weeks of travel. Source: Ozak (2013)
Distance from Marseille (weeks of travel). The time needed for a surface travel from Marseille tothe administrative center of each department measured in weeks of travel. Source: Ozak (2013)
Distance from Lyon (weeks of travel). The time needed for a surface travel from Lyon from Lyonto the administrative center of each department measured in weeks of travel. Source: Ozak (2013)
48

Distance from Rouen (weeks of travel). The time needed for a surface travel from Rouen to theadministrative center of each department measured in weeks of travel. Source: Ozak (2013)
Distance from Mulhouse (weeks of travel).The time needed for a surface travel from Mulhouse tothe administrative center of each department measured in weeks of travel. Source: Ozak (2013)
Distance from Bordeaux (weeks of travel). The time needed for a surface travel from Bordeaux tothe administrative center of each department measured in weeks of travel. Source: Ozak (2013)
49