the competitiveness and efficiency of potato...
TRANSCRIPT

THE COMPETITIVENESS AND EFFICIENCY OF POTATO FARMING IN PANGALENGAN
Elly Rasmikayati
Iis Nurasiyah
Research Institute of Padjadjaran University
March 2004

Table of Contents
Table of Contents ................................................................................................ 2
Summary .............................................................................................................. 3
1. Policy Issues................................................................................................... 4 1.1. Background.............................................................................................. 4 1.2. Objectives ................................................................................................ 5
2. Research Methods ......................................................................................... 6 2.1. Method of Data Collection ...................................................................... 6 2.2 Types and Sources of Data ....................................................................... 6 2.3. Data Analysis........................................................................................... 6 2.4. Assumptions.............................................................................................. 7
Exchange Rate............................................................................................. 7 Social Prices of Tradable Inputs ................................................................. 7 Social Prices of Nontradable Inputs............................................................ 7 Social Output Prices.................................................................................... 8
3. Potato Farming Systems in Pangalengan.................................................... 8 3.1 Physical Condition of Pangalengan ........................................................... 8 3.2 Profile of Potato Farming Systems in Pangalengan................................... 9
4. The Competitiveness and Efficiency of Potato Farming Systems ........... 11 4.1. Revenues and Profits of Potato Farming Systems ................................. 12 4.2 Competitiveness and Efficiency of Potato Farming Systems.................. 13 4.3 Transfers and the Impact of Government Policies................................... 14
5. Conclusions and Recommendations .......................................................... 18 5. 1 Conclusion .............................................................................................. 18 5.2 Recommendation ..................................................................................... 19
References ......................................................................................................... 19
2

Summary According to a World Bank analysis in 1991, the demand for vegetables in
Indonesia was projected to increase by 5 percent per year between 1998 and 2010. Potatoes play a very important role in menu diversification, because they can be fried, boiled, or baked. The trend of serving more potato-based foods can be observed from five-star hotels to roadside cafes.
Potato production systems needed to meet the increased demand can be characterized by their source of seed: domestic, certified, and imported. Users of domestic seed save tubers from their preceding crop or purchase them from their neighbors. This seed is less expensive but runs the risk of carrying diseases over from one season to the next. Certified seed users get potatoes from a joint program between Japan and the Government of Indonesia. Certified seeds are locally grown tubers that are monitored for several seasons and “certified” to be disease-free. Growers using imported seed obtain their potatoes from Germany or the Netherlands.
The PAM-based research shows that all three production systems are
highly profitable at both private and social prices. However, plots using certified seed were significantly more profitable than those using domestic or imported seed. As there are significant economies of scale in creating and enforcing a certification program, these results suggest that developing such a project might be a good investment for the West Java Government.
3

1. Policy Issues
1.1. Background
According to a World Bank analysis in 1991, the demand for vegetables in Indonesia was projected to increase by 5 percent per year between 1998 and 2010. Potatoes play a very important role in menu diversification, because they can be fried, boiled, or baked. The trend of serving more potato-based foods can be observed from five-star hotels to roadside cafes.
This increased demand creates an opportunity to expand and diversify potato-farming systems. The growth of potato production in Indonesia between 1997 and 2001 can be seen in Table 1.1.
Table 1.1. Potato Production of Indonesia (1997-
2001)
Years Production (tons) 1997 813,000 1998 998,000 1999 924,000 2000 977,000 2001 831,000
Source: Agriculture Department, 2002
From the agro-climatic perspective, West Java is a very suitable place for potato farming. Recent area, yields, and production for potato farming in West Java are shown in Table 1.2. In most years, West Java accounts for nearly half of national potato production.
Table 1.2. Harvested Area, Potatoes Production, and Productivity in West
Java (1997-2001)
Years Harvested Area (ha)
Production (tons) Productivity (ton/ha)
1997 11,428 208,297 18.243 1998 20,994 437,727 20.850 1999 22,813 426,863 18.711 2000 28,695 509,971 17.772 2001 23,414 414,431 17.700
Average 21,467 399,458 18.061 Source: Agricultural Department of West Java, 2002
4

A drop in potato prices caused the decline of production in 2001, both in Indonesia and in West Java. (Prices declined from Rp 2336/kg in 1999 to Rp 1628 in 2000). For that reason, most farmers felt reluctant to plant potatoes in 2001.
The average yield (productivity) of potatoes in West Java was about 18 tons/hectare. This productivity was less than that achieved in Japan, about 30 tons/hectare. The lower productivity of potato farming in West Java resulted largely from less consistent seed quality.
Many potato farmers were unable to optimize their potatoes yields. One of the reasons was the availability and price of high quality potato seeds. Imported and certified seeds were too expensive for some farmers. West Java could achieve potato yields of between 20 and 25 tons/hectare. Current productivity levels could be improved if more potato farmers adopted high quality seeds. This change requires widespread potato seed availability at an affordable seed price. The Government of West Java has tried to improve the quality and quantity of potatoes seeds. The Government has introduced a multiplication project for potato seed breeding, created well-trained seed breeders, and conducted farmer training. The Development of High Quality Seed Potato Multiplication System Project was a joint project between the Indonesian government and Japan through JICA (Japan International Cooperation Agency). This project developed high quality seed potatoes – certified seeds – but met only 3.5 percent of the national demand for potato seeds.
Farmers in West Java currently use three kinds of potato seeds – domestic seeds (produced in West Java), imported seeds (produced abroad), and certified seeds (grown by cooperation between local governments and the former JICA program). The cooperation between the West Java Government and JICA ended in September 2003. Since then, the government has been concerned about the availability and quality of certified seed. The government would like to renew its cooperation with JICA in the near future.
1.2. Objectives
The central goal of this study is to assist the government in determining whether to invest public funds in potato seed development. To that end, this study has two objectives:
• to assess the relative efficiency of potato-farming systems using certified, domestic, and imported seeds; and
• to rank the competitiveness of potato-farming systems using certified, domestic, and imported seeds.
5
2. Research Methods
2.1. Method of Data Collection
The research was conducted in Pangalengan, a central area of potato production in West Java. The variety used was Granola. The respondents were local potato producers and potato traders. The farmers were divided into three groups differentiated by whether they planted certified, domestic, or imported seeds.
The field research took place in November 2002. Interviews were conducted with 21 potatoes farmers, including 6 certified seed users, 6 domestic seed users, and 9 imported seed users. In addition, 5 potato traders were interviewed.
2.2 Types and Sources of Data
Two types of data – primary and secondary – were used in this research. The primary data on production (for the last planting season before November 2002) were collected from the farmers and traders. The secondary data were export, import, and production of potatoes at the regional and national levels. Additional data were also collected from the department of trade and industry and department of agriculture on CIF and FOB prices and on policies affecting production inputs and potatoes output.
2.3. Data Analysis
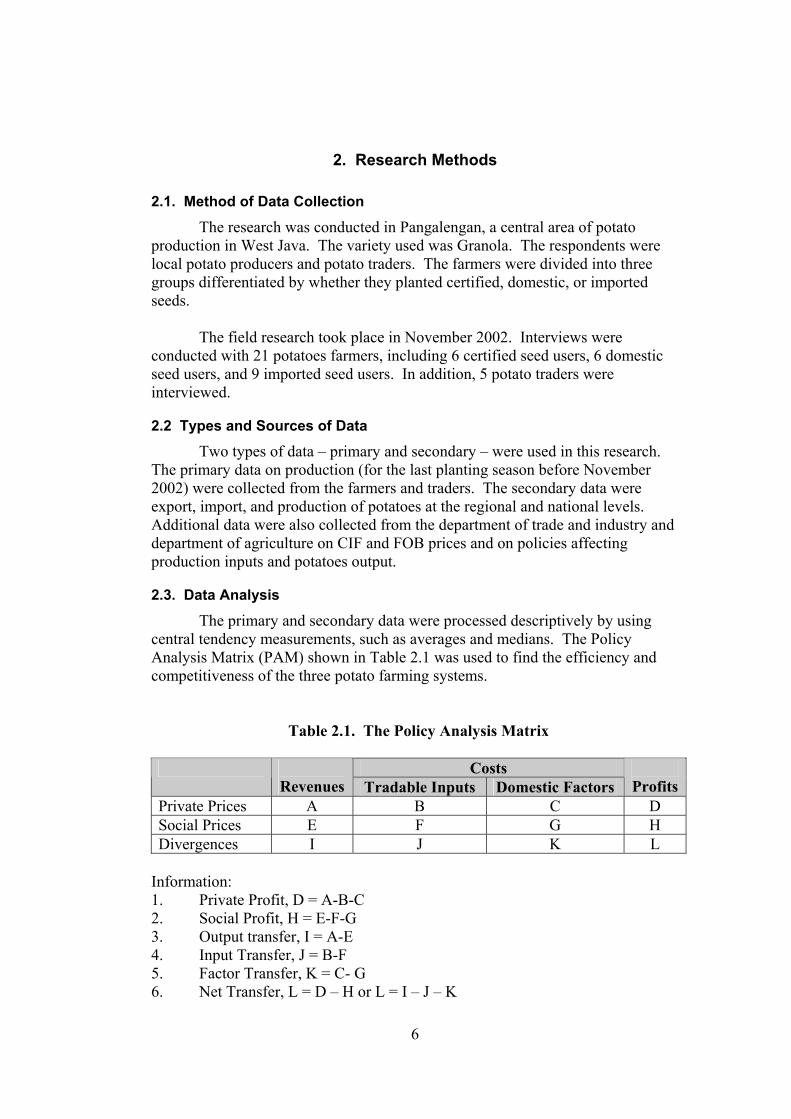
The primary and secondary data were processed descriptively by using central tendency measurements, such as averages and medians. The Policy Analysis Matrix (PAM) shown in Table 2.1 was used to find the efficiency and competitiveness of the three potato farming systems.
Table 2.1. The Policy Analysis Matrix
Costs
Revenues Tradable Inputs Domestic Factors
ProfitsPrivate Prices A B C D Social Prices E F G H Divergences I J K L
Information: 1. Private Profit, D = A-B-C 2. Social Profit, H = E-F-G 3. Output transfer, I = A-E 4. Input Transfer, J = B-F 5. Factor Transfer, K = C- G 6. Net Transfer, L = D – H or L = I – J – K
6

7. Private Cost Ratio, PCR = C/(A – B) 8. Domestic Resource Cost Ratio, DRC = G/(E – F) 9. Nominal Protection Coefficient
on Tradable Output, NPCO = A/E 10. Nominal Protection Coefficient on Input Tradable, NPCI = B/F 11. Effective Protection Coefficient, EPC = (A – B)/(E - F) 12. Profitability Coefficient, PC = (A-B-C)/(E-F-G) or D/H
Source: Monke and Pearson, 1989
2.4. Assumptions
Exchange Rate
The average Rupiah/US dollar exchange rate in November 2002 was Rp 9000/US$1.
Social Prices of Tradable Inputs
Certified seeds used in this research were G4 (fourth generation) taken from the government/JICA project. The imported seeds were available in seed kiosks (mostly originating from Germany and the Netherlands) and were equal to G4. According to project researchers and potato farmers, the quality of certified seeds was comparable with that of the imported seeds. Hence, the quality and generation for both improved types of Granola seeds are equivalent. Therefore, the social price of both seeds is approximated by the same import parity seed price.
Domestic seeds used were taken from the wholesaler or from the seeding systems (the generation was unclear but greater than G5). For local or domestic seeds where the heredity was unidentified, it was impossible to identify the generation. This type of seed was produced and planted only in the local area. Farmers could buy and sell the domestic seeds freely. It was assumed, therefore, that the social price of domestic seed could be approximated by its private price. According to information from importers and from the Department of Trade and Industry in West Java (2003), the social price of pesticide was lower than its actual (private) price. Because of a 20 percent import tariff on pesticide, the social price of pesticide was 20 percent lower than its private price. The social price for fuel was equal to its private price. At the end of 2002, the government eliminated its subsidy on fuel.
Social Prices of Nontradable Inputs
All laborers involved in potato-farming systems, both male and female, were uneducated laborers. No distorting policies or market failures were observed in
7

the market for rural, unskilled labor. As a result, the social price of labor was taken to equal the private wage rate. The private land rental rate was observed as the actual land rent price. There were many farmers who were interested in renting out their land and also many farmers who did not have land and thus rented in land to farm. In this research project, it was not possible to study alternative crops to estimate the social land rental rate. Therefore, land cost is omitted from both private and social calculations, and profitability is defined as the return to land and management.
Social Output Prices Consumption potatoes are potatoes produced by a farming system and used mostly for local household consumption. No distorting policies or market failures were observed to affect the domestic market for these consumption potatoes, and so the private price was assumed to be a good approximation for the social price. The export price is used to determine the export parity price (output), which serves as the social price for both the certified and imported potato seeds.
3. Potato Farming Systems in Pangalengan
3.1 Physical Condition of Pangalengan
Pangalengan is a sub-district in West Java province with an area of 25,849 hectares. The land uses in Pangalengan are summarized in Table 3.1.
Table 3.1. Land Uses in Pangalengan Sub-district, West Java
Land Categories Area Percentage 1. Wet land:
a. Technical irrigation b. Semi-technical irrigation c. Simple irrigation d. Rain cistern land
1,142,935 573,695 344,240 202,000 23,000
4 2 1 0.7 0.1
2. Dry land a. Yard/building/emplacement b. Garden c. Unirrigated agricultural field
7.710.661 2.313.196 4.626.396 771.06
30 9 18 3
3. Fishpond / pool 271,345 1 4. Forest land 9,316,009 36 5. Estate land 6,992,950 27 6. Other 415,008 2 Total 25.849,400 100
Source: Monograph of Pangalengan
8

The dominant land uses in Pangalengan sub-district are forestry, dry land, and estate land. The dry land areas were usually used for growing vegetables, mainly potatoes and cabbages.
Of Pangalengan’s 25,849,40 hectares, 29 percent is classified as flat and wavy, 33 percent as wavy-to-hilly, and 38 percent as hilly and mountainous. Pangalengan sub-district varies between sea level and 1500 meters in elevation, and it has an annual rainfall of 1500 mm. With these natural conditions, Pangalengan is a center of vegetable production in West Java.
3.2 Profile of Potato Farming Systems in Pangalengan
Three different kinds of potato seeds – certified, domestic, and imported – were used in Pangalengan. Most potato producers in Pangalengan preferred to use imported seeds since they believed that imported seeds have higher yields and better resistance to disease and pests. The farmers bought the imported seeds from the local market. Domestic seeds were obtained from other farmers or local breeders. The production and distribution of certified potato seeds are depicted in Figure 3.1.
Figure 3.1 Production and Distribution of Certified Potato Seed in Pangalengan Sub-district, West Java
G2
(from BBI)
G2 was grown in BBU, PD Hikmah,
and Paguyuban Pangalengan
G3
G4 was distributed to the farmers
G4 G3 was grown by the official breeder farmers
Information: BBI = Balai Benih Induk G2 = Second generation G4 = Fourth generation BBU = Balai Benih Utama G3 = Third generation Sumber: Balai Benih Induk, 2002 This marketing line of seed distribution was an ideal model line determined by the government. Those who have the right to sell the G4 seeds were the traders selected by BBU. But, in practice, some of the G4 seeds (certified seeds) marketed by the breeders were of low quality. Hence, some farmers did not trust certified seeds and preferred to use imported seeds instead. The farmers were very keen to plant high productivity seed. They tried every possible effort to get improved potato seeds, including buying G3 directly
9

from the BBU, which was forbidden. These activities happened during the time of the field research. For that reason, the certified potatoes in this research were the G3 type from BBU. The average price of imported seed in the local market was Rp9,300/kg. At the same time, the average price of certified potato seed from BBU was Rp 7,300/kg, and the price of domestic seed was only Rp 4,100. Farmers who had limited finance or access to credit tended to buy domestic seeds. The price of certified seeds was determined by the government. The price was adjusted with the price of consumption potatoes. The policy is stated in Governor’s Regulation No. 521.32/SK.1475-Perek/98. The purpose of this regulation is to determine the price of G2, G3, and G4 seed in an effort to stabilize the price of certified seed. The regulation is depicted below.
Table 3.2 Potato Seed Price Regulation in West Java
Seed Determinations Of Price
Basic Seed (G2) from BBI 1.2 x G3 price
Main Seed (G3) 1.2 x G4 price
Spread Seed (G4) 3 x consumption potatoes price
Source: Governor Decree No.521.32/SK.1475-Perek/98
The main purpose of the regulation was to control the price level and to reduce the fluctuation of potato seed prices. The stated aim was to allow farmers with less money to buy the certified seeds. But the regulation did not work well. The regulation only controlled the prices of certified seed from BBI and BBU, but it could not control the price of certified seed grow by other breeders.
The inorganic fertilizers used by most farmers were urea, SP36, ZA, and KCl. The usage of fertilizer depended on the farming condition and the experience of each farmer. The average rate of urea usage was 313 kg/hectare, SP36 was 668 kg/hectare, ZA was 502 kg/hectare, and KCl was 246 kg/hectare. The average price of urea was Rp 1200/kg, ZA Rp 1275/kg, KCl Rp 1800/kg, and SP36 Rp 1400/kg. The most common organic fertilizer used by farmers in Pangalengan was batere (chicken manure). The farmers use a great amount of this kind of fertilizer, on average 13,995 kg/hectare. The price of organic fertilizer was Rp 205/kg.
Potato farmers have different criteria for using pesticide. In the rainy season, plant diseases commonly destroy the potato plants, whereas in the dry season, the main threat to potatoes are insects.
10

The average cost of pesticide usage per hectare was Rp 9,593,000 for certified seeds, Rp 8,963,000 for domestic seeds, and Rp8,938,000 for imported seeds. Farmers used more pesticide on certified seeds because they had less confidence about the resistance of those seeds to diseases.
Most labor was hired on a short-term basis. Some farmers hired labor gangs (“borongan”) that worked during planting and drainage preparation. The labor used in land preparation, planting, fertilizing, weeding, harvesting, and breeding was mostly female. Male laborers were used in spraying, supervising, and drainage. The average daily wage for male laborers was Rp 8,000 and for female laborers was Rp 6,000. The wage rate for labor at the preparation stage was the same as that at the harvesting stage. The average wage for workers who provided security (to protect output before harvest from thieves) was Rp 11,200 per day. Most farmers in Pangalengan rented land either in or out. The average land rental rate per hectare for sampled potato farmers was Rp 959,135.
The outputs of the potato farming systems are consumption potatoes and potato seed. On average, farmers sold about 80 percent of their potato output as consumption potatoes. The remaining fifth of output was germinated and sold as potato seed.
In Pangalengan, there were four marketing channels for potatoes: Line distribution 1: farmer – small collector – big collector – wholesaler; Line distribution 2: farmer – small collector – wholesaler; Line distribution 3: farmer – big collector – wholesaler; and Line distribution 4: farmer – wholesaler.
The wholesalers were located in Caringin, Kramat Jati, Cibitung, and Tangerang.
The average price at which farmers sold consumption potatoes to small or big collectors was Rp 2,200/kg. The average price at which collectors sold to wholesalers was Rp 2,300/kg. The average price at which wholesalers sold to retailers was Rp 2,800/kg.
4. The Competitiveness and Efficiency of Potato Farming Systems The objective of this study is to compare the efficiency and competitiveness of potato farming systems that use three different kinds of seeds – certified seeds, domestic seeds, and imported seeds. To that end, three different Policy Analysis Matrices (PAMs) were constructed. The PAM results are displayed in Table 4.1.
11
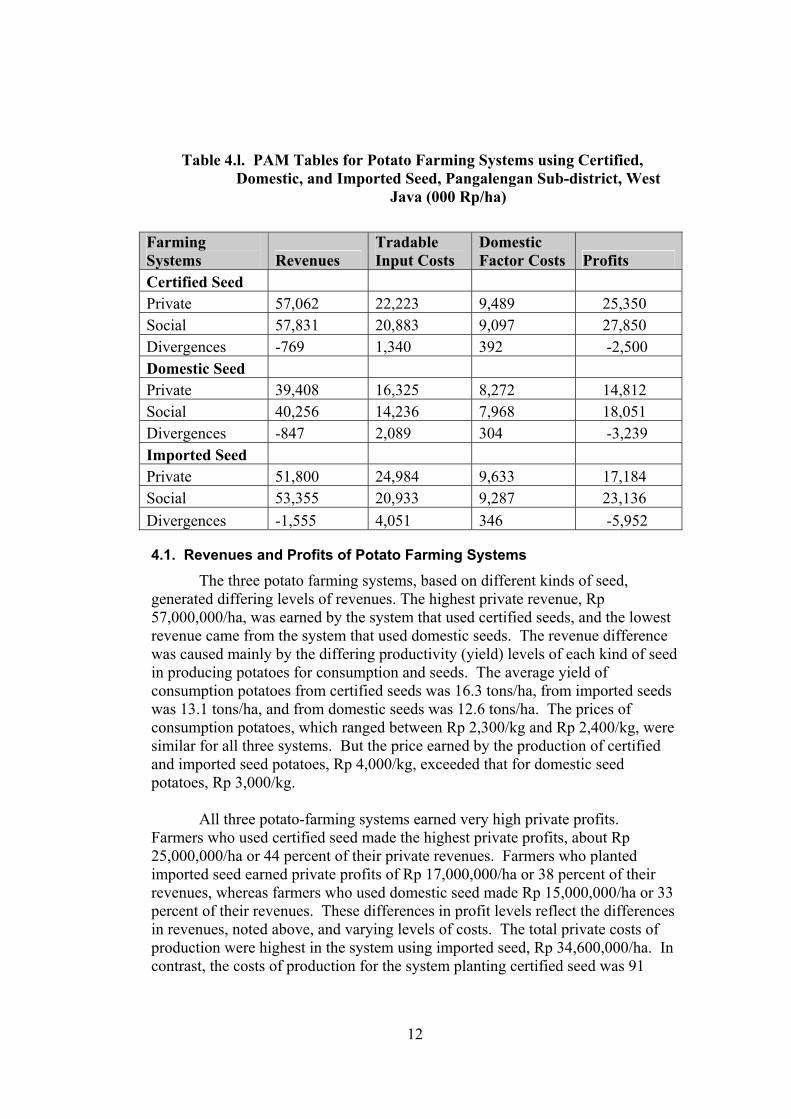
Table 4.l. PAM Tables for Potato Farming Systems using Certified, Domestic, and Imported Seed, Pangalengan Sub-district, West
Java (000 Rp/ha)
Farming Systems Revenues
Tradable Input Costs
Domestic Factor Costs Profits
Certified Seed Private 57,062 22,223 9,489 25,350 Social 57,831 20,883 9,097 27,850 Divergences -769 1,340 392 -2,500 Domestic Seed Private 39,408 16,325 8,272 14,812 Social 40,256 14,236 7,968 18,051 Divergences -847 2,089 304 -3,239 Imported Seed Private 51,800 24,984 9,633 17,184 Social 53,355 20,933 9,287 23,136 Divergences -1,555 4,051 346 -5,952
4.1. Revenues and Profits of Potato Farming Systems
The three potato farming systems, based on different kinds of seed, generated differing levels of revenues. The highest private revenue, Rp 57,000,000/ha, was earned by the system that used certified seeds, and the lowest revenue came from the system that used domestic seeds. The revenue difference was caused mainly by the differing productivity (yield) levels of each kind of seed in producing potatoes for consumption and seeds. The average yield of consumption potatoes from certified seeds was 16.3 tons/ha, from imported seeds was 13.1 tons/ha, and from domestic seeds was 12.6 tons/ha. The prices of consumption potatoes, which ranged between Rp 2,300/kg and Rp 2,400/kg, were similar for all three systems. But the price earned by the production of certified and imported seed potatoes, Rp 4,000/kg, exceeded that for domestic seed potatoes, Rp 3,000/kg. All three potato-farming systems earned very high private profits. Farmers who used certified seed made the highest private profits, about Rp 25,000,000/ha or 44 percent of their private revenues. Farmers who planted imported seed earned private profits of Rp 17,000,000/ha or 38 percent of their revenues, whereas farmers who used domestic seed made Rp 15,000,000/ha or 33 percent of their revenues. These differences in profit levels reflect the differences in revenues, noted above, and varying levels of costs. The total private costs of production were highest in the system using imported seed, Rp 34,600,000/ha. In contrast, the costs of production for the system planting certified seed was 91
12

percent of that level, whereas the costs of producing potatoes with domestic seeds were only 71 percent of those of the system using imported seeds.
In spite of the greater profitability of planting certified seeds, many farmers who used improved potato seeds preferred to plant imported seeds, because they felt more confident that the imported seeds (from Germany and the Netherlands) would give higher yields and be less susceptible to diseases and pests. They judged the certified seeds to be riskier until they achieved a proven track record of success. The certified seeds used a new technology developed in the JICA project and had been planted only in a few locations in West Java.
4.2 Competitiveness and Efficiency of Potato Farming Systems
Efficiency refers to the ability of a farming system to earn profit at efficient (or social) prices, those that reflect the absence of distorting policies and market failures and thus lead to the highest income for the country. Competitiveness reflects the ability of a farming system to earn profits at the actual market (or private) prices in place when the study was carried out. Indicators of efficiency and competitiveness for potato-farming systems using certified, domestic, and imported seed are presented in Table 4.2.
Table 4.2. Indicators of Efficiency and Competitiveness for Potato
Farming systems Using Certified, domestic, and Imported Seed, Pangalengan Sub-District
Certified Domestic Imported
DRC [G/(E-F)] 0.25 0.31 0.29 PCR [C/(A-B)] 0.27 0.36 0.36
The Domestic Cost Ratio (DRC) is an indicator of social profit or
efficiency. The DRC is a ratio of the social opportunity costs of domestic factors of production (labor, capital, manure, and sometimes land) relative to the value added in world prices (revenues less tradable input costs, both measured in efficiency or world prices). A DRC less than one indicates positive social profit and shows that the production system is economically efficient and the country has a comparative advantage in producing a commodity with that system. The lower the DRC, the greater is the degree of economic efficiency.
Because the PAM entries (E, F, and G) used to calculate the DRC ratios are identical to those used to calculate social profitability, rankings using DRC results are identical to those using social profits (H in PAM). As shown in Table 4.2, all three potato-farming systems were extremely efficient (DRC ratios much less than one). The system that used certified seed was the most efficient (DRC equal to 0.25), followed by those using imported seed (0.29) and domestic seed
13

(0.31). The lesson is that potato production – with any of the three different seeds – provides a very efficient use of scarce resources in West Java.
The Private Cost Ratio (PCR) is an indicator of private profit or competitiveness. The PCR is a ratio of the private opportunity costs of domestic factors of production (labor, capital, manure, and sometimes land) relative to the value added in domestic prices (revenues less tradable input costs, both measured in actual market prices). A PCR less than one indicates positive private profit and shows that the production system is competitive for resources given the actual prices in the product and factor markets. The lower the PCR, the greater is the degree of competitiveness. Because the PAM entries (A, B, and C) used to calculate the PCR ratios are identical to those used to calculate private profitability, rankings using PCR results are identical to those using private profits (D in PAM). As shown in Table 4.2, all three potato-farming systems were extremely competitive (PCR ratios much less than one). The system that used certified seed was the most competitive (PCR equal to 0.26), followed by those using imported seed (0.36) and domestic seed (0.36). Potato production – with any of the three different seeds – provides a very competitive use of resources in West Java.
4.3 Transfers and the Impact of Government Policies
The third row of PAM contains a measure of the effects of divergences between valuations of products and factors in actual market prices (private or top row of PAM) and in efficiency prices (social or second row of PAM). Divergences are caused either by distorting policies or by market failures. If market failures are not significant, the effects of divergences are the result of distorting policies. Then the third row of PAM shows whether policies transfer resources toward or away from the production system under study.
The impact of policies affecting tradable outputs is shown in entry I of the PAM. The output transfer is the difference between the valuation of revenues in private (actual market) prices and in efficiency (social) prices, or (I=A-E). A ratio measuring this output transfer is the nominal protection coefficient on output, or NPCO (A/E). Output transfers for the three potato systems are shown in Table 4.3.
Table 4.3. Output Transfers for Potato Farming Systems using Certified, Domestic, and Imported Seed, Pangalengan Sub-
district, West Java (000 Rp/ha)
Total revenue NPCO
Certified seed Private Social
57,061 57,830
0.99
14

Table 4.3. Output Transfers for Potato Farming Systems using Certified, Domestic, and Imported Seed, Pangalengan Sub-
district, West Java (000 Rp/ha)
Total revenue NPCO
Divergences -769 Domestic seed Private Social Divergences
39,408 40,255 -847
0.98
Imported seed Private Social Divergences
51,800 53,355 -1,555
0.97
The very small measured (negative) output divergences resulted from minor errors in the data. There were no policies taxing potatoes, and there were no observed market failures. The output from the potato farming systems was unprotected and untaxed.
The impact of policies affecting tradable inputs is shown in entry J of the PAM. The tradable input transfer is the difference between the valuation of tradable inputs in private (actual market) prices and in efficiency (social) prices, or (J=B-F). A ratio measuring this tradable input transfer is the nominal protection coefficient on tradable inputs, or NPCI (B/F). The tradable inputs used in potato farming were seeds, fertilizer, pesticides, and fuel. Tradable input transfers for the three potato systems are shown in Table 4.4.
Table 4.4 Tradable Input Transfers for Potato Farming Systems using Certified, Domestic, and Imported Seed, Pangalengan Sub-district,
West Java (000 Rp/ha)
Tradable Inputs Seed Fertilizers Pesticide Fuel Total
NPCI
Certified Seed Private 10,265 2,102 9,593 262 22,223 Social 11,176 1,770 7,674 262 20,883 Divergences - 911 332 1,918 0 1,340
1.06
Domestic Seed Private 5,133 1,965 8,963 262 16,325 Social 5,133 1,669 7,171 262 14,236 Divergences 0 295 1,792 0 2,089
1.15
Imported Seed
15

Table 4.4 Tradable Input Transfers for Potato Farming Systems using Certified, Domestic, and Imported Seed, Pangalengan Sub-district,
West Java (000 Rp/ha)
Tradable Inputs Seed Fertilizers Pesticide Fuel Total
NPCI
Private 13,447 2,335 8,938 262 24,984 Social 11,492 2,027 7,151 262 20,932 Divergences 1,955 308 1,787 0 4,052
1.19
The divergence on seed input was negative for the certified seed production system. Through the Potatoes Seed Price Regulation, the government provided a subsidy, amounting to about Rp 900,000/ha. In contrast, potato producers using imported seed paid a 17 percent tax on that input, while those using domestic seeds received no subsidy and paid no tax (and thus faced no divergence).
The measured divergences on fertilizer amounted to implicit taxes of between 15 and 19 percent for the three potato systems. It is not clear what causes this apparent divergence. There were no explicit taxes (from government policies) on fertilizer. The higher private cost of fertilizer might be the result of unofficial taxes paid on the road from wholesale market to the kiosk in Pangalengan.
The measured divergences on pesticide amounted to implicit taxes of between 20 and 25 percent. This divergence is explained by government taxes on pesticides, mostly generated through a 20 percent tariff on pesticide..
For all three potato-farming systems, the NPCI values were greater than one. Farmers planting certified seeds paid 6 percent more than the efficient prices for their tradable inputs; taxes on fertilizer and pesticide more than offset the subsidy on seed. Farmers using imported and domestic seed were taxed 19 percent and 15 percent, respectively, for their purchase of tradable inputs. They paid taxes on seed, pesticide, and fertilizer.
The impact of policies affecting domestic factors of production (manure, labor, and capital) is shown in entry K of the PAM. The domestic factor transfer is the difference between the valuation of factors in private (actual market) prices and in efficiency (social) prices, or (K=C-G). Domestic factor transfers for the three potato systems are shown in Table 4.5.
16

Table 4.5. Domestic Factor Transfers for Potato Farming Systems Using Certified, Domestic, and Imported Seed,
Pangalengan Sub-district, West Java (000 Rp/ha)
Manure Labor Capital Total
Certified seed Private Social Divergences
3,265 3,265
0
3,873 3,873
0
2,349 1,957 391
9,488 9,097 391
Domestic seed Private Social Divergences
2,576 2,576
0
3,873 3,873
0
1,821 1,518 303
8,272 7,968 303
Imported seed Private Social Divergences
3,683 3,683
0
3,873 3,873
0
2,076 1,730 346
9,633 9,287 346
There were no distorting policies or market failures affecting the markets
for manure and labor. Hence, the divergences in those markets were zero for all three potato-farming systems. The private interest rate for both working capital and investment capital was 8 percent per season, whereas the social interest rate was 6.7 percent per season. This difference in the private and social costs of capital resulted in a divergence in the capital market of 1.3 percent per season. Because of the underdeveloped nature of the rural credit markets, farmers had to pay more for their capital than its scarcity value to society. The transfer was small in all three systems, ranging between Rp 303,000/ha and Rp 391,000/ha, because relatively little capital was used in potato production in West Java.
The complete impact of policies (and market failures) affecting potato-farming systems, the net transfer, is shown as entry L of the PAM. The net transfer is the difference between the valuation of profits in private (actual market) prices and in efficiency (social) prices, or (D-H). Net transfers for the three potato systems are shown in Table 4.5. They were small for all three systems, ranging between negative Rp 2,500,000/ha and negative Rp 6,000,000/ha, because there were few divergences affecting potato production in Pangalengan.
17

Table 4.6. Net Transfers and Profitability Coefficients for Potato Farming Systems using Certified, Domestic, and Imported Seed, Pangalengan Sub-
district, West Java (000 Rp/ha)
Revenue Tradable
Input Domestic
Factor Profit
Profitability Coefficient
Certified seed Private 57,062 22,223 9,488 25,350 0.91 Social 57,831 20,883 9,097 27,850 Divergences -769 1,340 391 -2,500 Domestic Seed Private 39,408 16,325 8,272 14,812 0.82 Social 40,256 14,236 7,968 18,051 Divergences -847 2,089 304 -3,239 Imported Seed Private 51,800 24,984 9,633 17,183 0.74 Social 53,355 20,933 9,287 23,135 Divergences -1,555 4,051 346 -5,952
The Profitability Coefficient (PC = D/H) is a comparison of private profits
(D) with social profits (H). The PC shows the impact of all divergences on private profits. If the PC is less than one, policies (and market failures) transfer income away from the production system (or impose a net tax), whereas if the PC exceeds one, policies (and market failures) transfer income toward the system (or provide a net subsidy). As shown in Table 4.6, the PC for the system planting certified seeds, 0.91, was higher than those for the systems using domestic seeds, 0.81, and imported seeds, 0.73. Policies transferred 9 percent of potential income away from the system using certified seeds, 19 percent from that using domestic seeds, and 27 percent from that using imported seeds. The key explanation for this difference lies in seed policies. Certified seeds are subsidized, domestic seeds are unaffected by policy, and imported seeds are taxed.
5. Conclusions and Recommendations
5. 1 Conclusion
All three of the potato-farming systems in Pangalengan were very competitive. Farmers planting certified seeds earned private profits of Rp 25,00,000/ha, those planting imported seeds received Rp 17,000,000/ha, and those planting domestic seeds gained Rp 15,000,000/ha. All three of the systems also were highly efficient. The social profits were highest for the system planting certified seeds, Rp 28,000,000/ha, second best for the
18

system using imported seeds, Rp 23,000,000/ha, and still high for the system using domestic seeds, Rp 18,000,000/ha. The DRC ratios for the three systems were 0.25, 0.29, and 0.31, respectively, showing strong comparative advantage.
The net effect of government policies affecting outputs and inputs was to discourage potato production. The Profitability Coefficients (PCs) were 0.91 for the system planting certified seed, 0.74 for the system using imported seed, and 0.82 for the system planting domestic seed. These transfers away from potato farmers resulted largely from taxes on tradable inputs.
5.2 Recommendation
This research shows that all three potato-farming systems were highly profitable (in both private and social prices) and that the system using certified seed was more profitable than the systems that used domestic and imported seeds. Based on this result, it is important for the government to support the development of the certified seeds system. The government might also cooperate with scientists and seed breeders in other countries to increase the quality of imported seed.
References Bank Indonesia, 2002. Neraca Pembayaran. Bank Indonesia. Jakarta. Bina Hortikultura Tanaman Pangan Jawa Barat. 2002. Program Pengembangan
Perbenihan Kentang di Jawa Barat Tahun 2002. Dinas Pertanian Tanaman Pangan Jawa Barat
Djamin, Zulkarnaen. 1993. Perencanaan dan Analisa Proyek. Lembaga Penerbit
Fakultas Ekonomi Universitas Indonesia. Jakarta Hukum, Rusli Nyak. 2000. Potato Production and Research Development In
Indonesia. Departemen Pertanian. Jakarta.
Indrawan, R. D. 1997. Analisis Keunggulan komparatif dan Kemungkinan Pengembangan Ekspor Terong Beku ke Jepang (Kasus pada PT Humpuss Trading dan CV Kem Farms). Skripsi Jurusan Ilmu-Ilmu Sosial Ekonomi Pertanian. Fakultas Pertanian. Institut Pertanian Bogor. Bogor
Kadariah. 1986. Evaluasi Proyek Analisa Ekonomi. Lembaga Penerbit Fakultas Ekonomi Universitas Indonesia. Jakarta.
Monke.E.A. and Pearson S.R. 1994. The Policy Analysis Matrix for Agricultural Development, Cornell University Press.
19
20
Noorsapto, Asep. 1994. Keunggulan Komparatif dan Dampak Kebijakan Pemerintah Pada Komoditas Kakao (Suatu Studi Kasus Pada Perkebunan Kakao Di Sumatera Utara). Thesis Pasca Sarjana Institut Pertanain Bogor. Bogor.
Oktaviani, R. 1991. Efisiensi Ekonomi dan Dampak Kebijakan Insentif Pertanian
Pada Produksi komoditas Pangan di Indonesia. Thesis Pasca sarjana. Institut Pertanian Bogor. Bogor
Satia, A. 1997. Analisis Usahatani, Pemasaran, Keunggulan Komparatif dan
Keunggulan Kompetitif Brokoli. Kasus di Desa Ciherang, Kecamatan Pacet, Kabupaten Cianjur dan Desa Cikahuripan, Kecamatan Lembang, Kabupaten Bandung, Jawa Barat. Skripsi. Jurusan Ilmu-Ilmu Sosial Ekonomi Pertanian. Fakultas Pertanian. Institut Pertanian Bogor. Bogor.
Suryana, A. 1980. Keunggulan Komparatif dalam Produksi Ubikayu dan Jagung
di Jawa Timur dan Lampung dengan Analisis Biaya Sumberdaya Domestik. Thesis Pasca Sarjana. Institut Pertanian Bogor. Bogor.