the comparison orientation scale
TRANSCRIPT

econstorMake Your Publications Visible.
A Service of
zbwLeibniz-InformationszentrumWirtschaftLeibniz Information Centrefor Economics
Schneider, Simone; Schupp, Jürgen
Working PaperThe Social Comparison Scale: Testing the Validity, Reliability, andApplicability of the Iowa-Netherlands Comparison OrientationMeasure (INCOM) on the German Population
SOEPpapers on Multidisciplinary Panel Data Research, No. 360
Provided in Cooperation with:German Institute for Economic Research (DIW Berlin)
Suggested Citation: Schneider, Simone; Schupp, Jürgen (2011) : The Social Comparison Scale:Testing the Validity, Reliability, and Applicability of the Iowa-Netherlands Comparison OrientationMeasure (INCOM) on the German Population, SOEPpapers on Multidisciplinary Panel DataResearch, No. 360, Deutsches Institut für Wirtschaftsforschung (DIW), Berlin
This Version is available at:http://hdl.handle.net/10419/150905
Standard-Nutzungsbedingungen:
Die Dokumente auf EconStor dürfen zu eigenen wissenschaftlichenZwecken und zum Privatgebrauch gespeichert und kopiert werden.
Sie dürfen die Dokumente nicht für öffentliche oder kommerzielleZwecke vervielfältigen, öffentlich ausstellen, öffentlich zugänglichmachen, vertreiben oder anderweitig nutzen.
Sofern die Verfasser die Dokumente unter Open-Content-Lizenzen(insbesondere CC-Lizenzen) zur Verfügung gestellt haben sollten,gelten abweichend von diesen Nutzungsbedingungen die in der dortgenannten Lizenz gewährten Nutzungsrechte.
Terms of use:
Documents in EconStor may be saved and copied for yourpersonal and scholarly purposes.
You are not to copy documents for public or commercialpurposes, to exhibit the documents publicly, to make thempublicly available on the internet, or to distribute or otherwiseuse the documents in public.
If the documents have been made available under an OpenContent Licence (especially Creative Commons Licences), youmay exercise further usage rights as specified in the indicatedlicence.
www.econstor.eu
Deutsches Institut für Wirtschaftsforschung
www.diw.de
Simone Schneider • Jürgen Schupp
T W The Social Comparison Scale
360
SOEPpaperson Multidisciplinary Panel Data Research
Berlin, January 2011

SOEPpapers on Multidisciplinary Panel Data Research at DIW Berlin This series presents research findings based either directly on data from the German Socio-Economic Panel Study (SOEP) or using SOEP data as part of an internationally comparable data set (e.g. CNEF, ECHP, LIS, LWS, CHER/PACO). SOEP is a truly multidisciplinary household panel study covering a wide range of social and behavioral sciences: economics, sociology, psychology, survey methodology, econometrics and applied statistics, educational science, political science, public health, behavioral genetics, demography, geography, and sport science. The decision to publish a submission in SOEPpapers is made by a board of editors chosen by the DIW Berlin to represent the wide range of disciplines covered by SOEP. There is no external referee process and papers are either accepted or rejected without revision. Papers appear in this series as works in progress and may also appear elsewhere. They often represent preliminary studies and are circulated to encourage discussion. Citation of such a paper should account for its provisional character. A revised version may be requested from the author directly. Any opinions expressed in this series are those of the author(s) and not those of DIW Berlin. Research disseminated by DIW Berlin may include views on public policy issues, but the institute itself takes no institutional policy positions. The SOEPpapers are available at http://www.diw.de/soeppapers Editors: Georg Meran (Dean DIW Graduate Center) Gert G. Wagner (Social Sciences) Joachim R. Frick (Empirical Economics) Jürgen Schupp (Sociology)
Conchita D’Ambrosio (Public Economics) Christoph Breuer (Sport Science, DIW Research Professor) Anita I. Drever (Geography) Elke Holst (Gender Studies) Martin Kroh (Political Science and Survey Methodology) Frieder R. Lang (Psychology, DIW Research Professor) Jörg-Peter Schräpler (Survey Methodology) C. Katharina Spieß (Educational Science) Martin Spieß (Survey Methodology, DIW Research Professor) ISSN: 1864-6689 (online) German Socio-Economic Panel Study (SOEP) DIW Berlin Mohrenstrasse 58 10117 Berlin, Germany Contact: Uta Rahmann | [email protected]

The Social Comparison Scale Testing the Validity, Reliability, and Applicability of the Iowa-Netherlands Comparison Orientation Measure (INCOM) on the German Population Simone Schneider * Jürgen Schupp** Berlin, January 2011 * Simone Schneider, Sess.EuroPhD, Berlin Graduate School of Social Sciences, Humboldt Universität
zu Berlin, [email protected]. ** Jürgen Schupp, DIW Berlin, SOEP; Freie Universität Berlin; IZA Bonn, [email protected] We want to thank Deborah Anne Bowen (DIW Berlin) for her kind support on this paper.

II
Abstract
Social comparisons are an essential source of information about the self. Research in social
psychology has shown individual variation in the tendency toward comparison with other
people’s opinions and abilities, raising the question of whether social comparisons are
driven by psychological dispositions. To test the empirical validity of this proposition,
Gibbons and Buunk (1999) created an instrument that measures the tendency to engage in
social comparison and captures central aspects of the self, the other, and the psychological
interaction between the two. The Iowa-Netherlands Comparison Orientation Measure
(INCOM) comprises 11 core items that have been tested in the United States and the
Netherlands. To date, however, no attempt has been made to implement this instrument in
a large-scale survey of the German population. To fill this gap, the core items of the
INCOM scale were integrated into the 2010 SOEP (Socio-Economic Panel Study) pretest.
This paper analyzes the validity of the INCOM scale and discusses potentials for
shortening the instrument for continued use in large-scale population surveys. Exploratory
and confirmatory factor analysis as well as scale validation tests (invariance tests combined
with external validation techniques) produce acceptable results and confirm the
measurement instrument as valid and effective. With regard to shortening the questionnaire,
a six-item scale is recommended, which shows excellent model fit and proves to be a
reliable and efficient indicator to grasp individual dispositions towards social comparison.
JEL Classification: D31, D63, Z13
Keywords: Social comparisons; relative evaluations; reference groups, validity tests;
SOEP

III
Contents
Abstract .................................................................................................................................... II
1 Introduction ......................................................................................................................... 1
2 The INCOM Scale ............................................................................................................... 2
3 The Data ............................................................................................................................... 3
4 The Empirical Evaluation of the INCOM Scale ............................................................... 3 4.1 Descriptive statistics ...................................................................................................... 3 4.2 Factor structure .............................................................................................................. 3
5 Short Version of the INCOM Scale.................................................................................... 6
6 Scale Validation (for the Short Version of the INCOM Scale)........................................ 7 6.1 Construct validity........................................................................................................... 7 6.2 Discriminant validity ..................................................................................................... 8 6.3 Social desirability........................................................................................................... 8 6.4 External validation ......................................................................................................... 9
7 Summary ............................................................................................................................ 11
References ............................................................................................................................... 14
Tables ...................................................................................................................................... 16
Figures ..................................................................................................................................... 28
Appendix ................................................................................................................................. 31

1 Introduction
Social comparisons are an essential source of information about the self. People need this
information to evaluate their abilities and opinions, to improve their performance, and
potentially to enhance their self-esteem (Festinger, 1954). Several theories attempt to
explain this complex phenomenon by exploring the situational necessity, frequency, and
principles of social comparison processes (see Blau, 1964; Festinger, 1954; Homans, 1961;
Merton, 1968; Pettigrew, 1967; Thibaut and Kelley, 1959; see also Goethals, 1986;
Kruglanski and Mayseles, 1990; Messick and Sentis, 1983; Suls, 1991; Suls and Wheeler,
2000). Recently, however, researchers have claimed that the need for social comparison
depends not only on the situational context but also on individual characteristics and
preferences. Research has even identified a psychological disposition towards social
comparisons (see Buunk and Mussweiler, 2001). Gibbons and Buunk (1999) attempted to
empirically test for such individual dispositions by developing a scale to measure
individual differences in the tendency to make comparisons. To our knowledge, no effort
has been made to test the empirical validity of this instrument in Germany. To fill this gap,
the core items of the Iowa-Netherlands Comparison Orientation Measure (INCOM)
introduced by Gibbons & Buunk (1999) were implemented in the 2010 SOEP pretest. This
paper analyses the validity of the measurement instrument and discusses the potential to
shorten it for further implementation in large-scale population surveys.
1
2 The INCOM Scale
The core instrument of the INCOM scale (Gibbons and Buunk, 1999) contains 11 items. In
these items, people are given statements about their self-comparisons with others, to which
they can respond on a five-point scale ranging from A, strongly disagree, to E, strongly
agree (see Table 1). The validity of the instrument has been tested in 22 questionnaires in
the United States and the Netherlands. It has proven to be valid and reliable based on a
wide range of empirical tests. In detail, the 11 items ask about: (1) making comparisons
with loved ones; (2) paying attention to one’s own and others’ accomplishments; (3)
evaluating accomplishments through comparison; (4) comparing sociability; (5) denying
any comparison with others (reverse coding); (6) comparing life accomplishments; (7)
exchanging opinions and experiences with others; (8) interest in similar others’ thoughts;
(9) interest in similar others’ coping strategies; (10) gaining knowledge through others’
thoughts; (11) making no comparisons of personal life situation (reverse coding).
In accordance with Festinger (1954), the questionnaire developed by Gibbons and Buunk
(1999) differentiates between two dimensions of social comparisons that are distinct in
their underlying nature: (a) comparisons of abilities referring to the question “How am I
doing?” (Items 1-6) and (b) comparisons of opinions referring to the question “What shall I
feel/think?” (Items 7-11). Each dimension includes an item that is reverse-coded (item 5
and 11) and functions as control items for acquiescence biases (see Oskamp and Schultz
2004). In the following, we empirically test the validity of this instrument for the German
population, making use of methodological techniques proposed by Gibbons & Buunk
(1999). We also explore further possibilities for shortening the questionnaire to facilitate
more widespread use in large-scale population surveys.
2

3 The Data
The instrument was integrated into the 2010 Socio-Economic Panel Study (SOEP) pretest
module. SOEP is an annual household panel that has been conducted in Germany since
1984 (Haisken-DeNew and Frick, 2005; Wagner et al., 2007). Questions on whether
people compare their personal situation with others, look for orientation in life by
consulting others, or totally refuse any kind of social comparison are asked in the 2010
pretest module (see Jänsch and Siegel, 2010). The sample consists of 1,058 randomly
chosen respondents between the ages of 16 and 90. To ensure a reliable translation of the
original English version, the questionnaire was translated into and back-translated from
German (see Appendix, Table A1).
4 The Empirical Evaluation of the INCOM Scale
4.1 Descriptive statistics
The descriptive statistics provide an overview of the distribution of each item (see Table 2).
The overall distribution pattern shows a high response rate. Therefore, difficulties in
comprehending and/or answering the questions are rather negligible. The mean values vary
between 2.4 and 4.0. Items from the first dimension (1-6) are fairly right-skewed,
suggesting that respondents hesitate somewhat to make comparisons of abilities;1 the items
from the second dimension (6-11), however, are moderately left-skewed, which implies a
general tendency to compare themselves with the behavior, opinions, and experiences of
others. One exception is item 11. Although reverse-coded, the item indicates that
respondents tend not to make social comparisons of general life situations.
4.2 Factor structure
To gain an overall impression of the underlying factor structure, exploratory factor
analyses are conducted using the software Stata 10 (Kohler and Kreuter 2009). First, we
run a principle component analysis followed by a maximum-likelihood exploratory factor
analysis. In a second step, confirmatory factor analyses are done to confirm the
theoretically derived components of social comparison orientations.
1 Please note that item five follows a reversed coding structure. A mean value of 3.5 therefore indicates that individuals tend to agree that they are not the type of person who compares often with others.
3

Exploratory analysis
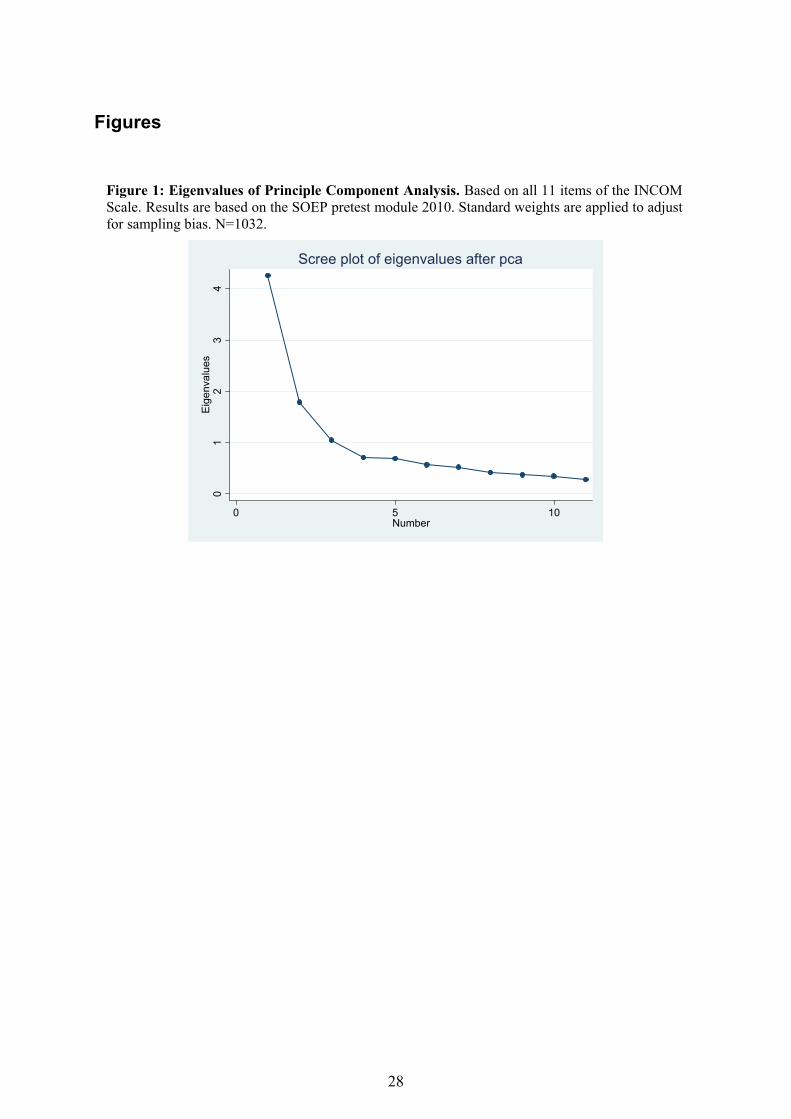
Contrary to our expectations, the principle component analysis points to the existence of
three components (Figure 1), and the Kaiser criterion and Catell scree test supports the
three-component solution. The low eigenvalue of the third component (1.04), however,
suggests that it is of only minor importance. In the following, we conduct a principle
component analysis constrained to three independent factors. The results point to a clear-
cut factor structure (Table 3). Alongside abilities and opinions, the two components
proposed above, it suggests the existence of a third component of social comparison, which
shows high values for the two control variables. Due to the nature of the items, the third
component may resemble a personal refusal to engage in social comparison. However, the
low eigenvalue, high negative correlations with the two other components, and the lack of
theoretical support fuel our doubts in the added value of including a third component of
social comparison. We therefore run a maximum likelihood factor analysis to test the
robustness of our previous findings.
The results of the maximum likelihood exploratory factor analysis differ from the previous
findings. The Kaiser criterion as well as the Catell scree test suggest the existence of two
comparison factors (Figure 2), in support of our theoretical assumptions (Table 4). The
first factor reflects comparisons of abilities, whereas the second factor reflects
consideration of and comparison with others’ opinions. The factor loadings are, however,
less discriminant than theoretically expected. The two control variables show fairly low
factor loadings, which slightly pass the 0.3 benchmark. Further, the second control variable
(item 11), shares more common variance with the ability than with the opinion factor. The
indifference of the second control variable in particular blurs the discriminant factor
structure, which is theoretically driven and has been observed in the United States and the
Netherlands.2
In sum, the results of the exploratory factor analyses support the existence of the two
components of social comparison orientations proposed in the theoretical section above:
comparisons of abilities and comparisons of opinions. Our results are therefore in line with
those of Gibbons and Buunk (1999), who concluded that social comparison orientations
consist of “two distinguishable factors that are highly related” (Gibbons & Buunk 1999:
132). However, our analyses also point to minor problems with the two-dimensional
2 The exploratory factor analyses which were calculated with Stata 10 were replicated with the software Mplus 5 (Muthén/Muthén 2010), which uses all information available (N=1052) and reports additional model fit indices. The analysis supports the previous results. The maximum likelihood exploratory factor analysis reports a poor model fit for the one-factor solution (χ²: 1202.015; df(44); P-Value: 0.0000; RMSEA: 0.158) with a significant improvement in fit of the two-factor (χ²: 186.369, df(34), P-Value: 0.0000; RMSEA: 0.065) and three-factor solution (χ²: 125.703, df(25), P-Value: 0.0000; RMSEA: 0.062).
4

comparison structure introduced by Gibbons and Buunk (1999). The observed deviance is
high for the two reverse-coded items (5 & 11). In general, reverse-coded items are used to
control the item response process and to prevent acquiescence biases (Oskamp and Schultz,
2004: 59). The control items in the social comparison scale, however, form either an
independent component within the comparison orientation (see results of principle
component analysis) or load with only minor values on the first ability comparison factor
(see results of maximum likelihood exploratory factor analysis).
Confirmatory analysis
To empirically test the concept of social comparison tendencies, we conduct a
confirmatory factor analysis. By so doing, we hope to gain additional insights into the
dimensionality of the orientation scale and derive further implications for its modification.
Figure 3 displays the underlying logic of confirmatory factor model, which is tested in the
following section.3
We use the software Mplus 5 (Muthén and Muthén 2010) to estimate the confirmatory
factor analysis, controlling for sampling bias and non-normal distribution of items by
applying standard weights and robust maximum likelihood estimation. The results in Table
5 show a decent model fit for a distinct two-factor structure (χ²: 170.933, df(43), p-value:
0.0000; scaling correction factor for MLR: 1.955; CFI: 0.933; TLI: 0.924; RMSEA: 0.053;
SRMR: 0.066). The low factor loadings of the second control item (item 11) and the
computational modification index suggest the introduction of error term correlations
between the two control items bridging the distinctiveness of the two dimensions. This
modification, however, only slightly increases the model fit (χ²: 145.335, df(42), p-value:
0.0000; scaling correction factor for MLR: 1.943; CFI: 0.945; TLI: 0.929; RMSEA: 0.048;
SRMR: 0.06; with a correlation of 0.23 between the error terms of the two items).4 The
relocation of the second control item towards the ability dimension, a more profound
modification, further improves the model fit (χ²: 113.711, df(42), p-value: 0.0000; scaling
correction factor for MLR: 1.935; CFI: 0.962; TLI: 0.950; RMSEA: 0.040; SRMR: 0.042;
with a correlation of 0.21 between the error terms of the two items) (Table 6). This
solution provides equally good model fit compared to a three-factor solution (Table 7),
3 Note that the first-order model can be easily replaced by a second-order model, whenever the first-order dimensions prove to be strongly interrelated (indicated by high correlations between the latent constructs). 4 We refrain from reporting the factor loadings of this modified factor solution due to only minor deviances in the loadings reported in Table 5.
5

which lacks a theoretical basis (χ²: 113.541, df(42), p-value: 0.0000; scaling correction
factor for MLR: 1.9330; CFI: 0.962; TLI: 0.949; RMSEA: 0.041; SRMR: 0.042).
In sum, the results of the confirmatory factor analysis confirm the aforementioned
difficulties with the 11-item INCOM scale for Germany. Again, the problems relate to the
reverse-coded item(s) of the INCOM scale. Opening up a third dimension of social
comparison does not seem justified on the basis of theoretical reasoning. A personal
refusal to make social comparisons should already be inherent in the two original
dimensions of social comparison. Alongside theoretical doubts, methodological arguments
are not convincing enough to support a three-factor solution. Therefore, we may conclude
that in general the INCOM scale is applicable to German society, although one might
consider excluding the second control variable (item 11), since it does not serve its original
purpose.
5 Short Version of the INCOM Scale
To enhance the likelihood of further considerations of the INCOM scale within large-scale
population surveys, a shortening of the questionnaire is recommendable. Based on the
previous findings, we suggest a two-factor solution using six items from the original 11-
item core questionnaire. We selected the items based on their content and the share of
common variance. We aim for a multi-faceted but valid comparison orientation scale that
reflects the two components in their versatility. Comparisons on abilities are represented
by items 2 and 4 ((2) I always pay a lot of attention to how I do things compared with how
others do things. (4) I often compare how I am doing socially (e.g., social skills, popularity)
with other people).5 Not to completely abstain from a control mechanism, we add item 5 (I
am not the type of person who compares often with others. (reverse-coded)). Orientations
towards others’ opinions are measured by items 8, 9, and 10 ((8) I often try to find out what
others think who face similar problems as I face. (9) I always like to know what others in a
similar situation would do. (10) If I want to learn more about something, I try to find out
what others think about it).
The model fit of this shortened version of the two-dimensional INCOM scale turns out to
be excellent (χ²: 9.857; df(8); p-value:0.2752; scaling correction factor for MLR: 2.040;
CFI: 0.998; TLI: 0.996; RMSEA: 0.015; SRMR: 0.019). The factor loadings indicate a
well-fitting factor structure, as expected (Table 8). The reliability proves to be high,
5 Item 3 and 4 showed an equal proportion of shared variance. For the shortened version of the INCOM scale we selected item 4 to further broaden the scope of the dimension by including a more social ability component.
6

reaching from 49 to 73 percent of explained variance. However, the reliability of the
control item (5) is low, as expected, with a reliability of only 15 percent. We further run an
exploratory factor analysis. Both the principle component analysis (Table 9) and the
maximum likelihood exploratory factor analysis (Table 10) confirm the previous findings.
6 Scale Validation (for the Short Version of the INCOM Scale)
6.1 Construct validity
Testing whether the factor structure of the shortened version of the INCOM scale is
equivalent across sex, age, education, and regional residence, we conduct a multi-group
analysis, constraining factor loadings (β) and intercepts (α) to be equal for men and women,
young and old, high and low-educated, and East and West Germans. The results show
good model fits,6 which indicate an equivalent understanding of the questionnaire across
subgroups and therefore allow for further analysis of social comparison tendencies across
subgroups.7
In accordance with Gibbons and Buunk (1999), we use known-groups validation to further
assess construct validity. Based on previous research and in line with common reasoning,
we expect to find gender differences in social comparison tendencies: whereas men are
expected to show a tendency towards competitive behavior (> ability comparisons),
women are expected to be more open to advice and interested in others’ opinions, ideas,
and behavior (> opinion component). Tendencies in social comparisons are also expected
to vary across age groups. We assume that life experience strengthens the self-esteem and
the general confidence in one’s approach to life. Therefore, older people are more likely to
show weaker tendencies than younger people to compare themselves with others and to
seek guidance in others’ opinions and behavior. We do not expect any clear educational or
regional distinctions in social comparison tendencies.
6 These are for (a) sex: χ²: 56.966 (Men: 26.037; Women: 30.929), df(18), p-value: 0.0000; CFI: 0.982; TLI: 0.989; RMSEA: 0.064; WRMR: 1.361; (b) age: χ²: 72.340 (young: 26.742; older: 45.598), df(20), p-value: 0.0000; CFI: 0.956; TLI: 0.974; RMSEA: 0.099; WRMR: 1.388; (c) education: χ²: 44.724 (low: 16.938; high: 27.786), df(21), p-value: 0.0019; CFI: 0.974; TLI: 0.990; RMSEA: 0.059; WRMR: 1.082; (d) region: χ²: 19.210 (East: 12.476; Women: 6.734), df(16), p-value: 0.2579; CFI: 0.998; TLI: 0.999; RMSEA: 0.020; WRMR: 0.773. 7 Please note that the invariance test required a WLSMV-estimation which corrects for the categorical character of the comparison items. It is most likely that with the decline in sample size (due to the differentiation between, e.g., men and women) the categorical character of the comparison items became more decisive in the computation process. We checked whether a change in the estimation process would lead to any major deviance in the outcome. However, no evidence was found. The model fit for the pooled confirmatory factor analysis using the WLSMV estimator proved to be excellent as well (χ²: 13.990, df(5), p-value: 0.0000; CFI: 0.995; TLI: 0.994; RMSEA: 0.041; WRMR: 0.554).
7

The results in Table 11 are in line with our previous reasoning. We find evidence that men
show significantly stronger tendencies to compare their abilities with others than women,
whereas women report a significantly higher tendency to consider others’ opinions and
ideas. The results on age groups are also in line with our assumptions. People who are
older and thus have more life experience show weaker tendencies to seek external
feedback and less need to compare their abilities with others than younger people, who
face various outside pressures and are more receptive to external opinions. We also find far
fewer and less pronounced regional and educational differences in comparison tendencies.
Those with higher education report a stronger interest in other people’s opinions than the
less-educated. No significant differences are observed between East and West Germany. In
sum, our results are in line with our previous expectations and provide further evidence of
the validity of the measurement construct.
6.2 Discriminant validity
To test for the discriminant validity of the shortened INCOM scale, we correlate the two
orientation components, ability and opinion, with various other scales implemented in the
questionnaire, e.g., life and domain satisfactions, justice evaluations, and affect scales.
Besides high correlations with direct comparison measures (see Schneider and Schupp,
2010), we expect the INCOM scale to be theoretically and empirically independent from
all other scales. Table 12 reports the pairwise correlation coefficients. The results point to
only few significant correlations, which are of only minor strength. In contrast, correlations
with the direct comparison measures are significant and of higher correlative power. Thus,
we find indications of discriminant validity.
6.3 Social desirability
It is also likely that patterns of response to social comparison questions are biased by social
desirability. Despite the psychological usefulness of social comparisons in providing
information about the other and in enabling evaluation of the self (Festinger 1954), it is
likely that they are perceived as signs of helplessness that signal a lack of autonomy,
independence, and individuality—all qualities that are highly valued in Western society.
Biases in response patterns therefore seem probable and need to be tested.
For this purpose, we used items on social desirability (Winkler et al. 2006) that were
included in the 2010 SOEP pretest study. We found social desirability to be weakly
correlated with the ability component (correlations with ability: 0.10***; and with opinion:
0.01). Contrary to our expectations, the correlation between the two scales is positive,
8

indicating that individuals who show tendencies toward social desirability in their response
patterns show a higher affinity to report ability comparison tendencies. Therefore, contrary
to our expectations and the results reported by Gibbons and Buunk (1999), the findings
indicate that people who are likely to be influenced by social standards, tend to
overestimate the frequency and importance of comparisons with others’ abilities. However,
the relation is of only minor importance due to the low correlation coefficients.
6.4 External validation
Correlations with external variables, which are theoretically assumed to be correlated with
tendencies toward social comparison, offer further indications as to whether the
psychological concepts proposed prove to be valid. Here, we refer to the literature on life
satisfaction and its findings on comparison processes. Research on life satisfaction and
happiness has shown that it is not the increase in absolute income that increases a person’s
happiness, but the relative increase in income compared to significant others (Easterlin,
1995; Kahneman et al., 2006). This implies that social comparison processes are key
psychological mechanisms. We therefore assume that people compare their incomes to
others in order to evaluate their own financial situation.
Linking the research on life satisfaction to the concept of psychological dispositions
toward social comparison, we suggest a modification of the relative income hypothesis. If
social comparisons are key mechanisms translating relative income into individual
happiness, relative income only affects those individuals for whom comparisons are
important; that is, the higher the tendency to compare oneself to others, the stronger the
effect of relative income on life satisfaction. Distinguishing between different kinds of
social comparisons, we claim that attitudes about other peoples’ abilities are especially
important, since they are likely to reflect attitudes about others’ economic success. We
therefore assume that comparisons with the abilities of others decrease personal life
satisfaction, since such comparisons provide information that fosters competition and/or
places pressure on the individual. Comparisons with others’ opinions, however, may serve
a different function, offering coping strategies and providing more general orientations in
life, thereby increasing one’s life satisfaction. This may be the case only as long as
comparisons with others’ opinions are not directly related to other characteristics, e.g.,
personal instability, insecurity, and external locus of control, which may reduce enjoyment
of life. Therefore, we expect the effect of opinion comparisons to be less direct than effects
of ability comparisons. Following this argumentation, we plan to validate our comparison
9

orientation scale by exploring the empirical and theoretical distinction between the two
dimensions of the INCOM scale.
The empirical research on social comparison tendencies and their effects on personal life
satisfaction has not produced conclusive findings in line with the theoretical reasoning.
Gibbons and Buunk (1999: 133) conclude that “those who indicated that they compared
frequently with others were no more or less satisfied with their life situations than were
those who did not compare often.” Their findings were consistent with past research on the
subject (see Diener and Frujita 1997). Recently, however, research has suggested that
individuals who tend to compare their incomes with others report lower levels of
satisfaction than respondents who do not care at all about other peoples’ incomes
(Schneider 2010).
This being said, we empirically test (1) whether the tendency to make comparisons with
others has a significant impact on individual life satisfaction and (2) whether relative
income only affects the life satisfaction of those who show a disposition towards ability
comparisons as opposed to opinion comparisons or no comparisons. The subgroups were
generated on the basis of mean factor scores (opinion: -0.037; ability: -0.026). Individuals
with scores higher than the mean represent individuals with a general tendency towards
comparisons; those with scores lower than the mean represent those with no or a rather
minor tendency towards comparisons. 8 We run linear OLS regressions with robust
standard estimations (to adjust for the non-normal distribution of life satisfaction). We
control for age, gender, and the household’s financial situation.9
The results show that the absolute and relative position of the household within the
neighborhood significantly increases individual life satisfaction (Table 13, column 1).
Further, the findings provide evidence of a significant impact of comparison tendencies:
individuals who tend to compare their abilities with others are less satisfied than those who
do not. No significant effect is reported for orientations towards others’ opinions. Our
findings are therefore generally in line with our assumptions. We also find evidence
supporting our modification of the relative income hypothesis (Table 13, column 2). The
8 We favor a more relaxed categorization of comparison orientation “subgroups” (above and below the factor mean of ability and opinion comparisons) against a more restrictive one (at least one std.dev above/below the factor mean) to keep up the sample size. The conservative categorization limits our sample, varying between 170 and 231 cases for each subgroup. However, choosing a more indistinctive categorization offers more analyzable cases, but limits our interpretations towards general tendencies. 9 Following variables are used: gender (man=0; women=1); age (metric); household’s financial situation (perceived financial situation of the household; respondents were asked to place the own household on a scale ranging from 0, poor household, to 10, wealthy household); other households’ financial situation (perceived financial situation of the households in the neighbourhood; respondents were asked to evaluate typical households of their neighbourhoods on a scale ranging from 0, poor household, to 10, wealthy household).
10

results show that relative income (here: the financial situation of other households in the
same neighborhood) only affects personal life satisfaction if individuals care about the
financial situations of others: Only those who report a tendency to compare their abilities
with others are affected by the financial situations of people around them. However,
relative income is of no significance if no such psychological tendencies are reported.
In general, the findings are in line with our assumptions. Alongside their theoretical
implications for research on well-being, calling for revision of the relative income
hypothesis to account for psychological factors, our findings support the distinction
between the two components of social comparison. Social comparison processes are not an
undifferentiated mass of psychological phenomena; to be understood, they have to be split
into their individual components, which serve specific functions. Other people’s income
only matters to those who show a tendency to compare their abilities with others and not to
those who consult others only for general orientation in life.
7 Summary
The aim of the paper was (1) to test the INCOM scale on comparison orientation for the
German population and (2) to propose a shortened version of the questionnaire which
would be easily implementable within large-scale population surveys. We used data of the
2010 SOEP pretest module which offered information on the 11 core items of the
questionnaire for 1,058 randomly chosen respondents in the German population. The
literature on social comparison suggests that social comparison orientations are two-
dimensional: Individuals may compare their abilities and/or opinions with others to assist
in the evaluation of their own accomplishments and/or to gain insights into others’ beliefs
and thereby derive coping strategies for difficult life situations. We tested the two-
dimensional factor structure. Exploratory and confirmatory factor analyses report
acceptable results and approve the measurement instrument as valid and effective.
However, we encountered minor difficulties that were strongly related to the reverse-coded
items. The analysis supported either a three-factor solution with an extra component for
total refusal of social comparisons or a two-factor solution, in which both control items
loaded on the ability component. Based on the theoretical and methodological reasoning,
we support a two-factor solution, which either integrates the second control item (11) into
the ability component or omits it. In a second step and for the purposes of the future
integration of these items into large-scale population surveys, we developed a shortened
version of the questionnaire. The selection of six items followed methodological (shared
11
variance) and theoretical (diversity) reasoning. The short version of the questionnaire
showed excellent model fit and proved valid in a variety of tests.
In this process, we obtained two interesting findings that are worth mentioning in the hope
of spurring further discussion. We found significantly negative correlations between social
desirability and social comparison orientations. Although the correlations are only small,
they are significant. They indicate that respondents with a tendency to give socially
desirable answers are also likely to report a stronger tendency toward social comparison.
This finding seems counterintuitive at first, since one might expect social comparisons to
be a psychological process that runs counter to the predominant values of the twenty-first
century, including self-esteem, individuality, and autonomy. However, at second glance,
social comparisons appear strongly related to the idea of social competition, a highly
prevalent feature of Western capitalist societies. Thus, one might argue that social
comparisons are not (or no longer) a sensitive social issue but rather a practical tool of
everyday life. This is just a hypothetical proposition, requiring further research on the
normative perceptions of social comparisons.
The results point to another striking finding. To gain further evidence on the theoretical
discriminatory power of the two comparison dimensions, we applied the research on well-
being to the study of tendencies toward social comparison. We tested whether tendencies
toward social comparisons affect personal life satisfaction as such and/or its interrelation
with relative income. The results not only affirm the discriminant validity of the two
dimensions, they also call for a revision of the relative income hypothesis. We found
evidence that relative income does not affect life satisfaction in general; significant effects
were only observed for individuals who showed a tendency towards comparisons with
others’ abilities. Testing for the overall impact of social comparison tendencies on life
satisfaction, the results also suggest that individuals who are prone to compare their
abilities with others are less happy than those who show low or no comparison tendencies.
These findings have major implications for the research on individual well-being and call
for in-depth consideration of personal dispositions. This will certainly be a first step in
crossing disciplinary boundaries and will help to increase our understanding of important
social issues.
It will also be crucial for future research to investigate the social and psychological roots of
social comparison tendencies. With regard to the psychological studies suggesting a
genetic disposition towards social comparison, our results point in another direction. We
found significant group effects across age, sex, and educational backgrounds, which point
to socialization effects and structural biases rather than to cognitive dispositions. It will be
12

13
the multidisciplinary task of sociological and psychological research to shed light on these
neglected areas of the social mind.

References
BLAU, P.M. (1964). Exchange and Power in Social Life. New York: Wiley. BUUNK, B. P. (Ed.) (1997). Health, coping, and well-being: Perspectives from social comparison
theory. Mahwah, NJ: Erlbaum. BUUNK, B. P., & MUSSWEILER, T. (2001). New directions in social comparison research. European
Journal of Social Psychology, 31, 467–475. DIENER, E., & FUJITA, F. (1997). Social Comparisons and Subjective Well-Being. In B. P. Buunk
(Ed.), Health, coping, and well-being: Perspectives from social comparison theory (pp. 329–358). Mahwah, NJ: Erlbaum.
EASTERLIN, R. A. (1995). Will raising the incomes of all increase the happiness of all? Journal of Economic Behavior & Organization, 27(35-47).
FESTINGER, L. (1954). A Theory of Social Comparison Processes. Human Relations, 7, 117–140. GIBBONS, F. X., & BUUNK, B. P. (1999). Individual Differences in Social Comparison: Development
of a Scale of Social Comparison Orientation. Journal of Personality and Social Psychology, 76(1), 129–142.
GOETHALS, G.R. (1986). Social Comparison Theory: Psychology from the Lost and Found. Personality and Social Psychology Bulletin, 12, 261–278.
HAISKEN-DENEW, J. P., & FRICK, J. R. (2005). Desktop Companion to the German Socio-Economic Panel Study (SOEP): German Institute for Economic Research Berlin.
HOMANS, G. C. (1961). Social Behavior: its elementary forms. New York: Harcourt, Brace & World. JÄNSCH, A., & SIEGEL, N. (2010): SOEP-Testerhebung 2010 – Methodenbericht. München (mimeo). KAHNEMAN, D., KRUEGER, A., SCHKADE, D., SCHWARZ, N., & STONE, A. (2006). Would You Be
Happier If You Were Richer? A Focusing Illusion. Science, 312, 1908–1910.
KOHLER, U & KREUTER, F. (2009). Data Analysis using STATA, 2nd Edition. Stata Press. KRUGLANSKI, A.W., & MAYSELESS, O. (1990). Classic and Current Social Comparison Research:
Expanding the Perspective. Psychological Bulletin, 108(2), 195–208. MERTON, R. K. (Ed.) (1968). Social Theory and Social Structure. 1968 enlarged edition. New York,
London: The Free Press. MESSNICK, D. M., & SENTIS, K. (1983). Fairness Preference and Fairness Biases. In D. M. C. K. S.
Messnick (Ed.), Equity Theory. Psychological and Sociological Perspectives. (pp. 61–94). New York: Praeger.
MUTHÉN, LK. & MUTHÉN, B.O. (2010): Mplus Users Guide. 6th Edition, Los Angeles. OSKAMP, S., & SCHULTZ, P.W. (2004). Attitudes and Opinions. Third Edition. New York: Erlbaum. PETTIGREW, T.F. (1967). Social Evaluation Theory: Convergences and applications. In D. I. Levine
(Ed.), Nebraska symposium on motivation (pp. 241–311). Lincoln: University of Nebraska Press. SCHNEIDER, S. (2010). The Selection of Pay Referents: Potential Patterns and Impacts on Life
Satisfaction. SOEP Paper, 333, 1–32. SCHNEIDER, S. & SCHUPP, J. (2010). Measuring the Selection of Pay Referents. A Methodological
Analysis of the Questions on Pay Referents in the 2008 and 2009 Pretest Modules. DIW Data Documentation, (48), 1–16.
SULS, J. (Ed.) (1991). Social comparison: Contemporary theory and research. Hillsdale, NJ: Erlbaum.
14

SULS, J., & WHEELER, L. (Eds.) (2000). Handbook of social comparison: Theory and research. The Plenum series in social/clinical psychology. New York, NY u. a.: Kluwer Academic/Plenum Publ.
THIBAUT, J. W., & KELLEY, H. H. (1959). The Social Psychology of Groups. New York: Wiley. WAGNER, G. G., FRICK, J. R., & SCHUPP, J. (2007). The German Socio-Economic Panel Study (SOEP)
- Scope, Evolution and Enhancements. Schmollers Jahrbuch, 127, 139–169. WINKLER, N,, KROH, M. & SPIESS. M. (2006). Entwicklung einer deutschen Kurzskala zur
zweidimensionalen Messung von sozialer Erwünschtheit. DIW-Discussion Paper No. 579
15

Tables
Table 1: The Questionnaire of the Iowa-Netherlands Comparison Orientation Measureproposed by Gibbons and Buunk (1999)
“Most people compare themselves from time to time with others. For example, they may
compare the way they feel, their opinions, their abilities, and/or their situation with those of
other people. There is nothing particularly “good” or “bad” about this type of comparison,
and some people do it more than others. We would like to find out how often you compare
yourself with other people. To do that we would like you to indicate how much you agree with
each statement below, by using the following scale.”
A B C D E
I disagree strongly
I agree strongly
1. I often compare how my loved ones (boy or girlfriend, family members, etc.) are doing with
how others are doing.
2. I always pay a lot of attention to how I do things compared with how others do things.
3. If I want to find out how well I have done something, I compare what I have done with how
others have done.
4. I often compare how I am doing socially (e.g., social skills, popularity) with other people.
5. I am not the type of person who compares often with others. (reversed)
6. I often compare myself with others with respect to what I have accomplished in life.
7. I often like to talk with others about mutual opinions and experiences.
8. I often try to find out what others think who face similar problems as I face.
9. I always like to know what others in a similar situation would do.
10. If I want to learn more about something, I try to find out what others think about it.
11. I never consider my situation in life relative to that of other people. (reversed)
16

Table 2: Summary Statistics of the INCOM Scale. Reports for all 11 items of the INCOM Scale the percentage of agreement for each cell (ranging from 1, strongly disagree, to 5, strongly agree), the missing values, the mean levels, the standard deviation, and the number of observations. Results are based on the SOEP pretest module 2010. Standard weights are applied to adjust for sampling bias.
Components Items 1 2 3 4 5 Miss. Mean Sd. Obs.
1 29.6 22.1 22.4 18.9 7.1 0.9 2.5 1.3 1047
2 26.4 23.6 24.2 17.8 8.1 0.8 2.6 1.3 1048
Ability 3 23.1 20.5 23.9 22.7 9.8 1.2 2.8 1.3 1045
4 31.2 25.6 22.3 15.8 5.1 1.2 2.4 1.2 1046
5 10.6 13.9 20.1 22.9 32.5 1.2 3.5 1.4 1044
6 28.9 25.8 23.9 15.2 6.2 1.1 2.4 1.2 1047
7 2.0 7.1 18.6 36.5 35.8 0.5 4.0 1.0 1052
8 9.3 12.5 23.7 32.2 22.4 0.6 3.5 1.2 1049
Opinion 9 12.3 14.8 28.1 27.3 17.6 0.6 3.2 1.3 1051
10 11.3 11.9 23.8 35.5 17.5 0.8 3.4 1.2 1048
11 10.1 19.5 25.5 21.0 23.9 0.9 3.3 1.3 1047
17
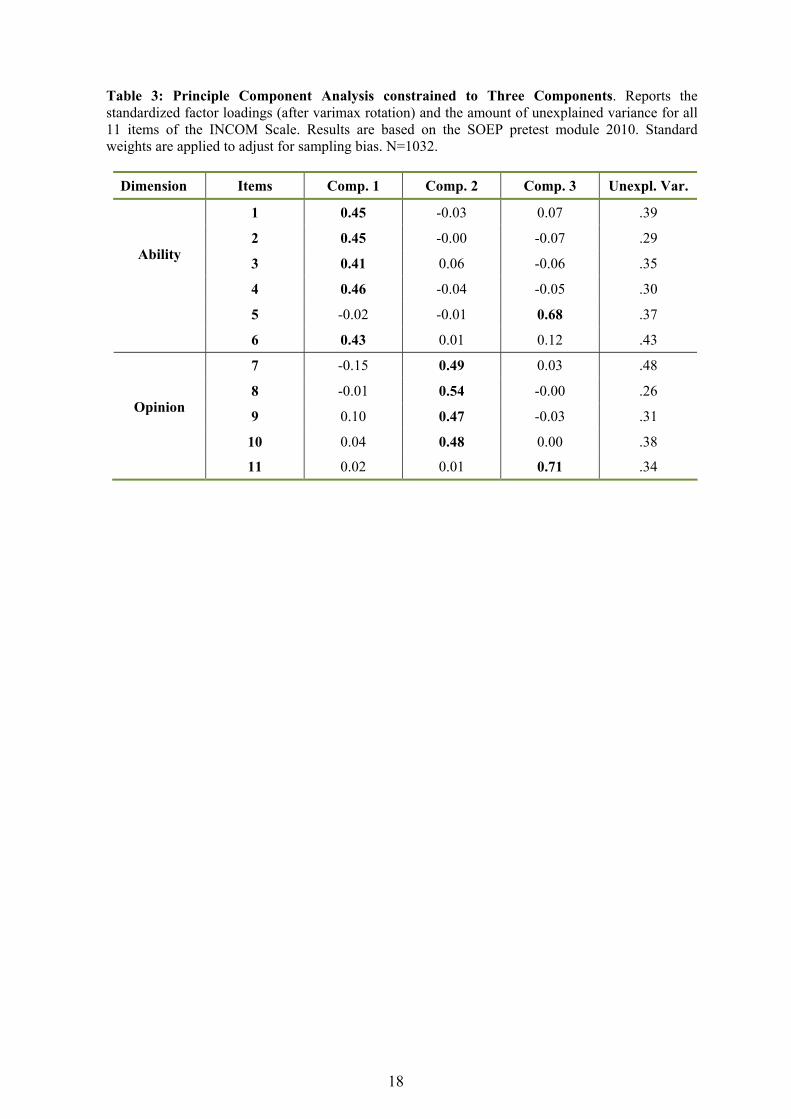
Table 3: Principle Component Analysis constrained to Three Components. Reports the standardized factor loadings (after varimax rotation) and the amount of unexplained variance for all 11 items of the INCOM Scale. Results are based on the SOEP pretest module 2010. Standard weights are applied to adjust for sampling bias. N=1032.
Dimension Items Comp. 1 Comp. 2 Comp. 3 Unexpl. Var.
1 0.45 -0.03 0.07 .39
2 0.45 -0.00 -0.07 .29
3 0.41 0.06 -0.06 .35
4 0.46 -0.04 -0.05 .30
5 -0.02 -0.01 0.68 .37
Ability
6 0.43 0.01 0.12 .43
7 -0.15 0.49 0.03 .48
8 -0.01 0.54 -0.00 .26
9 0.10 0.47 -0.03 .31
Opinion
10 0.04 0.48 0.00 .38
11 0.02 0.01 0.71 .34
18

Table 4: Maximum Likelihood Exploratory Factor Analysis Constrained to Two Factors. Reports the standardized factor loadings (after varimax rotation) and the amount of unexplained variance for all 11 items of the INCOM Scale. Results are based on the SOEP pretest module 2010. Standard weights are applied to adjust for sampling bias. N=1032.
Dimension Items Factor 1 Factor 2 Uniqueness
1 0.67 0.15 0.53
2 0.80 0.18 0.33
3 0.74 0.24 0.40
4 0.78 0.14 0.37
5 -0.35 -0.09 0.87
Ability
6 0.60 0.20 0.59
7 -0.06 0.52 0.72
8 0.16 0.83 0.29
9 0.30 0.74 0.37
10 0.22 0.66 0.52
Opinion
11 -0.31 -0.11 0.89
Log likelihood (2 factors): - 90.45; LR-Test independent vs. saturated χ2(55)
= 4155.34; px2= 0.0000; 2 factors vs. saturated: χ2
(34) = 179.88; px2=
0.0000; BIC: 2 factors: 326.63; 3 factors: 328.54; 4 factors: 327.55.
19
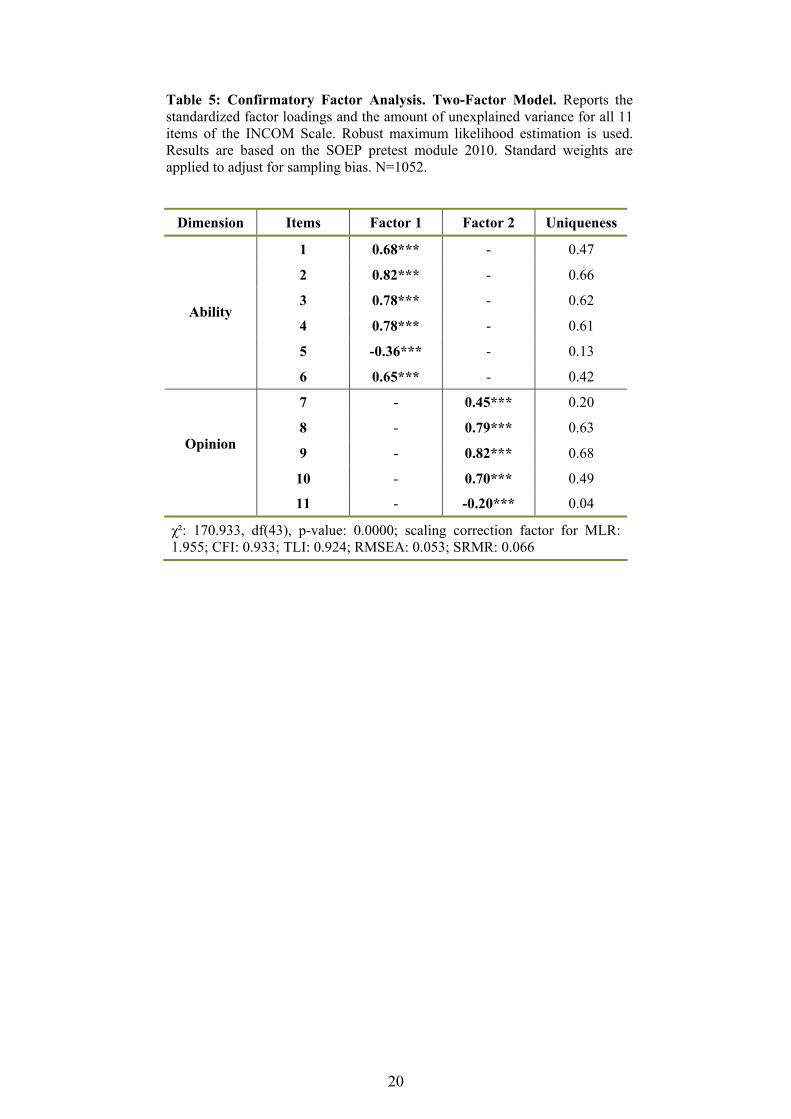
Table 5: Confirmatory Factor Analysis. Two-Factor Model. Reports the standardized factor loadings and the amount of unexplained variance for all 11 items of the INCOM Scale. Robust maximum likelihood estimation is used. Results are based on the SOEP pretest module 2010. Standard weights are applied to adjust for sampling bias. N=1052.
Dimension Items Factor 1 Factor 2 Uniqueness
1 0.68*** - 0.47
2 0.82*** - 0.66
3 0.78*** - 0.62
4 0.78*** - 0.61
5 -0.36*** - 0.13
Ability
6 0.65*** - 0.42
7 - 0.45*** 0.20
8 - 0.79*** 0.63
9 - 0.82*** 0.68
Opinion
10 - 0.70*** 0.49
11 - -0.20*** 0.04
χ²: 170.933, df(43), p-value: 0.0000; scaling correction factor for MLR: 1.955; CFI: 0.933; TLI: 0.924; RMSEA: 0.053; SRMR: 0.066
20
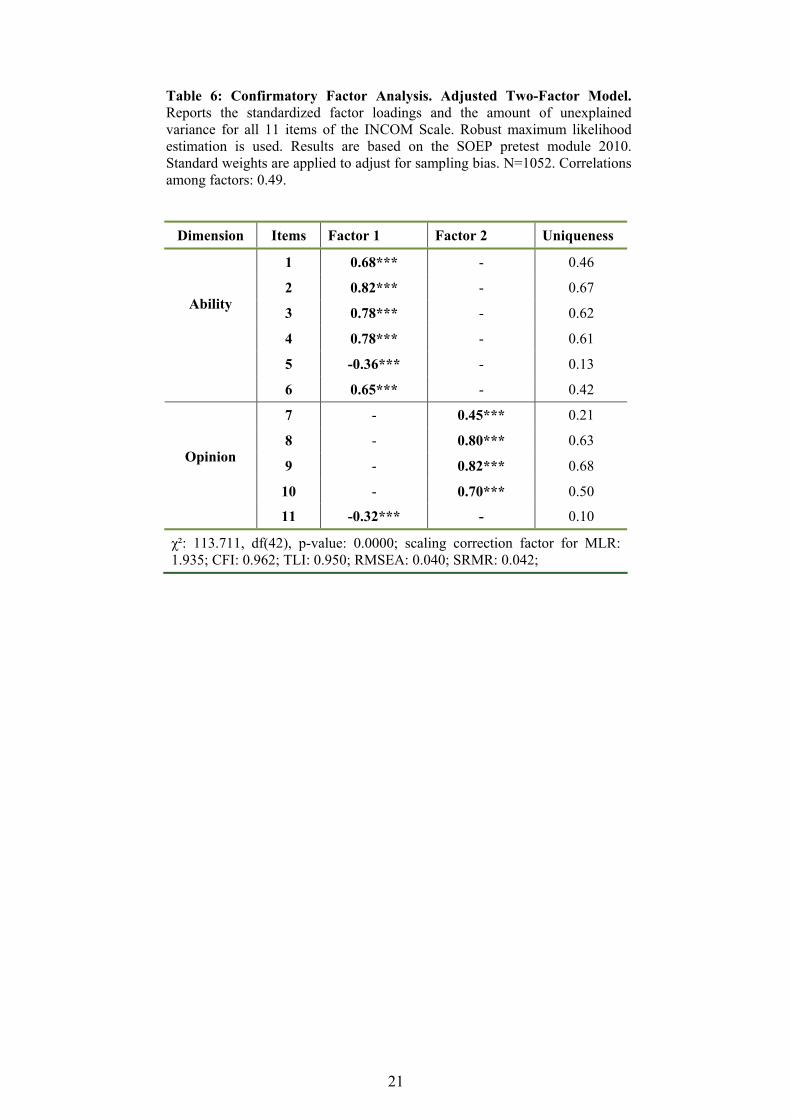
Table 6: Confirmatory Factor Analysis. Adjusted Two-Factor Model. Reports the standardized factor loadings and the amount of unexplained variance for all 11 items of the INCOM Scale. Robust maximum likelihood estimation is used. Results are based on the SOEP pretest module 2010. Standard weights are applied to adjust for sampling bias. N=1052. Correlations among factors: 0.49.
Dimension Items Factor 1 Factor 2 Uniqueness
1 0.68*** - 0.46
2 0.82*** - 0.67
3 0.78*** - 0.62
4 0.78*** - 0.61
5 -0.36*** - 0.13
Ability
6 0.65*** - 0.42
7 - 0.45*** 0.21
8 - 0.80*** 0.63
9 - 0.82*** 0.68
Opinion
10 - 0.70*** 0.50
11 -0.32*** - 0.10
χ²: 113.711, df(42), p-value: 0.0000; scaling correction factor for MLR: 1.935; CFI: 0.962; TLI: 0.950; RMSEA: 0.040; SRMR: 0.042;
21

Table 7: Confirmatory Factor Analysis. Three-Factor Model. Reports the standardized factor loadings and the amount of unexplained variance for all 11 items of the INCOM Scale. Robust maximum likelihood estimation is used. Results are based on the SOEP pretest module 2010. Standard weights are applied to adjust for sampling bias. N=1052. Correlations among factors: fac1/fac2: 0.48; fac1/fac3: -0.61; fac2/fac3: -0.3.
Dimension Items Factor 1 Factor 2 Factor 3 Uniqueness
1 0.68*** - - 0.46
2 0.82*** - - 0.67
3 0.78*** - - 0.62
4 0.78*** - - 0.61
Ability
6 0.65*** - - 0.34
7 - 0.43*** - 0.42
8 - 0.80*** - 0.21
9 - 0.82*** - 0.63
Opinion
10 - 0.70*** - 0.68
5 - - 0.52*** 0.50 Refusal
11 - - 0.58*** 0.27
χ²: 113.541, df(42), p-value: 0.0000; scaling correction factor for MLR: 1.9330; CFI: 0.962; TLI: 0.949; RMSEA: 0.041; SRMR: 0.042
22

Table 8: Shortened INCOM Scale. Confirmatory Factor Analysis. Reports the standardized factor loadings and the amount of unexplained variance for 6 items of the INCOM Scale. Robust maximum likelihood estimation is used. Results are based on the SOEP pretest module 2010. Standard weights are applied to adjust for sampling bias. N=1051. Correlations among factors: 0.50.
Dimension Items Factor 1 Factor 2 R²
2 0.80*** - 0.64
4 0.76*** - 0.58
Ability
5 -0.38*** - 0.15
8 - 0.76*** 0.58
9 - 0.85*** 0.73
Opinion
10 - 0.70*** 0.49
χ²: 9.857; df(8); p-value: 0.2752; scaling correction factor for MLR: 2.040; CFI: 0.998; TLI: 0.996; RMSEA: 0.015; SRMR: 0.019
Table 9: Shortened INCOM Scale. Principle Component Analysis constrained to Two Components. Reports the standardized factor loadings (after varimax rotation) and the amount of unexplained variance for 6 items of the INCOM Scale. Results are based on the SOEP pretest module 2010. Standard weights are applied to adjust for sampling bias. N=1037.
Dimension Items Factor 1 Factor 2 Unexplained
2 0.05 0.59 0.30
4 0.02 0.61 0.30
Ability
5 0.10 -0.52 0.55
8 0.61 -0.06 0.24
9 0.55 0.08 0.24
Opinion
10 0.56 0.00 0.32
23

Table 10: Shortened INCOM Scale. Maximum Likelihood Exploratory Factor Analysis. Reports the standardized factor loadings (after varimax rotation) and the amount of unexplained variance for 6 items of the INCOM Scale. Results are based on the SOEP pretest module 2010. Standard weights are applied to adjust for sampling bias. N=1037.
Dimension Items Factor 1 Factor 2 Uniqueness
2 0.22 0.76 0.37
4 0.19 0.75 0.40
Ability
5 -0.10 -0.37 0.85
8 0.80 0.10 0.35
9 0.79 0.26 0.31
Opinion
10 0.67 0.19 0.51
Log likelihood (2 factors): - 1.51; LR-Test independent vs. saturated χ2(15) =
1907.13; px2= 0.0000; 2 factors vs. saturated: χ2
(4) = 3.01; px2= 0.5564; BIC:
2 factors: 79.41;
24
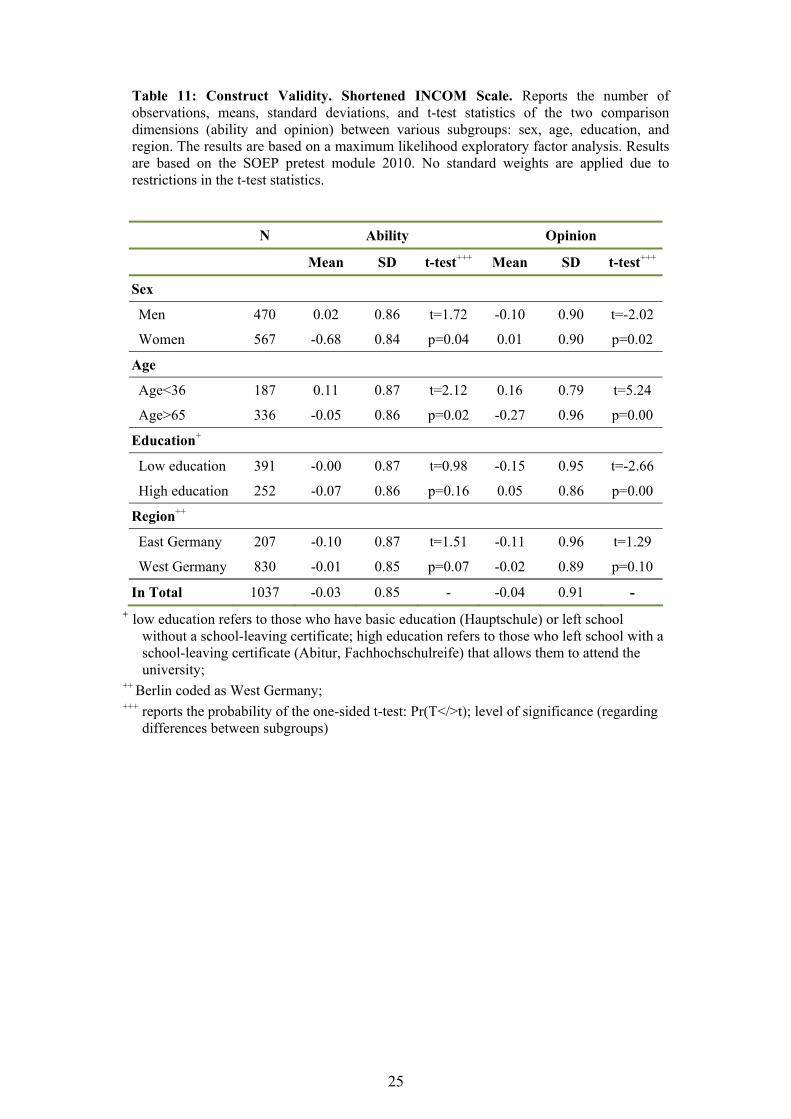
Table 11: Construct Validity. Shortened INCOM Scale. Reports the number of observations, means, standard deviations, and t-test statistics of the two comparison dimensions (ability and opinion) between various subgroups: sex, age, education, and region. The results are based on a maximum likelihood exploratory factor analysis. Results are based on the SOEP pretest module 2010. No standard weights are applied due to restrictions in the t-test statistics.
N Ability Opinion
Mean SD t-test+++ Mean SD t-test+++
Sex
Men 470 0.02 0.86 t=1.72 -0.10 0.90 t=-2.02
Women 567 -0.68 0.84 p=0.04 0.01 0.90 p=0.02
Age
Age<36 187 0.11 0.87 t=2.12 0.16 0.79 t=5.24
Age>65 336 -0.05 0.86 p=0.02 -0.27 0.96 p=0.00
Education+
Low education 391 -0.00 0.87 t=0.98 -0.15 0.95 t=-2.66
High education 252 -0.07 0.86 p=0.16 0.05 0.86 p=0.00
Region++
East Germany 207 -0.10 0.87 t=1.51 -0.11 0.96 t=1.29
West Germany 830 -0.01 0.85 p=0.07 -0.02 0.89 p=0.10
In Total 1037 -0.03 0.85 - -0.04 0.91 - + low education refers to those who have basic education (Hauptschule) or left school
without a school-leaving certificate; high education refers to those who left school with a school-leaving certificate (Abitur, Fachhochschulreife) that allows them to attend the university;
++ Berlin coded as West Germany;
+++ reports the probability of the one-sided t-test: Pr(T</>t); level of significance (regarding differences between subgroups)
25

Table 12: Discriminant Validity. Correlations of the INCOME Scale with other Scales.Reports the pairwise correlation coefficients. Results are based on the SOEP pretest module 2010. Standard weights are applied to adjust for sampling bias.
Comparisons towards: Ability Opinion
Life Satisfaction (10-point scale) -.08* .01 Domain Satisfaction (10-point scale)
- Satisfaction with Health -.00 .10* - Satisfaction with Work -.09* -.02 - Satisfaction with Household Income -.00 .02* - Satisfaction with Leisure Time -.13* -.02
Life Evaluation1 (factor score) -.06* .00 Affection (yesterday)2 (factor score) .08* -.01 Affection (past 4 weeks)3 (factor score) .08* .20* Openness4 (factor score) .13* -.03* Job Concern/Emotional Burden5 (factor score) .21* .02 Just Income Evaluation (10-point scale) -.03 -.04* Age -.08* -.19* Standard of Living -.09* .02* Relative Standard of Living in Neighborhood -.02 .01 Self-rated Importance of Direct Comparisons (7-point scale) (see Schneider & Schupp 2010)
- Neighbors .38* .10* - Friends .32* .08* - Colleagues .15* .11* - Same Profession .10* .11* - Same Age .23* .17* - Parents .28* .10* - Partner .49* .10* - Other Women .31* .10* - Other Men .28* .18*
1 Factor score of the maximum-likelihood exploratory factor analysis on the agreement to five statements on the general evaluation of life rated on a seven-point scale (question 94 of the pretest questionnaire). 2 Factor score of the maximum-likelihood exploratory factor analysis on the frequency of experienced emotions (anger, fear, happiness, sadness) during the previous day rated on a five-point scale (question 2 of the pretest questionnaire). 3 Factor score of the maximum-likelihood exploratory factor analysis on the frequency of experienced emotions (anger, fear, happiness, sadness, shame, envy, having done something wrong) during the past four weeks rated on a five-point scale (question 109 of the pretest questionnaire). 4 Factor score of the maximum-likelihood exploratory factor analysis on the agreement to seven items on the openness towards new experiences rated on a seven-point scale (question 109 of the pretest questionnaire, item 3 was excluded). 5 Factor score of the maximum-likelihood exploratory factor analysis on the agreement to six items on job concern/personal involvement rated on a four-point scale (question 75 of the pretest questionnaire).
26

Table 13: Linear Regressions for Life Satisfaction (OLS). Reports coefficients, level of significance (***p<0.001, **p<0.01, *p<0.05), robust t-statistics (in parenthesis), share of explained variance (R2), and number of observations (N) for (a) the general population (pooled sample) and (b) different subgroups differentiating between individuals above (+) and below (-) the factor mean of comparisons of abilities and opinions. Standard controls included are age and gender. Results based on the SOEP pretest modules 2010. Standard weights are applied to adjust for sampling bias.
LIFE SATISFACTION Pooled Sample Ability Opinion
+ - + -
Financial Situation 0.43*** 0.35*** 0.35*** 0.31*** 0.40*** 0.32*** 0.38***
-Household (10.72) (6.99) (7.05) (4.44) (5.75) (4.98) (4.92)
Financial Situation 0.15* 0.14* 0.22* 0.05 0.13 0.18
-Neighborhood (2.48) (2.30) (2.49) (0.64) (1.68) (1.87)
Comparisons: -0.15*
Ability (2.07)
Comparisons: 0.02
Opinion (0.23)
Constant 5.04*** 4.69*** 4.75*** 4.07*** 5.41*** 4.91*** 4.42***
(16.60) (13.77) (13.84) (7.67) (12.59) (11.34) (7.87)
N 0.16 0.17 0.17 0.15 0.21 0.14 0.20
R² 1014 1014 1014 492 522 539 475
27
Figures
Figure 1: Eigenvalues of Principle Component Analysis. Based on all 11 items of the INCOM Scale. Results are based on the SOEP pretest module 2010. Standard weights are applied to adjust for sampling bias. N=1032.
01
23
4E
igen
valu
es
0 5 10Number
Scree plot of eigenvalues after pca
28

Figure 2: Eigenvalues of Maximum Likelihood Exploratory Factor Analysis. Based on all 11 Items of the INCOM Scale. Results are based on the SOEP pretest module 2010. Standard weights are applied to adjust for sampling bias. N=1032.
01
23
Eig
enva
lues
0 5 10Number
Scree plot of eigenvalues after factor
29

Figure 3: Model of Confirmatory Factor Analysis.
30

31
Appendix
Table A1: The Questionnaire of the Iowa-Netherlands Comparison Orientation Measure proposed by Gibbons and Buunk (1999) – German Version
„Die meisten Menschen vergleichen sich ab und an mit anderen. Zum Beispiel vergleichen sie wie sie sich fühlen, ihre Meinungen, Fähigkeiten und/oder ihre Situation mit der anderer Menschen. Es gibt nichts was besonders „gut“ oder „schlecht“ wäre an dieser Art von Vergleichen und einige Menschen tun dies öfter als andere. Wir möchten nun herausfinden, wie oft Sie sich mit anderen Menschen vergleichen. Um dies zu erfahren, möchten wir Sie bitten uns mitzuteilen wie sehr Sie den folgenden Aussagen zustimmen.“
Bitte antworten Sie anhand der folgenden Skala: Der Wert 1 bedeutet: stimme überhaupt nicht zu. Der Wert 5 bedeutet: stimme voll and ganz zu. Mit den Werten zwischen 1 und 5 können Sie Ihre Meinung abstufen.
1 2 3 4 5
Ich stimme überhaupt
nicht zu
Ich stimme voll und ganz zu
1. Ich vergleiche häufig das Wohlergehen meiner Angehörigen (Partner, Familienangehörige, etc.) mit dem von anderen.
2. Ich achte immer sehr stark darauf, wie ich Dinge im Vergleich zu anderen mache.
3. Wenn ich herausfinden möchte, wie gut ich etwas erledigt oder gemacht habe, dann vergleiche ich mein Ergebnis mit dem anderer Personen.
4. Ich vergleiche häufig meine sozialen Fähigkeiten und meine Beliebtheit mit denen anderer Personen.
5. Ich bin nicht der Typ Mensch, der sich oft mit anderen vergleicht.
6. Ich vergleiche mich häufig selbst mit anderen in Bezug auf das, was ich im Leben (bislang) erreicht habe.
7. Ich tausche mich gerne häufig mit anderen über Meinungen und Erfahrungen aus.
8. Ich versuche häufig herauszufinden, was andere denken, die mit ähnlichen Problemen konfrontiert sind wie ich.
9. Ich möchte immer gerne wissen wie sich andere in einer ähnlichen Situation verhalten würden.
10. Wenn ich über etwas mehr erfahren möchte, versuche ich herauszufinden was andere darüber denken oder wissen.
11. Ich bewerte meine Lebenssituation niemals im Vergleich zu der anderer Personen.