the combination of text classiers using reliability indicatorserichorvitz.com/tclass_combine.pdf ·...
TRANSCRIPT
The Combination of Text Classifiers Using Reliability Indicators∗
Paul N. BennettComputer Science Dept.
Carnegie Mellon UniversityPittsburgh, PA 15213
Susan T. DumaisMicrosoft ResearchOne Microsoft Way
Redmond, WA [email protected]
Eric HorvitzMicrosoft ResearchOne Microsoft Way
Redmond, WA [email protected]
Abstract
The intuition that different text classifiers behave in qualitatively different ways has long motivated attempts to
build a better metaclassifier via some combination of classifiers. We introduce a probabilistic method for combining
classifiers that considers the context-sensitive reliabilities of contributing classifiers. The method harnesses reliability
indicators—variables that provide signals about the performance of classifiers in different situations. We provide
background, present procedures for building metaclassifiers that take into consideration both reliability indicators and
classifier outputs, and review a set of comparative studies undertaken to evaluate the methodology.
Keywords: Text classification, classifier combination, metaclassifiers, feature selection, reliability indicators
1 Introduction
Researchers have long pursued the promise of harnessing multiple text classifiers to synthesize a more accurate classi-fication procedure via some combination of the outputs of the contributing classifiers. Studies of classifier combinationhave been motivated primarily by the intuition that overlaying classifiers, that work in related but qualitatively differentways, could leverage the distinct strengths of each method.
Classifiers can be combined in a variety of ways. In one approach, a text classifier is composed from multipledistinct classifiers by selecting the best classifier to use in different situations or contexts. For example, we mayperform analytical or empirical studies to identify the most accurate text classifier in some setting, seeking to learnabout accuracy over output scores or some combination of output scores and features considered in the analysis.Other procedures for combining classifiers consider inputs generated by the contributing classifiers. For example, ina voting analysis, a combination function considers the final decisions made by each classifier as votes that influencean overall decision about the best classification. In a finer-grained approach to combining multiple classifiers, thescores generated by the contributing classifiers are taken as inputs to the combination function. Whichever approachto combination employed, the creation of enhanced metaclassifiers from a set of text classifiers relies on developingan understanding of how different classifiers perform in different informational contexts.∗This paper revises and extends material originally presented by Bennett et al. (2002).
1

We have pursued the development of probabilistic combination procedures that hinge on learning and harnessingthe context-sensitive reliabilities of different classifiers. Rather than rely solely on output scores or on the set ofdomain-level features employed in text-classification, we introduce the use of reliability-indicator variables—a setof features that provide a low-dimensional abstraction on the discriminatory context for learning about reliability.We borrow the reliability-indicator methodology from work presented initially by Toyama and Horvitz (2000) in thecontext of automated vision. They introduced the reliability-indicator learning and inference framework and showedhow the approach could be applied in vision to integrate several distinct scene analyses into an overall higher-accuracycomposite visual analysis. We have found that the reliability-indicator methodology is useful in text classification forproviding context-sensitive signals about accuracy that can be used to weave together multiple classifiers in a coherentprobabilistic manner to boost overall accuracy.
We will first review related work on the combination of text-classification procedures. Then, we introduce theuse of reliability indicators in text classification, and show how we can employ these variables to learn about thecontext-sensitive reliabilities of naıve Bayes, unigram, support vector machine (SVM), and decision-tree classifiers.We describe how we integrate the indicator variables with base-level features and scores output by classifiers to buildmetaclassifiers that improve text classification performance. We highlight our methodology and results by reviewingseveral sets of experiments. Finally, we summarize our contributions and discuss future directions.
2 Related Work
Appropriately combining information sources to form a more effective output than any of the individual sources isa problem that has been investigated in many fields. The challenges of integrating information have gone underthe labels of diagnosis (Horvitz et al., 1988), pattern recognition (Duda et al., 2001), sensor fusion (Klein, 1999),distributed data mining (Kargupta & Chan, 2000), and a variety of ensemble methods (Dietterich, 2000). Diagnosiscenters on identifying disorders from multiple pieces of evidence, such as reasoning about probability distributionsover a patient’s diseases from a set of symptoms and test results. Pattern recognition and sensor fusion typicallyaddress challenges with integrating information from multiple modalities (e.g., auditory and visual) while distributeddata mining addresses how results retrieved from distinct training data sets can be unified to provide one coherentview to the user. Ensemble methods first solve a classification or regression problem by creating multiple learnersthat each attempt to solve the task independently, then use the procedure specified by the particular ensemble methodfor selecting or weighting the individual learners. Ensemble methods include such techniques as Bayesian averaging,bagging, boosting, stacking, cascade generalization, hierarchical mixture of experts, and the work presented in thispaper.
Text classification addresses the task of labeling a text document with one or more labels from a set of predefinedcontent-based categories. These categories may be primary document topics (e.g., Health & Fitness, Business &Finance, etc.), hierarchical indices of technical content (e.g., medical hierarchies [Hersh et al., 1994]), genres (e.g.,legal, fiction, etc. [Kessler et al., 1997]), or a variety of other distinctions (e.g., normal e-mail vs. junk e-mail, asused by [Sahami et al., 1998], or urgent e-mail vs. non-urgent e-mail, as explored by [Horvitz et al., 1999]). Textclassification methods can thus provide a backend for many information retrieval tasks, e.g., routing, tagging andfiltering. The interested reader should see Sebastiani (2002) for a broad survey of recent applications of machinelearning to text classification.
The overlaying of multiple methodologies or representations has been employed in several areas of informationretrieval. For example, previous research in information retrieval has demonstrated that retrieval effectiveness can beimproved by using multiple, distinct representations (Bartell et al., 1994; Katzer et al., 1982; Rajashekar & Croft,
2

1995), or by using multiple queries or search strategies (Belkin et al., 1993; Shaw & Fox, 1995). In the realm oftext classification, several researchers have achieved improvements in classification accuracy by combining differentclassifiers (Al-Kofahi et al., 2001; Hull et al., 1996; Larkey & Croft, 1996; Li & Jain, 1998; Yang et al., 2000).Similarly, several investigators have enhanced classification performance by applying many instances of the sameclassifier, such as boosting procedures (Schapire & Singer, 2000; Weiss et al., 1999).
Much of the previous work on combining text classifiers has centered on the use of basic policies for selecting thebest classifier or for combining the output of multiple classifiers. As some examples, Larkey and Croft (1996) usedweighted linear combinations of system ranks or scores; Hull et al. (1996) used linear combinations of probabilitiesor log odds scores; Yang et al. (2000) used a linear combination of normalized scores; Li and Jain (1998) used votingand classifier selection techniques; and Lam and Lai (2001) used category-averaged features to pick a (potentiallydifferent) classifier to use for each category.
Larkey and Croft (1996) used rank-based measures of performance because they were interested in interactivesystems in which a rank list of codes for each document would be displayed to users. Many other applications suchas automatic routing or tagging require that binary class membership decisions be made for each document as it isprocessed. We focus on classifier combination to enhance such classification decisions. This goal is more challengingthan the use of classifiers for document ranking. As an example, Hull et al. (1996) found that, although combinationtechniques were able to improve document ranking, they did considerably less well at estimating probabilities requiredfor online classification decisions.
As we shall highlight below, in contrast to prior research on classifier combination, our work centers on the useof a richer probabilistic combination of inputs, using combination functions learned with Bayesian and SVM learningmethods. In this respect, our approach is similar to work by Ting and Witten (1999) in stacked generalization andGama (1998a; 1998b) in cascade generalization, although they did not apply their approach to text problems. We alsoreport baseline comparisons with voting and classifier-selection techniques.
3 Problem Approach
Our work is distinguished from earlier combination approaches for text classification by (1) the use of expressiveprobabilistic dependency models to combine lower-level classifiers, leveraging special signaling variables, referredto as reliability indicators, and (2) a focus on measures of classification performance rather than the more commonconsideration of ranking.
3.1 Reliability Indicators
Previous approaches to classifier combination have typically limited the information considered at the metalevel tothe output of the classifiers (Ting & Witten, 1999) and/or the original feature space (Gama, 1998a). Since a classifierrarely is the best choice across a whole domain, an intuitive alternative is to identify the document-specific contextthat differentiates between regions where a base classifier has higher or lower reliability.
Figure 1 shows an example using four base classifiers: decision tree, SVM, naıve Bayes, and unigram. When givena test document as input, each of the four base classifiers outputs a probability distribution over possible class labels(depicted graphically as a histogram in the figure). The metaclassifier uses this information along with documentcontext (to be described in more detail) to produce a final classification of the document.
We address the challenge of learning about the reliability of different classifiers in different neighborhoods ofthe classification domain by introducing variables referred to as reliability indicators which represent the analytic
3

����
Metaclassifier
Document−SpecificContext
SVM
����
����
����
Decision Tree
Naive Bayes
Unigram
PSfrag replacements
w1
w2
w3
wn
· · ·r1
r2
r3
rn
Figure 1: Schematic characterization of reliability-indicator methodology. The methodology formalizes the intuitionshown here that document-specific context can be used to improve the performance of a set of base classifiers. Theoutput of the classifiers is a graphical representation of a distribution over possible class labels.
“context” of a specific document. A reliability indicator is an evidential distinction with states that are linked proba-bilistically to regions of a classification problem where a classifier performs relatively strongly or poorly.
The reliability-indicator methodology was introduced by Toyama and Horvitz (2000) and applied initially to thetask of combining, in a probabilistically coherent manner, several distinct machine-vision analyses in a system fortracking the head and pose of computer users. The researchers found that different visual processing modalities haddistinct context-sensitive reliabilities that depended on dynamically changing details of lighting, color, and the overallconfiguration of the visual scene. The authors introduced reliability indicators to capture properties of the visionanalyses, and of the scenes being analyzed, that provided probabilistic indications of the reliability of the output ofeach of the modalities. To learn probabilistic models for combining the multiple modalities, data was collected aboutground truth, the observed states of indicator variables, and the outputs from the concurrent vision analyses. The datawas used to construct a Bayesian network model with the ability to appropriately integrate the outputs from each ofthe visual modalities in real time, providing an overall higher-accuracy composite visual analysis.
The value of the indicator-variable methodology in machine vision stimulated us to explore the approach for rep-resenting and learning about reliability-dependent contexts in text classification problems. For the task of combiningclassifiers, we formulate and include sets of variables that hold promise as being related to the performance of theunderlying classifiers. We consider the states of reliability indicators and the scores of classifiers directly, and, thus,bypass the need to make ad hoc modifications to the base classifiers. This allows the metaclassifier to harness thereliability variables if they contain useful discriminatory information, and, if they do not, to fall back in a gracefulmanner to using the output of the base classifiers.
As an example, consider three types of documents where: (1) the words in the document are either uninformative orstrongly associated with one class; (2) the words in the document are weakly associated with several disjoint classes; or(3) the words in the document are strongly associated with several disjoint classes. Classifiers (e.g., a unigram model)will sometimes demonstrate different patterns of error on these different document types. If we can characterize adocument as belonging to one of these model-specific failure types, then we can assign the appropriate weight to theclassifier’s output for this kind of document. We have pursued the formulation of reliability indicators that capturedifferent association patterns among words in documents and the structure of classes under consideration. We seekindicator variables that would allow us to learn context-sensitive reliabilities of classifiers, conditioned on the observed
4
Not < 0.0551 (205)
Not < 0.113 (427) < 0.0551 (222) Not < −0.61 (203)
< −0.61 (19)
< 1(167)
< 0.113 (187)
Not < 1 (36)
OutputOfUnigram
OutputOfSmox
UnigramVariance
%FavoringInClassAfterFS
PSfrag replacements
w1
w2
w3
wn
· · ·r1
r2
r3
rn
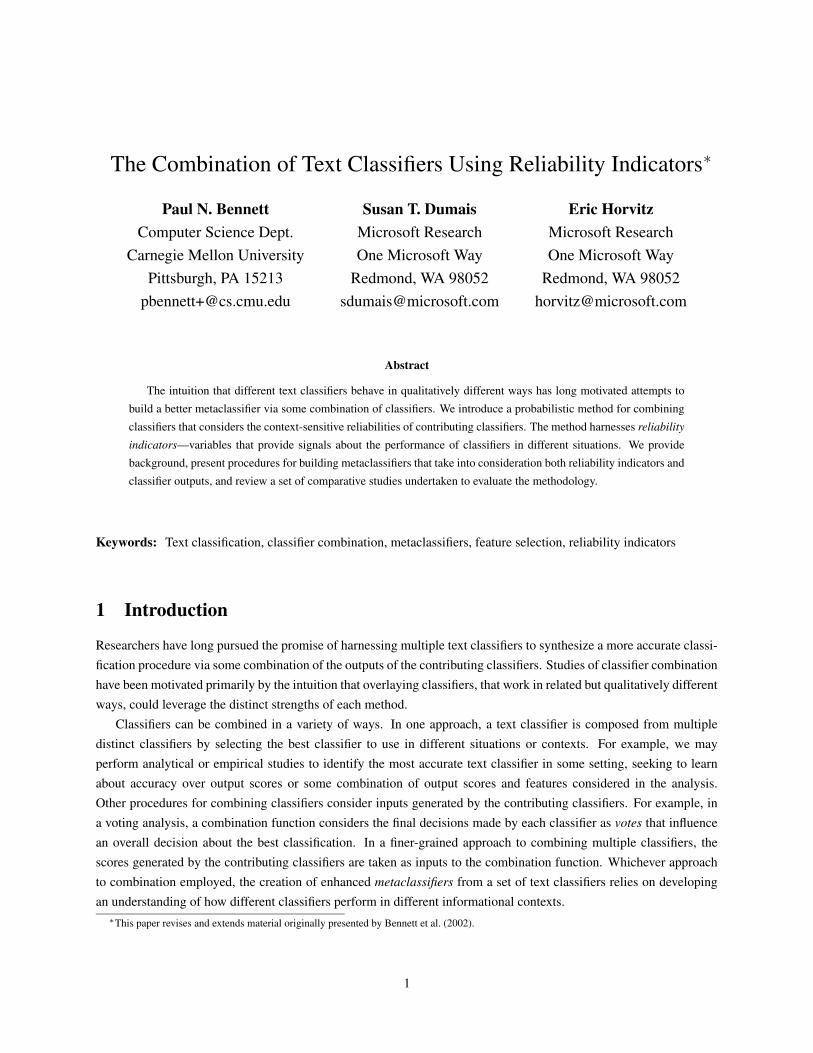
Figure 2: Portion of decision tree, learned by STRIVE-D (norm) for the Business & Finance class in the MSN WebDirectory corpus, representing a combination policy at the metalevel that considers scores output by classifiers (darknodes) and values of indicator variables (lighter nodes).
states of the variable in different settings.To highlight the approach with a concrete example, Figure 2 shows a portion of the type of combination func-
tion we can capture with the reliability-indicator methodology. The nodes on different branches of a decision treeinclude the values output by base classifiers, as well as the values of reliability indicators for the document beingclassified. The decision tree provides a probabilistic, context-sensitive combination rule indicated by the particularrelevant branching of values of classifier scores and indicator variables. In this case, the portion of the tree displayedshows a classifier-combination function that considers thresholds on scores provided by a base-level linear SVM (Out-putOfSmox) classifier and a base-level unigram classifier (OutputOfUnigram), and then uses the context establishedby reliability-indicator variables (UnigramVariance and %FavoringInClassAfterFS) to make a final decision about aclassification. The annotations in the figure show the threshold tests that are being performed, the number of examplesin the training set that satisfy the test, and a graphical representation of the probability distribution at the leaves. Thelikelihood of class membership is indicated by the length of the bars at the leaves of the tree.
The variable UnigramVariance represents the variance of unigram weights for words present in the current doc-ument. The intuition behind the formulation of this reliability-indicator variable is that the unigram classifier wouldshow a tendency toward higher accuracies when there is low variance in weights. The variable %FavoringInClass-AfterFS is the percentage of words (after feature selection) that occur more often in documents within a target classthan in other classes. Classifiers that weight positive and negative evidence differently should be distinguished by thisvariable. Appendix A gives further details about the reliability indicators used in these experiments.
The indicator variables used in our studies represent an attempt to formulate states that capture influential contexts.We constructed variables to represent a variety of contexts that held promise as being predictive of accuracy. These in-clude such variables as the number of features present in a document before and after feature selection, the distributionof features across the positive vs. negative classes, and the mean and variance of classifier-specific weights.
We can broadly group reliability-indicator variables into one of four types, including variables that measure (1) theamount of information present in the original document, (2) the information loss or mismatch between the representa-tion used by a classifier and the original document, (3) the sensitivity of the decision to evidence shift, and (4) somebasic voting statistics.
DocumentLength is an example of a reliability-indicator variable of type 1. The performance of classifiers issometimes correlated with document length, because longer documents give more information to use in making a
5

classification. DocumentLength can also be informative because some classifiers will perform poorly over longerdocuments as they do not model the influence of document length on classification performance (e.g., they doublecount evidence and longer documents are more likely to deviate from a correct determination).
PercentRemoved serves as an example of type 2. This variable represents the percent of features removed in theprocess of feature selection. If most of the document was not represented by the feature set employed by a classifier,then some classifiers may be unreliable. Others classifiers (e.g., decision trees that model missing attributes) maycontinue to be reliable. When the base classifiers are allowed to use different representations, type 2 features can playan even more important role.
An example of type 3 is the UnigramVariance variable. Low variance means the decision of the classifier isunlikely to change with a small change in the document content; high variance increases the chances that the decisionwould change with only a small change in the document.
Finally, NumVotingForClass or PercentAgreement are examples of type 4 reliability indicators. These simplevoting statistics improve the metaclassifier search space (since the metaclassifier is given the base classifier decisions asinput as well). For a two-class case the PercentAgreement variable may provide little extra information but for greaternumber of classes it can be used to determine if the base classifiers have fractured their votes among a small numberof classes or across a wide array. We found all four types of reliability indicators to be useful in the final combinationscheme, and preliminary analyses did not indicate that any one type dominates in the combination models.
Beyond the key difference in the semantics of their usage, reliability-indicator variables differ qualitatively fromvariables representing the output of classifiers in several ways. For one, we do not assume that the reliability indicatorshave some threshold point that classifies the examples better than random. We also do not assume that classificationconfidence shows monotonicity trends as in classifiers.
3.2 STRIVE: Metaclassifier with Reliability Indicators
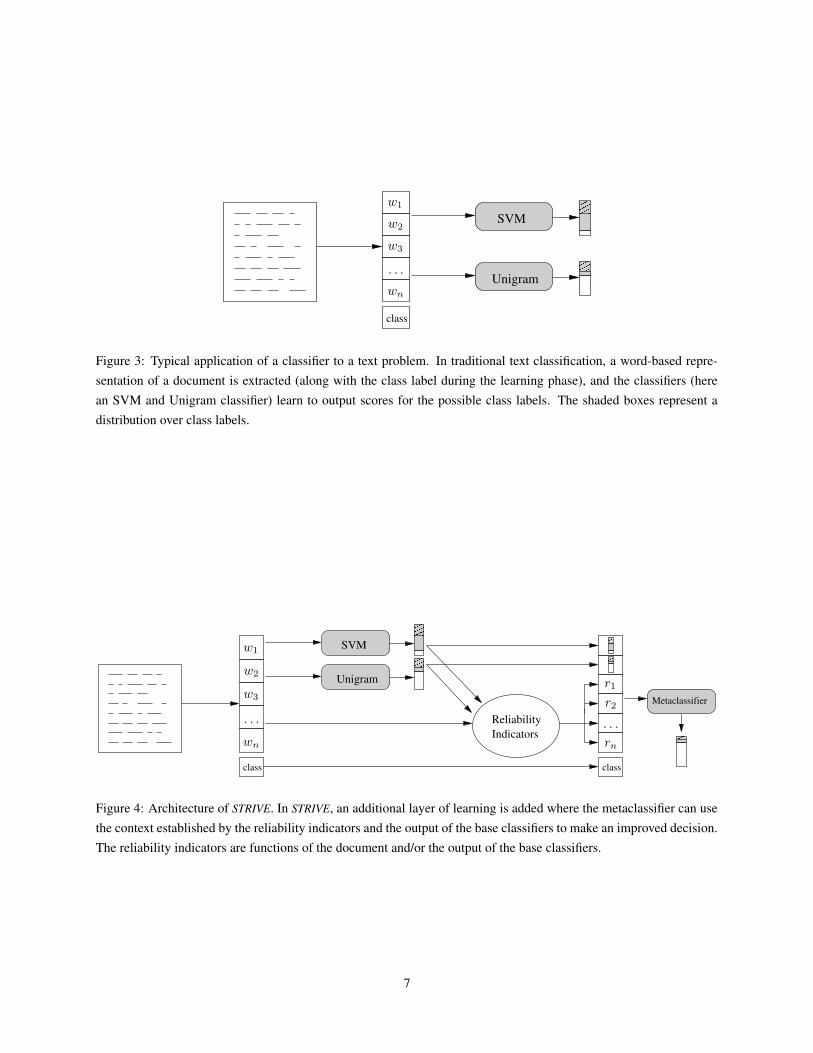
We refer to our classifier combination learning and inference framework as STRIVE for Stacked Reliability IndicatorVariable Ensemble. We select this name because the approach can be viewed as essentially extending the stackingframework by introducing reliability indicators at the metalevel. The STRIVE architecture is depicted graphically inFigure 4.
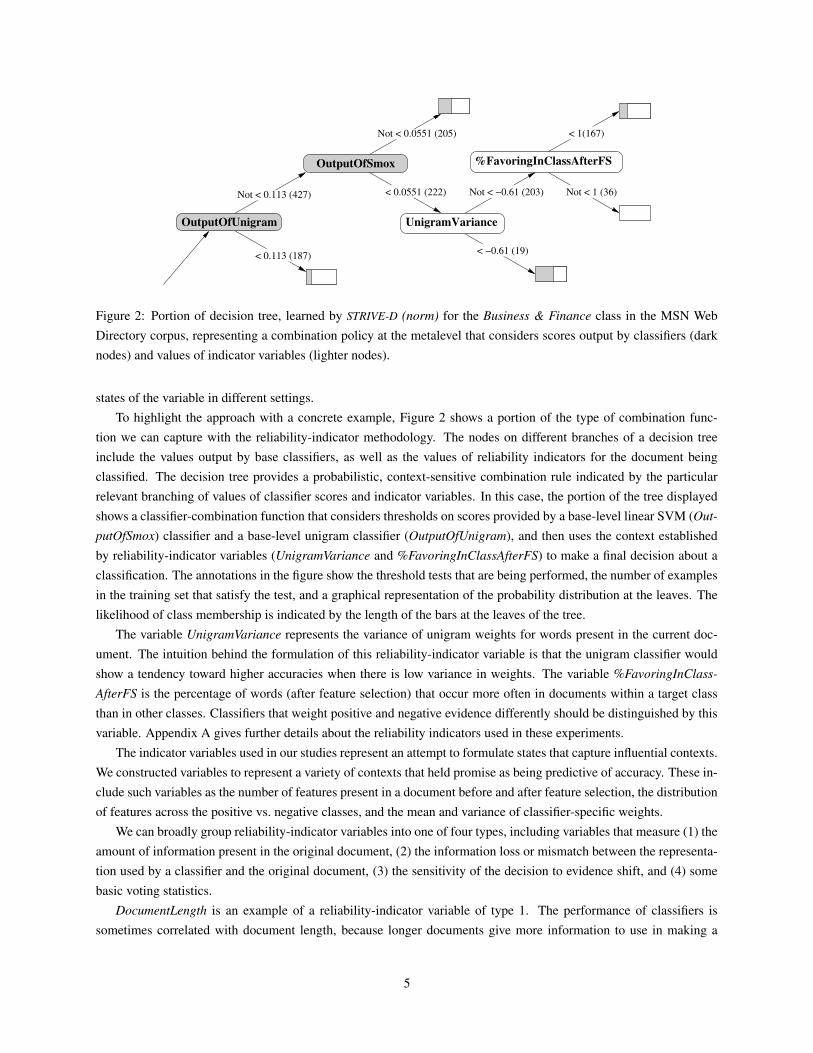
Our methodology maps the original classification task into a new learning problem. In the original learning prob-lem (Figure 3), the base classifiers simply predict the class from a word-based representation of the document, or moregenerally, each base classifier outputs a distribution (possibly unnormalized) over class labels. STRIVE adds anotherlayer of learning to the base problem. A set of reliability-indicator functions use the words in the document and theclassifier outputs to generate the reliability indicator values, ri, for a particular document. This process can be viewedas yielding a new representation of the document that consists of the values of the reliability indicators, as well as theoutputs of the base classifiers. The metaclassifier uses this new representation for learning and classification. This en-ables the metaclassifier to employ a model that uses the output of the base classifiers as well as the context establishedby the reliability indicators to make a final classification.
We require the outputs of the base classifiers to train the metaclassifier. Thus, we perform cross-validation over thetraining data and use the resulting base classifier predictions, obtained when an example serves as a validation item,as training inputs for the metaclassifier. We note that in the case where the set of reliability indicators are restrictedto be the identity function over the original data, then the resulting scheme can be viewed as a variant of cascadegeneralization (Gama, 1998a).
6
class
Unigram
SVM������ � �
������������
PSfrag replacements
w1
w2
w3
wn
· · ·r1
r2
r3
rn
Figure 3: Typical application of a classifier to a text problem. In traditional text classification, a word-based repre-sentation of a document is extracted (along with the class label during the learning phase), and the classifiers (herean SVM and Unigram classifier) learn to output scores for the possible class labels. The shaded boxes represent adistribution over class labels.
class class
��������
��������
����
Metaclassifier
ReliabilityIndicators
SVM
Unigram��������
PSfrag replacements
w1
w2
w3
wn
· · · · · ·
r1
r2
r3
rn
Figure 4: Architecture of STRIVE. In STRIVE, an additional layer of learning is added where the metaclassifier can usethe context established by the reliability indicators and the output of the base classifiers to make an improved decision.The reliability indicators are functions of the document and/or the output of the base classifiers.
7
4 Experimental Analysis
We performed a large number of experiments to test the value of probabilistic classifier combination with reliability-indicator variables. We now describe the corpora, methodology, and results.
4.1 Data
We examined several corpora, including the MSN Web Directory, Reuters, and TREC-AP.
4.1.1 MSN Web Directory
The MSN Web Directory is a large collection of heterogeneous web pages (from a May 1999 web snapshot) that havebeen hierarchically classified. We used the same train/test split of 50078/10024 documents as that reported by Dumaisand Chen (2000).
The MSN Web hierarchy is a seven-level hierarchy; we used all 13 of the top-level categories. The class proportionsin the training set vary from 1.15% to 22.29%. In the testing set, they range from 1.14% to 21.54%. The classesare general subject categories such as Health & Fitness and Travel & Vacation. Human indexers have assigned thedocuments to zero or more categories.
For the experiments below, we used only the top 1000 words with highest mutual information for each class;approximately 195K words appear in at least three training documents.
4.1.2 Reuters
The Reuters 21578 corpus (Lewis, 1997) contains Reuters news articles from 1987. For this data set, we used theModApte standard train/ test split of 9603/3299 documents (8676 unused documents). The classes are economicsubjects (e.g., “acq” for acquisitions, “earn” for earnings, etc.) that human taggers applied to the document; a documentmay have multiple subjects. There are actually 135 classes in this domain (only 90 of which occur in the training andtesting set); however, we only examined the ten most frequent classes since small numbers of testing examples makesestimating some performance measures unreliable due to high variance. Limiting to the ten largest classes allows usto compare our results to previously published results (Zhang & Oles, 2001; Dumais et al., 1998; Joachims, 1998;McCallum & Nigam, 1998; Platt, 1999b). The class proportions in the training set vary from 1.88% to 29.96%. In thetesting set, they range from 1.7% to 32.95%.
For the experiments below we used only the top 300 words with highest mutual information for each class; ap-proximately 15K words appear in at least three training documents.
4.1.3 TREC-AP
The TREC-AP corpus is a collection of AP news stories from 1988 to 1990. We used the same train/test split of142791/66992 documents that was used by Lewis et al. (1996). As described by Lewis and Gale (1994) (see also[Lewis, 1995]), the categories are defined by keywords in a keyword field. The title and body fields are used in theexperiments below. There are twenty categories in total.
The frequencies of the twenty classes are the same as those reported by Lewis et al. (1996). The class proportionsin the training set vary from 0.06% to 2.03%. In the testing set, they range from 0.03% to 4.32%.
For the experiments described below, we use only the top 1000 words with the highest mutual information for eachclass; approximately 123K words appear in at least 3 training documents.
8

4.2 Classifiers
We employed several base-level classifiers and classifier combination methods in our comparative studies. We reviewthe classifiers and combination methods here.
4.2.1 Base Classifiers
In an attempt to isolate the benefits gained from the probabilistic combination of classifiers with reliability indicators,we worked to keep the representations for the base classifiers in our experiments nearly identical. We would expectthat varying the representations (i.e., using different feature-selection methods or document representations) wouldonly improve the performance as this would likely decorrelate the performance of the base classifiers. We selectedfour classifiers that have been used traditionally for text classification: decision trees, linear SVMs, naıve Bayes, anda unigram classifier.
For the decision-tree implementation, we employed the WinMine decision networks toolkit and refer to this asDnet below (WinMine Toolkit v1.0, 2001). Dnet builds decision trees using a Bayesian machine learning algorithm(Chickering et al., 1997; Heckerman et al., 2000). While this toolkit is targeted primarily at building models thatprovide probability estimates, we found that Dnet models usually perform acceptably for the goal of minimizing errorrate. However, we found that the performance of Dnet with regard to other measures is sometimes poor.
For linear SVMs, we used the Smox toolkit which is based on Platt’s Sequential Minimal Optimization algorithm(Platt, 1999a). We have experimented with both binary and continuous feature representations, and both perform atapproximately the same level of accuracy. In order to keep the base representations used by each classifier as similaras possible, we used a continuous model.
The naıve Bayes classifier has also been referred to as a multivariate Bernoulli model. In using this classifier,we smoothed word and class probabilities using a Bayesian estimate (with the word prior) and a Laplace m-estimate,respectively.
The unigram classifier uses probability estimates from a unigram language model. This classifier has also been re-ferred to as a multinomial naıve Bayes classifier. Probability estimates are smoothed in a similar fashion to smoothingin the naıve Bayes classifier.
4.2.2 Basic Combination Methods
We performed experiments to explore a variety of classifier-combination methods. We considered several differentcombination procedures. The first combination method is based on selecting one classifier for each binary classproblem, based on the one that performed best for a validation set. We refer to this method as the Best By Classmethod.
Another combination method centers on taking a majority vote of the base classifiers. This approach is perhaps themost popular methodology used for the combination of text classifiers. When performing a majority vote, ties can bebroken in a variety of ways (e.g., breaking ties by always voting for in class). We experimented with several variantsof this method, but we only present results here for the method which relies on breaking ties by voting with the BestBy Class classifier as this procedure nearly always outperformed the other majority vote methods. We refer to thismethod as Majority BBC.
9
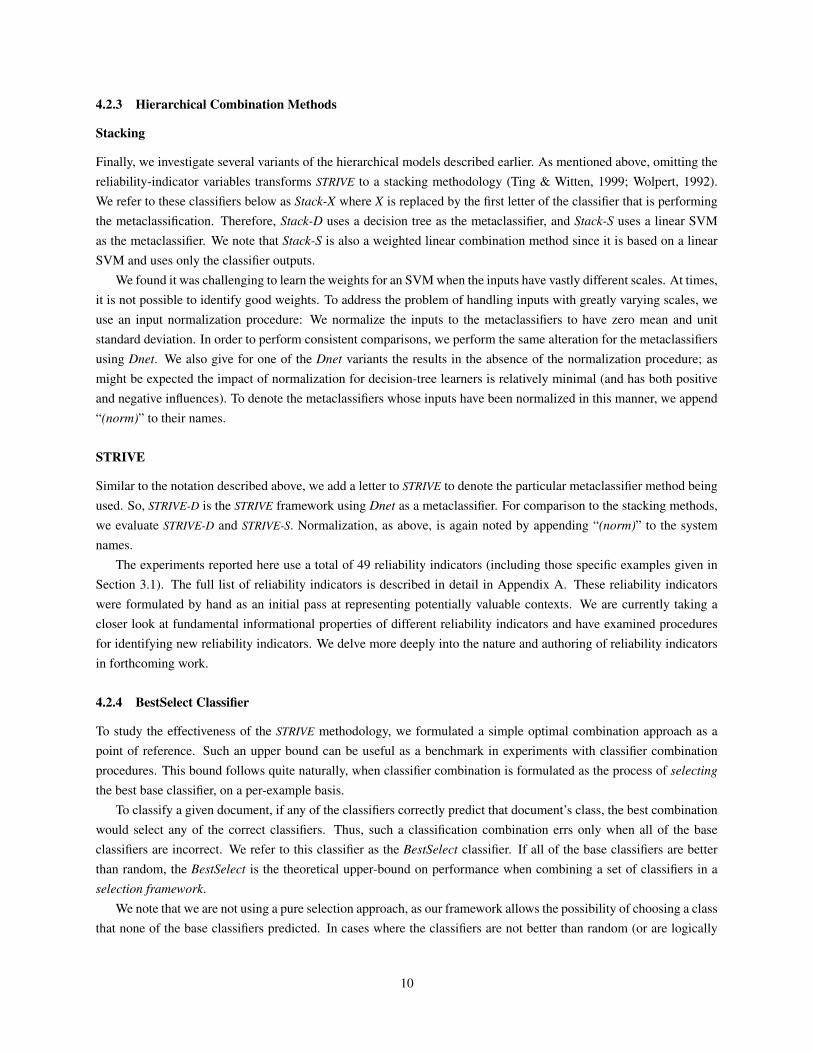
4.2.3 Hierarchical Combination Methods
Stacking
Finally, we investigate several variants of the hierarchical models described earlier. As mentioned above, omitting thereliability-indicator variables transforms STRIVE to a stacking methodology (Ting & Witten, 1999; Wolpert, 1992).We refer to these classifiers below as Stack-X where X is replaced by the first letter of the classifier that is performingthe metaclassification. Therefore, Stack-D uses a decision tree as the metaclassifier, and Stack-S uses a linear SVMas the metaclassifier. We note that Stack-S is also a weighted linear combination method since it is based on a linearSVM and uses only the classifier outputs.
We found it was challenging to learn the weights for an SVM when the inputs have vastly different scales. At times,it is not possible to identify good weights. To address the problem of handling inputs with greatly varying scales, weuse an input normalization procedure: We normalize the inputs to the metaclassifiers to have zero mean and unitstandard deviation. In order to perform consistent comparisons, we perform the same alteration for the metaclassifiersusing Dnet. We also give for one of the Dnet variants the results in the absence of the normalization procedure; asmight be expected the impact of normalization for decision-tree learners is relatively minimal (and has both positiveand negative influences). To denote the metaclassifiers whose inputs have been normalized in this manner, we append“(norm)” to their names.
STRIVE
Similar to the notation described above, we add a letter to STRIVE to denote the particular metaclassifier method beingused. So, STRIVE-D is the STRIVE framework using Dnet as a metaclassifier. For comparison to the stacking methods,we evaluate STRIVE-D and STRIVE-S. Normalization, as above, is again noted by appending “(norm)” to the systemnames.
The experiments reported here use a total of 49 reliability indicators (including those specific examples given inSection 3.1). The full list of reliability indicators is described in detail in Appendix A. These reliability indicatorswere formulated by hand as an initial pass at representing potentially valuable contexts. We are currently taking acloser look at fundamental informational properties of different reliability indicators and have examined proceduresfor identifying new reliability indicators. We delve more deeply into the nature and authoring of reliability indicatorsin forthcoming work.
4.2.4 BestSelect Classifier
To study the effectiveness of the STRIVE methodology, we formulated a simple optimal combination approach as apoint of reference. Such an upper bound can be useful as a benchmark in experiments with classifier combinationprocedures. This bound follows quite naturally, when classifier combination is formulated as the process of selectingthe best base classifier, on a per-example basis.
To classify a given document, if any of the classifiers correctly predict that document’s class, the best combinationwould select any of the correct classifiers. Thus, such a classification combination errs only when all of the baseclassifiers are incorrect. We refer to this classifier as the BestSelect classifier. If all of the base classifiers are betterthan random, the BestSelect is the theoretical upper-bound on performance when combining a set of classifiers in aselection framework.
We note that we are not using a pure selection approach, as our framework allows the possibility of choosing a classthat none of the base classifiers predicted. In cases where the classifiers are not better than random (or are logically
10
dependent), such an upper bound may be uninformatively loose. Even though we are not working in a pure selectionframework, we found it is rarely the case the metaclassifier outputs a prediction which none of the base classifiersmade. Therefore, we have employed this BestSelect bound to assist with understanding the performance of STRIVE.
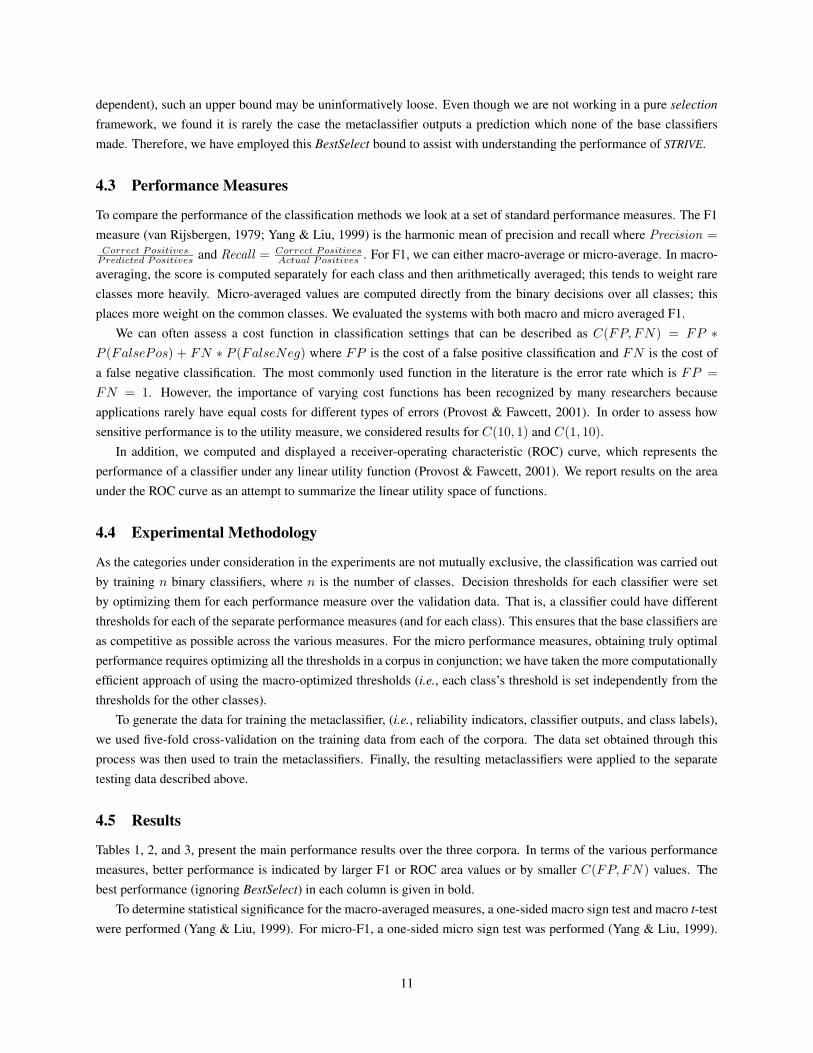
4.3 Performance Measures
To compare the performance of the classification methods we look at a set of standard performance measures. The F1measure (van Rijsbergen, 1979; Yang & Liu, 1999) is the harmonic mean of precision and recall where Precision =Correct PositivesPredicted Positives and Recall = Correct Positives
Actual Positives . For F1, we can either macro-average or micro-average. In macro-averaging, the score is computed separately for each class and then arithmetically averaged; this tends to weight rareclasses more heavily. Micro-averaged values are computed directly from the binary decisions over all classes; thisplaces more weight on the common classes. We evaluated the systems with both macro and micro averaged F1.
We can often assess a cost function in classification settings that can be described as C(FP, FN) = FP ∗P (FalsePos) + FN ∗ P (FalseNeg) where FP is the cost of a false positive classification and FN is the cost ofa false negative classification. The most commonly used function in the literature is the error rate which is FP =
FN = 1. However, the importance of varying cost functions has been recognized by many researchers becauseapplications rarely have equal costs for different types of errors (Provost & Fawcett, 2001). In order to assess howsensitive performance is to the utility measure, we considered results for C(10, 1) and C(1, 10).
In addition, we computed and displayed a receiver-operating characteristic (ROC) curve, which represents theperformance of a classifier under any linear utility function (Provost & Fawcett, 2001). We report results on the areaunder the ROC curve as an attempt to summarize the linear utility space of functions.
4.4 Experimental Methodology
As the categories under consideration in the experiments are not mutually exclusive, the classification was carried outby training n binary classifiers, where n is the number of classes. Decision thresholds for each classifier were setby optimizing them for each performance measure over the validation data. That is, a classifier could have differentthresholds for each of the separate performance measures (and for each class). This ensures that the base classifiers areas competitive as possible across the various measures. For the micro performance measures, obtaining truly optimalperformance requires optimizing all the thresholds in a corpus in conjunction; we have taken the more computationallyefficient approach of using the macro-optimized thresholds (i.e., each class’s threshold is set independently from thethresholds for the other classes).
To generate the data for training the metaclassifier, (i.e., reliability indicators, classifier outputs, and class labels),we used five-fold cross-validation on the training data from each of the corpora. The data set obtained through thisprocess was then used to train the metaclassifiers. Finally, the resulting metaclassifiers were applied to the separatetesting data described above.
4.5 Results
Tables 1, 2, and 3, present the main performance results over the three corpora. In terms of the various performancemeasures, better performance is indicated by larger F1 or ROC area values or by smaller C(FP, FN) values. Thebest performance (ignoring BestSelect) in each column is given in bold.
To determine statistical significance for the macro-averaged measures, a one-sided macro sign test and macro t-testwere performed (Yang & Liu, 1999). For micro-F1, a one-sided micro sign test was performed (Yang & Liu, 1999).
11

Method Macro F1 Micro F1 Error C(1,10) C(10,1) ROC AreaDnet 0.5502 0.5837 0.0583 0.3023 0.0771 0.8812Smox 0.6705 0.7001 0.0455 0.2239 0.0799 0.9125Naıve Bayes 0.5527 0.5619 0.0649 0.2853 0.0798 0.8915Unigram 0.5982 0.6116 0.0594 0.2589 0.0812 0.9003Best By Class 0.6705 0.7001 0.0455 0.2236 0.0783 N/AMajority BBC 0.6668 0.6919 0.0476 0.2173† 0.0761 N/AStack-D (norm) 0.6775 0.7038†‡ 0.0446†‡ 0.2118† 0.0784 0.9292†
Stack-S (norm) 0.6732 0.7037†‡ 0.0450 0.2174† 0.0757 0.9210†
STRIVE-D 0.6877†‡ 0.7179†‡ 0.0429†‡ 0.1939†‡ 0.0742 0.9383†
STRIVE-D (norm) 0.6908†‡ 0.7178†‡ 0.0434 0.1949†‡ 0.0742 0.9398†STRIVE-S (norm) 0.6948†‡ 0.7233†‡ 0.0430†‡ 0.2037† 0.0712 0.9114STRIVE-D (norm, omit Smox) 0.6670 0.6945 0.0464 0.2062†‡ 0.0754 0.9361†
BestSelect 0.8365 0.8577 0.0270 0.0905 0.0616 N/A
Table 1: Performance on MSN Web Directory Corpus
Method Macro F1 Micro F1 Error C(1,10) C(10,1) ROCDnet 0.7846 0.8541 0.0242 0.0799 0.0537 0.9804Smox 0.8480 0.9102 0.0157 0.0580 0.0390 0.9815Naıve Bayes 0.6574 0.7908 0.0320 0.1423 0.0527 0.9703Unigram 0.7645 0.8674 0.0234 0.0713 0.0476 0.9877Best By Class 0.8592 0.9126 0.0153 0.0518 0.0409 N/AMajority BBC 0.8524 0.9097 0.0160 0.0448 0.0446 N/AStack-D (norm) 0.8636 0.9181 0.0153 0.0449 0.0392 0.9893Stack-S (norm) 0.8720†‡ 0.9201†‡ 0.0143† 0.0445 0.0365 0.9930†
STRIVE-D 0.8547 0.9106 0.0154 0.0472 0.0358 0.9903STRIVE-D (norm) 0.8526 0.9085 0.0157 0.0468 0.0359 0.9897STRIVE-S (norm) 0.8749† 0.9235†‡ 0.0125†‡ 0.0382† 0.0353 0.9939STRIVE-D (norm, omit Smox) 0.8433 0.8961 0.0168 0.0484 0.0425 0.9900BestSelect 0.9529 0.9725 0.0050 0.0100 0.0202 N/A
Table 2: Performance on Reuters Corpus
Differences with a p-level above 0.05 were not considered statistically significant.We do not explicitly report significance results for the t-test comparisons over the main performance results;
instead, our analysis follows the macro and micro sign test which yield more conservative comparisons (i.e., the t-testprimarily increased the number of differences found to be significant in the tables).
The classifier combinations are annotated to indicate the results of the macro sign test and, for micro F1, the microsign test. A † indicates the method significantly outperforms (at the 0.05 level) the best base classifier. In addition, onthe variants of Stack and STRIVE, a ‡ indicates that the method outperforms the basic combination methods. Resultsfor the remaining sign test comparisons are omitted for brevity.
Tables 4, 5, and 6, present the performance results for additional experiments (described in Section 4.6.3) weconducted to determine how much could be gained by incorporating the reliability indicators directly into a baseclassifier versus combining them hierarchically with classifier outputs, as in STRIVE. Thus, this ablation experimentaims to empirically examine how much first-order information the reliability indicators have versus their information
12
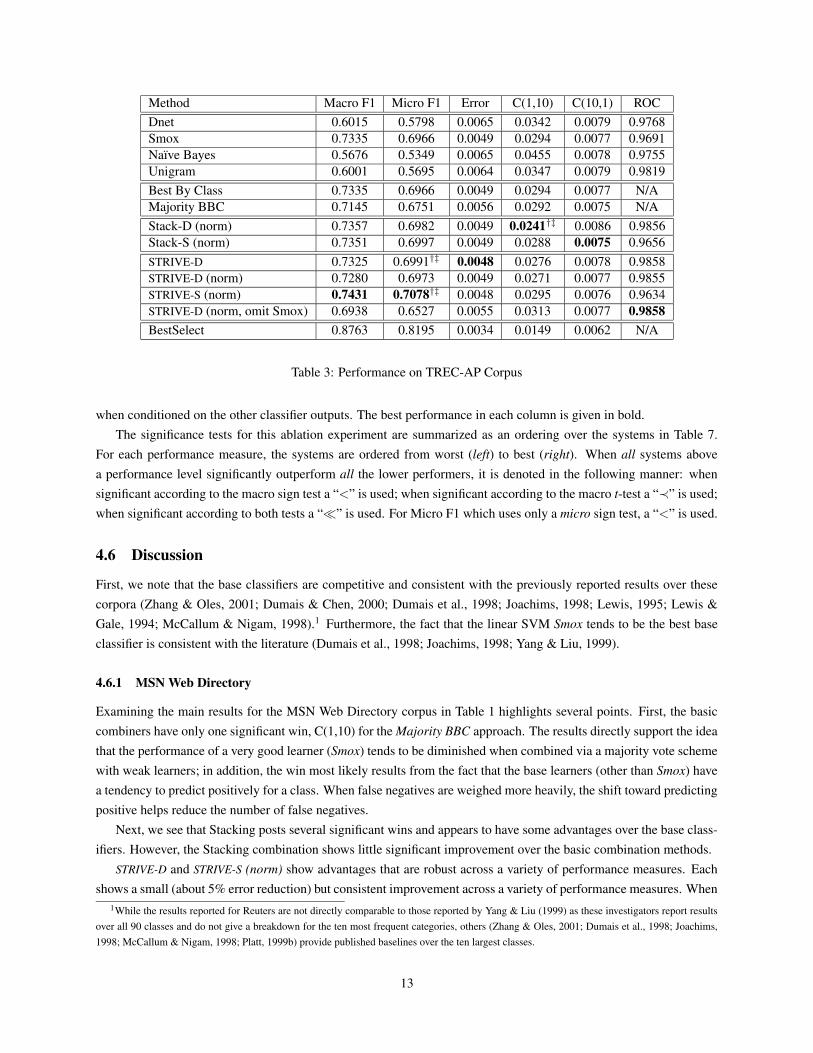
Method Macro F1 Micro F1 Error C(1,10) C(10,1) ROCDnet 0.6015 0.5798 0.0065 0.0342 0.0079 0.9768Smox 0.7335 0.6966 0.0049 0.0294 0.0077 0.9691Naıve Bayes 0.5676 0.5349 0.0065 0.0455 0.0078 0.9755Unigram 0.6001 0.5695 0.0064 0.0347 0.0079 0.9819Best By Class 0.7335 0.6966 0.0049 0.0294 0.0077 N/AMajority BBC 0.7145 0.6751 0.0056 0.0292 0.0075 N/AStack-D (norm) 0.7357 0.6982 0.0049 0.0241†‡ 0.0086 0.9856Stack-S (norm) 0.7351 0.6997 0.0049 0.0288 0.0075 0.9656STRIVE-D 0.7325 0.6991†‡ 0.0048 0.0276 0.0078 0.9858STRIVE-D (norm) 0.7280 0.6973 0.0049 0.0271 0.0077 0.9855STRIVE-S (norm) 0.7431 0.7078†‡ 0.0048 0.0295 0.0076 0.9634STRIVE-D (norm, omit Smox) 0.6938 0.6527 0.0055 0.0313 0.0077 0.9858BestSelect 0.8763 0.8195 0.0034 0.0149 0.0062 N/A
Table 3: Performance on TREC-AP Corpus
when conditioned on the other classifier outputs. The best performance in each column is given in bold.The significance tests for this ablation experiment are summarized as an ordering over the systems in Table 7.
For each performance measure, the systems are ordered from worst (left) to best (right). When all systems abovea performance level significantly outperform all the lower performers, it is denoted in the following manner: whensignificant according to the macro sign test a “<” is used; when significant according to the macro t-test a “≺” is used;when significant according to both tests a “�” is used. For Micro F1 which uses only a micro sign test, a “<” is used.
4.6 Discussion
First, we note that the base classifiers are competitive and consistent with the previously reported results over thesecorpora (Zhang & Oles, 2001; Dumais & Chen, 2000; Dumais et al., 1998; Joachims, 1998; Lewis, 1995; Lewis &Gale, 1994; McCallum & Nigam, 1998).1 Furthermore, the fact that the linear SVM Smox tends to be the best baseclassifier is consistent with the literature (Dumais et al., 1998; Joachims, 1998; Yang & Liu, 1999).
4.6.1 MSN Web Directory
Examining the main results for the MSN Web Directory corpus in Table 1 highlights several points. First, the basiccombiners have only one significant win, C(1,10) for the Majority BBC approach. The results directly support the ideathat the performance of a very good learner (Smox) tends to be diminished when combined via a majority vote schemewith weak learners; in addition, the win most likely results from the fact that the base learners (other than Smox) havea tendency to predict positively for a class. When false negatives are weighed more heavily, the shift toward predictingpositive helps reduce the number of false negatives.
Next, we see that Stacking posts several significant wins and appears to have some advantages over the base class-ifiers. However, the Stacking combination shows little significant improvement over the basic combination methods.
STRIVE-D and STRIVE-S (norm) show advantages that are robust across a variety of performance measures. Eachshows a small (about 5% error reduction) but consistent improvement across a variety of performance measures. When
1While the results reported for Reuters are not directly comparable to those reported by Yang & Liu (1999) as these investigators report resultsover all 90 classes and do not give a breakdown for the ten most frequent categories, others (Zhang & Oles, 2001; Dumais et al., 1998; Joachims,1998; McCallum & Nigam, 1998; Platt, 1999b) provide published baselines over the ten largest classes.
13
0
0.2
0.4
0.6
0.8
1
0 0.05 0.1 0.15 0.2
True
Pos
itive
Rat
e
False Positive Rate
DnetSmox
Naive BayesUnigram
STRIVE-D STRIVE-S (norm)
PSfrag replacements
w1
w2
w3
wn
· · ·r1
r2
r3
rn
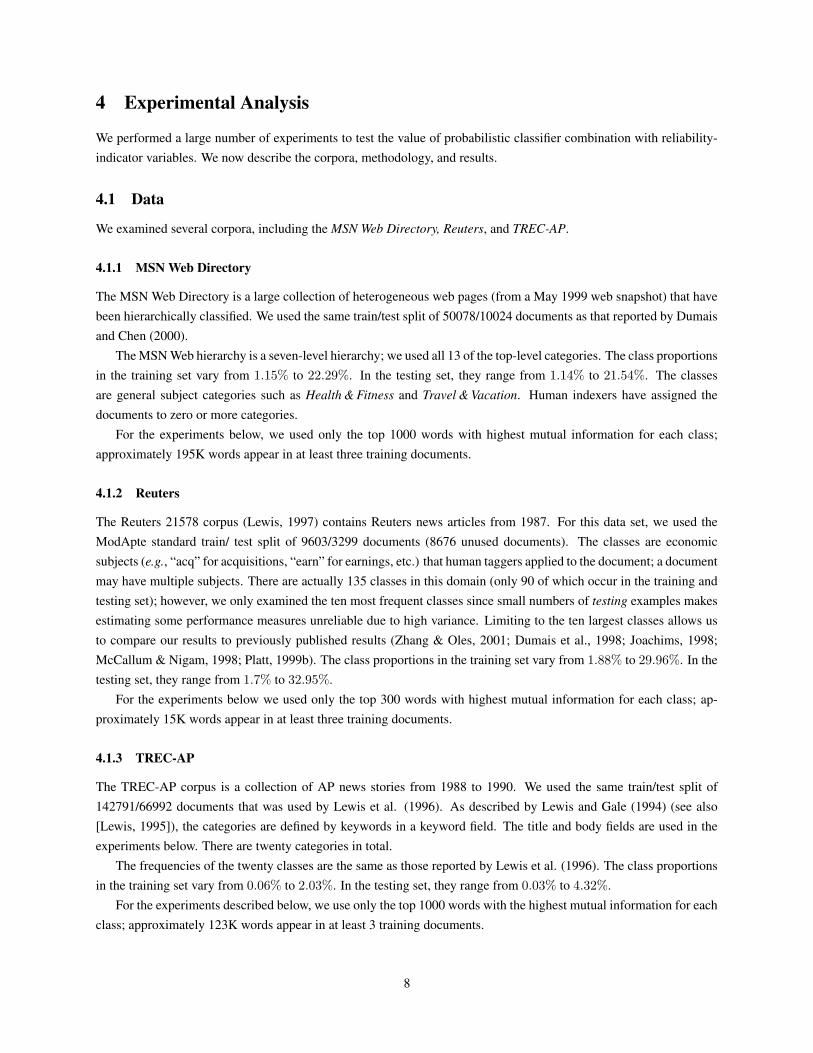
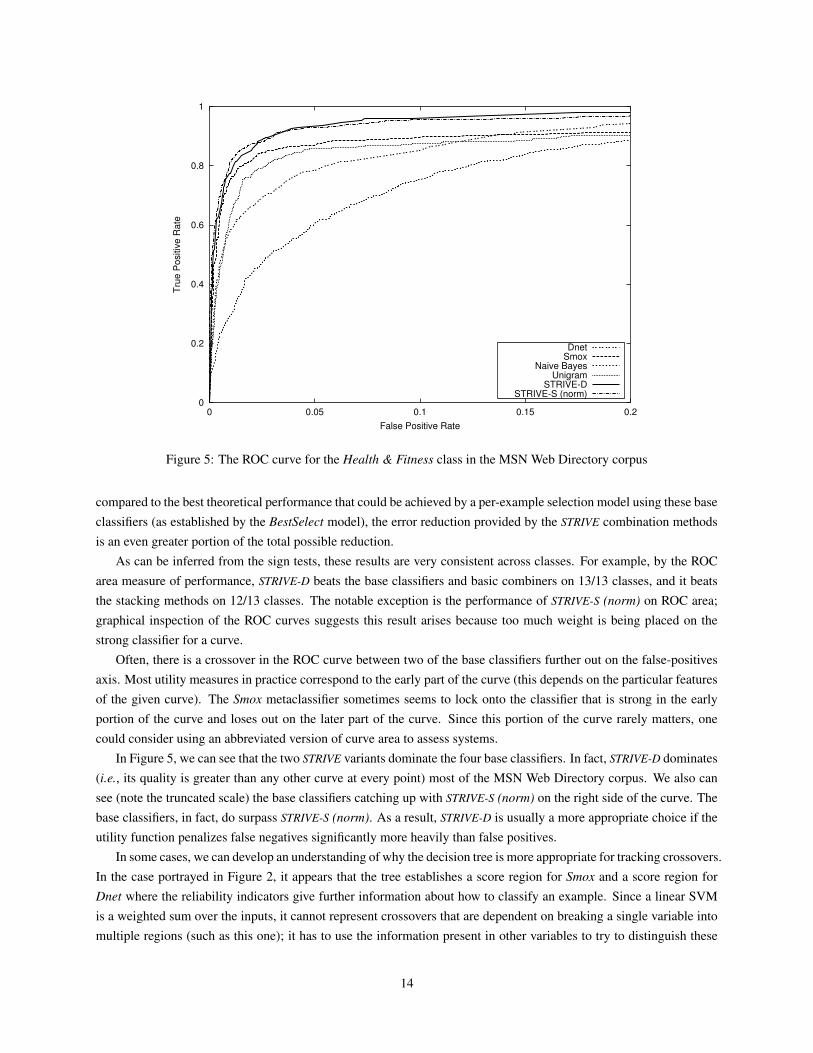
Figure 5: The ROC curve for the Health & Fitness class in the MSN Web Directory corpus
compared to the best theoretical performance that could be achieved by a per-example selection model using these baseclassifiers (as established by the BestSelect model), the error reduction provided by the STRIVE combination methodsis an even greater portion of the total possible reduction.
As can be inferred from the sign tests, these results are very consistent across classes. For example, by the ROCarea measure of performance, STRIVE-D beats the base classifiers and basic combiners on 13/13 classes, and it beatsthe stacking methods on 12/13 classes. The notable exception is the performance of STRIVE-S (norm) on ROC area;graphical inspection of the ROC curves suggests this result arises because too much weight is being placed on thestrong classifier for a curve.
Often, there is a crossover in the ROC curve between two of the base classifiers further out on the false-positivesaxis. Most utility measures in practice correspond to the early part of the curve (this depends on the particular featuresof the given curve). The Smox metaclassifier sometimes seems to lock onto the classifier that is strong in the earlyportion of the curve and loses out on the later part of the curve. Since this portion of the curve rarely matters, onecould consider using an abbreviated version of curve area to assess systems.
In Figure 5, we can see that the two STRIVE variants dominate the four base classifiers. In fact, STRIVE-D dominates(i.e., its quality is greater than any other curve at every point) most of the MSN Web Directory corpus. We also cansee (note the truncated scale) the base classifiers catching up with STRIVE-S (norm) on the right side of the curve. Thebase classifiers, in fact, do surpass STRIVE-S (norm). As a result, STRIVE-D is usually a more appropriate choice if theutility function penalizes false negatives significantly more heavily than false positives.
In some cases, we can develop an understanding of why the decision tree is more appropriate for tracking crossovers.In the case portrayed in Figure 2, it appears that the tree establishes a score region for Smox and a score region forDnet where the reliability indicators give further information about how to classify an example. Since a linear SVMis a weighted sum over the inputs, it cannot represent crossovers that are dependent on breaking a single variable intomultiple regions (such as this one); it has to use the information present in other variables to try to distinguish these
14

regions. Higher-order polynomial kernels are one way to allow an SVM to represent this type of information.Finally, we performed an ablation experiment to determine how STRIVE would behave without the presence of
an extremely strong base classifier. Since Smox frequently outperforms the other base classifiers, we investigated thelevel of performance STRIVE could obtain if the output of Smox was omitted from the inputs given to the metaclassifier,STRIVE-D (norm, omit Smox). The results show that when we omit the base classifier Smox, the resulting combinationimproves by a large margin over the remaining base methods; however, the resulting classifier generally still failsto beat Smox’s individual performance. This suggests that there are not enough indicator variables tied to Smox’sbehavior, or alternatively, that the other classifiers as a group behave like Smox, rather than classify in a complementaryfashion.
4.6.2 Reuters and TREC-AP
The results for Reuters and TREC-AP in Tables 2 and 3 are consistent with the above analysis. We note that the levelof improvement tends to be less pronounced for these corpora. Since it is common in the literature to show results foreach class of the top ten largest classes in Reuters, we provide a detailed listing in Appendix B.
4.6.3 Additional Experiments
Method Macro F1 Micro F1 Error C(1,10) C(10,1) ROC AreaDnet 0.5502 0.5837 0.0583 0.3023 0.0771 0.8812Dnet+RIV– 0.6547 0.6841 0.0489 0.2136 0.0760 0.9295Dnet+RIV 0.6825 0.7127 0.0447 0.2022 0.0781 0.9374Stack-D (norm) 0.6775 0.7038 0.0446 0.2118 0.0784 0.9292STRIVE-D 0.6877 0.7179 0.0429 0.1939 0.0742 0.9383STRIVE-D (norm) 0.6908 0.7178 0.0434 0.1949 0.0742 0.9398
Table 4: Results of incorporating reliability indicators directly into a base classifier for the MSN Web Directory Corpus
Method Macro F1 Micro F1 Error C(1,10) C(10,1) ROC AreaDnet 0.7846 0.8541 0.0242 0.0799 0.0537 0.9804Dnet+RIV– 0.8429 0.8985 0.0167 0.0629 0.0444 0.9888Dnet+RIV 0.8479 0.9074 0.0161 0.0460 0.0439 0.9908Stack-D (norm) 0.8636 0.9181 0.0153 0.0449 0.0392 0.9893STRIVE-D 0.8547 0.9106 0.0154 0.0472 0.0358 0.9903STRIVE-D (norm) 0.8526 0.9085 0.0157 0.0468 0.0359 0.9897
Table 5: Results of incorporating reliability indicators directly into a base classifier for the Reuters Corpus
Finally, we investigated whether the reliability indicators could be directly incorporated into the base classifiers.That is, we wanted to understand to what extent their information can be directly used to improve classification and towhat extent it is conditional on the presence of classifier outputs. To examine these issues, we performed an experimentwhere we added all of the reliability indicators to the standard document representation and built a model using Dnet.The resulting system is denoted Dnet+RIV. Since some of the reliability indicators contain information equivalent to
15
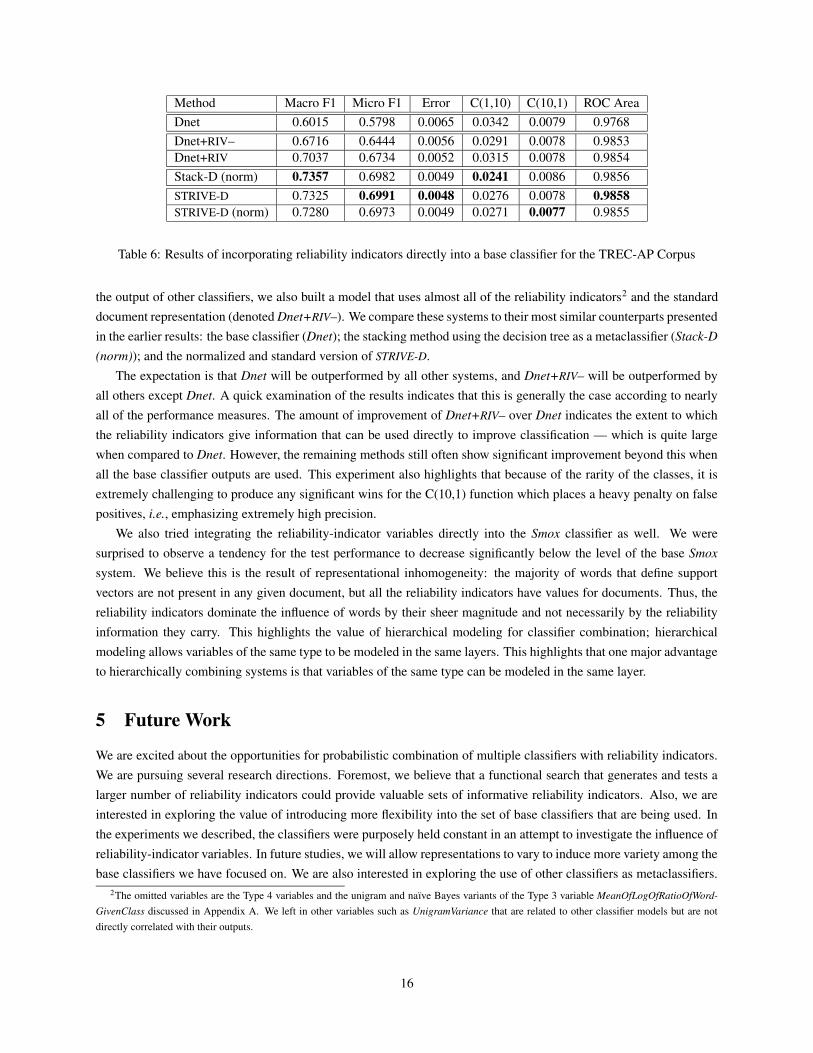
Method Macro F1 Micro F1 Error C(1,10) C(10,1) ROC AreaDnet 0.6015 0.5798 0.0065 0.0342 0.0079 0.9768Dnet+RIV– 0.6716 0.6444 0.0056 0.0291 0.0078 0.9853Dnet+RIV 0.7037 0.6734 0.0052 0.0315 0.0078 0.9854Stack-D (norm) 0.7357 0.6982 0.0049 0.0241 0.0086 0.9856STRIVE-D 0.7325 0.6991 0.0048 0.0276 0.0078 0.9858STRIVE-D (norm) 0.7280 0.6973 0.0049 0.0271 0.0077 0.9855
Table 6: Results of incorporating reliability indicators directly into a base classifier for the TREC-AP Corpus
the output of other classifiers, we also built a model that uses almost all of the reliability indicators2 and the standarddocument representation (denoted Dnet+RIV–). We compare these systems to their most similar counterparts presentedin the earlier results: the base classifier (Dnet); the stacking method using the decision tree as a metaclassifier (Stack-D(norm)); and the normalized and standard version of STRIVE-D.
The expectation is that Dnet will be outperformed by all other systems, and Dnet+RIV– will be outperformed byall others except Dnet. A quick examination of the results indicates that this is generally the case according to nearlyall of the performance measures. The amount of improvement of Dnet+RIV– over Dnet indicates the extent to whichthe reliability indicators give information that can be used directly to improve classification — which is quite largewhen compared to Dnet. However, the remaining methods still often show significant improvement beyond this whenall the base classifier outputs are used. This experiment also highlights that because of the rarity of the classes, it isextremely challenging to produce any significant wins for the C(10,1) function which places a heavy penalty on falsepositives, i.e., emphasizing extremely high precision.
We also tried integrating the reliability-indicator variables directly into the Smox classifier as well. We weresurprised to observe a tendency for the test performance to decrease significantly below the level of the base Smoxsystem. We believe this is the result of representational inhomogeneity: the majority of words that define supportvectors are not present in any given document, but all the reliability indicators have values for documents. Thus, thereliability indicators dominate the influence of words by their sheer magnitude and not necessarily by the reliabilityinformation they carry. This highlights the value of hierarchical modeling for classifier combination; hierarchicalmodeling allows variables of the same type to be modeled in the same layers. This highlights that one major advantageto hierarchically combining systems is that variables of the same type can be modeled in the same layer.
5 Future Work
We are excited about the opportunities for probabilistic combination of multiple classifiers with reliability indicators.We are pursuing several research directions. Foremost, we believe that a functional search that generates and tests alarger number of reliability indicators could provide valuable sets of informative reliability indicators. Also, we areinterested in exploring the value of introducing more flexibility into the set of base classifiers that are being used. Inthe experiments we described, the classifiers were purposely held constant in an attempt to investigate the influence ofreliability-indicator variables. In future studies, we will allow representations to vary to induce more variety among thebase classifiers we have focused on. We are also interested in exploring the use of other classifiers as metaclassifiers.
2The omitted variables are the Type 4 variables and the unigram and naıve Bayes variants of the Type 3 variable MeanOfLogOfRatioOfWord-GivenClass discussed in Appendix A. We left in other variables such as UnigramVariance that are related to other classifier models but are notdirectly correlated with their outputs.
16

Macro F1MSN Web Dnet� Dnet+RIV–� Stack-D (norm), Dnet+RIV, STRIVE-D, STRIVE-D (norm)Reuters Dnet ≺ Dnet+RIV–, Dnet+RIV, STRIVE-D (norm), STRIVE-D, Stack-D (norm)TREC-AP Dnet� Dnet+RIV– ≺ Dnet+RIV� STRIVE-D (norm), STRIVE-D, Stack-D (norm)
Micro F1MSN Web Dnet < Dnet+RIV– < Stack-D (norm), Dnet+RIV < STRIVE-D (norm), STRIVE-DReuters Dnet < Dnet+RIV– < Dnet+RIV, STRIVE-D (norm), STRIVE-D < Stack-D (norm)TREC-AP Dnet < Dnet+RIV– < Dnet+RIV < STRIVE-D (norm), Stack-D (norm) < STRIVE-D
ErrorMSN Web Dnet� Dnet+RIV–� Dnet+RIV, Stack-D (norm), STRIVE-D (norm), STRIVE-DReuters Dnet ≺ Dnet+RIV–, Dnet+RIV, STRIVE-D (norm), STRIVE-D, Stack-D (norm)TREC-AP Dnet� Dnet+RIV–� Dnet+RIV� Stack-D (norm), STRIVE-D (norm)� STRIVE-D
C(1,10)MSN Web Dnet� Dnet+RIV–, Stack-D (norm)� Dnet+RIV� STRIVE-D (norm), STRIVE-DReuters Dnet, Dnet+RIV–, STRIVE-D, STRIVE-D (norm), Dnet+RIV, Stack-D (norm)TREC-AP Dnet < Dnet+RIV < Dnet+RIV– < STRIVE-D, STRIVE-D (norm), Stack-D (norm)
C(10,1)MSN Web Stack-D (norm), Dnet+RIV, Dnet, Dnet+RIV–, STRIVE-D (norm), STRIVE-DReuters Dnet, Dnet+RIV–, Dnet+RIV, Stack-D (norm), STRIVE-D (norm), STRIVE-DTREC-AP Stack-D (norm), Dnet, Dnet+RIV, STRIVE-D, Dnet+RIV–, STRIVE-D (norm)
ROC AreaMSN Web Dnet� Stack-D (norm), Dnet+RIV–� Dnet+RIV < STRIVE-D� STRIVE-D (norm)Reuters Dnet ≺ Dnet+RIV–, Stack-D (norm), STRIVE-D (norm), STRIVE-D, Dnet+RIVTREC-AP Dnet < Dnet+RIV–, Dnet+RIV, STRIVE-D (norm), Stack-D (norm), STRIVE-D
Table 7: An ordered comparison of classification models built with reliability indicators directly added to a baseclassifier versus hierarchical combination models. For each performance measure, the systems are ordered from worst(left) to best (right).
The metaclassifier should be a classifier that handles correlated input well (e.g., use of maximum entropy [Nigamet al., 1999]) as classifiers performing better than random will be necessarily correlated.
In addition, we believe the STRIVE framework can be used to elucidate deeper, information-theoretic foundationsof how classifiers leverage information in text classification. Currently, we build one metaclassifier for each binarytopic problem in a corpus (e.g., Acquisitions vs. not Acquisitions). However, a promising abstraction of the STRIVE
framework enables us to use model structure or parameters learned using data from one binary task for a separatebinary task (even in a different corpus). This can be experimentally tested by coalescing metalevel training datafrom different binary discrimination tasks and building one, more general, metaclassifier. With this approach, wetreat the metaclassifier as an abstraction moving the focus of the analysis from discriminating a specific topic (e.g.,Acquisitions vs. not Acquisitions) to the problem of discriminating topic membership (i.e., In-Topic vs. Out-of-Topic).The base-level classifiers trained on a particular topic are used as the representation of topic-specific knowledge, whilethe metaclassifier provides information about how to leverage context across topic-classification in general. If themetaclassifier still improves performance of base classifiers, then the reliability indicators will have inductively definedinformational properties for classifier combination across all of the text problems considered. Such an extension is onlypossible if we generalize the reliability indicators away from linkages to the precise words in a document. Considerwhen “shares” occurs in a document in the Acquisitions discrimination task and “corn” occurs in a document inthe Corn Futures discrimination task. One task-invariant representation of context at the metalevel might transform
17

both of these to: Is the word with maximum mutual information for the current task present in this document? Thisrepresentation enables the metaclassifier to use information about how document-specific context influences topicdiscrimination across a wide variety of text classification tasks. Recent experiments have demonstrated that thismethodology can be valuable in enhancing the performance of classifiers (Bennett et al., 2003). We are continuing topursue this promising extension.
6 Summary and Conclusions
We reviewed a methodology for building a metaclassifier for text documents that centers on combining multipledistinct classifiers with probabilistic learning and inference that leverages reliability-indicator variables. Reliabilityindicators provide information about the context-sensitive nature of classifier reliability, informing a metaclassifierabout the best way to integrate the outputs from base-level classifiers. We reviewed several popular text classificationmethods, and described several combination schemes. We introduced the STRIVE methodology that uses reliabilityindicators in a hierarchical combination model and reviewed comparative studies comparing STRIVE with other com-bination mechanisms.
We conducted experimental evaluations over three text-classification corpora (MSN Web, Reuters 21578, andTREC-AP) with a variety of performance measures. These measures were selected to determine the robustness of theclassification procedures under different misclassification penalties. The empirical evaluations support the conclusionthat a simple majority vote in situations where one of the classifiers performs strongly can weaken the best classifier’sperformance. In contrast, in all of these corpora across all measures, the STRIVE methodology was competitive, failingto produce the top performer in only two instances (the two skewed linear utility measures in the TREC-AP corpus).Furthermore, on a class-by-class basis, the STRIVE methodology produced receiver-operating characteristic curves thatdominated the other classifiers in nearly every class of the MSN Web corpus—demonstrating that it provides the bestchoice for any possible linear utility function in this corpus. In conclusion, the experiments show that stacking andSTRIVE provide robust combination schemes across a variety of performance measures.
Acknowledgments
We thank Max Chickering and Robert Rounthwaite for their special support of the WinMine toolkit, and John Platt foradvice and code support for the linear SVM classifier. We would also like to thank the anonymous reviewers for theuseful suggestions they provided.
Appendix A: Detailed Descriptions of Inputs to STRIVE
This appendix gives details for all of the inputs to STRIVE—including the base classifier outputs in addition to all 49reliability-indicator variables.
A.1 Outputs of Base Classifiers
We considered the outputs of four base classifiers as inputs to STRIVE.
• OutputOfDnetThis is the output of the decision tree built using the Dnet classifier (available as the WinMine toolkit [WinMineToolkit v1.0, 2001]). Its value is the estimated probability at the leaf node of belonging to the class.
18

• OutputOfSmoxThis is the output of the Linear SVM model built using the Smox toolkit. It is a probability estimate of classmembership obtained via a monotonic transformation using a fitted sigmoid (Platt, 1999) of the raw score of theSVM.
• OutputOfNaıvebayesThis is the output of the naıve Bayes model built using a multivariate Bernoulli representation (i.e. only featurepresence/absence in an example is modeled) (McCallum & Nigam, 1998). It is the log-odds (or logistic) of themodel’s probability estimate of class membership, i.e. log P (c|d)
1−P (c|d) . The direct probability estimate is not usedbecause typically enough machine floating-point precision is not available to preserve the ranking induced bythis model (they cluster too closely to zero and one).
• OutputOfUnigramThis is the output of the unigram model (also referred to as a multinomial model [McCallum and Nigam, 1998]).It is the log-odds (or logistic) of the model’s probability estimate of class membership, i.e. log P (c|d)
1−P (c|d) . Thedirect probability estimate is not used because typically enough machine floating-point precision is not availableto preserve the ranking induced by this model (they cluster too closely to zero and one).
A.2 Reliability Indicator Variables
Indicator variables are currently broken roughly into one of four types:
• Amount of information present in the original document (15/15);
• Information loss or mismatch between representations (12/12);
• Sensitivity of the decision to evidence shift (20/6);
• Basic voting statistics (2/2).
The first number in parentheses is the number of variables of this type that were present in the experimentalevaluation. The second number is the number of those whose effect on the metaclassifier model appears to be non-negligible. We group the reliability indicators into their primary type (based on the main reasons we expect to see alink to classifier reliability). We note that this is only a soft clustering; some reliability indicators may provide contextinformation in more than one way.
Several of the variables listed below have an instantiation for each class in a learning problem (the variable countswe report tallies each instance separately). For these variables below we list only one entry and use “{Class}” in thename of the variable to denote that this variable has one instantiation per class. Since our methodology built a binaryclassifier for each topic, then our experiments have a Positive and a Negative class version. In a two-class problem,the values of the two instantiations may be redundant. We have, however, retained each since in polyclass (3 or moreclasses) discrimination they are more distinct.
After each bullet below, a number is given in parentheses, indicating the number of variables that this descriptionincludes. Thus, the total of the numbers in parentheses is 49.
A.2.1 Type 1: Amount of information present in the original document
There are 15 reliability indicator variables whose primary type is considered to be this type (11 not counting instanti-ations for each class).
19

• (1) DocumentLengthThe number of words in a document before feature selection. Presumably longer documents provide moreinformation to base a decision upon. Therefore, longer documents will lead to more reliable decisions (whenDocumentLength is correctly modeled). Alternatively, models that do not correctly normalize for documentlength may be less reliable for extreme lengths (short or long) of documents.
• (1) EffectiveDocumentLengthDocumentLength minus the number of out-of-vocabulary words in the document. Since a model cannot gener-alize strongly (other than smoothing) for features that were not seen in the training set, this variable may be abetter indicator of information present in the document than DocumentLength.
• (1) NumUniqueWordsNumber of distinct tokens in a document, i.e. |{w|w ∈ document}| (as opposed to length which counts repeatsof a token in a document). The motivation is similar to DocumentLength, but here the variable is only countingeach new word as an indicator of new information.
• (1) EffectiveUniqueWordsNumUniqueWords minus the number of unique out-of-vocabulary words. This is the analogue of Effective-DocumentLength and is included for similar reasons.
• (1) PercentUniqueThis is a measure of the variety in word choice in a document. It is equal to NumUniqueWords / Docu-mentLength. This can also be seen as 1 / average number of times a word is repeated in a document. Closeto 1 means very few words (if any) are repeated in the document; close to 0 means the documents consists ofvery few unique words (possibly repeated many times). This is essentially a normalized version of NumUnique-Words; however this variable will show high variance for short documents. The intuition here is that morecomplex documents, while providing more information, also might be more difficult to classify (since they mayhave many features each carrying some small weight).
• (1) PercentOOVThe percentage of the words in a document which weren’t seen in the training set. It is equal to the number ofout-of-vocabulary words divided by DocumentLength. Similar to PercentUnique, this variable can show highvariance for short values. The intuition here is that the more novel words a document contains the more likely aclassifier is to incorrectly classify the document into the a priori prevalent class (typically unseen words slightlyfavor minority classes since we have less samples from them). This is a variable that essentially allows a globalsmoothing model to be induced. Its range is [0, 1]. Therefore, as it approaches 1, we would expect minorityclasses to be more likely than our base models might estimate.
• (1) PercentUniqueOOVThe percentage of the words (not counting duplicates) in a document which weren’t seen in the training set.This is the distinct token analogue for PercentOOV. Again, the motivations are similar to just using a differentinformation model.
• (2) PercentIn{Class}BeforeFSOf all words occurring in the training set (i.e. out-of-vocabulary words are ignored), the percentage of words ina document that occurred at least once in examples belonging to the class. It is equal to the number of words thatoccurred in the class before feature selection divided by EffectiveDocumentLength. Similar to PercentOOV, this
20

can be used to inductively learn smoothing behavior. The assumption is that if this variable is high, predictionsthat the example belongs to the class are more reliable. For the binary case with a negative class that effectivelygroups many classes together, this isn’t quite expected with respect to PercentInNegBeforeFS (since predictionsof “negative” would almost always expected to be more reliable under that assumption).
• (2) UpercentIn{Class}BeforeFSOf all words occurring in the training set (i.e. out-of-vocabulary words are ignored), the percentage of uniquewords in a document that occurred at least once in examples belonging to the class. This is the analogue toPercentIn{Class}BeforeFS using unique tokens as the basis for the information model.
• (2) %Favoring{Class}BeforeFSOf all words occurring in the training set, the percentage of words in a document that occurred more times inexamples belonging to the class than in examples not belonging to the class. This is essentially a rough statisticfor an unnormalized unigram model (tied slightly into the smoothing related variables discussed above) thatgives a very rough sense of the evidential weight of the original document.
• (2) U%Favoring{Class}BeforeFSOf all words occurring in the training set, the percentage of unique words in a document that occurred moretimes in examples belonging to the class than in examples not belonging to the class. This is the analogue to%Favoring{Class}BeforeFS.
A.2.2 Type 2: Information loss or mismatch between representations
There are 12 reliability indicator variables whose primary type is considered to be this type. While each of thesevariables are a measure of loss of information, they all generally have a paired variable of Type 1 that together give amore direct measure of information loss.
• (1) DocumentLengthAfterFSThe number of words in a document after out-of-vocabulary words have been removed and feature selection wasperformed. Similar to DocumentLength, this is the measure of information that the classifier actually sees withrespect to this document. Currently, it’s assumed the metaclassifier can combine this with DocumentLength toinfer information loss.
• (1) UniqueAfterFSThe number of unique words remaining in a document after out-of-vocabulary words have been removed andfeature selection was performed. This is the distinct token analogue of DocumentLengthAfterFS and is similarlyexpected to be used in conjunction with NumUniqueWords as a gauge of information loss.
• (1) PercentRemovedThe percentage of a document that was discarded because it was out-of-vocabulary or removed by featureselection. It can have high variance for short documents. The intuition is that reliability of a classifier is higherfor low values of PercentRemoved.
• (1) UniquePercentRemovedThe percentage of unique words in a document that were discarded because they were out-of-vocabulary orremoved by feature selection. The distinct token analogue of PercentRemoved where the information model isunique words.
21
• (2) PercentIn{Class}AfterFSOf all words occurring in the training set, the percentage of words remaining in a document after feature selectionthat occurred at least once in examples in the class. Together with PercentIn{Class}BeforeFS, allows the modelto inductively model shift in information content because of feature selection.
• (2) UpercentIn{Class}AfterFSOf all words occurring in the training set, the percentage of unique words remaining in a document (afterfeature selection) that occurred at least once in the class. Again, this is expected to be used in conjunction withUpercentIn{Class}BeforeFS to model information loss.
• (2) %Favoring{Class}AfterFSOf all words occurring in the training set, the percentage of words remaining in a document (after featureselection) that occurred more times in examples in the class than in examples not in the class. Like its BeforeFScounterpart, it is essentially like an unnormalized unigram model. We expect that it can be used in conjunctionwith %Favoring{Class}BeforeFS to measure how a feature selection method may have biased the informationfor a given document toward a particular class.
• (2) U%Favoring{Class}AfterFSOf all words occurring in the training set, the percentage of distinct words remaining in a document after featureselection that occurred more times in examples in the class than examples not in the class.
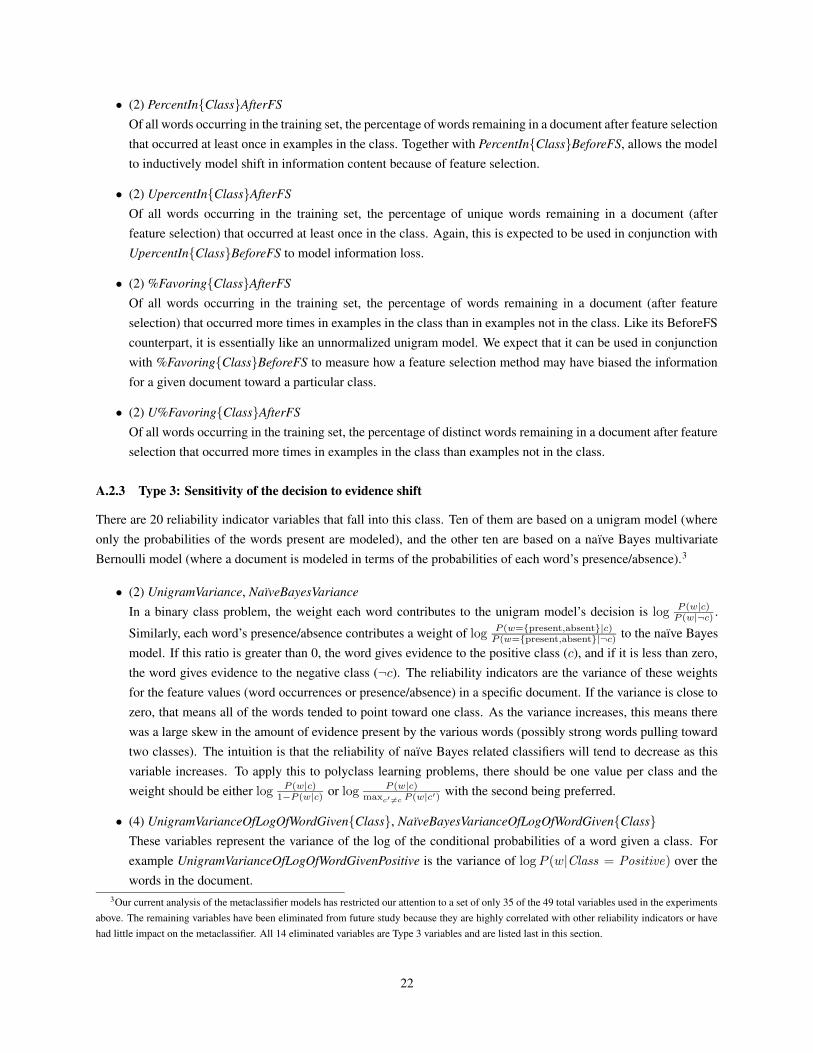
A.2.3 Type 3: Sensitivity of the decision to evidence shift
There are 20 reliability indicator variables that fall into this class. Ten of them are based on a unigram model (whereonly the probabilities of the words present are modeled), and the other ten are based on a naıve Bayes multivariateBernoulli model (where a document is modeled in terms of the probabilities of each word’s presence/absence).3
• (2) UnigramVariance, NaıveBayesVarianceIn a binary class problem, the weight each word contributes to the unigram model’s decision is log P (w|c)
P (w|¬c) .
Similarly, each word’s presence/absence contributes a weight of log P (w={present,absent}|c)P (w={present,absent}|¬c) to the naıve Bayes
model. If this ratio is greater than 0, the word gives evidence to the positive class (c), and if it is less than zero,the word gives evidence to the negative class (¬c). The reliability indicators are the variance of these weightsfor the feature values (word occurrences or presence/absence) in a specific document. If the variance is close tozero, that means all of the words tended to point toward one class. As the variance increases, this means therewas a large skew in the amount of evidence present by the various words (possibly strong words pulling towardtwo classes). The intuition is that the reliability of naıve Bayes related classifiers will tend to decrease as thisvariable increases. To apply this to polyclass learning problems, there should be one value per class and theweight should be either log P (w|c)
1−P (w|c) or log P (w|c)maxc′ 6=c P (w|c′) with the second being preferred.
• (4) UnigramVarianceOfLogOfWordGiven{Class}, NaıveBayesVarianceOfLogOfWordGiven{Class}These variables represent the variance of the log of the conditional probabilities of a word given a class. Forexample UnigramVarianceOfLogOfWordGivenPositive is the variance of logP (w|Class = Positive) over thewords in the document.
3Our current analysis of the metaclassifier models has restricted our attention to a set of only 35 of the 49 total variables used in the experimentsabove. The remaining variables have been eliminated from future study because they are highly correlated with other reliability indicators or havehad little impact on the metaclassifier. All 14 eliminated variables are Type 3 variables and are listed last in this section.
22

• (4) UnigramMeanOfWordGiven{Class}, NaıveBayesMeanOfWordGiven{Class}These variables represent the mean of the conditional probabilities of a word given a class. For example Uni-gramMeanOfWordGivenPositive is the mean of P (w|Class = Positive) over the words in the document. Noneof these variables had much impact on the metaclassifier model and have been eliminated from future study asa result.
• (4) UnigramMeanOfLogOfWordGiven{Class}, NaıveBayesMeanOfLogOfWordGiven{Class}These variables represent the mean of the conditional probabilities of a word given a class. For example Uni-gramMeanOfLogOfWordGivenPositive is the mean of logP (w|Class = Positive) over the words in the docu-ment. This essentially provides a log scaling of the variables (UnigramMeanOfWordGiven{Class}, NaıveBayesMean-OfWordGiven{Class}) described above and is only a factor if the metaclassifier is sensitive to the scaling. Noneof these variables had much impact on the metaclassifier model and have been eliminated from future study asa result.
• (4) UnigramVarianceOfWordGiven{Class}, NaıveBayesVarianceOfWordGiven{Class}These variables represent the variance of the log of the conditional probabilities of a word given a class. Forexample UnigramVarianceOfWordGivenPositive is the variance of P (w|Class = Positive) over the wordsin the document. This essentially provides a log scaling of the variables (UnigramVarianceOfLogOfWord-Given{Class}, NaıveBayesVarianceOfLogOfWordGiven{Class}) described in the Type 3 section and is onlya factor if the metaclassifier is sensitive to the scaling. We have found that the metaclassifiers have not beensensitive to this scaling, and these variables have been eliminated from future study while their counterparts arebeing retained.
• (2) UnigramMeanOfLogOfRatioOfWordGivenClass, NaıveBayesMeanOfLogOfRatioOfWordGivenClassIn a binary class problem, the weight each word contributes to the unigram model’s decision is log P (w|c)
P (w|¬c) .
Similarly, each word’s presence/absence contributes a weight of log P (w={present,absent}|c)P (w={present,absent}|¬c) to the naıve Bayes
model. If this ratio is greater than 0, the word gives evidence to the positive class (c), and if it is less thanzero, the word gives evidence to the negative class (¬c). The reliability indicators are the mean of these weightsfor the feature values (word occurrences or presence/absence) in a specific document. These variables are beingeliminated from future study because their information is highly correlated with the output scores of the unigramand naıve Bayes classifiers.
A.2.4 Type 4: Basic voting statistics
There are 2 reliability indicator variables whose primary type is considered to be this type. Both of these wereintroduced mainly to reduce the data required to learn m-of-n rules in the decision tree metaclassifier.
• (1) PercentPredictingPositiveWe refer to this in the main text as NumVotingForClass. This variable is the percentage of base classifiers (outof all base classifiers) that vote for membership in the class. In our experimental evaluation, we only used oneinstantiation of this variable. This was added to help the search space since learning this m-of-n type of featurecan require significant data for a decision tree learning algorithm (unless it is specifically altered for this).
• (1) PercentAgreeWBestThis variable is referred to as PercentAgreement in the main text. For polyclass problems, PercentAgreement canbe used to indicate how many classes the classifiers fracture their votes among. Since there are only two classes
23

here, we altered it to indicate the percent agreement with the best base classifier (the classifier that performedbest over the training data).
24
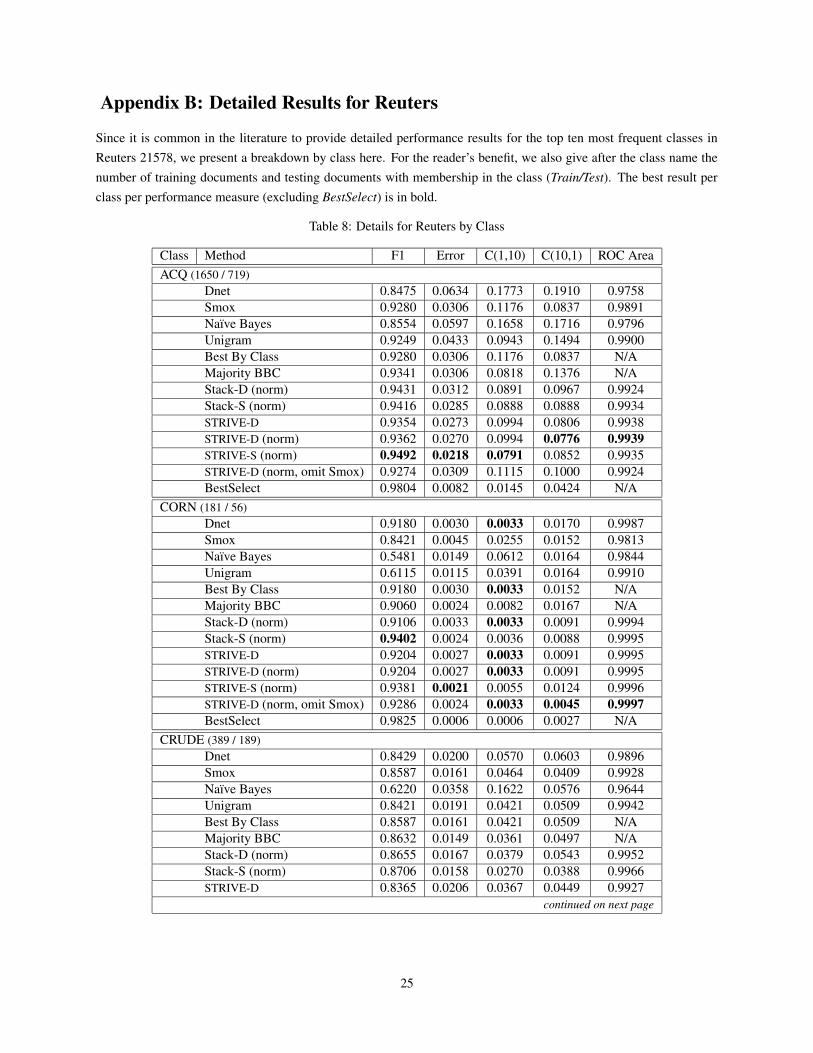
Appendix B: Detailed Results for Reuters
Since it is common in the literature to provide detailed performance results for the top ten most frequent classes inReuters 21578, we present a breakdown by class here. For the reader’s benefit, we also give after the class name thenumber of training documents and testing documents with membership in the class (Train/Test). The best result perclass per performance measure (excluding BestSelect) is in bold.
Table 8: Details for Reuters by Class
Class Method F1 Error C(1,10) C(10,1) ROC AreaACQ (1650 / 719)
Dnet 0.8475 0.0634 0.1773 0.1910 0.9758Smox 0.9280 0.0306 0.1176 0.0837 0.9891Naıve Bayes 0.8554 0.0597 0.1658 0.1716 0.9796Unigram 0.9249 0.0433 0.0943 0.1494 0.9900Best By Class 0.9280 0.0306 0.1176 0.0837 N/AMajority BBC 0.9341 0.0306 0.0818 0.1376 N/AStack-D (norm) 0.9431 0.0312 0.0891 0.0967 0.9924Stack-S (norm) 0.9416 0.0285 0.0888 0.0888 0.9934STRIVE-D 0.9354 0.0273 0.0994 0.0806 0.9938STRIVE-D (norm) 0.9362 0.0270 0.0994 0.0776 0.9939STRIVE-S (norm) 0.9492 0.0218 0.0791 0.0852 0.9935STRIVE-D (norm, omit Smox) 0.9274 0.0309 0.1115 0.1000 0.9924BestSelect 0.9804 0.0082 0.0145 0.0424 N/A
CORN (181 / 56)Dnet 0.9180 0.0030 0.0033 0.0170 0.9987Smox 0.8421 0.0045 0.0255 0.0152 0.9813Naıve Bayes 0.5481 0.0149 0.0612 0.0164 0.9844Unigram 0.6115 0.0115 0.0391 0.0164 0.9910Best By Class 0.9180 0.0030 0.0033 0.0152 N/AMajority BBC 0.9060 0.0024 0.0082 0.0167 N/AStack-D (norm) 0.9106 0.0033 0.0033 0.0091 0.9994Stack-S (norm) 0.9402 0.0024 0.0036 0.0088 0.9995STRIVE-D 0.9204 0.0027 0.0033 0.0091 0.9995STRIVE-D (norm) 0.9204 0.0027 0.0033 0.0091 0.9995STRIVE-S (norm) 0.9381 0.0021 0.0055 0.0124 0.9996STRIVE-D (norm, omit Smox) 0.9286 0.0024 0.0033 0.0045 0.9997BestSelect 0.9825 0.0006 0.0006 0.0027 N/A
CRUDE (389 / 189)Dnet 0.8429 0.0200 0.0570 0.0603 0.9896Smox 0.8587 0.0161 0.0464 0.0409 0.9928Naıve Bayes 0.6220 0.0358 0.1622 0.0576 0.9644Unigram 0.8421 0.0191 0.0421 0.0509 0.9942Best By Class 0.8587 0.0161 0.0421 0.0509 N/AMajority BBC 0.8632 0.0149 0.0361 0.0497 N/AStack-D (norm) 0.8655 0.0167 0.0379 0.0543 0.9952Stack-S (norm) 0.8706 0.0158 0.0270 0.0388 0.9966STRIVE-D 0.8365 0.0206 0.0367 0.0449 0.9927
continued on next page
25

continued from previous pageClass Method F1 Error C(1,10) C(10,1) ROC Area
STRIVE-D (norm) 0.8365 0.0206 0.0367 0.0449 0.9927STRIVE-S (norm) 0.8737 0.0145 0.0252 0.0239 0.9976STRIVE-D (norm, omit Smox) 0.8333 0.0170 0.0309 0.0443 0.9944BestSelect 0.9764 0.0027 0.0079 0.0306 N/A
EARN (2877 / 1087)Dnet 0.9529 0.0315 0.0867 0.0479 0.9959Smox 0.9790 0.0139 0.0458 0.0500 0.9951Naıve Bayes 0.9348 0.0373 0.3383 0.0415 0.9687Unigram 0.9617 0.0249 0.1949 0.0394 0.9837Best By Class 0.9790 0.0139 0.0458 0.0500 N/AMajority BBC 0.9751 0.0158 0.0549 0.0373 N/AStack-D (norm) 0.9794 0.0136 0.0512 0.0336 0.9978Stack-S (norm) 0.9798 0.0133 0.0476 0.0491 0.9978STRIVE-D 0.9786 0.0142 0.0527 0.0312 0.9982STRIVE-D (norm) 0.9750 0.0167 0.0530 0.0312 0.9981STRIVE-S (norm) 0.9793 0.0136 0.0455 0.0367 0.9989STRIVE-D (norm, omit Smox) 0.9665 0.0221 0.0643 0.0470 0.9969BestSelect 0.9954 0.0030 0.0070 0.0130 N/A
GRAIN (433 / 149)Dnet 0.8797 0.0085 0.0388 0.0258 0.9842Smox 0.9342 0.0061 0.0264 0.0197 0.9853Naıve Bayes 0.7205 0.0261 0.0737 0.0436 0.9877Unigram 0.8148 0.0164 0.0446 0.0330 0.9900Best By Class 0.9342 0.0061 0.0264 0.0197 N/AMajority BBC 0.9161 0.0061 0.0215 0.0239 N/AStack-D (norm) 0.9384 0.0055 0.0158 0.0197 0.9919Stack-S (norm) 0.9338 0.0061 0.0161 0.0173 0.9950STRIVE-D 0.9129 0.0076 0.0285 0.0197 0.9916STRIVE-D (norm) 0.9129 0.0076 0.0224 0.0197 0.9917STRIVE-S (norm) 0.9352 0.0058 0.0164 0.0152 0.9882STRIVE-D (norm, omit Smox) 0.9054 0.0085 0.0318 0.0139 0.9914BestSelect 0.9703 0.0012 0.0061 0.0055 N/A
INTEREST (347 / 131)Dnet 0.5249 0.0318 0.1337 0.0452 0.9645Smox 0.7470 0.0224 0.0997 0.0330 0.9597Naıve Bayes 0.5059 0.0358 0.1367 0.0412 0.9635Unigram 0.6471 0.0315 0.0773 0.0388 0.9840Best By Class 0.7470 0.0224 0.0997 0.0412 N/AMajority BBC 0.6807 0.0261 0.0846 0.0382 N/AStack-D (norm) 0.7470 0.0255 0.0843 0.0382 0.9806Stack-S (norm) 0.7530 0.0227 0.0967 0.0364 0.9827STRIVE-D 0.6933 0.0236 0.0906 0.0409 0.9804STRIVE-D (norm) 0.6933 0.0236 0.0906 0.0382 0.9804STRIVE-S (norm) 0.7737 0.0188 0.0655 0.0303 0.9888STRIVE-D (norm, omit Smox) 0.6553 0.0273 0.1115 0.0385 0.9759BestSelect 0.8755 0.0155 0.0155 0.0282 N/A
MONEY-FX (538 / 179)continued on next page
26
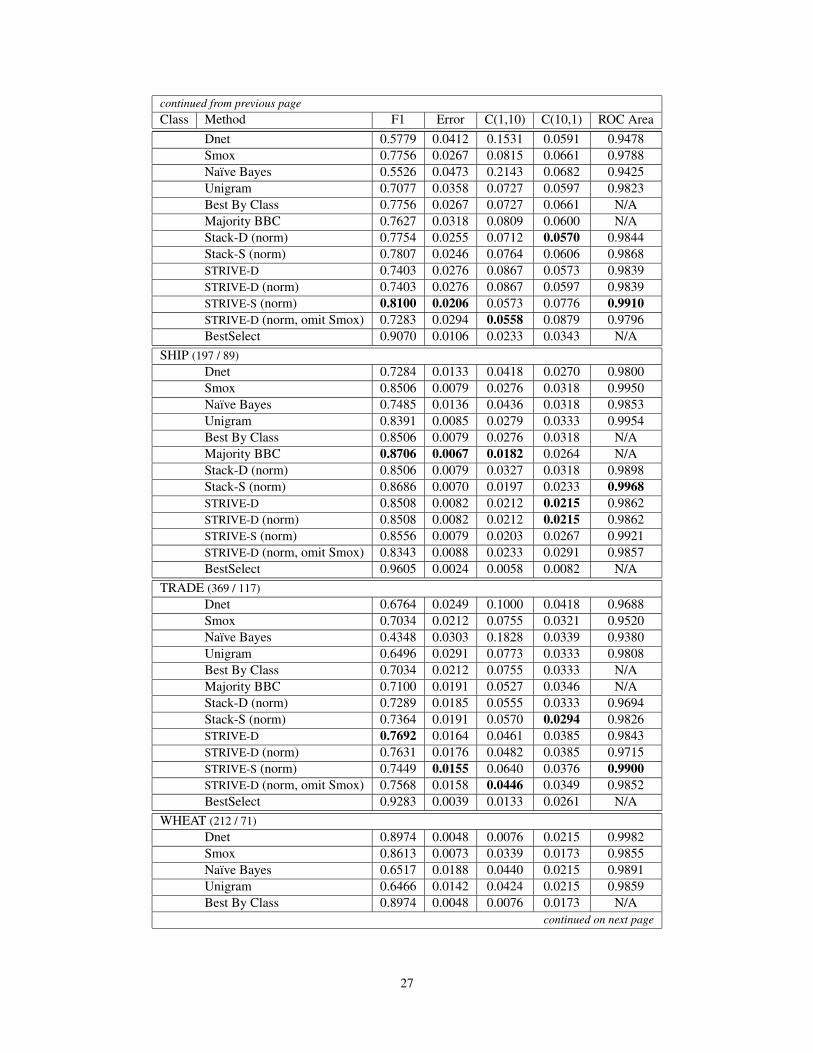
continued from previous pageClass Method F1 Error C(1,10) C(10,1) ROC Area
Dnet 0.5779 0.0412 0.1531 0.0591 0.9478Smox 0.7756 0.0267 0.0815 0.0661 0.9788Naıve Bayes 0.5526 0.0473 0.2143 0.0682 0.9425Unigram 0.7077 0.0358 0.0727 0.0597 0.9823Best By Class 0.7756 0.0267 0.0727 0.0661 N/AMajority BBC 0.7627 0.0318 0.0809 0.0600 N/AStack-D (norm) 0.7754 0.0255 0.0712 0.0570 0.9844Stack-S (norm) 0.7807 0.0246 0.0764 0.0606 0.9868STRIVE-D 0.7403 0.0276 0.0867 0.0573 0.9839STRIVE-D (norm) 0.7403 0.0276 0.0867 0.0597 0.9839STRIVE-S (norm) 0.8100 0.0206 0.0573 0.0776 0.9910STRIVE-D (norm, omit Smox) 0.7283 0.0294 0.0558 0.0879 0.9796BestSelect 0.9070 0.0106 0.0233 0.0343 N/A
SHIP (197 / 89)Dnet 0.7284 0.0133 0.0418 0.0270 0.9800Smox 0.8506 0.0079 0.0276 0.0318 0.9950Naıve Bayes 0.7485 0.0136 0.0436 0.0318 0.9853Unigram 0.8391 0.0085 0.0279 0.0333 0.9954Best By Class 0.8506 0.0079 0.0276 0.0318 N/AMajority BBC 0.8706 0.0067 0.0182 0.0264 N/AStack-D (norm) 0.8506 0.0079 0.0327 0.0318 0.9898Stack-S (norm) 0.8686 0.0070 0.0197 0.0233 0.9968STRIVE-D 0.8508 0.0082 0.0212 0.0215 0.9862STRIVE-D (norm) 0.8508 0.0082 0.0212 0.0215 0.9862STRIVE-S (norm) 0.8556 0.0079 0.0203 0.0267 0.9921STRIVE-D (norm, omit Smox) 0.8343 0.0088 0.0233 0.0291 0.9857BestSelect 0.9605 0.0024 0.0058 0.0082 N/A
TRADE (369 / 117)Dnet 0.6764 0.0249 0.1000 0.0418 0.9688Smox 0.7034 0.0212 0.0755 0.0321 0.9520Naıve Bayes 0.4348 0.0303 0.1828 0.0339 0.9380Unigram 0.6496 0.0291 0.0773 0.0333 0.9808Best By Class 0.7034 0.0212 0.0755 0.0333 N/AMajority BBC 0.7100 0.0191 0.0527 0.0346 N/AStack-D (norm) 0.7289 0.0185 0.0555 0.0333 0.9694Stack-S (norm) 0.7364 0.0191 0.0570 0.0294 0.9826STRIVE-D 0.7692 0.0164 0.0461 0.0385 0.9843STRIVE-D (norm) 0.7631 0.0176 0.0482 0.0385 0.9715STRIVE-S (norm) 0.7449 0.0155 0.0640 0.0376 0.9900STRIVE-D (norm, omit Smox) 0.7568 0.0158 0.0446 0.0349 0.9852BestSelect 0.9283 0.0039 0.0133 0.0261 N/A
WHEAT (212 / 71)Dnet 0.8974 0.0048 0.0076 0.0215 0.9982Smox 0.8613 0.0073 0.0339 0.0173 0.9855Naıve Bayes 0.6517 0.0188 0.0440 0.0215 0.9891Unigram 0.6466 0.0142 0.0424 0.0215 0.9859Best By Class 0.8974 0.0048 0.0076 0.0173 N/A
continued on next page
27
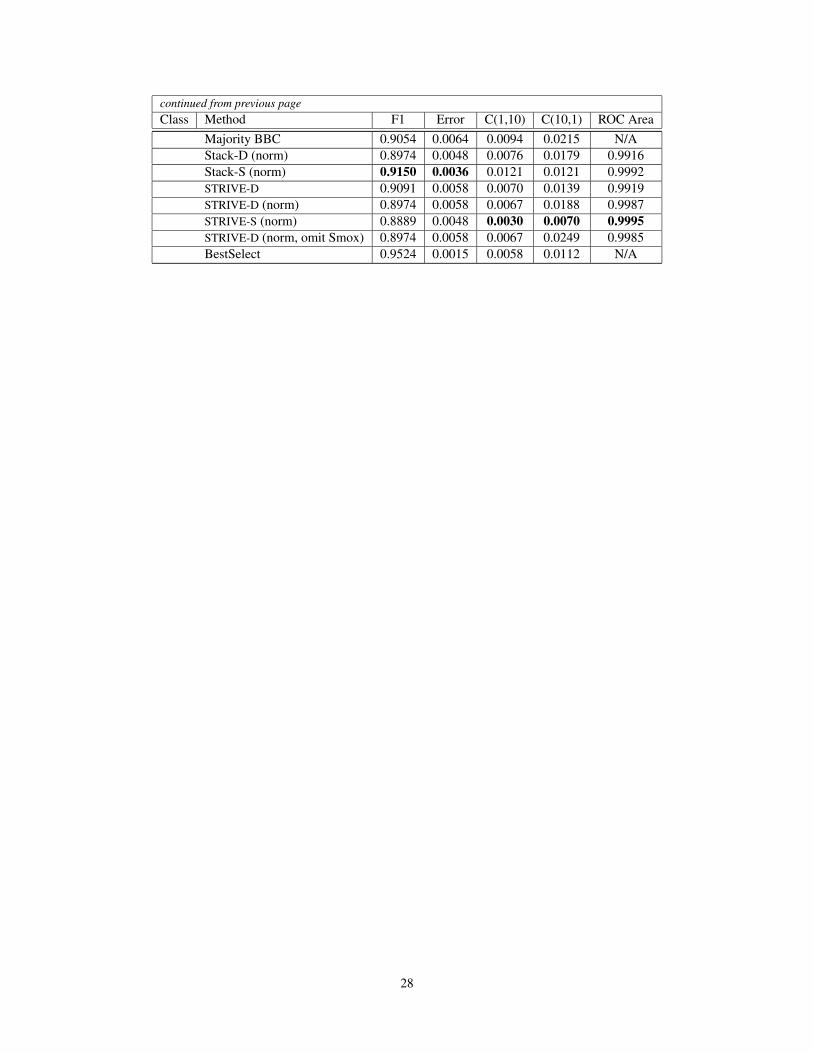
continued from previous pageClass Method F1 Error C(1,10) C(10,1) ROC Area
Majority BBC 0.9054 0.0064 0.0094 0.0215 N/AStack-D (norm) 0.8974 0.0048 0.0076 0.0179 0.9916Stack-S (norm) 0.9150 0.0036 0.0121 0.0121 0.9992STRIVE-D 0.9091 0.0058 0.0070 0.0139 0.9919STRIVE-D (norm) 0.8974 0.0058 0.0067 0.0188 0.9987STRIVE-S (norm) 0.8889 0.0048 0.0030 0.0070 0.9995STRIVE-D (norm, omit Smox) 0.8974 0.0058 0.0067 0.0249 0.9985BestSelect 0.9524 0.0015 0.0058 0.0112 N/A
28

References
Al-Kofahi K, Tyrrell A, Vacher A, Travers T and Jackson P (2001) Combining multiple classifiers for text categoriza-tion. In CIKM ’01, Proceedings of the 10th ACM Conference on Information and Knowledge Management. pp.97–104.
Bartell BT, Cottrell GW and Belew RK (1994) Automatic combination of multiple ranked retrieval systems. In SIGIR’94, Proceedings of the 17th Annual International ACM Conference on Research and Development in InformationRetrieval. pp. 173–181.
Belkin N, Cool C, Croft W and Callan J (1993) The effect of multiple query representations on information retrievalsystem performance. In SIGIR ’93, Proceedings of the 16th Annual International ACM Conference on Researchand Development in Information Retrieval. pp. 339–346.
Bennett PN, Dumais ST and Horvitz E (2002) Probabilistic combination of text classifiers using reliability indicators:Models and results. In SIGIR ’02, Proceedings of the 25th Annual International ACM Conference on Research andDevelopment in Information Retrieval. pp. 207–214.
Bennett PN, Dumais ST and Horvitz E (2003) Inductive transfer for text classification using generalized reliabilityindicators. In Working Notes of ICML ’03 (The 20th International Conference on Machine Learning), Workshop onThe Continuum from Labeled to Unlabeled Data. pp. 72–79.
Chickering D, Heckerman D and Meek C (1997) A Bayesian approach to learning Bayesian networks with localstructure. In UAI ’97, Proceedings of the 13th Conference on Uncertainty in Artificial Intelligence. pp. 80–89.
Dietterich T (2000) Ensemble methods. In MCS ’00, Proceedings of the 1st International Workshop on MultipleClassifier Systems. Springer. pp. 1–15.
Duda R, Hart P and Stork D (2001) Pattern classification. New York, NY: John Wiley & Sons, Inc.
Dumais ST and Chen H (2000) Hierarchical classification of web content. In SIGIR ’00, Proceedings of the 23rdAnnual International ACM Conference on Research and Development in Information Retrieval. pp. 256–263.
Dumais ST, Platt J, Heckerman D and Sahami M (1998) Inductive learning algorithms and representations for textcategorization. In CIKM ’98, Proceedings of the 7th ACM Conference on Information and Knowledge Management.pp. 148–155.
Gama J (1998a) Combining classifiers by constructive induction. In ECML ’98, Proceedings of the 10th EuropeanConference on Machine Learning. pp. 178–189.
Gama J (1998b) Local cascade generalization. In ICML ’98, Proceedings of the 15th International Conference onMachine Learning. pp. 206–214.
Heckerman D, Chickering D, Meek C, Rounthwaite R and Kadie C (2000) Dependency networks for inference, col-laborative filtering, and data visualization. Journal of Machine Learning Research, 1:49–75.
Hersh W, Buckley C, Leone T and Hickam D (1994) OHSUMED: An interactive retrieval evaluation and new large testcollection for research. In SIGIR ’94, Proceedings of the 17th Annual International ACM Conference on Researchand Development in Information Retrieval. pp. 192–201.
29
Horvitz E, Breese J and Henrion M (1988) Decision theory in expert systems and artificial intelligence. InternationalJournal of Approximate Reasoning, Special Issue on Uncertain Reasoning, 2:247–302.
Horvitz E, Jacobs A and Hovel D (1999) Attention-sensitive alerting. In UAI ’99, Proceedings of the 15th Conferenceon Uncertainty in Artificial Intelligence. pp. 305–313.
Hull D, Pedersen J and Schuetze H (1996) Method combination for document filtering. In SIGIR ’96, Proceedingsof the 19th Annual International ACM Conference on Research and Development in Information Retrieval. pp.279–287.
Joachims T (1998) Text categorization with support vector machines: Learning with many relevant features. In ECML’98, Proceedings of the 10th European Conference on Machine Learning. pp. 137–142.
Kargupta H and Chan P, eds. (2000) Advances in distributed and parallel knowledge discovery. Cambridge, Mas-sachusetts: AAAI Press/MIT Press.
Katzer J, McGill M, Tessier J, Frakes W and DasGupta P (1982) A study of the overlap among document representa-tions. Information Technology: Research and Development, 1:261–274.
Kessler B, Nunberg G and Schutze H (1997) Automatic detection of text genre. In ACL ’97, Proceedings of the 35thAnnual Meeting of the Association for Computational Linguistics. pp. 32–38.
Klein LA (1999) Sensor and data fusion concepts and applications. Society of Photo-optical Instrumentation Engi-neers. 2nd edition.
Lam W and Lai KY (2001) A meta-learning approach for text categorization. In SIGIR ’01, Proceedings of the 24thAnnual International ACM Conference on Research and Development in Information Retrieval. pp. 303–309.
Larkey LS and Croft WB (1996) Combining classifiers in text categorization. In SIGIR ’96, Proceedings of the 19thAnnual International ACM Conference on Research and Development in Information Retrieval. pp. 289–297.
Lewis DD (1995) A sequential algorithm for training text classifiers: Corrigendum and additional data. ACM SIGIRForum, 29(2):13–19.
Lewis DD (1997) Reuters-21578, distribution 1.0. http://www.daviddlewis.com/resources/testcollections-/reuters21578 (visited 2002).
Lewis DD and Gale WA (1994) A sequential algorithm for training text classifiers. In SIGIR ’94, Proceedings of the17th Annual International ACM Conference on Research and Development in Information Retrieval. pp. 3–12.
Lewis DD, Schapire RE, Callan JP and Papka R (1996) Training algorithms for linear text classifiers. In SIGIR’96, Proceedings of the 19th Annual International ACM Conference on Research and Development in InformationRetrieval. pp. 298–306.
Li Y and Jain A (1998) Classification of text documents. The Computer Journal, 41(8):537–546.
McCallum A and Nigam K (1998) A comparison of event models for naive bayes text classification. In Working Notesof AAAI ’98 (The 15th National Conference on Artificial Intelligence), Workshop on Learning for Text Categoriza-tion. pp. 41–48.
30
Nigam K, Lafferty J and McCallum A (1999) Using maximum entropy for text classification. In Working Notes ofIJCAI ’99 (The 16th International Joint Conference on Artificial Intelligence), Workshop on Machine Learning forInformation Filtering. pp. 61–67.
Platt JC (1999a) Fast training of support vector machines using sequential minimal optimization. In Scholkopf B,Burges C and Smola A, eds. Advances in kernel methods - support vector learning. MIT Press. pp. 185–208.
Platt JC (1999b) Probabilistic outputs for support vector machines and comparisons to regularized likelihood methods.In Smola AJ, Bartlett P, Scholkopf B and Schuurmans D, eds. Advances in large margin classifiers. MIT Press. pp.61–74.
Provost F and Fawcett T (2001) Robust classification for imprecise environments. Machine Learning, 42:203–231.
Rajashekar T and Croft W (1995) Combining automatic and manual index representations in probabilistic retrieval.Journal of the American Society for Information Science, 6(4):272–283.
Sahami M, Dumais S, Heckerman D and Horvitz E (1998) A bayesian approach to filtering junk e-mail. In Work-ing Notes of AAAI ’98 (The 15th National Conference on Artificial Intelligence), Workshop on Learning for TextCategorization. pp. 55–62.
Schapire RE and Singer Y (2000) BoosTexter: A boosting-based system for text categorization. Machine Learning,39:135–168.
Sebastiani F (2002) Machine learning in automated text categorization. ACM Computing Surveys, 34(1):1–47.
Shaw J and Fox E (1995) Combination of multiple searches. In TREC-3, Proceedings of the 3rd Text REtrievalConference. pp. 105–108.
Ting K and Witten I (1999) Issues in stacked generalization. Journal of Artificial Intelligence Research, 10:271–289.
Toyama K and Horvitz E (2000) Bayesian modality fusion: Probabilistic integration of multiple vision algorithms forhead tracking. In ACCV 2000, Proceedings of the 4th Asian Conference on Computer Vision.
van Rijsbergen CJ (1979) Information retrieval. Butterworths, London.
Weiss S, Apte C, Damerau F, Johnson D, Oles F, Goetz T and Hampp T (1999) Maximizing text-mining performance.IEEE Intelligent Systems, 14(4):63–69.
WinMine Toolkit v1.0, http://research.microsoft.com/˜dmax/WinMine/ContactInfo.html (visited 2002). MicrosoftCorporation.
Wolpert DH (1992) Stacked generalization. Neural Networks, 5:241–259.
Yang Y, Ault T and Pierce T (2000) Combining multiple learning strategies for effective cross validation. In ICML’00, Proceedings of the 17th International Conference on Machine Learning. pp. 1167–1182.
Yang Y and Liu X (1999) A re-examination of text categorization methods. In SIGIR ’99, Proceedings of the 22ndAnnual International ACM Conference on Research and Development in Information Retrieval. pp. 42–49.
Zhang T and Oles FJ (2001) Text categorization based on regularized linear classification methods. InformationRetrieval, 4:5–31.
31