the coeval of starburst and bh growing
DESCRIPTION
The Coeval of Starburst and BH Growing. X.Y.Xia Tianjin Normal University, China. Outline. The Relation of Bulge and BH ( M-σ 关系 ) Ferrarese & Merrit , 2000 , Tremaine et al. 2002 The Star Formation History and Distribution of QSOs - PowerPoint PPT PresentationTRANSCRIPT

The Coeval of Starburst and BH Growing
X.Y.Xia
Tianjin Normal University, China

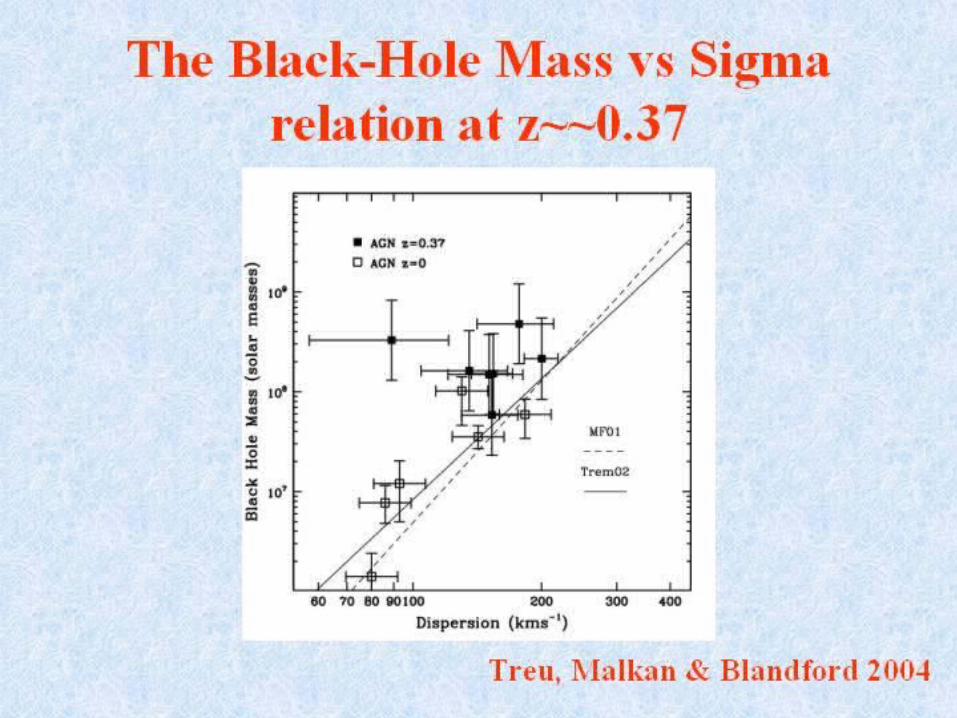
Outline• The Relation of Bulge and BH ( M-σ 关系 ) Ferrarese & Merrit , 2000 , Tremaine et al. 2002
• The Star Formation History and Distribution of QSOs
星系中心黑洞的增长与星系核球中恒星的形成过程的紧密联系。这使人们开始认识到星系的形成过程与星系中心黑洞的增长、与星系核的活动密切相关,即星系中心的黑洞参与并影响了其“宿主”星系的演化过程(Heckman et al. 2004; Springel et al. )
• 星系相互作用和并合的观测证据• 星暴和 AGN


Galaxy Structure Flat disk: •1011 stars (Pop.I)• ISM (gas, dust) • 5% of the Galaxy mass, 90% of the visible light • Active star formation since 10 Gyr.
Central bulge:• moderately old stars with low specific angular momentum. • Wide range of metallicity• Triaxial shape (central bar)• Central supermassive BH
Stellar Halo• 109 old and metal poor stars (Pop.II)• 150 globular clusters (13 Gyr)• <0.2% Galaxy mass, 2% of the light•Dark Halo

M 关系对超重质量黑洞进行观测的一个重要结果发现,星系超重质量黑洞质量与星系核球光度很好地相关, 但与整个星系性质 ( 如,光度 ) 不相关。

黑洞质量与星系核球质量有很好的相关


Galactic Cannibalism Computer Simulation

Outline• The Relation of Bulge and BH ( M-σ 关系 ) Ferrarese & Merrit , 2000 , Tremaine et al. 2002
• The Star Formation History and Distribution of QSOs
星系中心黑洞的增长与星系核球中恒星的形成过程的紧密联系。这使人们开始认识到星系的形成过程与星系中心黑洞的增长、与星系核的活动密切相关,即星系中心的黑洞参与并影响了其“宿主”星系的演化过程(Heckman et al. 2004; Springel et al. )
• 星系相互作用和并合的观测证据• 星暴和 AGN


Outline• The Relation of Bulge and BH ( M-σ 关系 ) Ferrarese & Merrit , 2000 , Tremaine et al. 2002
• The Star Formation History and Distribution of QSOs
星系中心黑洞的增长与星系核球中恒星的形成过程的紧密联系。使人们开始认识到星系的形成过程与星系中心黑洞的增长、与星系核的活动密切相关,即星系中心的黑洞参与并影响了其“宿主”星系的演化过程(Heckman et al. 2004; Springel et al. )
• 星系相互作用和并合的观测证据• 星暴和 AGN

Outline• The Relation of Bulge and BH ( M-σ 关系 ) Ferrarese & Merrit , 2000 , Tremaine et al. 2002
• The Star Formation History and Distribution of QSOs
星系中心黑洞的增长与星系核球中恒星的形成过程的紧密联系。这使人们开始认识到星系的形成过程与星系中心黑洞的增长、与星系核的活动密切相关,即星系中心的黑洞参与并影响了其“宿主”星系的演化过程(Heckman et al. 2004; Springel et al. )
• 星系相互作用和并合的观测证据• 星暴和 AGN


HUDF


CDM - Hierarchical scenario
Springel et al, 2001, MNRAS, 228, 726: high resolution N-body simulation of the evolution of clusters of galaxies


Interacting

worlds collide

Pair

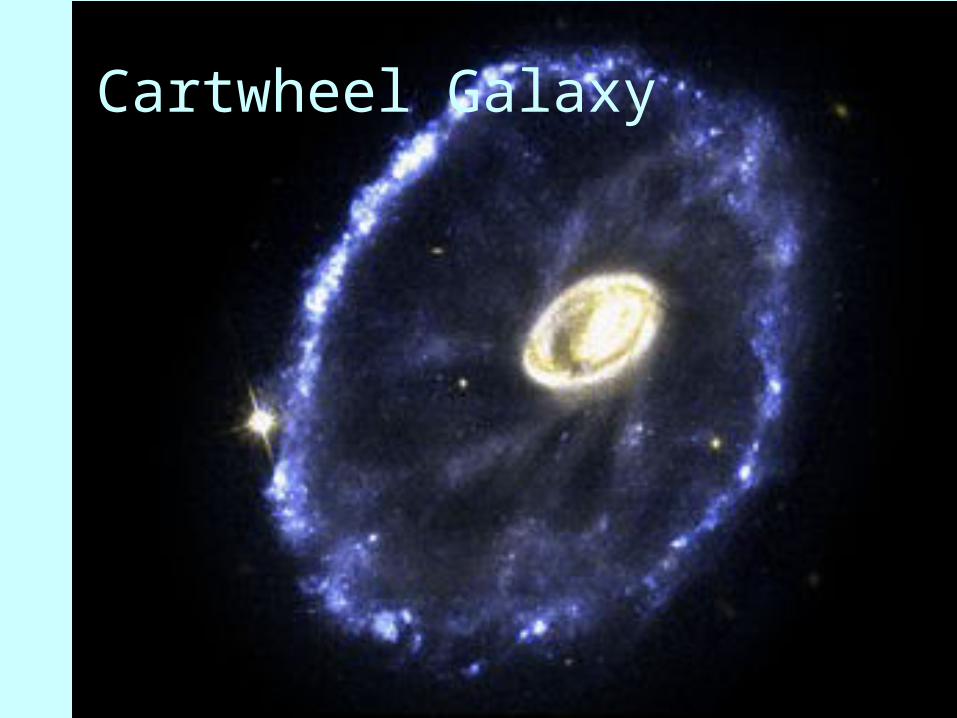
Cartwheel Galaxy


Chandra Image of NGC 6240
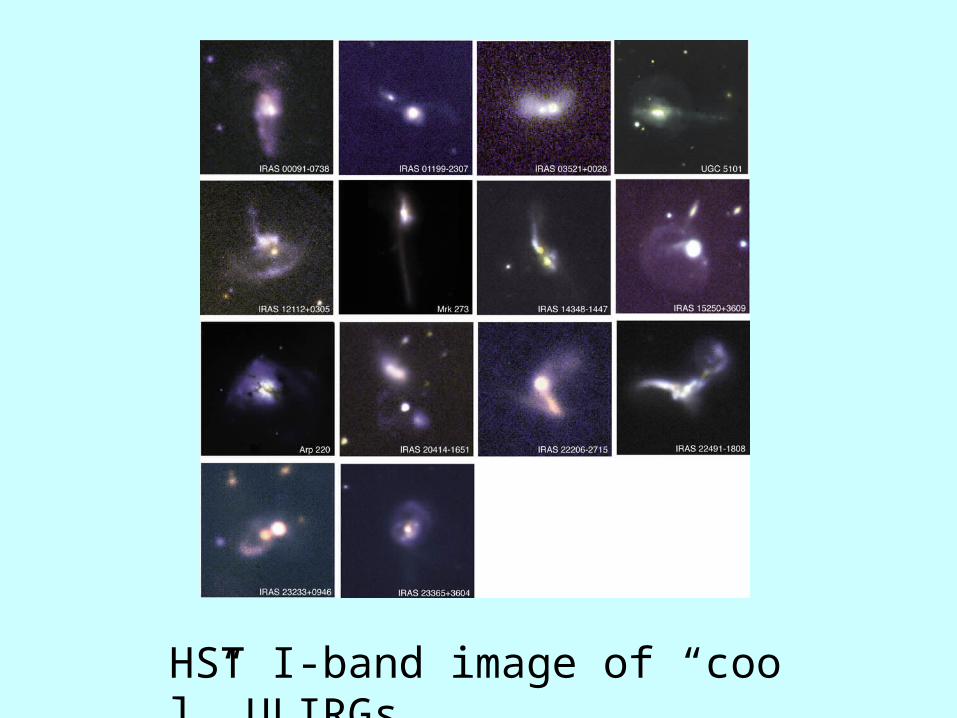
HST I-band image of “cool” ULIRGs


IR 18580+6527

Three galaxies, M81 (big), M82 (medium), and
NGC 3077 (small).
Are they related to one
another?


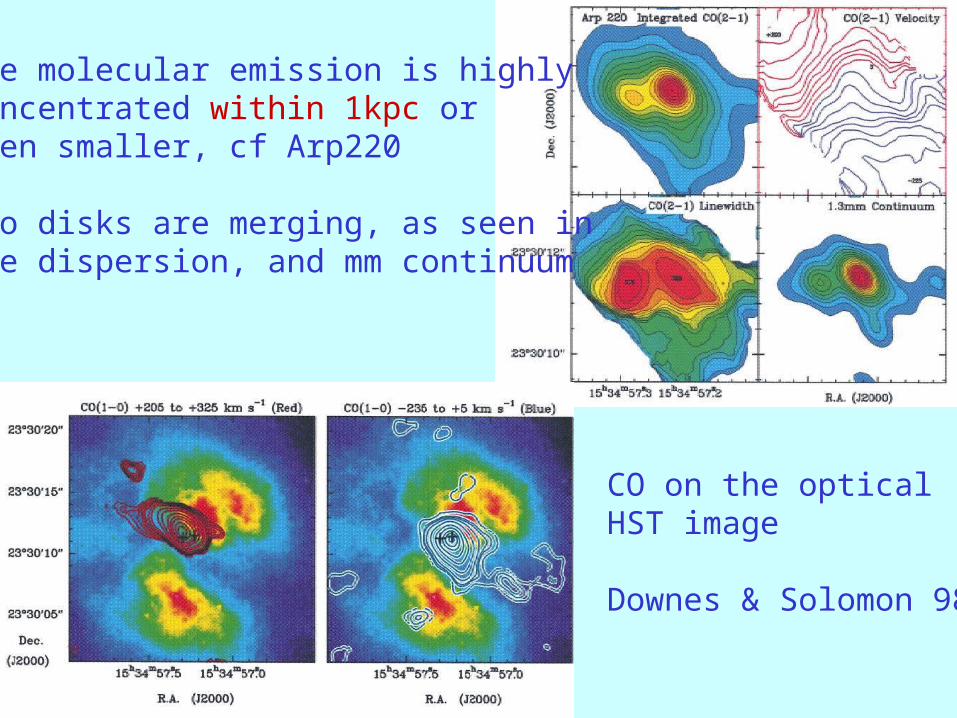
CO on the optical HST image
Downes & Solomon 98
The molecular emission is highlyconcentrated within 1kpc oreven smaller, cf Arp220
Two disks are merging, as seen inthe dispersion, and mm continuum

Mihos & Hernquist 96
Simulations of disk/halo galaxies
Gas and young starsare plotted


Outline• The Relation of Bulge and BH ( M-σ 关系 ) Ferrarese & Merrit , 2000 , Tremaine et al. 2002
• The Star Formation History and Distribution of QSOs
星系中心黑洞的增长与星系核球中恒星的形成过程的紧密联系。这使人们开始认识到星系的形成过程与星系中心黑洞的增长、与星系核的活动密切相关,即星系中心的黑洞参与并影响了其“宿主”星系的演化过程(Heckman et al. 2004; Springel et al. )
• 星系相互作用和并合的观测证据• 星暴和 AGN

Heckman & Kauffman, 2004, based on 23000 SDSS narrow emission line galaxies

The Host Galaxies of IR QSOs Have Same Pofile as Optical QSOs


29.0
11 8.588
yrM
MyrM
SFR
sunsun

Host Galaxies of Nearby QSOs Hutching et al. Astro/ph-0202401

Two components of host galaxies of z=2 QSOs


SMGs: strongest starbursts in the Universe
Giant starbursts at the peak of elliptical formation z ~ 2-3 1-4
At least Ultra-Luminous Infra-Red Galaxies (ULIRGs):
• LFIR >~ 1012 Lo, SFR > 100 Mo/yr
• Relatively rare, but ~1 per arcmin2
• Generally not isolated; strongly biased along high-z Large Scale Structures• Probably progenitors of massive elliptical galaxies
• A few of these objects are powerful QSOs or radiogalaxies MBH >~ 108 Mo
Most exceptional Hyper-Luminous IR Galaxies (HLIRGs):
• LFIR >~ 1013 Lo, SFR ~ 1000 Mo/yr
• Nothing equivalent in the local Universe• Very rare ~1 per 100 arcmin2
• CO already detectable• Probably in most massive DM halos progenitors of central cD galaxies of clusters
• A fraction of them are very powerful QSOs or radiogalaxies MBH >~ 108 Mo

Landmarks and questions of the evolution of most massive galaxiesand associated super-massive black-holes
Final mass 1011 – 1012 Moz ~ 4 - 10Major starbursts in the 1st billion yr at DM density peaks (first LSSs) LBGs & Ly Galaxies SMGs: ULIRGs & HLIRGs ?
1.5 ~< z <~ 3 Peak of starburst SMGs• SCUBA/MAMBO counts• Mergers & pre-clustering ? • CO detection• Detection in Spitzer wide surveys+ Distant Red Galaxies ?
z < 1-1.5 Decline of SMGs mostly passive evolution (+stellar mergers) massive elliptical galaxies + supermassive cD cluster galaxies
Final black-hole mass 108 – 109 Mo
First SMBHs MBH ~ 109 Mo A few most powerful QSOs z=6.4 Fewer Radio Galaxies z >~4
Major phase of SMBH growth Peak of QSO activity• Weak AGN activity in most SMGs• X-absorbed QSOs and Type 2 QSOs• Spitzer IR QSOs ? SMBH mergers ?
Very few powerful QSOsDormant most massive SMBHs
QSO Feedback

from Bertoldi, Voss, WalterLfir = 4x10¹² S250(mJy) Lsun
FIR emission of cold dust (Td ~ 35-50 K) :
- steep submm spectrum - compensates for distance - S practically independent of z from z ~ 0.5 to 10
Effect also known as « negative K correction »
Redshift degeneracy
Dust detection: The Magic of the high-z submm window

SCUBA (+MAMBO) submm counts SCUBA(-radio) redshift distributionChapman, Blain, Ivison, Smail 2003
SCUBA(-MAMBO) census of high-z ULIRGs• Take advantage of steep submm spectrum• Account for most of submm background• z at Keck for radio ones (~50%) (weak AGN ?) History of star formation up to z~3-4• Small but uncertain number at z > 4
Dust detection: the magic of the submm window

Dense gasdensity ~105 cm-3
T ~ 100 Ksize R ~400-1400 pcgaz mass 1-2 1010 Mo
CO detection in QSO SDSS J1148 at z=6.42
Bertoldi et al. 03 PdBI
Walter et al. 03 VLA
Multi-line excitation model
Resolution of CO in 2 sources VLA Walter et al. 04
CO detection in14 high-z QSOs

Molecular Gas in SCUBA submm Galaxies
Greve et al. (2004)
1 < z < 3.5
<M(H2)> = 3.0 1010 Msun
• ~5 times more gas and luminous, than local ULIRGs
• Broad FWHM linewidth
• Complex/interactive environment (+weak AGN)
• Mgas significant fraction of central mass
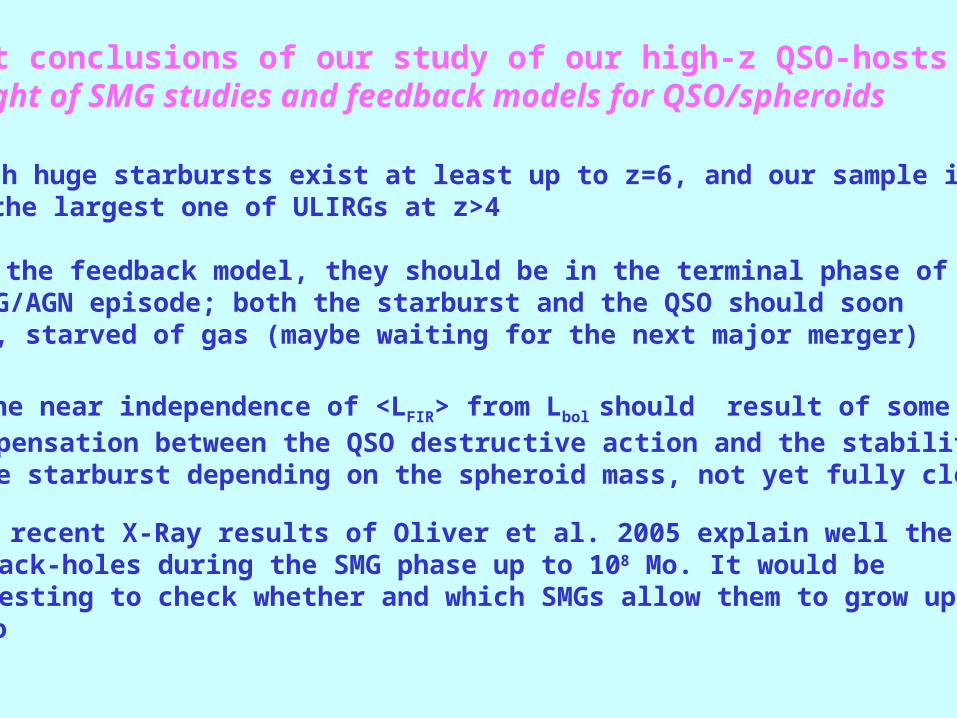
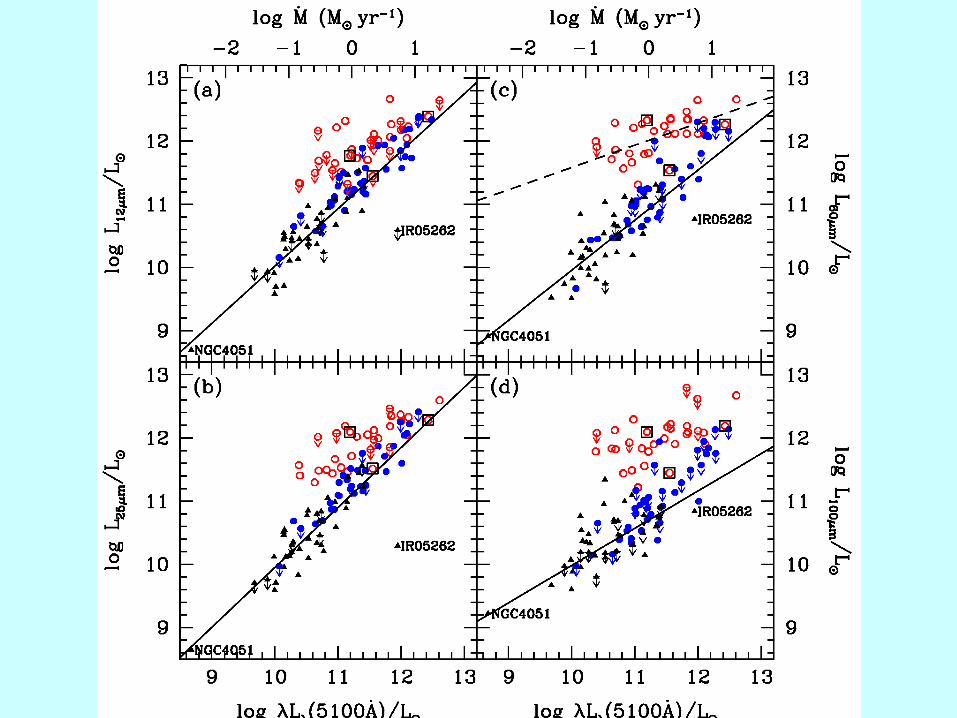
Current conclusions of our study of our high-z QSO-hosts HLIRGsin the light of SMG studies and feedback models for QSO/spheroids
Such huge starbursts exist at least up to z=6, and our sample is by far the largest one of ULIRGs at z>4
In the feedback model, they should be in the terminal phase of the ULIRG/AGN episode; both the starburst and the QSO should soon stop, starved of gas (maybe waiting for the next major merger)
The near independence of <LFIR> from Lbol should result of some compensation between the QSO destructive action and the stability of the starburst depending on the spheroid mass, not yet fully clear
The recent X-Ray results of Oliver et al. 2005 explain well the growth of black-holes during the SMG phase up to 108 Mo. It would be interesting to check whether and which SMGs allow them to grow up to 109 Mo

z Dphot (Gpc)
1000
--------------------
20 230
12 130
--------------------
z= 6 60
--------------------
z=2 16 -------------------
0.5 3--------------------
0
~ 300 million
~ 3.5 billion
z ~ 7 – 20 ?- Reionization PopIII stars +1st galaxies-Formation of 1st galaxies Pop. II stars - First AGN
z ~ 4 – 7 :Current frontier- Galaxy and Black-Hole early assembly- End of reionization
z ~ 1.5 -4: - Peak of star formationsubmm sources + LBGs-Peak of QSO activity -Luminous mid-IR sour. -Proto-cluster formation
z ~ 0.5-1.5 : Final phase of active SF - Mid-IR sources- Weak X-ray AGN- Cluster formation
Main z ranges in the Cosmic History of galaxies

Key Points
• 如何确定恒星形成率?• 如何确定星系中心黑洞的吸积率?• 恒星形成和 AGN 的反馈过程( feedbac
k )

SFR• 光学或紫外连续谱• 远红外连续谱• 射电连续谱或复合线( Ha 或 OII 发射线)强度。 每一种方法都有其局限性和问题,这给了解星系的恒星形成历史带来很大的不确定性。特别是当星暴和 AGN 共生的情况下,星暴和 AGN 对各波段的辐射都会有贡献。认识、了解和区分在宇宙演化的每一个阶段恒星形成和 AGN 对辐射的贡献非常困难,但又是必须首先解决的问题。所以,寻找新的、更可靠的确定恒星形成率的方法是急待解决的问题。多波段的观测资料恰恰可以提供基于全波段 SED (光谱能量分布)或某些仅与恒星形成有关的特征谱线来可靠地测量恒星形成率的可能。

如何确定星系中心黑洞的吸积率 从观测上是通过测量星系中心 AGN 辐射的总的热光度来确定黑洞吸积率的。一般情况下并不是基于全波段的 SED 来测量总的辐射热光度,而是用由经验关系和理论模型结合,基于单一波段的测量来确定总的辐射热光度,从而确定黑洞吸积率。因此,黑洞吸积率的测量也有很大的不确定性。但是,如果用多波段的观测资料,建立亮类星体样本的 SED ,基于全波段的
SED 来确定类星体热光度,这将降低对吸积率计算的误差;并可以用来更准确地建立对一般类星体的热光度的定标。

Thank You

Infrared Excess QSOs

IR QSOs are in transitionary stage
• Strong FeII emitters• High Eddington ratio• Steep x-ray slop
at one extreme end of Eigenvecgtor 1 and they are young QSOs
• Starburst

Key point• The starburst and central AGN give main contr
ibutions at different waveband
• By comparing optical and IR QSOs sample, It is possible to separate the contributions
• Determining SFR and Mdot
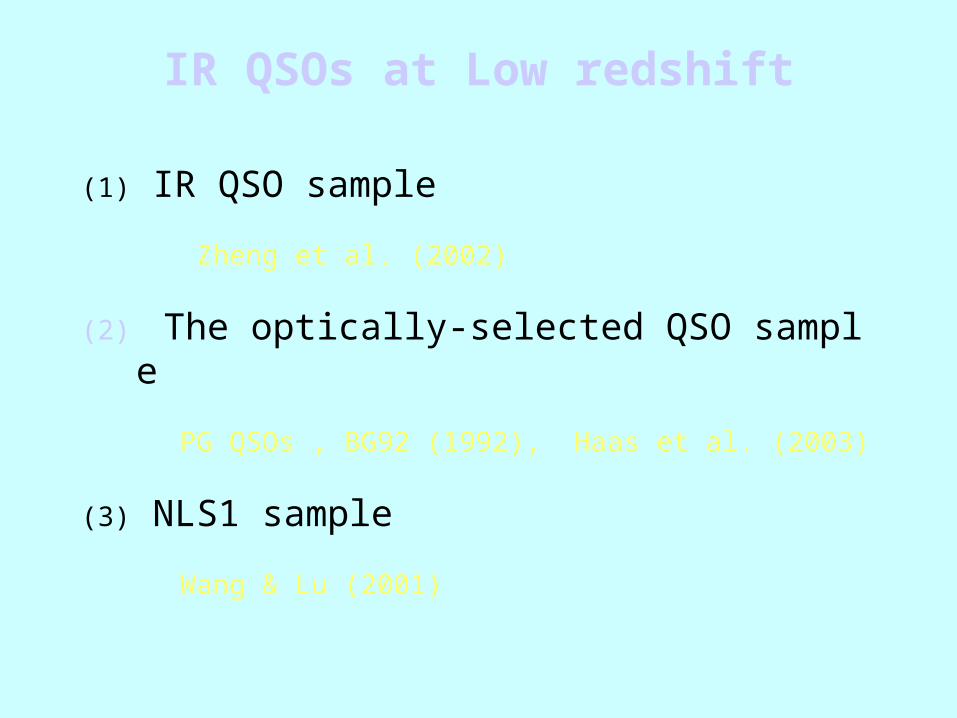
IR QSOs at Low redshift
(1) IR QSO sample
Zheng et al. (2002)
(2) The optically-selected QSO sample
PG QSOs , BG92 (1992), Haas et al. (2003)
(3) NLS1 sample Wang & Lu (2001)

Sample Selection
• QDOT IRAS galaxy sample (Lawrence et al. 1999)• 1 Jy ULIRGs sample (Kim & Sanders 1998)• IRAS-ROSAT cross-identification sample (Mora
n et al. 1996) A sample of 31 IR QSOs (z<0.35) , takes a fraction of about 25% in local universe. Based on the sample, stati
stical results should be representative.
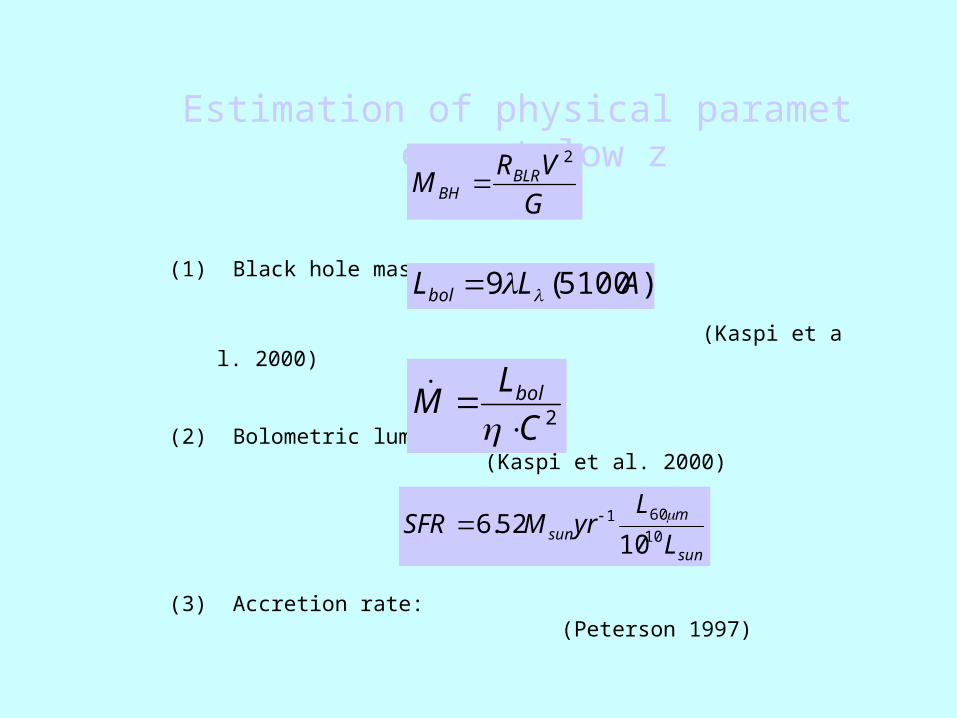
Estimation of physical parameters at low z
(1) Black hole mass:
(Kaspi et al. 2000)
(2) Bolometric luminosity: (Kaspi et al. 2000)
(3) Accretion rate: (Peterson 1997)
(4) Star formation rate:
(Kennicutt 1998; Lawrence et al. 1989; Cardiel et al. 2003)
GVRM BLR
BH
2
)5100(9 ALLbol
2CLM bol
sun
msun L
LyrMSFR 10
601
1052.6


High-z QSOs
Current available data at radio, UV and X-ray show
No any difference between low-z and high-z QSOs

The sample
(1) Optically selected QSOs at redshift about 4 with 1.2mm observation, Omont et al. (2001)
(2) Optically selected QSOs at redshift about 4 with 1.2mm observation, Carilli et al. (2001)
(3) Optically selected QSOs at redshift about 2 with 1.2mm observation, Omont et al. (2003)
High-z QSOs

T=41K, ß=1.95


Parameters estimates at high zSFR: Monochromatic luminosity at 60m the monochromatic luminosity at 60m from the flux density
at 1.2mm by assuming the rest-frame FIR SED can be described by
a greybody spectrum with the dust temperature of 41K and the dust emissivity of 1.95
Priddey & McMahon (2001).
Mdot: Bolometric luminosity Vestergaard (2004 )
Bbol LL 74.9


Summary
• IR QSOs (at both low and high redshift) are ideal laboratory for study the starburst and black hole growing process
extending sample• The relation of SFR/Mdot with Mbh may in
dicate the strong outflow from central AGN for bright QSOs


Merger Remnants
• Disky or Boxy
• Hot Gas halo
• Glubular Cluster


Starburst Ring

M82

Starburst
starburst


CO on the optical HST image
Downes & Solomon 98
The molecular emission is highlyconcentrated within 1kpc oreven smaller, cf Arp220
Two disks are merging, as seen inthe dispersion, and mm continuum

MAMBO/IRAM detection of redshifted far-IR/submm dust (and CO) emission from high-z QSOs
Summary of results (very similar to bright Scuba SMGs)
• High rate of detection : ~55 sources detected ~ 25%
• No significant dependence of the far-IR luminosity on z
• The mm/submm emission is dominated by cold dust at 40-50 K
• LFIR ~ 1013 Lo HLIRGs SFR ~ 1000 Mo/yr
• Heating of cold dust by starburst or AGN, or both ? Both are viable; probably a combination of both in various proportions, but some starburst is probably always present in the sources detected at 1.2 mm (CO detections in some sources)
• The far-IR luminosity is weakly correlated with rest UV Lbol

Dense gasdensity ~105 cm-3
T ~ 100 Ksize R ~400-1400 pcgaz mass 1-2 1010 Mo
CO detection in QSO SDSS J1148 at z=6.42
Bertoldi et al. 03 PdBI
Walter et al. 03 VLA
Multi-line excitation model
Resolution of CO in 2 sources VLA Walter et al. 04
CO detection in14 high-z QSOs

Molecular Gas in SCUBA submm Galaxies
Greve et al. (2004)
1 < z < 3.5
<M(H2)> = 3.0 1010 Msun
• ~5 times more gas and luminous, than local ULIRGs
• Broad FWHM linewidth
• Complex/interactive environment (+weak AGN)
• Mgas significant fraction of central mass

E68
• New generation single-pixel receivers PdB
• New IF processor (PV)• IF transport with opt fibers
(PdB)• New correlator (PdB)• WVR corrections• Track extension (PdB)• New subreflector (PV)• New bolo camera (MPIfR)
• New gener. single-pixel receivers for PV
• Improved wobbler (PV)• Extension of HERA 1.3-mm
FPA• Second station on E track
or extension towards West (PdB)
Mid-term projects summarydecided open options

z Dphot (Gpc)
1000
--------------------
20 230
12 130
--------------------
z= 6 60
--------------------
z=2 16 -------------------
0.5 3--------------------
0
~ 300 million
~ 3.5 billion
z ~ 7 – 20 ?- Reionization PopIII stars +1st galaxies-Formation of 1st galaxies Pop. II stars - First AGN
z ~ 4 – 7 :Current frontier- Galaxy and Black-Hole early assembly- End of reionization
z ~ 1.5 -4: - Peak of star formationsubmm sources + LBGs-Peak of QSO activity -Luminous mid-IR sour. -Proto-cluster formation
z ~ 0.5-1.5 : Final phase of active SF - Mid-IR sources- Weak X-ray AGN- Cluster formation
Main z ranges in the Cosmic History of galaxies


F.Combes, Maoli, Omont 1999F.Combes, Maoli, Omont 1999
CO linesCO lines Continuum submm radiationContinuum submm radiation
J=1-0J=1-02-12-1
3-23-2
z=5z=5
Some kind of « negative K correction » also exists for CO detection:Some kind of « negative K correction » also exists for CO detection: at at fixed (3mm window) J of redshifted detected line increases with z:fixed (3mm window) J of redshifted detected line increases with z: J=1-0 at z=0 J=1-0 at z=0 J=5-4 at z=5 J=5-4 at z=5 the line luminosity strongly increases with J, as long as the level is excitedthe line luminosity strongly increases with J, as long as the level is excited
z=1
z=0.1
High-z CO Detectability
3mm window
---------- 5
---------- 4
---------- 3
---------- 2
---------- 1---------- 0
CO rotation lines

Survey deg² filters depth total exposure nights
Vega mag (dark)
Very Wide * 1300 r' 24.7 14mn
Ecliptic strip g' 25.6 6mn
Optimized for KBO detection i' 24.1 6mn 110
170 u* 25.5 6000 s
g' 26.5 2500 s
r' 25.7 2000 s
i' 25.5 4300 s
z' 24.0 7200 s 162
Deep Synoptic 4 u* 27 33 hr
g' 28.4 33 hr
r' 28 66 hr
i' 27.8 132 hr
z' 26 66 hr 202
CFHTLS at a glance
W1: 02 18 00 ; - 07 00 00W2: 08 54 00 ; - 04 15 00W3: 14 17 54 ; +54 30 31
D1 02h 26m 00s -04d 30m 00sD2 10h 00m 29s 02d 12m 21sD3 14h 19m 28s +52d 40m 41sD4 22h 15m 31s -17d 44m 00s
Wide Synoptic