the choice of financing method in european mergers ... · large size of many m&a transactions,...
TRANSCRIPT
The choice of financing method in European mergers & acquisitions
Mara Faccio
Owen Graduate School of Management
Vanderbilt University
401 21st Avenue South
Nashville, TN 37203
and
Ronald W. Masulis
Owen Graduate School of Management
Vanderbilt University
401 21st Avenue South
Nashville, TN 37203
Version: July 4, 2003
We thank Utpal Bhattacharya, Harry DeAngelo, Tim Loughran and seminar participants at the University of Miami, University of Notre Dame, University of Pittsburgh and Vanderbilt University for helpful comments.
1
The choice of financing method in European mergers & acquisitions
Abstract
We study the financing choices in a broad sample of 3864 mergers and acquisitions (M&A) by European bidders of publicly and privately held targets and over the period 1997-2000. Europe is an ideal venue for studying the importance of corporate governance in making M&A financing choices, given the large number of closely held firms. Furthermore, our dataset allows for a wide range of institutional settings and legal and regulatory rules which can impact M&A activity. A model of the M&A financing choice is developed and tested with panel data. The trade off between corporate governance concerns and debt financing constraints is found to have a large bearing on the bidder’s financing choice. Consistent with earlier evidence, we find that other bidder characteristics such as deal and target characteristics significantly affect the choice of M&A payment method.
2
I. Introduction
Global M&A activity has grown dramatically over the last ten years, bringing with it major
changes in the organization and control of economic activity around the world. Yet, there is much about
the M&A process that we do not fully understand, including the choice of payment method. Given the
large size of many M&A transactions, the financing decision can have a significant impact on an
acquirer’s ownership structure, financial leverage, future profitability and subsequent financing decisions.
In this study, we examine the choice of payment method and its determinants across a large sample of
European M&A transactions. Unlike several earlier studies of this question, our primary focus is on the
relative importance of debt financing constraints and threats to corporate control, which have opposing
effects on an acquirer’s financing choice.
An acquiring firm’s financing decision can be strongly influenced by its debt capacity, existing
leverage and target leverage ratio, given that most acquirers have limited cash holdings, so that cash
acquisitions generally require debt financing.1 Under existing theories of capital structure, debt capacity
is a positive function of tangible assets, growth in earnings and asset diversification and a negative
function of asset volatility.2 Firms with more tangible assets can borrow more privately from banks and
publicly through bond issuance, which is generally easier when bonds receive higher ratings.3 Since
larger firms are generally more diversified, we expect them to have a lower probability of bankruptcy at a
given leverage ratio and thus, greater debt capacity. Firms with higher growth rates and lower volatility
of earnings and valuation also are predicted to have lower bankruptcy risk and higher debt capacity.
These financing constraint and bankruptcy risk considerations can also reduce a lenders willingness to
finance an acquirer’s cash bid, especially in relatively large deals.
The merger currency choice has important implications for a bidder’s corporate governance
structure since stock issuance weakens a dominant shareholder’s voting power. If preserving control is
important to bidder management, then they have incentives to select cash financing over stock financing,
especially under circumstances where continued corporate control can be threatened. The corporate
control incentives to choose cash are likely to be strongest when a bidder’s largest shareholder has an
1 Debt financing would dominate stock financing of cash payments given debt’s lower percentage flotation costs and the tax benefits of stock financing that are lost when the seller isn’t paid in stock. 2 See for example, Hovakimian, Opler and Titman (2001). 3 For example, institutional investors are more likely to invest and underwriters are more likely to commit to take the issue to market.
3
intermediate level of voting power in the range of 20 to 60 percent; a range where she is most vulnerable
to a loss of control under a stock financed acquisition. These incentives weakened if the acquirer is
diffusely owned, since no controlling block is threatened. On the other hand, when a shareholder has a
supermajority of voting rights, stock financing is unlikely to threaten her continued control. In this case
any reluctance to issue stock in an acquisition is greatly weakened. These predictions are in the spirit of
the Harris and Raviv (1988) and Stulz (1988) models, which show that managers with significant
ownership positions are reluctant to seriously dilute their voting power and risk loss of control by issuing
stock.
Stulz (1988) posits that M&A financing decisions are affected by management’s desire to
maintain corporate control and continue receiving personal benefits. Managers have incentives to
maintain or increase their voting power since the probability of a change in control rises as their fractional
voting power falls. Stulz observes that while managers’ wealth constrains their shareholdings, growing
firms can rely on debt financing to maintain managements’ ownership level and voting power. However,
risk-averse managers bear greater portfolio risk as increasing debt raise their stock risk. This manager
trade-off results in an optimal debt level for a firm and an optimal manager investment in shares, which
generally precludes the corner solution of managers of growing firms preserving their majority control
through continued debt financing.4
An early test of this theory is reported in Amihud, Lev and Travlos (1990) who estimated a probit
regression to explain the choice of stock versus cash financed acquisitions as a function of officer and
director share ownership, and target size. They find manager share ownership measures have a
significant negative relationship to stock financing. Martin (1996) and Ghosh and Ruland (1998) provide
more recent empirical support for the bidder’s preservation of control predictions using US acquisition
data.
Corporate control concerns in M&A activity can manifest themselves in more subtle ways.
Concentrated ownership of a target means that a stock financed acquisition can create large blockholder,
threatening the corporate governance of the acquirer. In this case, an acquirer is unlikely to finance with
stock for fear of giving away control of itself. An acquirer can be more reluctant to finance with stock if
4 One alternative is to issue stock with inferior voting rights, but this also presents difficulties due to market discounting of these shares due to the greater moral hazard risk they are subjected to.
4
the seller is a corporation disposing of a division or if the seller is closely held, since in both cases a new
blockholder is created, threatening the positions of a buyer’s current management and board. When the
seller is privately held, target ownership is generally concentrated, so the threat to corporate control of the
acquirer is large. In addition, when the target is a subsidiary of a publicly corporation, we treat the target
as privately held to reflect the fact that there is a single selling shareholder. It should be noted that this
selling shareholder may also have the financial wherewithal to make a takeover attempt.
Target equity capitalization can also matter to the financing decision since a diffusely held target
ownership structure becomes more likely as capitalization rises, which makes equity financing an
acquisition less threatening to a buyer. As buyer equity capitalization rises, concern about its financing
constraint falls, since there is a relatively smaller impact on its overall financial condition. The corporate
control threat is also positively associated with deal size relative to buyer equity capitalization, since it is
relatively larger equity financed deals that are likely to create new rival blockholders.
A buyer’s recent stock price history can also be a potentially important determinant of its
financing choice. If a buyer has recently experienced a sizable stock price gain, then its existing
shareholders experience lower dilution of their voting power when stock financing is employed.
Korajczyk, Lucas, and MacDonald (1991) argue that stock investors bear greater adverse selection risk
after stock runups, assuming the acquirer has a strong say over the M&A deal terms. Since firms with a
greater proportion of growth option value and stocks with greater price volatility create greater
information asymmetry between investors and issuers, on average acquirers exploiting their information
advantage would again prefer to finance with stock.
While the vast majority of M&A research is based on US transactions over a 10 to 15 year sample
period, US data has the disadvantage of holding many institutional factors relatively fixed. To better
evaluate the importance of a wider range of ownership structures, corporate governance rules, corporation
law, securities regulation and market conditions, we study merger activity across a broad sample of
European bidders. In comparison to the US, European corporations are often characterized by bank
dominated lending and more concentrated share ownership. For a sample of 5,232 listed firms across 13
Western European countries, Faccio and Lang (2002) document that 63 percent have a single large
shareholder who directly or indirectly controls at least 20 percent of their votes. This is in sharp contrast
with a recent paper by Gadhoum, Lang and Young (2003) who examine a sample of 3,607 US
5
corporations and document that only 28 percent of their sample have a large shareholder who controls 20
percent or more of its votes.
The primary questions we investigate are the extent to which the M&A currency decision is
determined by buyer debt financing constraints and corporate control concerns. Furthermore, our study
explores several additional questions. When do target shareholder preferences have a significant bearing
on M&A payment choice? For example, we might expect sellers to have greater demand for cash when a
bidder is closely held, since obtaining liquidity and reducing stock risk are major motives for selling.
This preference should be especially strong for owners of privately held target firms. A seller may also
be wary of taking a minority equity position in a buyer having a dominant shareholder due to moral
hazard considerations. On the other hand, target managers may be willing to accept stock payment if they
perceive this increases the likelihood of their continued employment after the acquisition.5
Allocation of deal risk and expected M&A benefits among buyer and seller stockholders is also
determined by the M&A currency choice. Bidder expectations concerning the risks and expected rewards
of the M&A deal can affect their willingness to accept bidder stock as deal consideration. M&A
transactions in the same industry or same country are likely to be perceived as less adverse selection risk,
making stock currency more attractive to a seller. Greater bidder asset growth and recent stock price
gains are likely to make bidder stock more attractive to target shareholders influenced by momentum
strategies, while greater stock price volatility is likely to make bidder stock less attractive. In addition to
these considerations, the relative negotiating power of the two parties is important. Presumably, targets
that are privately held, more profitable, have larger market shares, or are owned by a corporate parent
have greater negotiating power since they can choose to stay independent or easily attract other bids.
Finally, several M&A specific tax considerations can also influence the M&A financing decision. When
a target’s or acquirer’s home nation offers merger tax benefits or the stock financing benefits (due to
capital gains treatment), we would expect a higher proportion of stock financing.
In section II we review existing research in the area and discuss our variables. Our analysis of
European M&A activity begins in section III where we document data sources and present statistics on
deal, bidder and target characteristics by type of M&A financing decision. Section IV presents our
5 Ghosh and Ruland (1998) document for US listed buyers and sellers that target management retention is positively correlated with stock financing of the acquisition.
6
primary empirical results concerning M&A financing choice determinants and explore the robustness of
these results. The last section summarizes our empirical findings and conclusions.
II. Prior Literature and Hypotheses Explaining Financing Decisions
A number of earlier studies have analyzed M&A financing decisions. Hansen (1987), Stulz
(1988) and Fishman (1989) develop theories of acquisition payment choice based on asymmetric
information and moral hazard considerations. Of these theories, only Stulz focuses on corporate control
concerns, as we discussed earlier. Most of the early empirical literature concentrates on the market
reactions to these M&A financing announcements, with the determinants of these financing decisions
generally given limited attention. For acquisitions of publicly traded targets, Travlos (1987), Wansley,
Lane and Yang (1987), Amihud, Lev and Travlos (1990), Servaes (1991), and Brown and Ryngaert
(1991) document significant negative average announcement returns to acquirers when the method of
payment is stock rather than cash.6 One dominant explanation for this pattern is that stock financing
creates an adverse selection effect similar to a seasoned stock offering. A potential concern with these
studies is that none of them controls for endogeneity in the financing decision when measuring
announcement effects. In this perspective, this study develops a predictive model that enables researchers
to better control for endogeneity of their financing decisions.
Franks, Harris and Mayer (1988) document that US and UK target shareholders realize
significantly greater gains from cash offers relative to stock offers. Servaes (1991) finds similar evidence
for a sample of US targets. Loughran and Vijh (1997) report that US firms completing stock-financed
mergers experience a significantly negative 25% excess return over the five–year period following the
announcement. In contrast, acquiring firms completing cash tender offers gain a positive excess return of
62%. This evidence strongly suggests that the M&A payment decision is relevant to both the buying and
selling shareholders. Yet, these studies do not pursue the question of why a particular payment choice is
made.
Amihud, Lev and Travlos (1990), Martin (1996) and Ghosh and Ruland (1998) study the
determinants of M&A payment method and investigate the importance of buyer management
6 For a sample of Canadian acquisitions, Eckbo, Giammarino and Heinkel (1990) document that acquirer announcement returns are highest for mixed cash and stock payments.
7
stockholdings on US acquisitions between 1978-1988. All three studies conclude that buyer management
shareholdings have a negative effect on stock financing. With the exception of Martin (1996), the
analyses only cover large deals involving publicly listed targets.7 However, while Martin includes private
targets, his analysis does not differentiate between them and public targets. Using a sample of 846
completed acquisitions of public and private firms by NYSE and AMEX listed buyers, Martin reports that
higher buyer growth opportunities lead to more stock financing, while an intermediate range
shareholdings by buyer managers reduce stock financing. In his study, Martin controls for the following
deal characteristics: buyer institutional ownership, cash holdings, leverage and profits divided by deal
value, a tender offer indicator and several business cycle variables.
Following Martin (1996) we classify the form of M&A payment into cash and stock where “cash
payments” are defined to include cash, non-contingent liabilities and newly issued notes and “stock” is
defined to include shares with full voting rights, inferior voting rights or no voting rights.8 We take two
approaches to analyzing the method of payment decision. First, we measure the proportion of cash and
stock in each deal. The variables PERCENT CASH and PERCENT STOCK measure these proportions.
Second, we classify deals into those containing only cash (CASH ONLY), only stocks (STOCK ONLY),
or a mixture of cash and stocks (MIXED PYMT).
In assessing potential determinants of the M&A financing decision, our focus is on bidder M&A
financing choices, recognizing that targets can also influence the final terms of an M&A deal. However,
if a target’s financing choice is unacceptable to the bidder, then the proposed M&A transaction is likely to
be aborted or else the bidder can make a hostile offer on its own terms. For a deal to succeed, the bidder
must be satisfied with the financial structure of the deal. Moreover a bidder can have strong preferences
toward one financial structure over another because of control threats to its dominant shareholders, its
desire to minimize taxes, its unused debt capacity and available liquid assets which determine a deal’s
financial feasibility and a bidder’s future investment and M&A plans. Since both successful and
unsuccessful bids are in our sample, we have further reason to focus on bidder financing objectives and 7 For example, Amihud, Lev and Travlos (1990) examine 209 acquisitions by Fortune 500 firms over 1981-1983 and find buyer management and board shareholdings reduce the probability of stock offers, controlling for target sales. Ghosh and Ruland (1998) extend Martin’s study by examining shareholdings of target managers using a sample of 212 large US acquisitions. They also report stock financed acquisitions significantly decrease over an intermediate range of buyer management shareholdings, but also find they significantly increase with target management shareholdings. 8 We have only three cases in the final sample where shares with inferior or no voting rights are offered.
8
constraints. Several other proxies and control variables are discussed later in the sensitivity analysis
section.
A. Collateral, Debt Capacity and Excess Cash
We use the fraction of tangible assets as our primary measure of a bidder’s ability to pay cash,
financed from additional borrowing. COLLATERAL is measured by the ratio of property, plant and
equipment (PPE) to book value of total assets. Myers (1977) argues that debtholders in firms with fewer
tangible assets and more growth opportunities are subject to greater moral hazard risk, which increases
the cost of debt, often making stock more attractive. Hovakimian, Opler and Titman (2001) find that a
firm’s percentage of tangible assets has a strong positive influence on its debt level. If external financing
is more costly than internal financing, then firms should prefer to first use their cash reserves for
investment purposes.
We also control for a bidder’s financial condition (FIN CONSTRAINT). Since cash is primarily
obtained by issuing new debt, highly levered bidders are constrained in their ability to issue debt and as a
consequence use stock financing more frequently. A bidder’s financial constraint is measured by the sum
of the bidder’s face value of debt prior to the M&A announcement plus the deal value (including assumed
liabilities) divided by the sum of the book value of total assets prior to the announcement plus the deal value
(including assumed liabilities). This captures that bidder’s post-deal leverage if the transaction is debt
financed. This measure differs from Martin (1996) who uses a pre-deal bidder leverage measure adjusted
for an industry mean and reports an insignificant effect.
Bidder size is likely to influence its financing choices. Larger firms are more diversified and thus,
have proportionally lower expected bankruptcy costs.9 They also have lower flotation costs and are likely
to have better access to debt markets, making debt financing more readily available. Thus, cash financing
should be more feasible in the case of larger firms. Larger firms are also more apt to choose cash
financing in smaller deals due to its ease of use, provided they have sufficient unused debt capacity or
liquid assets. Further, the use of cash allows the buyer to avoid the significant costs of obtaining
shareholder approval of pre-emptive rights exemptions and stock authorizations and the higher flotation
9 See evidence in Warner (1977), Ang, Chua and McConnell (1982) and Thorburn (2000).
9
costs of stock offers. We measure bidder firm size by the log of pre-merger book value of assets in
dollars (TOTAL ASSETS).
B. Corporate Control
Bidders controlled by a major shareholder should be reluctant to use stock financing when this
causes the controlling shareholder to risk losing control (Amihud, Lev, and Travlos, 1990, Stulz, 1988,
Jung, Kim and Stulz, 1996). Assuming control is valuable,10 the presence of dominant shareholder
positions should be associated with more frequent use of cash, especially when the controlling
shareholder’s position is threatened. To capture this effect, we use the ultimate voting stake held by the
largest controlling shareholder (CONTROL). For example, if a family owns 50% of Firm X that owns
20% of Firm Y, then this family controls 20% of Firm Y (the weakest link in the chain of control). If we
create a pyramid where the family also owns 50% of Firm Z that also owns a 40% of Firm Y, then the
family owns 60% of Firm Y (the sum of the weakest links in the two chains of control). This variable
comes from Faccio and Lang (2002), and captures the effects of complex control structures.
Figure 1 illustrates voting this control measure using the actual ownership of Ifil S.p.A. by the
Agnelli family group, Italy’s largest corporate group. Ifi is controlled by a single major shareholder,
Giovanni Agnelli & C. S.p.A. (the Agnelli family) and Carfin is an unlisted firm, wholly owned by the
Agnelli family. In turn, Ifil is controlled with a 14.6% direct voting stake by Ifi and a 37.64% indirect
voting stake held by Carfin. The Agnelli family’s control of Ifil is exercised through two lines of
pyramiding (Giovanni Agnelli & C. S.p.A.-Ifi-Carfin-Ifil and Giovanni Agnelli & C. S.p.A.-Ifi-Ifil). The
Agnelli family’s ultimate control stake is the sum of the weakest links along each control chain. The
weakest link in the pyramidal chain is min(100%; 82.45%; 100%; 37.64%) = 37.64%. In the control
chain from Ifi to Ifil, the weakest link is min(100%; 82.45%; 14.16%) = 14.16%. The Agnelli family’s
control stake in Ifil is the sum of these two weakest links, namely 14.81% + 37.64% = 52.24%.
[Figure 1 goes here]
A buyer with diffuse or highly concentrated ownership is less likely to be concerned with
corporate control issues. In line with this argument, Martin (1996) documents a significantly negative
relationship between the likelihood of stock financing and managerial ownership over an intermediate
10 Nenova (2003) and Dyck and Zingales (2003) document substantial benefits of control in Europe.
10
ownership range. Similar evidence is reported in Ghosh and Ruland (1998). Therefore, we incorporate
the possibility of a non–linear relationship between the method of payment and the voting rights of a
bidder’s controlling shareholder. Following previous studies, we use a spline function to capture the
effects of a bidder’s control structure. The spline function uses cutoffs at the 20% and 60% ownership
levels. The variable is constructed as follows. CNTRL0_20_SPLINE takes the value of CONTROL if
control is equal or below 20 percent; and takes the value of 20 if control exceeds 20 percent.
CNTRL20_60_SPLINE takes the value of 0 if control is equal or below 20 percent; takes the value of
“CONTROL – 20” if 20 < control < 60 (percent); and takes the value of 40 (= 60–20, since 20 (%) is
already incorporated in the first segment of the spline function) if control exceeds 60 percent. Finally,
CNTRL60_PLUS_SPLINE takes the value of 0 if control is equal or below 60 percent, and takes the
value of “CONTROL – 60” if control exceeds 60 percent. The motivation for choosing the 20% and 60%
cutoff points is that stock financed acquisitions are much more likely to threaten the effective control of
the bidder’s largest shareholder when their voting rights are in this range.11
We go beyond the Martin (1996) study by differentiating between private and publicly held target
firms when analyzing the buyer corporate governance risk associated the acquisition’s method of
payment. The separate treatment of private companies is important to our analysis since these firms
usually have highly concentrated ownership structures.12 To many bidders, giving a privately controlled
target a large block of bidder stock would be unacceptable because of the potential threat this could pose
to their corporate governance. We use a dummy variable, UNLISTED TARGET to control for listing
status where the variable takes a value of one if the target is not listed on any stock exchange and is zero
otherwise.
While the risk of creating a new bidder blockholder with stock financing is higher when a target
is unlisted, this is especially true when the value of target assets acquired is large relative to a bidder’s
dominant shareholdings. Similarly, given the presence of a large shareholder in a bidder’s ownership
structure, the risk of losing control will increase with the relative size of the deal, as will the reluctance of
the bidder’s controlling shareholder to support stock financing. To capture the risk of creating a large
blockholder when buying an unlisted target with stock financing, we employ CONTROL LOSS, the
11 La Porta, Lopez-de-Silanes and Shleifer (1999), Faccio and Lang (2002) also use a 20% cut off for control. 12 See Bianchi et al. (2001) for evidence on Italy, Bloch and Kremp (2001) for France, Goergen and Renneboog (2001) for the UK, and Faccio and Lang (2002) for Germany.
11
product between the unlisted target indicator and the target’s relative size. The relative deal size is
computed as the ratio of offer size (excluding assumed liabilities) to bidder equity market capitalization.
Other Explanatory Variables:
In addition to bidder control and financing considerations, we need to take into account other
bidder characteristics, deal structure, target characteristics and macroeconomic influences.
C. Relative Size
Cash payments are less likely in very large deals, especially when a buyer has limited liquid
assets and unused debt capacity. Furthermore, Hansen (1987) predicts that bidders have greater
incentives to finance with stock when the asymmetric information about target assets is high.13 This
information asymmetry is likely to rise as target assets rise relative to those of a bidder. Yet, when stock
is used in relatively larger deals, it produces more serious dilution of a dominant shareholder’s control
position. We use REL SIZE as proxy for these effects. REL SIZE is computed as the ratio of deal offer
size (excluding assumed liabilities) divided by bidder’s pre-offer market capitalization at the year-end
prior to the bid (*100).14
D. Asymmetric Information and Overvalued Bidder Stock
Both Myers and Majluf (1984) and Hansen (1987) predict that bidders will prefer to finance with
stock when they consider their stock overvalued by the market and prefer to finance with cash when they
consider their stock undervalued. As uncertainty about bidder asset value rises, this adverse selection
effect is exacerbated. Martin (1996) finds evidence consistent with this prediction. Travlos (1987)
explores the empirical validity of an adverse selection problem in stock financed M&A transactions for a
sample of publicly traded targets. He finds stock financed M&A deals exhibit much larger negative
announcement effects than cash financed deals. We use as a proxy for bidder overvaluation (or
undervaluation), RUNUP, calculated from a bidder’s buy and hold cumulative stock return over the year
13 While Hansen’s model predicts all cash or all stock financing, the Eckbo, Giammarino and Heinkel (1990) model, predicts a mix of cash and stock is chosen to convey information to the target about a bidder’s true value. 14 We checked for outliers in the “deal value” using Lexis-Nexis and found (and fixed) a number of mistakes in the SDC database. Updated figures for these outliers are available from the authors upon request.
12
preceding the M&A announcement month. We also view 1 - COLLATERAL, STOCK STDDEV and
ASSET GROWTH as measures of uncertainty about bidder asset value. Bidders are likely to prefer to
issue stock as this uncertainty rises to exploit their asymmetric information advantage.
E. Asymmetric Information in Cross-Industry Deals
Sellers should be more reluctant to accept buyer stock as M&A currency as the asymmetric
information problem worsens with greater uncertainty about buyer equity value and its future earnings.
This problem is also likely to be more serious for conglomerate mergers. In contrast, sellers are more apt
to accept a continuing equity position in an intra–industry merger, where they are well acquainted with
industry risks and prospects. Therefore, we employ INTRA-INDUSTRY, a dummy that equals one if
bidder and target are in the same industry (the primary three digit SIC codes coincide) and is zero
otherwise.
F. Target Payment Preferences
When an M&A deal involves an unlisted target, a seller’s consumption/liquidity needs are also
likely to be important considerations, given the illiquid and concentrated nature of their portfolio holdings
and the often impending retirement of a controlling shareholder-manager. These considerations imply a
seller preference for cash.
High growth buyers can make an attractive equity investment for selling shareholders. ASSET
GROWTH, defined as a bidder’s asset growth rate in the year prior to the bid, measures a bidder’s
investment opportunities. We expect higher asset growth to increase its stock’s attractiveness as M&A
consideration. High asset growth is also correlated with high levels of tax deductible R&D expenditures,
along with low current earnings and substantial accumulation of capital asset. These firm attributes lower
a bidder’s need for additional debt tax shield, making cash financing less attractive. These attributes are
also attractive to high income bracket sellers sue to their tax benefits. Martin (1996) and Jung, Kim and
Stulz (1996) document a higher incidence of stock financing for higher growth acquirers. Buyer stocks
that recently realize large price gains can also be attractive to sellers influenced by momentum strategies.
As a consequence, it is also possible for RUNUP to proxy for this effect.
13
G. Cross-Border Deals and Local Exchange Listing
In cross border deals, selling stock to foreign investors can entail several problems. We are
concerned with the possibility that investors have a home country bias in their portfolio decisions as
documented in Coval and Moskowitz (1999), French and Poterba (1991) and Grinblatt and Keloharju
(2001), among others. This can reflect foreign buyers’ greater transaction costs, lower liquidity, currency
exposure and less timely, more limited access to firm information. These considerations lower seller
demand for bidder stock. We define CROSS BORDER, as an indicator variable that equals one if bidder
and target countries differ and is zero otherwise.
H. Capital Controls on Foreign Equity Investments and Cash Alternative Laws
Some nations restrict or prohibit their investors from holding foreign equity over part of our
sample period. In these cases, a seller is likely to insist on cash or possibly debt financing. Information
on these restrictions is taken from IMF annual reports on “Exchange Arrangements and Exchange
Restrictions”. We employ a dummy variable FOREIGN INVESTMENT RULES to capture this effect
and define it to have a value of one when restrictions on external equity investment by domestic investors
exist, and to equal zero otherwise.
We also look at whether target country regulations require compulsory cash payments, at least as
alternative consideration in M&A deals. We use the dummy variable CASH ALTERN LAW to capture
this effect. It takes a value of one when such a regulation holds and is zero otherwise. Since the cash
alternative usually applies only to acquisitions of listed targets, this dummy variable takes a zero value
whenever the target is unlisted.
I. Business Cycle and Stock Market Effects
We examine several business cycle and aggregate stock market variables to control for possible
macroeconomic effects, such as those documented in Choe, Masulis and Nanda (1993) and Lowry and
Schwert (2002) which are shown to influence aggregate IPO and SEO issuance decisions. These
variables can affect M&A financing decisions since they can alter the relative costs of debt and equity
financing. More specifically, business upturns reduce the adverse selection associated with accepting
buyer stock as M&A currency. Business upturns can also reduce the moral hazard risks borne by sellers
14
who become minority shareholders in a buyer. As such, these macroeconomic variables can affect the
relative cost of stock versus cash offers. We use prior stock market runup (MKT RUNUP) on a bidder’s
stock exchange, measured by the market index’s cumulative return over the year prior to the M&A
announcement month, as our primary business cycle variable. We also examine the 3 month LIBOR rate,
stock market index standard deviation (MKT STNDDEV) and GDP PER CAPITA as macroeconomic
variables, but find these variables to be statistically insignificant.
II. Data and Descriptive Statistics
The sample includes acquisitions announced over the four years between January 1997 and
December 2000 by bidders from 13 European countries: Austria, Belgium, Finland, France, Germany,
Ireland, Italy, Norway, Portugal, Spain, Sweden, Switzerland, and the UK. Announcements must be
reported in Thomson Financial Securities Data’s SDC, “Worldwide Mergers & Acquisitions Database”.
This database covers public and private corporate transactions involving at least 5% ownership of a target
company.
All mergers and acquisitions must satisfy the following screening criteria. First, bidders need to
be incorporated and listed on a stock market in one of the above listed major European countries. No
restriction is imposed on a target’s country of incorporation, its listing status, or the bid’s outcome (i.e.
both successful and unsuccessful bids are included). We use SDC’s “Worldwide Mergers & Acquisitions”
database to collect the two M&A partners’ identities, country, industry (SIC code) and determine whether
their stocks are publicly listed, the deal’s initial announcement date, dollar value, method of payment, legal
form, and whether it is friendly or hostile. After this initial screening, we have complete information for
9,935 M&A announcements. Data on method of payment is hand collected based on descriptive information
reported in SDC, rather than relying on SDC’s method of payment variable because we found frequent
inconsistencies between the two data sources.
Second, to be included in the sample a bidder’s financial accounting statements for the year-end
prior to the offer must be reported in Worldscope. Although SDC provides data fields for bidder and target
accounting information, it is often missing for European bidders. Third, bidder stock price and share volume
data over the year prior to the offer announcement month must be available in Datastream. This data is used
in constructing our measures of stock risk, return and liquidity.
15
Fourth, bidder stock ownership and voting control data must be available. Stock ownership and
voting control data are taken from Faccio and Lang (2002). In order to minimize the loss of observations
from merging these databases, Lexis–Nexis, Extel Financial and Worldscope are used to identify company
name changes. There are 4,342 observations where bidder names can be matched across all four datasets.
Finally, M&A deals must be financed with cash, stocks, or a combination of cash and stock. After excluding
478 deals with earnouts,15 we are left with 3,864 observations in our final sample.
[Table I goes here]
As seen in Table I, a large majority of deals involve UK bidders (63.7%). We have relatively few
(i.e., less than 100) announcements by bidders incorporated in Switzerland, Belgium, Portugal and
Austria. Although targets may be from any country, UK targets represent the largest group in our sample
(44.6% of all targets). Similarly, targets incorporated in our 13 bidder countries represent 73% of the
sample. US firms represent the largest fraction of the non–European targets (11.7%).16
[Table II goes here]
Table II presents descriptive statistics when deals are classified by financing method. Panel A
shows that most European bids are entirely cash financed. Specifically, we find 3,123 M&A transactions
(or 80.8%) include only cash, 424 (11%) include a mix of cash and stocks, and 317 (8.2%) include only
stock. Mixed currency payments of cash and stocks on average contain a higher proportion of cash
(56.5%) than stock (43.5%). In contrast, Andrade, Mitchell and Stafford (2001) report that 70% of M&A
transactions by US firms in the 1990s involve stock financing, with 58% entirely stock financed.
The proportion of “all cash” deals is highest in Austria (100%) and Portugal (90%), and lowest in
Finland (66%) and Norway (71%). Cash financing is predominant across all countries, and more common
than is suggested in previous European M&A studies. For example, Eckbo and Langohr (1989) report in
a study of 306 tender offers for publicly traded French targets that over the 1966-1982 period, 25% were
at least partially stock financed. In our sample of French acquisitions, we find that only 19% of deals
include at least some stocks. Of course our sample is not limited to publicly traded targets or tender
offers, which may be a source of the difference. Our evidence contrasts sharply with a previous study by
Franks, Harris and Mayer (1988) who report that during 1955-85, 66% of UK M&A deals included at
15 Earn–out is an amount to be paid, over time (generally in cash), if the target company meets certain financial performance criteria. 16 The industries with the greatest M&A activity are real estate and business services.
16
least some stock in its method of payment. Zhang (2003) reports that 63% of M&A deals completed over
1990-99 where bidder and target are London Stock Exchange listed include at least some stock payment.
In contrast, for our sample of 2,463 UK acquisitions, only 20% of these deals involve some stock
payment. Both of these studies of UK acquisitions focus only on listed targets, which again is a likely
source for the higher frequency of stock financed transactions.
Table II also shows that on average the largest ultimate controlling shareholder controls 21.97%
of voting rights in the bidder. This figure is substantially lower than that previously documented in
Faccio and Lang (2002). One possible explanation for the difference is that bidders tend to be relatively
large companies, which have a significantly more widely dispersed ownership. Furthermore, we have a
relatively large proportion of UK firms, which happen to have more widespread ownership than
continental European companies. The countries with largest average level of dominant shareholder
voting control are Austria (42.80%) and Italy (40.52%), and the lowest are the UK (17.76%) and Ireland
(19.46%). In Europe, the existence of a controlling shareholder is common and typically translates to a
position on the board.17
The corporate ownership structure of our bidders is in sharp contrast to previous US studies.
Martin (1996) documents an average ownership of 11% by all bidder officers and directors (including
stock options). Ghosh and Ruland (1998) report average share ownership of 10.5% by all acquirer
officers, directors and insiders. One reason for the smaller ownership level reported in these studies is
that they focus on all directors, while we focus only on the dominant shareholder, who may or may not be
a director.
Table II, Panel B indicates that bidder and deal specific attributes are quite different across
method of payment categories and these differences are generally statistically significant. Bidders whose
largest shareholder has voting power in the 20 to 60% range are more common in stock financed deals
(33% of cases), while in mixed deals they are least common (24% of cases). This is surprising, given that
stock financing is more likely to threaten the voting control of the dominant shareholder in the 20 to 60%
range. However, the cash financed deals are substantially smaller relative to the bidder than the stock and
mixed deals, which suggest a strong financing motive. All cash deals are more likely to involve unlisted
targets (87.8% of cases) than mixed deals (81.6%) or all stock deals (49.8%). Bidders in cash financed
17 See Faccio and Lang (2002) for documentation of this pattern.
17
deals have the highest percentage of collateral (38.1%); while bidders in stock financed deals have the
lowest percentage of collateral (27.1%), and mixed deals have an intermediate level (31.5%). Financially
constrained bidders choose stock financed deals more frequently.
Bidders undertaking “pure cash” acquisitions are larger in terms of total assets than those in pure
stock financed deals. However, the difference in bidder size is not significantly different across deal
financing categories. Average deal size (DEAL VALUE) for pure stock financed deals is dramatically
larger than that for pure cash financed deals (i.e. over 17 times larger); with the average mixed deal being
of an intermediate size. On the other hand, the average size of a target relative to bidder size (REL SIZE)
is highest for mixed deals (36%) and lowest for cash only deals (10%). The relative size of stock only
deals averages 30%.
Consistent with our earlier analysis, the likelihood of a bidder and target being in the same
industry (INTRA-INDUSTRY) is highest for pure stock deals and lowest for pure cash deals. Bidder
asset growth (ASSET GROWTH) is highest for stock only deals, and lowest for cash only transactions.
Cross border transactions (CROSS BORDER) are more common in cash only deals (48.2%) than in stock
only deals (32.5%) or mixed deals (23.6%). Bidder stock price runup in the year prior to deal
announcement (RUNUP) is highest for all equity deals and lowest for all cash deals.
The “form of transaction” is highly correlated with the chosen method of payment. Most cash
only deals are acquisitions of assets, rather than acquisitions of stocks (61%). Acquisitions of assets are
also relatively common in mixed deals (44%) and infrequent in stock only deals (19.9%). This may
reflect the need of many sellers in asset acquisitions to pay off their outstanding debt.
The incidence of target nations having capital controls on foreign equity investment (FOREIGN
INVESTMENT RULES) does not significantly differ across deal types. Similarly, there is no significant
association between the method of payment and the business cycle variable (as measured by the prior one
year cumulative return in a bidder’s stock market index). Finally, regulations prescribing a cash
alternative are significantly more common amongst mixed deals. While this analysis suggests the
empirical relevance of many of our explanatory variables, to assess their marginal effects requires a
detailed multivariate analysis.

18
IV. Methodology and Empirical Evidence
A. OLS Regressions
We start our multivariate analysis by investigating the proportion of cash financing in M&A
deals. Estimation results are reported in Table III. White standard errors are used to adjust for
heteroscedastic errors in our panel dataset.
[Table III goes here]
In regression (1) we control for bidder financial condition with measures of collateral, financial
constraint, and total assets. We find that bidders with more tangible assets (collateral) are more likely to
choose cash as M&A payment form, which is consistent with more frequent M&A cash deals as both
bidder debt capacity and lender information about its asset value rises. Financially constrained bidders
are more likely to use stock financing. We also find bidders with more assets are more likely to cash
finance as expected.
Turning to the control variables, we find the relative size of the target is significantly negatively
correlated with the proportion of cash used as a method of payment. This supports Hansen’s (1987)
asymmetric information prediction that stock financing is more likely as the bidder’s information
asymmetry with regard to the target’s market value rises. The indicator for targets in related industries is
also negative and significant. Thus, sellers seem to find cash more attractive in case of conglomerate
mergers and acquisitions, which is consistent with the earlier analysis. The runup in bidder stock price
has a negative and significant effect on the proportion of cash financing, supporting the idea that bidders
are more likely to use stocks when they are overvalued. This is in line with the empirical findings by
Martin (1996), and the theoretical models of Hansen (1987) and Myers and Majluf (1984). Overall, the
model that accounts for bidder financial strength explains about 8% of the cross sectional variability in
M&A currency decisions.
In regression (2) we replace the bidder financial strength measures with measures of the threat to
bidder corporate control of a stock financing transaction. The regression indicates that the proportion of
cash increases significantly with the bidder controlling shareholder’s voting power when the bidder
controls between 20 and 60 percent of votes, but declines significantly when it reaches 60 percent or
more, or when it is below 20 percent. This suggests that, for high levels of control in a bidder, the
dominant shareholder is less concerned with losing control due to a stock financed acquisition, probably
19
because their position is only at risk in large deals. The positive coefficient on the intermediate
shareholdings level supports the previous findings of Amihud, Lev and Travlos (1990), Martin (1996) and
Ghosh and Ruland (1998), though they did not find a negative coefficient for high management
stockholdings.
We also control for a target’s listing status to proxy for its shareholder ownership structure. As
expected, buyers of unlisted targets use cash significantly more often as their method of payment, while
buyers of listed targets use stock financing more often. This evidence is consistent with buyer preference
for cash financing as risk of a control loss rises and a greater seller preference for cash when a target is
privately held. We document that a target’s listing status has very high statistical and economic
significance. We also account for whether a new dominant shareholder could result from an “all stock”
financed transaction (CONTROL LOSS) involving a relatively large unlisted target. The evidence on this
question shows that when large deals involve unlisted targets, bidders become particularly reluctant to use
stock. This is consistent with bidder aversion to actions that significantly dilute or threaten the control
positions of their dominant shareholders. All the other control variables maintain their sign and
significance. The second model explains more than 14% of cross sectional variability in the proportion of
cash used to finance M&A deals, which is substantially more than in the first regression.
In regression (3) we include both bidder financial strength and threats to corporate control
measures. Moreover, both the bidder financial strength and corporate control threat variables are
statistically significant and have the predicted signs. The qualitative results for the other control variables
are identical to the prior regression, except that the effect of bidder asset size is now significantly
negative. The model explains nearly 18% of the M&A currency choices.
In regressions (4) and (5), we add a number of control variables related to target investment
preferences. We expect target shareholders to be more inclined to hold bidder stock when a bidder has
promising growth opportunities. In regression (4), we evaluate this argument by adding a bidder’s asset
growth rate as a regressor. The results are supportive of the argument. Higher growth is associated with
a lower proportion of cash (thus, a higher proportion of stock) used as the method of payment. The
relationship is statistically significant at the one percent level. This result is in line with the earlier
findings of Jung et al. (1996) and Martin (1996). Also consistent with target shareholder preferences,
stock is more likely in domestic deals and cash is much more likely in cross–border deals; deals where
20
sellers are likely view bidder stock as more uncertain. Turning our attention to country–level factors, we
document in regression (4) that restrictions on foreign holdings of equity by a target nation’s residents
result in a significantly higher proportion of cash financing. We also use market runup to proxy for the
effects of business cycles, but find it is statistically insignificant.
Finally, in regression (5), we document that the compulsory cash alternative provision is found to
encourage greater use of stock financing. Our interpretation is that under this clearly defined regulatory
procedure target shareholders can always opt for cash, so they are more willing to accept stock as the
“stated” M&A consideration. The addition of these variables increases the model’s R–squared to 22
percent. In sum, the qualitative results and statistical significance are robust to the addition of a variety of
explanatory variables.
Interpreting the financial implications of the prior regression estimates, we find consistent
evidence that M&A financing decisions are strongly influenced by corporate control concerns of bidders’
dominant shareholders and bidder financial condition. In addition, the method of payment choice is
influenced by a wide variety of other factors related to the specific characteristics of the bidder, target and
the deal itself, as well as country–specific regulatory characteristics.
B. Ordered Probit Regressions
A benefit of probit estimation is that it allows us to focus on the qualitative decision to finance
with stock, cash or a mixture of the two and to more accurately account for the fact that our dependent
variable is constrained between zero and one with heavy concentration at the two endpoints. In the
following tables, we report ordered probit results for the full sample, where the dependent variable is two
for pure cash deals, one for deals with mixed financing, and zero for pure stock deals.
[Table IV goes here]
Most of the previous results hold under these various alternative specifications, and most
importantly bidder financial condition and corporate control vulnerability measures are similar in sign and
significance to our earlier OLS estimates. More specifically, we observe in regressions (1) and (4) that all
of the measures of bidder financial strength are statistically significant and of the predicted sign. Turning
to the coefficient on our spline function for dominant shareholder voting rights in 20% to 60% range is
positive and significant in all regressions. In contrast, Martin reports a significant positive effect on cash
21
financing for US acquisitions when bidder management shareholdings are in the 5% to 25% range. The
coefficient on the spline function for voting control above 60% is negative and significant. The
coefficient on the unlisted target indicator is always positive and highly significant, which supports bidder
aversion to creating a new blockholder, while the control loss variable is positive, but significant only in
regression (3). This relatively weaker result may be due to loss of information when passing from OLS
estimations to the ordered probit model, which treats all mixed financing choices identically. In addition,
the variables capturing bidder financial condition, namely collateral, leverage (financial constraint), and
asset value are always significant at the 1% level and their coefficients are all of the expected signs.
These results differ from Martin (1996) in that his leverage and relative offer size measures are never
significant, while his cash flow measure has an unstable sign.
Turning to the control variables in the model, we find relative size of the target to be negative and
significant only in regressions (2) and (3), when the bidder financial condition measures are excluded.
Industry relatedness, bidder stock runup and asset growth are negative and significant in all regressions.
This is similar to Martin’s finding that the coefficient on bidder stock price runup and Tobin’s Q are
significantly negative. The cross-border indicator is positive and significant in all the model estimates.
As for country specific variables, the foreign investment restriction indicator is positive and significant in
all but the first regression. As with the OLS estimates, the prior market runup is never significant.
C. Sensitivity Analysis
C.1. Additional control variables
We assess the robustness of our results by introducing additional deal descriptive variables and by
introducing alternative proxies for many of the variables discussed in previous sections. All regressions
discussed below are estimated after adding the new variables to the regression (5) of Table IV. Unless
otherwise specified, these variables are either added or substituted one at a time. We begin by adding the
percentage of cash used in a bidder’s most recent M&A transaction (see PRIORFIN in Table V,
regression 1). We find it has a significant positive coefficient. However, the magnitude of the coefficient
is small, indicating weak economic importance.
22
Due to the size of the typical merger, these M&A transactions generally require the use of stock
financing. We use an indicator variable MERGER to represent these sample observations. In addition,
Martin (1996) documents a lower likelihood of stock financing in tender offers. This evidence is also
consistent with Fishman’s (1989) model of bidding. We also include indicator variables to represent
deals involving tender offers and asset acquisitions. In line with prior theory and evidence, we find that
tender offers are associated with a higher incidence of cash payments. We find the coefficient on the
merger indicator is a negative and highly statistically significant (p–value<0.01). The coefficient on the
tender offer indicator is 0.50, with a p–value below 0.01, while the asset acquisition indicator is not
significant (Table V, regression 2). 18
[Table V goes here]
Bidders would often prefer to finance with stock when their stock return variance is high, since
they have a greater asymmetric information advantage over new investors in the stock as implied by
Myers and Majluf (1984). So a higher return variance should on average make stock financing more
desirable for bidders, since it increases the opportunities to issue overvalued stock. Higher return
variance also makes debt, and thus cash financing, less desirable for a bidder due to the higher expected
bankruptcy costs and lower expected tax benefits of debt. We measure a bidder’s standard deviation by
its monthly stock return over the year prior to the acquisition announcement month (STNDDEV BIDDER).
We see in regression (3) that the standard deviation is significant and negatively correlated with the frequency
of cash financing (coefficient of –2.39 and p–value<0.05), suggesting that bidder preferences dominate for
the typical M&A deal in our sample.
Illiquid or highly risky bidder stock is likely to reduce a seller’s willingness to accept stock as
deal consideration. We calculate bidder stock liquidity by the ratio of number of shares traded in a
particular month over the average number of shares outstanding at the beginning and end of the same
month. This liquidity ratio is averaged across the twelve months prior to the acquisition announcement
month to obtain a measure of bidder stock liquidity, LIQUIDITY. Examining regression (3), we see that
bidder liquidity is positive, but insignificantly correlated with cash financing.
18 With all these three variables, there is a serious concern about potential endogeneity of an M&A deal’s legal form decision. Specifically, this decision is likely to be made simultaneously with the M&A financing decision and to be driven by many of the same considerations. Since M&A deal form is only used as an additional control variable in some of our robustness tests, we do not explicitly address the problem of endogeneity.
23
In regression (4) we control for tax benefits. Several countries allow a tax exemption in case of
mergers (which are often financed with stocks). We use the Economist Intelligence Unit’s Country
Commerce Reports to build an indicator variable, MERGER TAX BEN, which captures this effect. This
indicator variable takes a value of two if there is any tax advantage for mergers (vs. acquisitions) in both
target and bidder nations, a value one if there is a tax advantage in only one of the nations involved, and
zero if there are no tax advantages in either nation. While controlling for all tax effects of M&A
transactions is a nearly impossible task, we do include a control for capital gains tax benefits for stock and
mixed financing methods.19 We use an indicator variable, STOCK TAX ADVANTAGED, to capture
target nations with individual and corporate capital gains treatment. This variable is also based on
information taken from the Economist Intelligence Unit’s Country Commerce Reports. This indicator
takes value of one if there is any tax advantage to stock payments in the target country and is zero
otherwise.20 As seen on Table V, only the first tax variable is statistically significant. We also examine
the explanatory power of the log of three month LIBOR interest rates in the target country and stock
market return standard deviation in the bidder nation and find that these variables generally lack
explanatory power. To conserve space, we do not report these results.
Cash enables more rapid deal completion, thus lessening the risk of competitive bids and
aggressive takeover defenses (Fishman, 1989). Gilson (1986) documents that stock payments lead to
substantial offer delays in the US, due to security registration and shareholder approval requirements.
Speed is particularly important when a bidder has a high valuation of a target.21 Furthermore, cash lowers
19 Detailed information on the tax codes (i.e., on exemptions, etc…) for all the countries with target firms in our sample is not always available. Moreover, we have very limited information on the target firms themselves such as the depreciation on assets, etc. 20 The US tax code allows for tax–free mergers and acquisitions, under a variety of conditions, the most important being that at least fifty percent of the target’s shares are exchanged for stocks. If conditions for a tax–free deal are met, then capital gain associated with the stock portion of the purchase price can be tax deferred; otherwise the entire the entire unrealized capital gain is taxed. Those offers must include at least fifty percent stock, to obtain this tax benefit. For non–US targets the tax implications are much more varied. Most countries offer no tax advantage to equity financed M&A transactions. However, some countries provide exemptions. In Ireland, capital gains are normally taxed at the standard corporate rate. A special tax exemption exists for business–related assets when sale proceeds are used to acquire new or similar assets within one year before or three years after the disposal date. In the UK, capital gains arising from acquisitions can normally be deferred if shareholders are compensated with shares or bonds rather than cash, provided the enlarged company continues in the same line of business. In addition, mergers create no taxable gains. If Canadian shareholders exchange shares for cash in a merger or takeover, they are taxed on the capital gain. Acquisitions offering optional payment in cash or shares permit a tax–free treatment when shares are chosen. 21 Shleifer and Vishny (2003) show that in a market where rational managers respond to market misevaluations, bidders will pay cash only when targets are undervalued.
24
the likelihood of bid rejection by target management (Fishman, 1989). To control for these hypothesized
effects, we use UNFRIENDLY, an indicator variable that takes value of one if a deal is characterized as
hostile, and is zero otherwise. This characterization is based on SDC data and extensive keyword
searches on Lexis–Nexis for M&A transactions that involve the words: hostile, unfriendly, unsolicited or
white knight. The unfriendly indicator is insignificantly related to the method of payment choice
(coefficient of –0.08, p-value = 0.68). The results are not formally reported in the table.
We next control for the origin of the national legal system (La Porta, Lopez-de-Silanes, Shleifer,
and Vishny, 1998) of the bidder in regression (5) and of the target in regression (6). The coefficients
measure the probability of cash payment relative to the intercept that captures the effect of the
Scandinavian legal system (which has the lowest level of cash financing). We find more frequent bidder
use of cash payments in Germanic countries, though this is not statistically significant, and for common
law countries where the effect of cash financing this is positive and significant. As for target legal
systems, cash payments are significantly more likely when the target is from a Socialist country or from a
common law country.
C.2 Alternative measures of prior explanatory variables
We consider several alternative measures of bidder incentives to preserve corporate control. For
example, since the choice of the 20% and 60% cutoffs is subjective, we examine the effect of replacing
these indicators with the voting control of the largest shareholder and its squared and cubed values. We
obtain similar conclusions about the significance and impact of the bidder’s corporate control concerns.
More specifically, we find the level and its cubed value are negative (with coefficients of –0.0099 and –
5.05E–06, and p-values of 0.17 and 0.009 respectively) and the squared term is significant and positive
(coefficient of 0.0005, p-value of 0.02). Based on the coefficients of the “ultimate voting control” of the
bidder’s dominant shareholder, we estimate cutoff points for the significant corporate control threat
caused by stock financing to be between 11% and 58% voting control. The cutoff points would have
been 15% and 57%, if we employ OLS estimates. These cutoff points are substantially higher than those
identified in the US literature, but close to the 20 and 60 percent cutoffs we employ.
Since there are other mechanisms for maintaining corporate control, we also investigate the
effects of buyers issuing stock with weak voting rights due to pyramids or a dual class shares structure in
25
regression (7), by including an indicator variable for these voting structures, WEAK VOTING RIGHTS.
Pyramids occur when bidder Y has an ultimate owner, who controls Y indirectly through another
corporation that he does not wholly control. Dual class shares are defined as several classes of
outstanding stock with differing voting rights, including non–voting and limited voting shares. The
“weak voting rights” indicator is positive and significantly related to the proportion of cash financing.
This result is consistent with the idea that bidders’ controlling shareholders find it valuable to maintain
control over all companies belonging to their business group.
A bidder’s payment choice can be constrained by several factors. A bidder with few excess
liquid assets, few tangible assets and little unused debt capacity (i.e. high leverage relative to its industry)
can be strongly constrained in its use of cash. We use several additional variables to measure a firm’s
ability to pay for an M&A transaction in cash. In regression (7), Table V, we include a cash holding
measure, CASH, which represents excess liquid assets and is measured as the sum of cash plus traded
securities divided by total assets.22 In our regression, cash reserves are significantly and negatively
correlated with the proportion of cash used as consideration in M&A deals (coefficient is –0.006, p–value
is <0.05).
Buying a subsidiary is much like buying a private company in that the target or more precisely its
parent has a strong negotiating position. Unless it faces a financial distress threat or similar short term
cash need, the target and its parent can just say no to a potential bidder if it is not completely satisfied
with an offer. A likely consequence is a greater use of cash in such deals, since bidders are frequently
motivated to divest subsidiaries to finance new acquisitions or reduce their debt burden. Fuller, Netter
and Stegemoller (2002) observe that mergers and acquisitions of US subsidiaries are generally financed
with cash and these deals tend to be small. In regression (8), we find cash payments to be more likely
when the target is a subsidiary (coefficient of 0.30, p-value < 0.01), which is consistent with buyers
avoiding stock financing to minimize corporate control threats, which could be viewed as a serious threat
given the divesting firm’s financial wherewithal.
As an alternative measure of a bidder cash constraint, we estimate unused debt capacity,
LEVFIN, as the difference between a bidder’s leverage ratio from its industry mean; leverage is measured
22 Martin (1996) documents a higher likelihood of stock financing by cash rich bidders, while Chaney, Lovata and Philipich (1991) find the opposite result.
26
by book value of debt divided by the sum of market value of equity plus book value of debt and the industry
is defined as all firms in the same 3 digit SIC code for our 13 bidder countries. We find highly levered
bidders are insignificantly less likely to finance M&A transactions with cash (coefficient of –0.04 and p–
value = 0.84, when substituting the financial constraint variable).
Recognizing that exchange rate fluctuations in cross-border deals can be less of a concern for
Euro–zone deals relative to other cross-border deals, we examine the impact of using a EURO ZONE
indicator variable in regression (9). If we omit the cross–border deal indicator, then Euro–zone deals
significantly reduce cash financing (coefficient of –0.44 and p–value < 0.01), but the coefficient is
statistically insignificant when the cross border indicator is also included in the model specification,
which suggest that the cross border variable captures the exchange rate risk as well as the home bias.
An alternative measure of a bidder’s growth opportunities is the MKT–TO–BOOK ratio. This
ratio is measured by the year-end market value of equity (ordinary and preferred) plus book value of debt
divided by the sum of book value of equity plus book value of debt, measured prior to the M&A
announcement. This ratio is an attractive growth measure because it is forward looking, but has the
disadvantage that it is strongly influenced by financial accounting policies. Though not formally
reported, the market to book ratio has a significant negative effect on the use of cash financing
(coefficient of –0.05 and p–value < 0.01), similar to the bidder’s asset growth rate.
C.3 U.K. vs. non-U.K. bidders.
Since a majority of our M&A sample involves UK bidders, we estimate our primary findings
separately for UK and non-UK bidders. This distinction can be particularly relevant because UK share
ownership tends to be less concentrated than other European nations. In our sample, the average voting
stake controlled by the bidder’s largest shareholder is 18% for UK bidders, and 29% for non-UK bidders.
Results are shown in Table VI for the UK and continental European bidders. Although corporate
control variables are important for both samples, we document some interesting differences. The
proportion of cash increases significantly when a non-UK bidder’s controlling shareholder has between
20 and 60 percent of voting power, and this coefficient is positive, but not always statistically significant
for UK bidders. When UK bidders have a shareholder with at least 60 percent voting control, they
27
typically use a significantly lower proportion of cash (this result is not always significant for all model
specifications).
We find both UK and non–UK bidders are very reluctant to use stock financing in deals involving
unlisted targets. As pointed out earlier, this significant effect is consistent with bidder aversion to
substantially diluting or threatening the control positions of their dominant shareholders. In this case, we
observe a much higher reluctance to use stock financing for UK bidders. This result is likely to reflect the
typically more diffuse ownership of UK stocks, which can make these bidder managers more sensitive to
creating a large new shareholder group. Using probit estimation, we find the control loss variable to be
insignificant for both the UK and non-UK samples. However, when we use OLS estimation, this control
loss variable is significant and positively related to the method of payment (with the expected sign) in the
UK sample.
[Table VI goes here]
Examining the variables measuring bidder financial condition, we find bidder collateral, financial
leverage, and asset value to be highly significant, supporting the prediction that bidder financial condition
has a strong influence on the method of payment choice with collateral and asset size increasing cash
financing and leverage decreasing it. This strongly supports the conclusion that stock financing becomes
more common as measures of bidder financial condition deteriorate.
As for the importance of our other explanatory variables, we find the cross-border indicator is
positively and significantly associated with the use of cash payments in both samples, while asset growth,
and stock price run-up are negatively and significantly related to cash payments. The relative deal size is
significantly, negatively associated with cash payments for the UK sample in regressions (1) and (3). The
industry relatedness indicator is negative but only significant in the non-UK sample. The foreign capital
restrictions indicator is significant only in some of the regressions of both subsamples of bids. As before,
the business cycle dummy is never significant.
V. Conclusions
We explore the determinants of M&A financing decisions using a large sample of European
transactions over the period 1997-2000. Our primary focus is on the trade-off between buyer financing
constraints, which encourages stock financing and bidder corporate control threats, which discourage
28
stock financing. We find that corporate control concerns of bidders’ dominant shareholders and its
financial condition have a clear influence on European M&A financing choices. Bidders prefer cash
financing of M&A transactions when the voting control of their dominant shareholders is threatened. This
is particularly the case when bidder stock is paid to shareholders of a closely held target. Furthermore,
corporate control incentives to choose cash are found to be particularly strong when a bidder’s controlling
shareholder has an intermediate level of voting power in the range of 20 to 60 percent. Our results also
strongly support a pattern of European bidders choosing stock financing with greater frequency as
measures of their financial condition weaken. We find much stronger effects for buyer financial
conditions in Europe than Martin (1996) finds for the US.
We find several other bidder characteristics to be significant factors in the M&A payment choice,
including prior stock price runup and asset growth. In addition, we find target and deal characteristics
along with legal and regulatory variables are important determinants of the M&A financing decision.
Statistically significant explanatory variables include deal size divided by bidder equity capitalization,
cross border and cross industry deals, restrictions on foreign equity investments and cash payment option
regulations. Overall, these bidder financial condition, corporate control threat and deal characteristics can
explain 22% of the cross sectional variability in M&A financing decisions, measured by the portion of the
M&A purchase price paid in cash.
29
References:
Amihud, Yakov, Baruch Lev, and Nickolaos G. Travlos, 1990, Corporate control and the choice of
investment financing: The case of corporate acquisitions, Journal of Finance, 45: 603–616.
Andrade, Gregor, Mark Mitchell, and Erik Stafford, 2001, New evidence and perspectives on mergers?
Journal of Economic Perspectives, 15: 103–120.
Ang, James S., Jess H. Chua, and John J. McConnell, 1982, The administrative costs of corporate
bankruptcy, Journal of Finance, 37: 219–226.
Bianchi, Marcello, Bianco, Magda, and Luca Enriques, 2001, Pyramidal groups and the separation
between ownership and control in Italy, in F. Barca and M. Becht, ed, The control of corporate Europe
(Oxford University Press).
Bloch, Laurence, and Elizabeth Kremp, 2001, Ownership and control in France, in F. Barca and M.
Becht, ed, The control of corporate Europe (Oxford University Press).
Brown, David T., and Michael D. Ryngaert, 1991, The mode of acquisition in takeovers: Taxes and
asymmetric information, Journal of Finance, 46: 653–669.
Chaney, Paul K., Linda M. Lovata, and Kirk L. Philipich, 1991, Acquiring firms characteristics and the
medium of exchange, Quarterly Journal of Business and Economics, 30: 55–69.
Choe, Hyuk, Ronald W. Masulis, and Vikram Nanda, 1993, Common stock offerings across the business
cycle, Journal of Empirical Finance, 1: 3–31.
Coval, Joshua, and Tobias Moskowitz, 1999, Home bias at home: Local equity preference in domestic
portfolios, Journal of Finance, 54: 2045–2073.
Dyck, Alexander, and Luigi Zingales, 2003, Private benefits of control: An international comparison, Journal
of Finance, forthcoming.
Eckbo, B. Espen, and Herwig Langohr, 1989, Information disclosure, method of payment, and takeover
premiums: Public and private tender offers in France, Journal of Financial Economics, 24: 363–404.
Eckbo, B. Espen, Ronald M. Giammarino, and Robert L. Heinkel, 1990, Asymmetric information and the
medium of exchange in takeovers: Theory and tests, The Review of Financial Studies, 3: 651–675.

30
Faccio, Mara, and Larry H. P. Lang, 2002, The ultimate ownership of western European corporations,
Journal of Financial Economics, 65: 365–395.
Fishman, Michael J., 1989, Preemptive bidding and the role of the medium of exchange in acquisitions,
Journal of Finance, 44: 41–57.
Franks, Julian R., Robert S. Harris, and Colin Mayer, 1988, Means of payment in takeovers: Results for
the United Kingdom and the United States, in: (Alan J. Auerbach ed.) Corporate takeovers: Causes and
consequences, The University of Chicago Press.
French, Kenneth, and James Poterba, 1991, Investor diversification and international equity markets,
American Economic Review, 81: 222–226.
Fuller, Kathleen, Jeffry Netter, and Mike Stegemoller, 2002, What do returns to acquiring firms tell us?
Evidence from firms that make many acquisitions, Journal of Finance, 57: 1763–1793.
Gadhoum, Yoser, Larry H.P. Lang and Leslie Young, 2003, Who controls US?, Chinese University of
Hong Kong Working Paper.
Ghosh, Aloke, and William Ruland, 1998, Managerial ownership, the method of payment for
acquisitions, and executive job retention, Journal of Finance, 53: 785–798.
Gilson, Ronald J., 1986, The law and finance of corporate acquisitions. The Foundation Press, Inc.,
Mineola, NY.
Goergen, Marc, and Luc Renneboog, 2001, Strong managers and passive institutional investors in the
UK, in F. Barca and M. Becht, ed, The control of corporate Europe (Oxford University Press).
Grinblatt, Matt, and Matti Keloharju, 2001, How distance, language and culture influence stockholdings
and trades, Journal of Finance, 56: 1053–1073.
Hansen, Robert G., 1987, A theory for the choice of exchange medium in mergers and acquisitions.
Journal of Business, 60: 75–95.
Harris, Milton, and Arthur Raviv, 1988, Corporate control contests and capital structure, Journal of
Financial Economics, 20: 55–86.
31
Hovakimian, Armen, Tim Opler, and Sheridan Titman, 2001, The debt–equity choice, Journal of
Financial and Quantitative Analysis, 36: 1–25.
Jung, Kooyul, Yong–Cheol Kim, and René M. Stulz, 1996, Timing, investment opportunities, managerial
discretion, and the security issue decision, Journal of Financial Economics, 42: 159–185.
Korajczyk, Robert A., Deborah Lucas and Robert MacDonald, 1991, The effect of information releases
on the pricing and timing of equity issues, Review of Financial Studies, 4: 695–708.
La Porta, Rafael, Florencio Lopez–de–Silanes, Andrei Shleifer, and Robert W. Vishny, 1998, Law and
finance, Journal of Political Economy, 106: 1113–1155.
La Porta, Rafael, Florencio Lopez–de–Silanes and Andrei Shleifer, 1999, Corporate ownership around the
world, Journal of Finance, 54: 471-518.
Loughran, Tim, and Anand M. Vijh, 1997, Do long–term shareholders benefit from corporate
acquisitions?, Journal of Finance, 52: 1765–1790.
Lowry, Michelle, and G. William Schwert, 2002, IPO market cycles: bubbles or sequential learning?,
Journal of Finance, 57: 1171–1200.
Martin, Kenneth J., 1996, The method of payment in corporate acquisitions, investment opportunities, and
management ownership, Journal of Finance, 51: 1227–1246.
Myers, Stewart C., 1977, Determinants of corporate borrowing, Journal of Financial Economics, 5: 147–
175.
Myers, Stewart C., and Nicholas S. Majluf, 1984, Corporate financing and investment decisions when
firms have information that investors do no have, Journal of Financial Economics, 13: 187–221.
Nenova, Tatiana, 2003, The value of corporate votes and control benefits: A cross–country analysis, Journal
of Financial Economics, 68: 325–351.
Servaes, Henri, 1991, Tobin’s Q and the gains from takeovers, Journal of Finance, 46: 409–419.
Shleifer, Andrei, and Robert W. Vishny, 2003, Stock market driven acquisitions, Journal of Financial
Economics, forthcoming.
Stulz, René M., 1988, Managerial control of voting rights, Journal of Financial Economics, 20: 25–54.
32
Thorburn, Karin S., 2000, Bankruptcy auctions: costs, debt recovery, and firm survival, Journal of
Financial Economics, 58: 337–368.
Travlos, Nickolaos G., 1987, Corporate takeover bids, method of payment, and bidding firms’ stock
returns, Journal of Finance, 42: 943–963.
Wansley, James W., William R. Lane and Ho C. Yang, 1987, Gains to bidder firms in cash and securities
transactions, Financial Review, 22: 403–414.
Warner, Jarold, 1977, Bankruptcy costs: Some evidence, Journal of Finance, 32: 337–347.
Zhang, Pinghshun, 2003, What really determines the payment methods in M&A deals, Manchester
School of Management Working Paper.
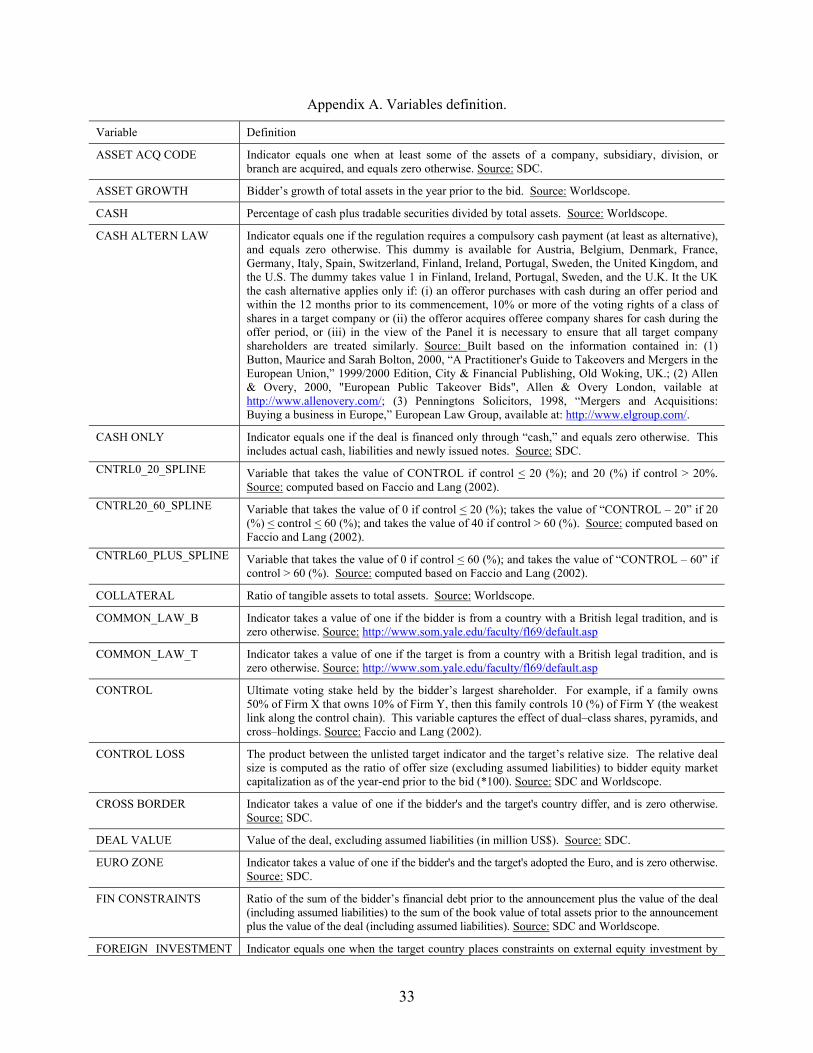
33
Appendix A. Variables definition.
Variable Definition
ASSET ACQ CODE Indicator equals one when at least some of the assets of a company, subsidiary, division, or branch are acquired, and equals zero otherwise. Source: SDC.
ASSET GROWTH Bidder’s growth of total assets in the year prior to the bid. Source: Worldscope.
CASH Percentage of cash plus tradable securities divided by total assets. Source: Worldscope.
CASH ALTERN LAW Indicator equals one if the regulation requires a compulsory cash payment (at least as alternative), and equals zero otherwise. This dummy is available for Austria, Belgium, Denmark, France, Germany, Italy, Spain, Switzerland, Finland, Ireland, Portugal, Sweden, the United Kingdom, and the U.S. The dummy takes value 1 in Finland, Ireland, Portugal, Sweden, and the U.K. It the UK the cash alternative applies only if: (i) an offeror purchases with cash during an offer period and within the 12 months prior to its commencement, 10% or more of the voting rights of a class of shares in a target company or (ii) the offeror acquires offeree company shares for cash during the offer period, or (iii) in the view of the Panel it is necessary to ensure that all target company shareholders are treated similarly. Source: Built based on the information contained in: (1) Button, Maurice and Sarah Bolton, 2000, “A Practitioner's Guide to Takeovers and Mergers in the European Union,” 1999/2000 Edition, City & Financial Publishing, Old Woking, UK.; (2) Allen & Overy, 2000, "European Public Takeover Bids", Allen & Overy London, vailable at http://www.allenovery.com/; (3) Penningtons Solicitors, 1998, “Mergers and Acquisitions: Buying a business in Europe,” European Law Group, available at: http://www.elgroup.com/.
CASH ONLY Indicator equals one if the deal is financed only through “cash,” and equals zero otherwise. This includes actual cash, liabilities and newly issued notes. Source: SDC.
CNTRL0_20_SPLINE Variable that takes the value of CONTROL if control < 20 (%); and 20 (%) if control > 20%. Source: computed based on Faccio and Lang (2002).
CNTRL20_60_SPLINE Variable that takes the value of 0 if control < 20 (%); takes the value of “CONTROL – 20” if 20 (%) < control < 60 (%); and takes the value of 40 if control > 60 (%). Source: computed based on Faccio and Lang (2002).
CNTRL60_PLUS_SPLINE Variable that takes the value of 0 if control < 60 (%); and takes the value of “CONTROL – 60” if control > 60 (%). Source: computed based on Faccio and Lang (2002).
COLLATERAL Ratio of tangible assets to total assets. Source: Worldscope.
COMMON_LAW_B Indicator takes a value of one if the bidder is from a country with a British legal tradition, and is zero otherwise. Source: http://www.som.yale.edu/faculty/fl69/default.asp
COMMON_LAW_T Indicator takes a value of one if the target is from a country with a British legal tradition, and is zero otherwise. Source: http://www.som.yale.edu/faculty/fl69/default.asp
CONTROL Ultimate voting stake held by the bidder’s largest shareholder. For example, if a family owns 50% of Firm X that owns 10% of Firm Y, then this family controls 10 (%) of Firm Y (the weakest link along the control chain). This variable captures the effect of dual–class shares, pyramids, and cross–holdings. Source: Faccio and Lang (2002).
CONTROL LOSS The product between the unlisted target indicator and the target’s relative size. The relative deal size is computed as the ratio of offer size (excluding assumed liabilities) to bidder equity market capitalization as of the year-end prior to the bid (*100). Source: SDC and Worldscope.
CROSS BORDER Indicator takes a value of one if the bidder's and the target's country differ, and is zero otherwise. Source: SDC.
DEAL VALUE Value of the deal, excluding assumed liabilities (in million US$). Source: SDC.
EURO ZONE Indicator takes a value of one if the bidder's and the target's adopted the Euro, and is zero otherwise. Source: SDC.
FIN CONSTRAINTS Ratio of the sum of the bidder’s financial debt prior to the announcement plus the value of the deal (including assumed liabilities) to the sum of the book value of total assets prior to the announcement plus the value of the deal (including assumed liabilities). Source: SDC and Worldscope.
FOREIGN INVESTMENT Indicator equals one when the target country places constraints on external equity investment by
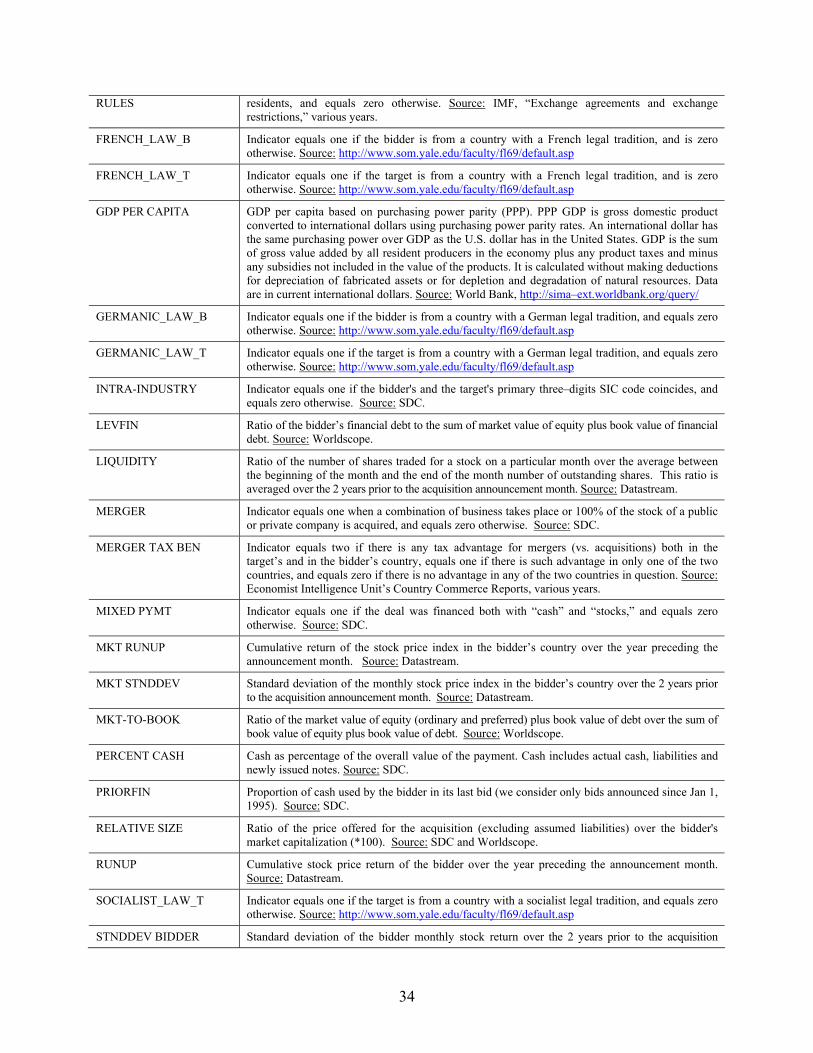
34
RULES residents, and equals zero otherwise. Source: IMF, “Exchange agreements and exchange restrictions,” various years.
FRENCH_LAW_B Indicator equals one if the bidder is from a country with a French legal tradition, and is zero otherwise. Source: http://www.som.yale.edu/faculty/fl69/default.asp
FRENCH_LAW_T Indicator equals one if the target is from a country with a French legal tradition, and is zero otherwise. Source: http://www.som.yale.edu/faculty/fl69/default.asp
GDP PER CAPITA GDP per capita based on purchasing power parity (PPP). PPP GDP is gross domestic product converted to international dollars using purchasing power parity rates. An international dollar has the same purchasing power over GDP as the U.S. dollar has in the United States. GDP is the sum of gross value added by all resident producers in the economy plus any product taxes and minus any subsidies not included in the value of the products. It is calculated without making deductions for depreciation of fabricated assets or for depletion and degradation of natural resources. Data are in current international dollars. Source: World Bank, http://sima–ext.worldbank.org/query/
GERMANIC_LAW_B Indicator equals one if the bidder is from a country with a German legal tradition, and equals zero otherwise. Source: http://www.som.yale.edu/faculty/fl69/default.asp
GERMANIC_LAW_T Indicator equals one if the target is from a country with a German legal tradition, and equals zero otherwise. Source: http://www.som.yale.edu/faculty/fl69/default.asp
INTRA-INDUSTRY Indicator equals one if the bidder's and the target's primary three–digits SIC code coincides, and equals zero otherwise. Source: SDC.
LEVFIN Ratio of the bidder’s financial debt to the sum of market value of equity plus book value of financial debt. Source: Worldscope.
LIQUIDITY Ratio of the number of shares traded for a stock on a particular month over the average between the beginning of the month and the end of the month number of outstanding shares. This ratio is averaged over the 2 years prior to the acquisition announcement month. Source: Datastream.
MERGER Indicator equals one when a combination of business takes place or 100% of the stock of a public or private company is acquired, and equals zero otherwise. Source: SDC.
MERGER TAX BEN Indicator equals two if there is any tax advantage for mergers (vs. acquisitions) both in the target’s and in the bidder’s country, equals one if there is such advantage in only one of the two countries, and equals zero if there is no advantage in any of the two countries in question. Source: Economist Intelligence Unit’s Country Commerce Reports, various years.
MIXED PYMT Indicator equals one if the deal was financed both with “cash” and “stocks,” and equals zero otherwise. Source: SDC.
MKT RUNUP Cumulative return of the stock price index in the bidder’s country over the year preceding the announcement month. Source: Datastream.
MKT STNDDEV Standard deviation of the monthly stock price index in the bidder’s country over the 2 years prior to the acquisition announcement month. Source: Datastream.
MKT-TO-BOOK Ratio of the market value of equity (ordinary and preferred) plus book value of debt over the sum of book value of equity plus book value of debt. Source: Worldscope.
PERCENT CASH Cash as percentage of the overall value of the payment. Cash includes actual cash, liabilities and newly issued notes. Source: SDC.
PRIORFIN Proportion of cash used by the bidder in its last bid (we consider only bids announced since Jan 1, 1995). Source: SDC.
RELATIVE SIZE Ratio of the price offered for the acquisition (excluding assumed liabilities) over the bidder's market capitalization (*100). Source: SDC and Worldscope.
RUNUP Cumulative stock price return of the bidder over the year preceding the announcement month. Source: Datastream.
SOCIALIST_LAW_T Indicator equals one if the target is from a country with a socialist legal tradition, and equals zero otherwise. Source: http://www.som.yale.edu/faculty/fl69/default.asp
STNDDEV BIDDER Standard deviation of the bidder monthly stock return over the 2 years prior to the acquisition
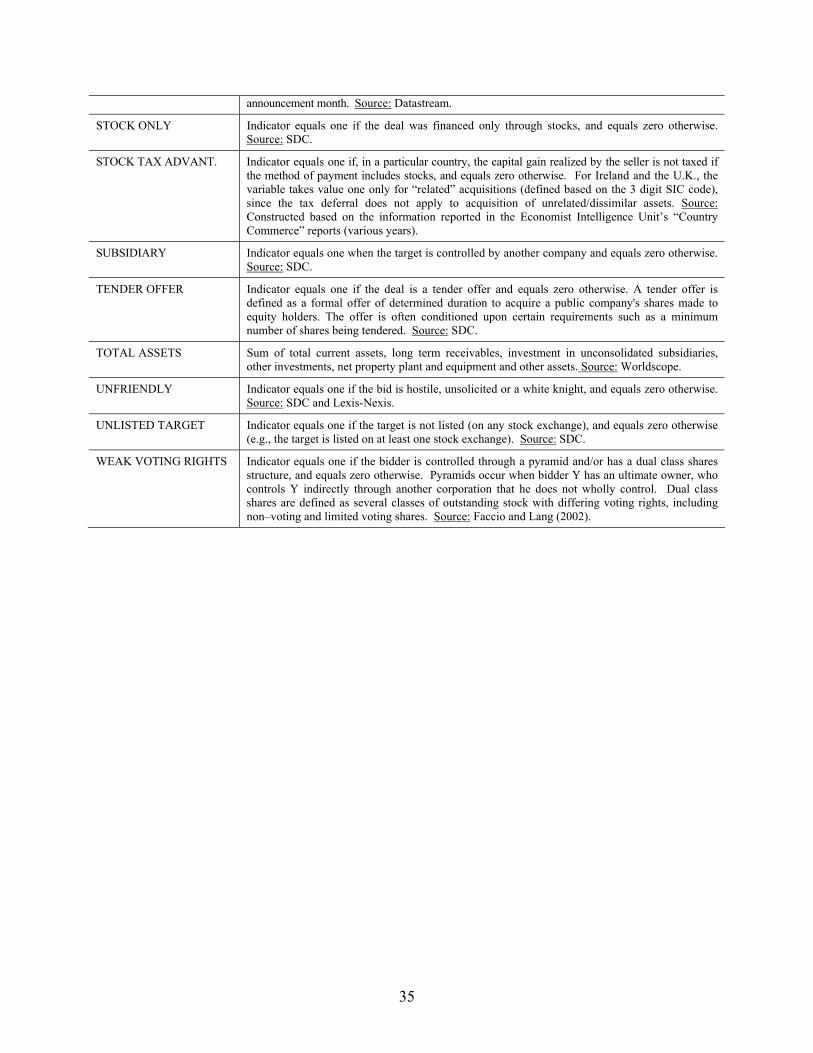
35
announcement month. Source: Datastream.
STOCK ONLY Indicator equals one if the deal was financed only through stocks, and equals zero otherwise. Source: SDC.
STOCK TAX ADVANT. Indicator equals one if, in a particular country, the capital gain realized by the seller is not taxed if the method of payment includes stocks, and equals zero otherwise. For Ireland and the U.K., the variable takes value one only for “related” acquisitions (defined based on the 3 digit SIC code), since the tax deferral does not apply to acquisition of unrelated/dissimilar assets. Source: Constructed based on the information reported in the Economist Intelligence Unit’s “Country Commerce” reports (various years).
SUBSIDIARY Indicator equals one when the target is controlled by another company and equals zero otherwise. Source: SDC.
TENDER OFFER Indicator equals one if the deal is a tender offer and equals zero otherwise. A tender offer is defined as a formal offer of determined duration to acquire a public company's shares made to equity holders. The offer is often conditioned upon certain requirements such as a minimum number of shares being tendered. Source: SDC.
TOTAL ASSETS Sum of total current assets, long term receivables, investment in unconsolidated subsidiaries, other investments, net property plant and equipment and other assets. Source: Worldscope.
UNFRIENDLY Indicator equals one if the bid is hostile, unsolicited or a white knight, and equals zero otherwise. Source: SDC and Lexis-Nexis.
UNLISTED TARGET Indicator equals one if the target is not listed (on any stock exchange), and equals zero otherwise (e.g., the target is listed on at least one stock exchange). Source: SDC.
WEAK VOTING RIGHTS Indicator equals one if the bidder is controlled through a pyramid and/or has a dual class shares structure, and equals zero otherwise. Pyramids occur when bidder Y has an ultimate owner, who controls Y indirectly through another corporation that he does not wholly control. Dual class shares are defined as several classes of outstanding stock with differing voting rights, including non–voting and limited voting shares. Source: Faccio and Lang (2002).
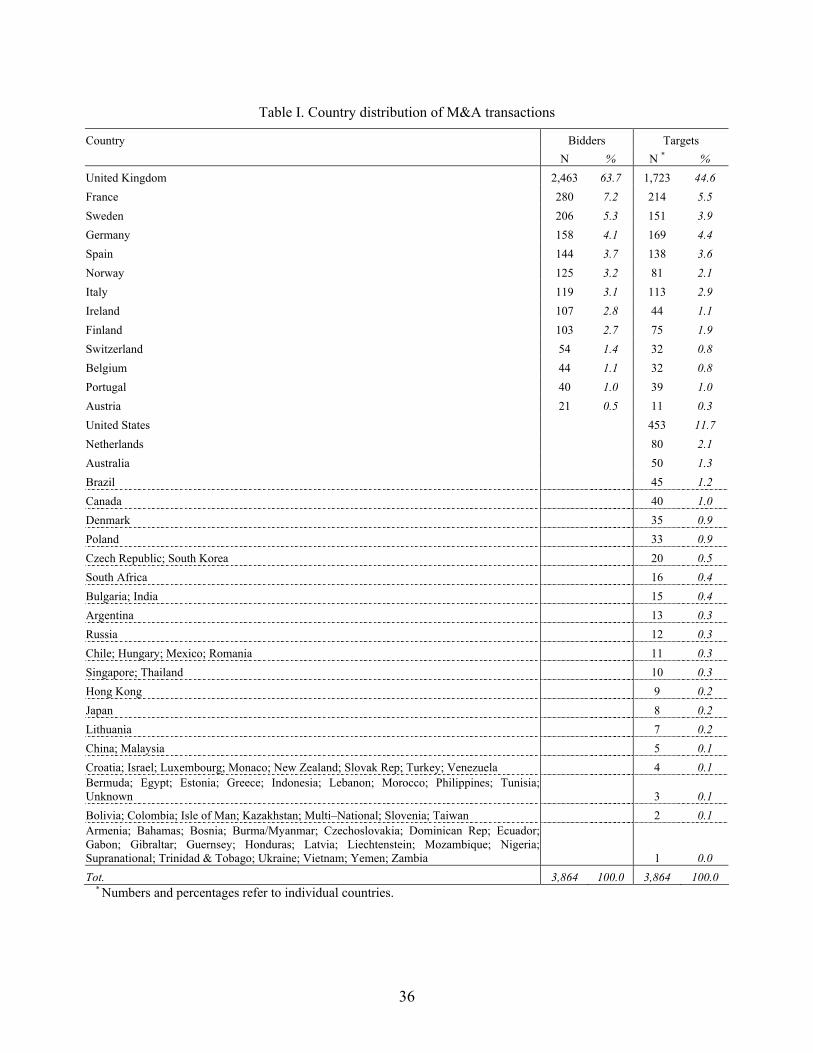
36
Table I. Country distribution of M&A transactions
Country Bidders Targets N % N * % United Kingdom 2,463 63.7 1,723 44.6 France 280 7.2 214 5.5 Sweden 206 5.3 151 3.9 Germany 158 4.1 169 4.4 Spain 144 3.7 138 3.6 Norway 125 3.2 81 2.1 Italy 119 3.1 113 2.9 Ireland 107 2.8 44 1.1 Finland 103 2.7 75 1.9 Switzerland 54 1.4 32 0.8 Belgium 44 1.1 32 0.8 Portugal 40 1.0 39 1.0 Austria 21 0.5 11 0.3 United States 453 11.7 Netherlands 80 2.1 Australia 50 1.3 Brazil 45 1.2 Canada 40 1.0 Denmark 35 0.9 Poland 33 0.9 Czech Republic; South Korea 20 0.5 South Africa 16 0.4 Bulgaria; India 15 0.4 Argentina 13 0.3 Russia 12 0.3 Chile; Hungary; Mexico; Romania 11 0.3 Singapore; Thailand 10 0.3 Hong Kong 9 0.2 Japan 8 0.2 Lithuania 7 0.2 China; Malaysia 5 0.1 Croatia; Israel; Luxembourg; Monaco; New Zealand; Slovak Rep; Turkey; Venezuela 4 0.1 Bermuda; Egypt; Estonia; Greece; Indonesia; Lebanon; Morocco; Philippines; Tunisia; Unknown 3 0.1 Bolivia; Colombia; Isle of Man; Kazakhstan; Multi–National; Slovenia; Taiwan 2 0.1 Armenia; Bahamas; Bosnia; Burma/Myanmar; Czechoslovakia; Dominican Rep; Ecuador; Gabon; Gibraltar; Guernsey; Honduras; Latvia; Liechtenstein; Mozambique; Nigeria; Supranational; Trinidad & Tobago; Ukraine; Vietnam; Yemen; Zambia 1 0.0 Tot. 3,864 100.0 3,864 100.0
* Numbers and percentages refer to individual countries.
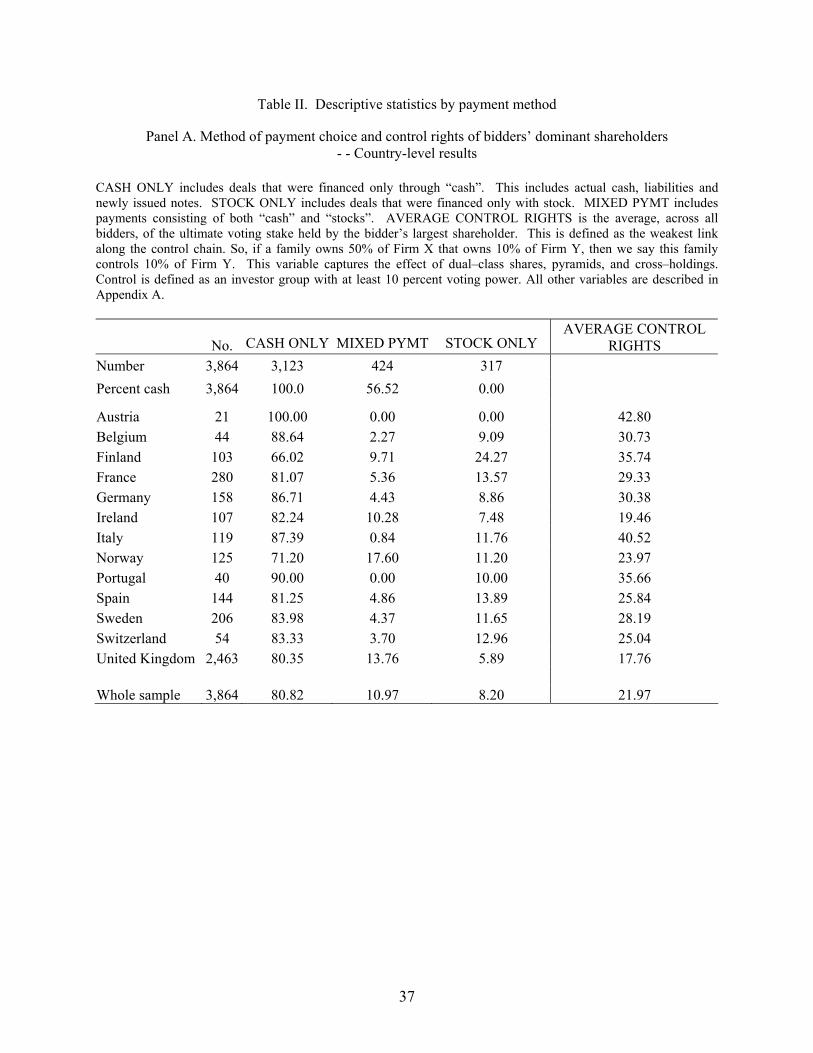
37
Table II. Descriptive statistics by payment method
Panel A. Method of payment choice and control rights of bidders’ dominant shareholders - - Country-level results
CASH ONLY includes deals that were financed only through “cash”. This includes actual cash, liabilities and newly issued notes. STOCK ONLY includes deals that were financed only with stock. MIXED PYMT includes payments consisting of both “cash” and “stocks”. AVERAGE CONTROL RIGHTS is the average, across all bidders, of the ultimate voting stake held by the bidder’s largest shareholder. This is defined as the weakest link along the control chain. So, if a family owns 50% of Firm X that owns 10% of Firm Y, then we say this family controls 10% of Firm Y. This variable captures the effect of dual–class shares, pyramids, and cross–holdings. Control is defined as an investor group with at least 10 percent voting power. All other variables are described in Appendix A.
No. CASH ONLY MIXED PYMT STOCK ONLY AVERAGE CONTROL
RIGHTS Number 3,864 3,123 424 317 Percent cash 3,864 100.0 56.52 0.00
Austria 21 100.00 0.00 0.00 42.80 Belgium 44 88.64 2.27 9.09 30.73 Finland 103 66.02 9.71 24.27 35.74 France 280 81.07 5.36 13.57 29.33 Germany 158 86.71 4.43 8.86 30.38 Ireland 107 82.24 10.28 7.48 19.46 Italy 119 87.39 0.84 11.76 40.52 Norway 125 71.20 17.60 11.20 23.97 Portugal 40 90.00 0.00 10.00 35.66 Spain 144 81.25 4.86 13.89 25.84 Sweden 206 83.98 4.37 11.65 28.19 Switzerland 54 83.33 3.70 12.96 25.04 United Kingdom 2,463 80.35 13.76 5.89 17.76 Whole sample 3,864 80.82 10.97 8.20 21.97
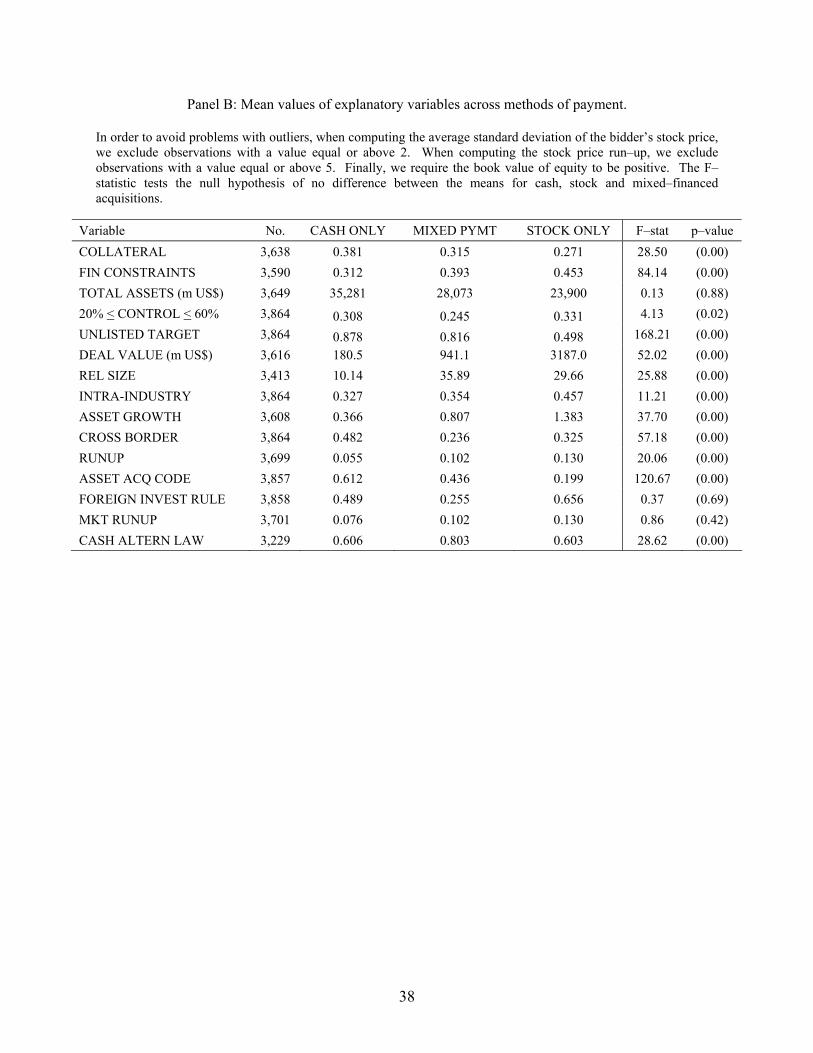
38
Panel B: Mean values of explanatory variables across methods of payment.
In order to avoid problems with outliers, when computing the average standard deviation of the bidder’s stock price, we exclude observations with a value equal or above 2. When computing the stock price run–up, we exclude observations with a value equal or above 5. Finally, we require the book value of equity to be positive. The F–statistic tests the null hypothesis of no difference between the means for cash, stock and mixed–financed acquisitions.
Variable No. CASH ONLY MIXED PYMT STOCK ONLY F–stat p–value COLLATERAL 3,638 0.381 0.315 0.271 28.50 (0.00) FIN CONSTRAINTS 3,590 0.312 0.393 0.453 84.14 (0.00) TOTAL ASSETS (m US$) 3,649 35,281 28,073 23,900 0.13 (0.88) 20% < CONTROL < 60% 3,864 0.308 0.245 0.331 4.13 (0.02) UNLISTED TARGET 3,864 0.878 0.816 0.498 168.21 (0.00) DEAL VALUE (m US$) 3,616 180.5 941.1 3187.0 52.02 (0.00) REL SIZE 3,413 10.14 35.89 29.66 25.88 (0.00) INTRA-INDUSTRY 3,864 0.327 0.354 0.457 11.21 (0.00) ASSET GROWTH 3,608 0.366 0.807 1.383 37.70 (0.00) CROSS BORDER 3,864 0.482 0.236 0.325 57.18 (0.00) RUNUP 3,699 0.055 0.102 0.130 20.06 (0.00) ASSET ACQ CODE 3,857 0.612 0.436 0.199 120.67 (0.00) FOREIGN INVEST RULE 3,858 0.489 0.255 0.656 0.37 (0.69) MKT RUNUP 3,701 0.076 0.102 0.130 0.86 (0.42) CASH ALTERN LAW 3,229 0.606 0.803 0.603 28.62 (0.00)

39
Table III. OLS Regressions Explaining Percent Cash Financing in M&A Deals White heteroscedasticity-consistent t-statistics and are shown in parentheses. In order to avoid problems with outliers, when computing the stock price run–up, we exclude observations with a value equal or above 5. Furthermore, we always require the book value of equity to be positive. Symbols *, **, and *** denote significance at the 1%, 5% and 10% level, respectively. The variable definitions are given in Appendix A.
(1) (2) (3) (4) (5) VARIABLE Coeff. t–stat Coeff. t–stat Coeff. t–stat Coeff. t–stat Coeff. t–stat COLLATERAL 16.62* (7.93) 13.20 * (6.79) 15.00* (7.45) 14.88* (7.00) FIN CONSTRAINTS –35.48* (–9.72) –22.46 * (–6.59) –20.45* (–6.04) –22.73* (–6.30)LOG (TOTAL ASSETS) 0.41 (1.45) 1.33 * (4.98) 0.80* (2.82) 0.54*** (1.67) CNTRL0_20_SPLINE –0.19** (–2.52) –0.08 (–1.05) –0.03 (–0.35) –0.004 (–0.05)CNTRL20_60_SPLINE 0.16* (2.94) 0.15 * (2.85) 0.15* (2.75) 0.12** (2.02) CNTRL60_PLUS_SPLINE –0.32*** (–1.79) –0.43 ** (–2.32) –0.40** (–2.27) –0.34*** (–1.78)UNLISTED TARGET 20.17* (8.09) 19.95 * (8.07) 19.74* (8.17) 17.15* (5.12) CONTROL LOSS 0.20* (3.25) 0.18 * (3.23) 0.17* (3.01) 0.12** (2.37) RELATIVE SIZE –0.02*** (–1.76) –0.22* (–3.58) –0.19 * (–3.34) –0.18* (–3.16) –0.13** (–2.53)INTRA–INDUSTRY –3.72* (–3.13) –3.85* (–3.38) –2.77 ** (–2.47) –3.33* (–3.01) –3.82* (–3.07)RUNUP –10.54* (–2.97) –18.20* (–5.38) –12.75 * (–3.64) –11.46* (–2.94) –11.34** (–2.53)ASSET GROWTH –1.19* (–2.65) –1.15* (–2.70)CROSS BORDER 7.46* (6.81) 6.56* (5.56) FOREIGN INVEST RULE 3.71** (1.96) MKT RUNUP –3.69 (–0.50) –12.81 (–1.47)CASH ALTERN. LAW –10.94** (–2.39)Intercept 89.44* (21.94) 75.56* (29.41) 57.86 * (11.65) 60.78* (12.46) 68.64* (11.71) N. Obs. 3,077 3,154 3,077 3,057 2,583 Adjusted R–squared 8.28% 14.31% 17.76% 20.09% 21.88% F–statistic 47.28 66.81 61.40 52.22 49.20
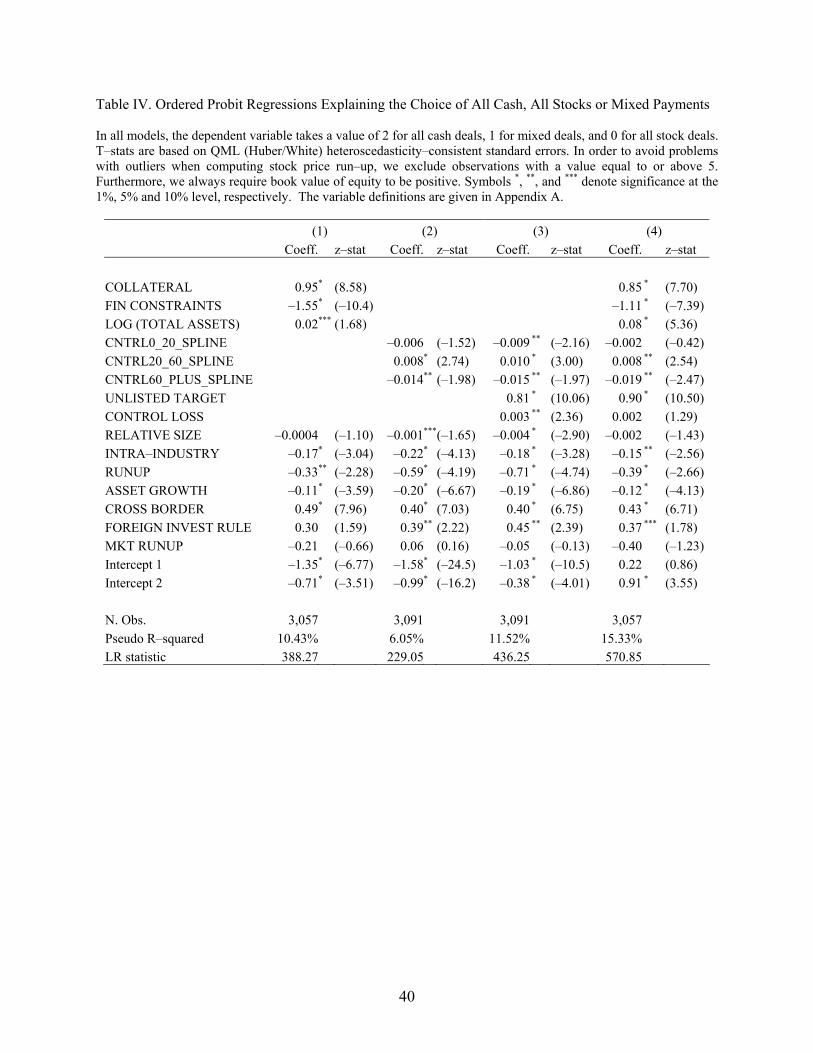
40
Table IV. Ordered Probit Regressions Explaining the Choice of All Cash, All Stocks or Mixed Payments In all models, the dependent variable takes a value of 2 for all cash deals, 1 for mixed deals, and 0 for all stock deals. T–stats are based on QML (Huber/White) heteroscedasticity–consistent standard errors. In order to avoid problems with outliers when computing stock price run–up, we exclude observations with a value equal to or above 5. Furthermore, we always require book value of equity to be positive. Symbols *, **, and *** denote significance at the 1%, 5% and 10% level, respectively. The variable definitions are given in Appendix A.
(1) (2) (3) (4) Coeff. z–stat Coeff. z–stat Coeff. z–stat Coeff. z–stat COLLATERAL 0.95* (8.58) 0.85 * (7.70) FIN CONSTRAINTS –1.55* (–10.4) –1.11 * (–7.39)LOG (TOTAL ASSETS) 0.02*** (1.68) 0.08 * (5.36) CNTRL0_20_SPLINE –0.006 (–1.52) –0.009 ** (–2.16) –0.002 (–0.42)CNTRL20_60_SPLINE 0.008* (2.74) 0.010 * (3.00) 0.008 ** (2.54) CNTRL60_PLUS_SPLINE –0.014** (–1.98) –0.015 ** (–1.97) –0.019 ** (–2.47)UNLISTED TARGET 0.81 * (10.06) 0.90 * (10.50)CONTROL LOSS 0.003 ** (2.36) 0.002 (1.29) RELATIVE SIZE –0.0004 (–1.10) –0.001***(–1.65) –0.004 * (–2.90) –0.002 (–1.43)INTRA–INDUSTRY –0.17* (–3.04) –0.22* (–4.13) –0.18 * (–3.28) –0.15 ** (–2.56)RUNUP –0.33** (–2.28) –0.59* (–4.19) –0.71 * (–4.74) –0.39 * (–2.66)ASSET GROWTH –0.11* (–3.59) –0.20* (–6.67) –0.19 * (–6.86) –0.12 * (–4.13)CROSS BORDER 0.49* (7.96) 0.40* (7.03) 0.40 * (6.75) 0.43 * (6.71) FOREIGN INVEST RULE 0.30 (1.59) 0.39** (2.22) 0.45 ** (2.39) 0.37 *** (1.78) MKT RUNUP –0.21 (–0.66) 0.06 (0.16) –0.05 (–0.13) –0.40 (–1.23)Intercept 1 –1.35* (–6.77) –1.58* (–24.5) –1.03 * (–10.5) 0.22 (0.86) Intercept 2 –0.71* (–3.51) –0.99* (–16.2) –0.38 * (–4.01) 0.91 * (3.55) N. Obs. 3,057 3,091 3,091 3,057 Pseudo R–squared 10.43% 6.05% 11.52% 15.33% LR statistic 388.27 229.05 436.25 570.85
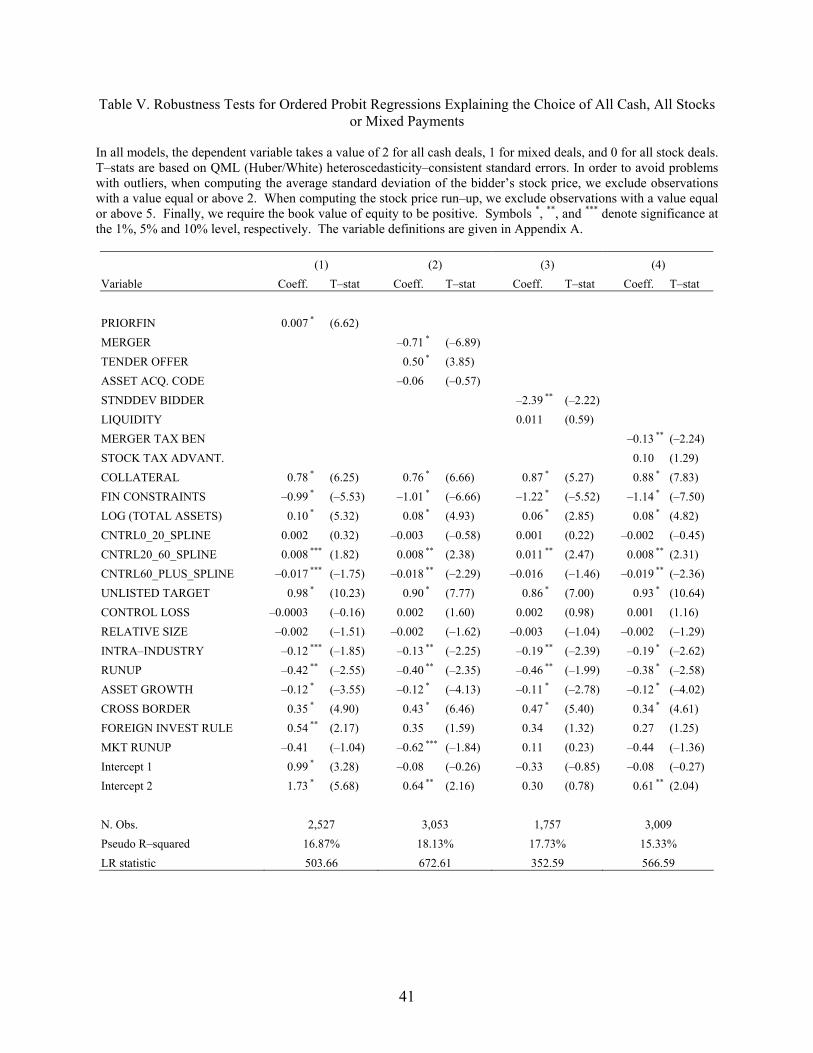
41
Table V. Robustness Tests for Ordered Probit Regressions Explaining the Choice of All Cash, All Stocks or Mixed Payments
In all models, the dependent variable takes a value of 2 for all cash deals, 1 for mixed deals, and 0 for all stock deals. T–stats are based on QML (Huber/White) heteroscedasticity–consistent standard errors. In order to avoid problems with outliers, when computing the average standard deviation of the bidder’s stock price, we exclude observations with a value equal or above 2. When computing the stock price run–up, we exclude observations with a value equal or above 5. Finally, we require the book value of equity to be positive. Symbols *, **, and *** denote significance at the 1%, 5% and 10% level, respectively. The variable definitions are given in Appendix A. (1) (2) (3) (4) Variable Coeff. T–stat Coeff. T–stat Coeff. T–stat Coeff. T–stat
PRIORFIN 0.007 * (6.62) MERGER –0.71 * (–6.89) TENDER OFFER 0.50 * (3.85) ASSET ACQ. CODE –0.06 (–0.57) STNDDEV BIDDER –2.39 ** (–2.22) LIQUIDITY 0.011 (0.59) MERGER TAX BEN –0.13 ** (–2.24) STOCK TAX ADVANT. 0.10 (1.29) COLLATERAL 0.78 * (6.25) 0.76 * (6.66) 0.87 * (5.27) 0.88 * (7.83) FIN CONSTRAINTS –0.99 * (–5.53) –1.01 * (–6.66) –1.22 * (–5.52) –1.14 * (–7.50) LOG (TOTAL ASSETS) 0.10 * (5.32) 0.08 * (4.93) 0.06 * (2.85) 0.08 * (4.82) CNTRL0_20_SPLINE 0.002 (0.32) –0.003 (–0.58) 0.001 (0.22) –0.002 (–0.45) CNTRL20_60_SPLINE 0.008 *** (1.82) 0.008 ** (2.38) 0.011 ** (2.47) 0.008 ** (2.31) CNTRL60_PLUS_SPLINE –0.017 *** (–1.75) –0.018 ** (–2.29) –0.016 (–1.46) –0.019 ** (–2.36) UNLISTED TARGET 0.98 * (10.23) 0.90 * (7.77) 0.86 * (7.00) 0.93 * (10.64) CONTROL LOSS –0.0003 (–0.16) 0.002 (1.60) 0.002 (0.98) 0.001 (1.16) RELATIVE SIZE –0.002 (–1.51) –0.002 (–1.62) –0.003 (–1.04) –0.002 (–1.29) INTRA–INDUSTRY –0.12 *** (–1.85) –0.13 ** (–2.25) –0.19 ** (–2.39) –0.19 * (–2.62) RUNUP –0.42 ** (–2.55) –0.40 ** (–2.35) –0.46 ** (–1.99) –0.38 * (–2.58) ASSET GROWTH –0.12 * (–3.55) –0.12 * (–4.13) –0.11 * (–2.78) –0.12 * (–4.02) CROSS BORDER 0.35 * (4.90) 0.43 * (6.46) 0.47 * (5.40) 0.34 * (4.61) FOREIGN INVEST RULE 0.54 ** (2.17) 0.35 (1.59) 0.34 (1.32) 0.27 (1.25) MKT RUNUP –0.41 (–1.04) –0.62 *** (–1.84) 0.11 (0.23) –0.44 (–1.36) Intercept 1 0.99 * (3.28) –0.08 (–0.26) –0.33 (–0.85) –0.08 (–0.27) Intercept 2 1.73 * (5.68) 0.64 ** (2.16) 0.30 (0.78) 0.61 ** (2.04) N. Obs. 2,527 3,053 1,757 3,009 Pseudo R–squared 16.87% 18.13% 17.73% 15.33% LR statistic 503.66 672.61 352.59 566.59
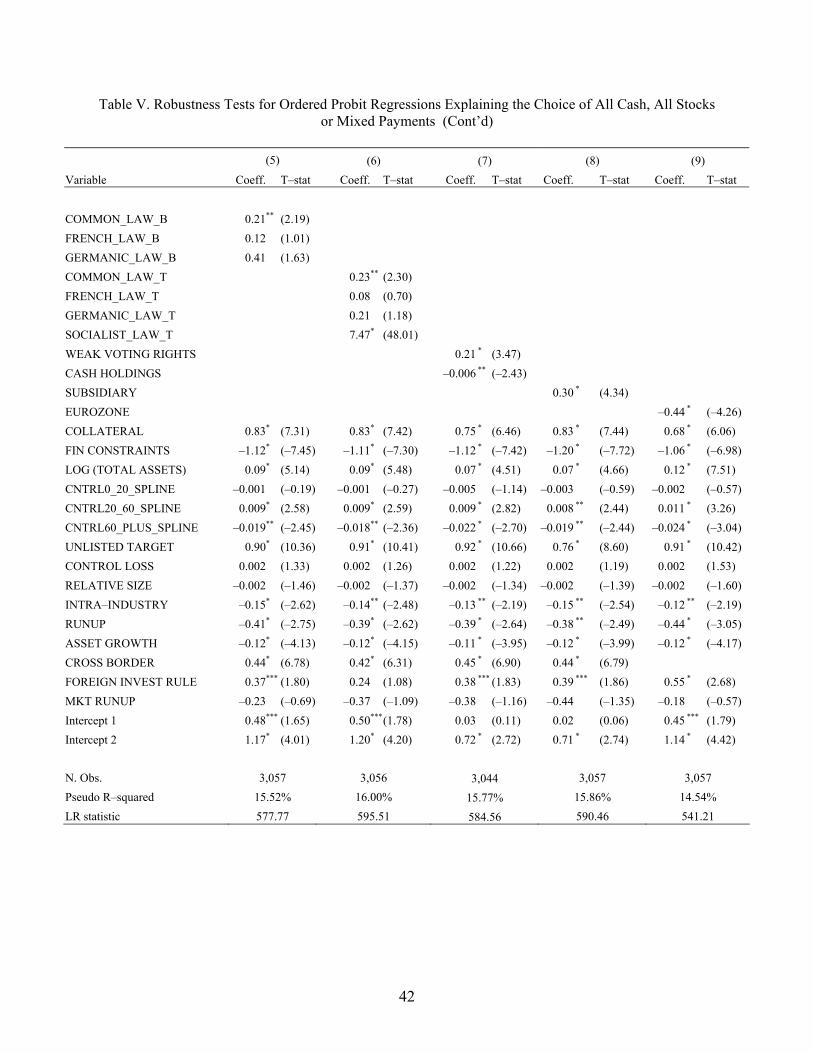
42
Table V. Robustness Tests for Ordered Probit Regressions Explaining the Choice of All Cash, All Stocks or Mixed Payments (Cont’d)
(5) (6) (7) (8) (9)
Variable Coeff. T–stat Coeff. T–stat Coeff. T–stat Coeff. T–stat Coeff. T–stat
COMMON_LAW_B 0.21** (2.19) FRENCH_LAW_B 0.12 (1.01) GERMANIC_LAW_B 0.41 (1.63) COMMON_LAW_T 0.23** (2.30) FRENCH_LAW_T 0.08 (0.70) GERMANIC_LAW_T 0.21 (1.18) SOCIALIST_LAW_T 7.47* (48.01) WEAK VOTING RIGHTS 0.21 * (3.47) CASH HOLDINGS –0.006 ** (–2.43) SUBSIDIARY 0.30 * (4.34) EUROZONE –0.44 * (–4.26) COLLATERAL 0.83* (7.31) 0.83* (7.42) 0.75 * (6.46) 0.83 * (7.44) 0.68 * (6.06) FIN CONSTRAINTS –1.12* (–7.45) –1.11* (–7.30) –1.12 * (–7.42) –1.20 * (–7.72) –1.06 * (–6.98) LOG (TOTAL ASSETS) 0.09* (5.14) 0.09* (5.48) 0.07 * (4.51) 0.07 * (4.66) 0.12 * (7.51) CNTRL0_20_SPLINE –0.001 (–0.19) –0.001 (–0.27) –0.005 (–1.14) –0.003 (–0.59) –0.002 (–0.57) CNTRL20_60_SPLINE 0.009* (2.58) 0.009* (2.59) 0.009 * (2.82) 0.008 ** (2.44) 0.011 * (3.26) CNTRL60_PLUS_SPLINE –0.019** (–2.45) –0.018** (–2.36) –0.022 * (–2.70) –0.019 ** (–2.44) –0.024 * (–3.04) UNLISTED TARGET 0.90* (10.36) 0.91* (10.41) 0.92 * (10.66) 0.76 * (8.60) 0.91 * (10.42) CONTROL LOSS 0.002 (1.33) 0.002 (1.26) 0.002 (1.22) 0.002 (1.19) 0.002 (1.53) RELATIVE SIZE –0.002 (–1.46) –0.002 (–1.37) –0.002 (–1.34) –0.002 (–1.39) –0.002 (–1.60) INTRA–INDUSTRY –0.15* (–2.62) –0.14** (–2.48) –0.13 ** (–2.19) –0.15 ** (–2.54) –0.12 ** (–2.19) RUNUP –0.41* (–2.75) –0.39* (–2.62) –0.39 * (–2.64) –0.38 ** (–2.49) –0.44 * (–3.05) ASSET GROWTH –0.12* (–4.13) –0.12* (–4.15) –0.11 * (–3.95) –0.12 * (–3.99) –0.12 * (–4.17) CROSS BORDER 0.44* (6.78) 0.42* (6.31) 0.45 * (6.90) 0.44 * (6.79) FOREIGN INVEST RULE 0.37*** (1.80) 0.24 (1.08) 0.38 *** (1.83) 0.39 *** (1.86) 0.55 * (2.68) MKT RUNUP –0.23 (–0.69) –0.37 (–1.09) –0.38 (–1.16) –0.44 (–1.35) –0.18 (–0.57) Intercept 1 0.48*** (1.65) 0.50***(1.78) 0.03 (0.11) 0.02 (0.06) 0.45 *** (1.79) Intercept 2 1.17* (4.01) 1.20* (4.20) 0.72 * (2.72) 0.71 * (2.74) 1.14 * (4.42) N. Obs. 3,057 3,056 3,044 3,057 3,057 Pseudo R–squared 15.52% 16.00% 15.77% 15.86% 14.54% LR statistic 577.77 595.51 584.56 590.46 541.21
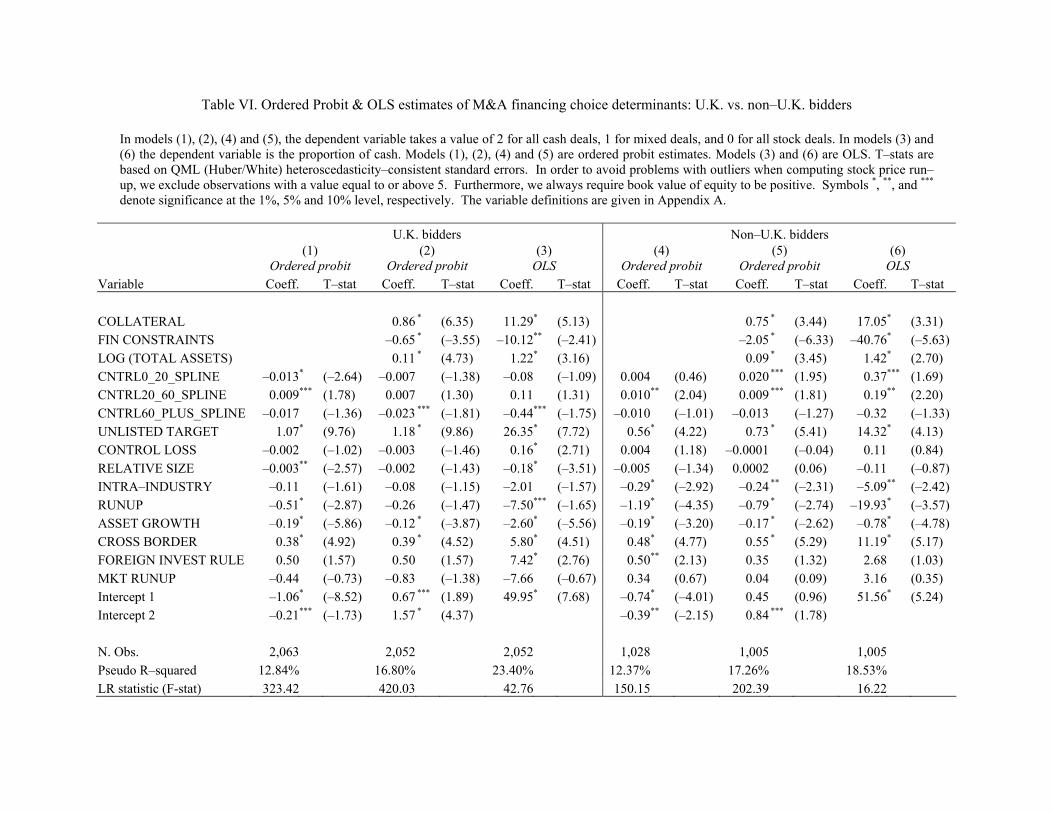
Table VI. Ordered Probit & OLS estimates of M&A financing choice determinants: U.K. vs. non–U.K. bidders
In models (1), (2), (4) and (5), the dependent variable takes a value of 2 for all cash deals, 1 for mixed deals, and 0 for all stock deals. In models (3) and (6) the dependent variable is the proportion of cash. Models (1), (2), (4) and (5) are ordered probit estimates. Models (3) and (6) are OLS. T–stats are based on QML (Huber/White) heteroscedasticity–consistent standard errors. In order to avoid problems with outliers when computing stock price run–up, we exclude observations with a value equal to or above 5. Furthermore, we always require book value of equity to be positive. Symbols *, **, and *** denote significance at the 1%, 5% and 10% level, respectively. The variable definitions are given in Appendix A.
U.K. bidders Non–U.K. bidders
(1)
Ordered probit (2)
Ordered probit (3)
OLS (4)
Ordered probit (5)
Ordered probit (6)
OLS Variable Coeff. T–stat Coeff. T–stat Coeff. T–stat Coeff. T–stat Coeff. T–stat Coeff. T–stat COLLATERAL 0.86 * (6.35) 11.29* (5.13) 0.75 * (3.44) 17.05* (3.31) FIN CONSTRAINTS –0.65 * (–3.55) –10.12** (–2.41) –2.05 * (–6.33) –40.76* (–5.63) LOG (TOTAL ASSETS) 0.11 * (4.73) 1.22* (3.16) 0.09 * (3.45) 1.42* (2.70) CNTRL0_20_SPLINE –0.013* (–2.64) –0.007 (–1.38) –0.08 (–1.09) 0.004 (0.46) 0.020 *** (1.95) 0.37*** (1.69) CNTRL20_60_SPLINE 0.009*** (1.78) 0.007 (1.30) 0.11 (1.31) 0.010 ** (2.04) 0.009 *** (1.81) 0.19** (2.20) CNTRL60_PLUS_SPLINE –0.017 (–1.36) –0.023 *** (–1.81) –0.44*** (–1.75) –0.010 (–1.01) –0.013 (–1.27) –0.32 (–1.33) UNLISTED TARGET 1.07* (9.76) 1.18 * (9.86) 26.35* (7.72) 0.56 * (4.22) 0.73 * (5.41) 14.32* (4.13) CONTROL LOSS –0.002 (–1.02) –0.003 (–1.46) 0.16* (2.71) 0.004 (1.18) –0.0001 (–0.04) 0.11 (0.84) RELATIVE SIZE –0.003** (–2.57) –0.002 (–1.43) –0.18* (–3.51) –0.005 (–1.34) 0.0002 (0.06) –0.11 (–0.87) INTRA–INDUSTRY –0.11 (–1.61) –0.08 (–1.15) –2.01 (–1.57) –0.29 * (–2.92) –0.24 ** (–2.31) –5.09** (–2.42) RUNUP –0.51* (–2.87) –0.26 (–1.47) –7.50*** (–1.65) –1.19 * (–4.35) –0.79 * (–2.74) –19.93* (–3.57) ASSET GROWTH –0.19* (–5.86) –0.12 * (–3.87) –2.60* (–5.56) –0.19 * (–3.20) –0.17 * (–2.62) –0.78* (–4.78) CROSS BORDER 0.38* (4.92) 0.39 * (4.52) 5.80* (4.51) 0.48 * (4.77) 0.55 * (5.29) 11.19* (5.17) FOREIGN INVEST RULE 0.50 (1.57) 0.50 (1.57) 7.42* (2.76) 0.50 ** (2.13) 0.35 (1.32) 2.68 (1.03) MKT RUNUP –0.44 (–0.73) –0.83 (–1.38) –7.66 (–0.67) 0.34 (0.67) 0.04 (0.09) 3.16 (0.35) Intercept 1 –1.06* (–8.52) 0.67 *** (1.89) 49.95* (7.68) –0.74 * (–4.01) 0.45 (0.96) 51.56* (5.24) Intercept 2 –0.21*** (–1.73) 1.57 * (4.37) –0.39 ** (–2.15) 0.84 *** (1.78) N. Obs. 2,063 2,052 2,052 1,028 1,005 1,005 Pseudo R–squared 12.84% 16.80% 23.40% 12.37% 17.26% 18.53% LR statistic (F-stat) 323.42 420.03 42.76 150.15 202.39 16.22
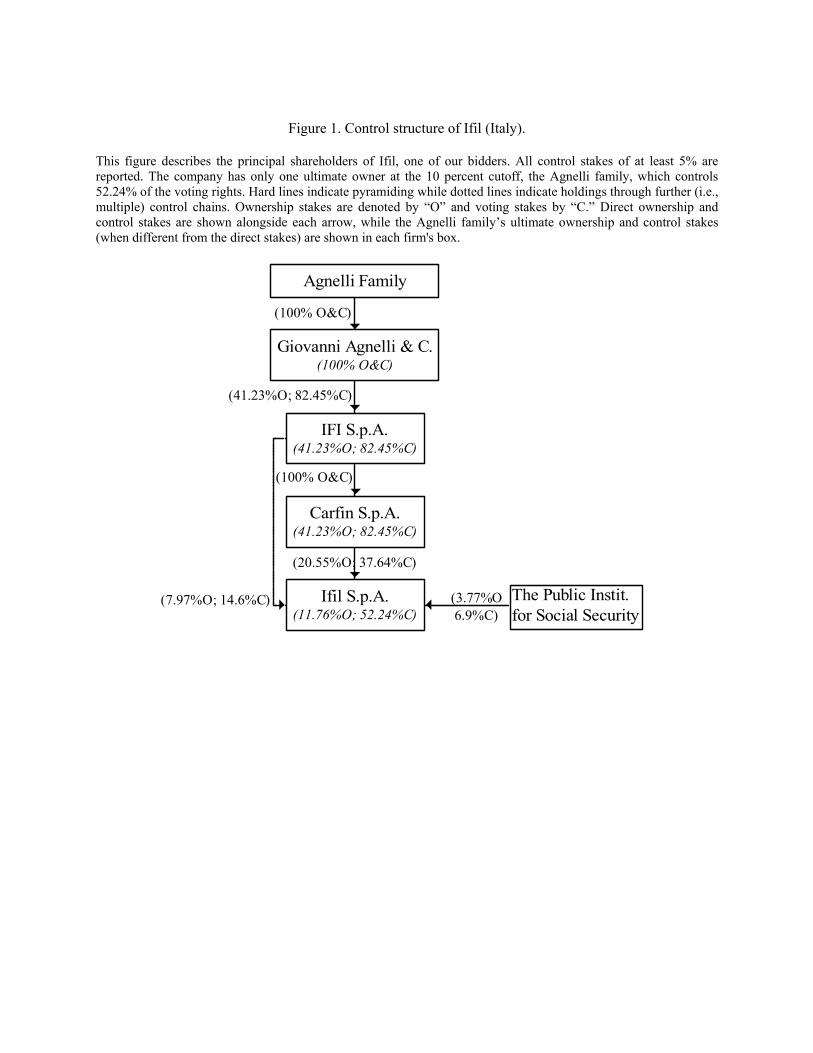
Figure 1. Control structure of Ifil (Italy).
This figure describes the principal shareholders of Ifil, one of our bidders. All control stakes of at least 5% are reported. The company has only one ultimate owner at the 10 percent cutoff, the Agnelli family, which controls 52.24% of the voting rights. Hard lines indicate pyramiding while dotted lines indicate holdings through further (i.e., multiple) control chains. Ownership stakes are denoted by “O” and voting stakes by “C.” Direct ownership and control stakes are shown alongside each arrow, while the Agnelli family’s ultimate ownership and control stakes (when different from the direct stakes) are shown in each firm's box.
(7.97%O; 14.6%C) The Public Instit.for Social Security
(3.77%O6.9%C)
(20.55%O; 37.64%C)
(100% O&C)
(41.23%O; 82.45%C)
(100% O&C)
Ifil S.p.A.(11.76%O; 52.24%C)
Carfin S.p.A.(41.23%O; 82.45%C)
IFI S.p.A.(41.23%O; 82.45%C)
Giovanni Agnelli & C.(100% O&C)
Agnelli Family