the chinese economy in transition --challenges and ... · the chinese economy in transition...
TRANSCRIPT
The Chinese Economy in Transition --Challenges and Opportunities
Lawrence J. Lau, Ph. D. Ralph and Claire Landau Professor of Economics, The Chinese Univ. of Hong Kong
and Kwoh-Ting Li Professor in Economic Development, Emeritus, Stanford University
2013 Primavera Investor Conference
Beijing, 21st October 2013
Tel: (852)3550-7070; Fax: (852)2104-6938 Email: [email protected]; WebPages: www.igef.cuhk.edu.hk/ljl
*All opinions expressed herein are the author’s own and do not necessarily reflect the views of any of the organisations with which the author is affiliated.

2
Introduction The recent slowdown in the rate of growth of the Chinese
economy should be viewed as a positive development. After all, it is still above 7.5%.
The Chinese Government leaders aim to change the model of economic growth from (1) export and investment-led to consumption-led; and (2) from tangible inputs-driven to innovation-driven.
Will the Chinese economy be able to make these changes smoothly and successfully?
Yes, but it will take time.

3
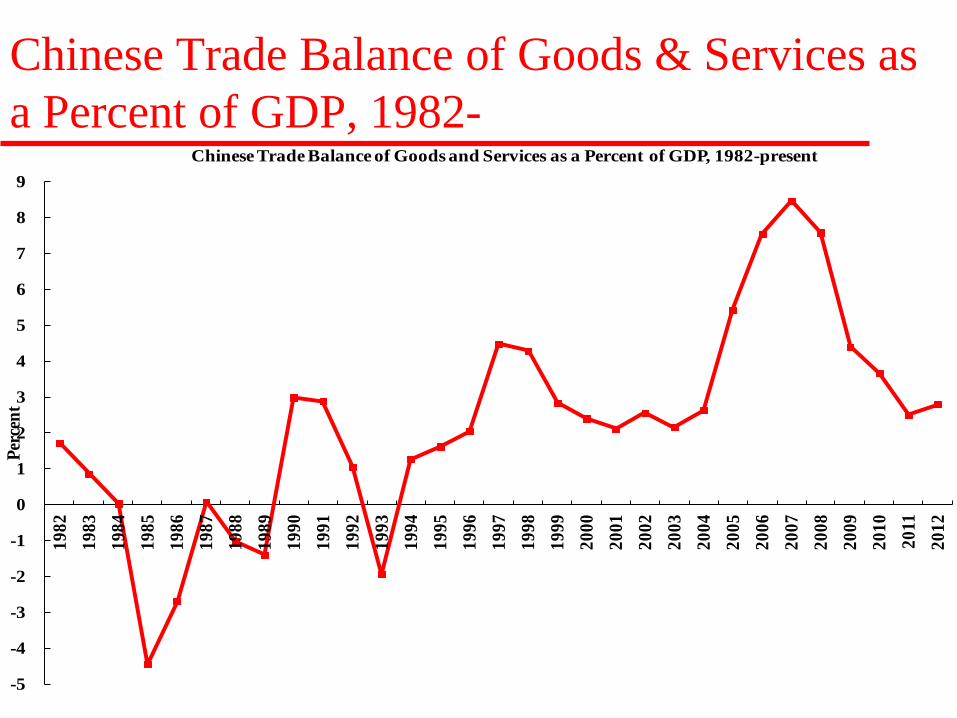
Export-Led Growth There is a common mis-impression that the Chinese
economy is highly dependent on exports, and in particular, on its export surpluses, as a source of growth.
The facts are that China only began to have a significant trade surplus vis-a-vis the World in 2005, whereas the Chinese economy has been growing at an average real rate of almost 10 percent per annum since 1978.
It should therefore be clear that the trade surplus could not have been an important source of growth for the Chinese economy during the past three decades. Chinese economic growth does not depend on the Chinese trade surpluses.

4
Export-Led Growth In fact, Chinese economic growth has not been export-led
for quite some time now. First, China no longer has a large trade surplus. Second, Chinese exports have a low domestic-value-added
content. Third, export-oriented labour-intensive light manufacturing
has been relocating from China to other economies such as Bangladesh, Cambodia, Indonesia, Vietnam and even Myanmar where the wage rates are lower.
It is a goal in the Twelfth Five-Year (2011-2015) Plan for China to achieve balanced international trade.
Going forward, the gross value of exports may decline (they have already been declining in Renminbi terms) even as the domestic value-added content rises.
Chinese Trade Balance of Goods & Services as a Percent of GDP, 1982-
5 -5
-4
-3
-2
-1
0
1
2
3
4
5
6
7
8
9
1982
1983
1984
1985
1986
1987
1988
1989
1990
1991
1992
1993
1994
1995
1996
1997
1998
1999
2000
2001
2002
2003
2004
2005
2006
2007
2008
2009
2010
2011
2012
Perc
ent
Chinese Trade Balance of Goods and Services as a Percent of GDP, 1982-present

6
Export-Led Growth China both saves too much and invests too much. However,
the excessive savings and excessive investments were in approximate balance and hence there was little or no excess savings to be exported (in the form of a trade surplus).
China did not have a significant trade surplus vis-a-vis the World until 2005, even though it had had a large trade surplus vis-a-vis the United States.
Since 2008, the Chinese savings-investment gap has once again narrowed, resulting in a large reduction in the Chinese trade surplus relative to its GDP. The Chinese trade surplus has declined to 2% of its GDP by the end of 2012 and is expected to decline further during the next couple of years, reaching essentially balanced international trade by perhaps 2015.
7
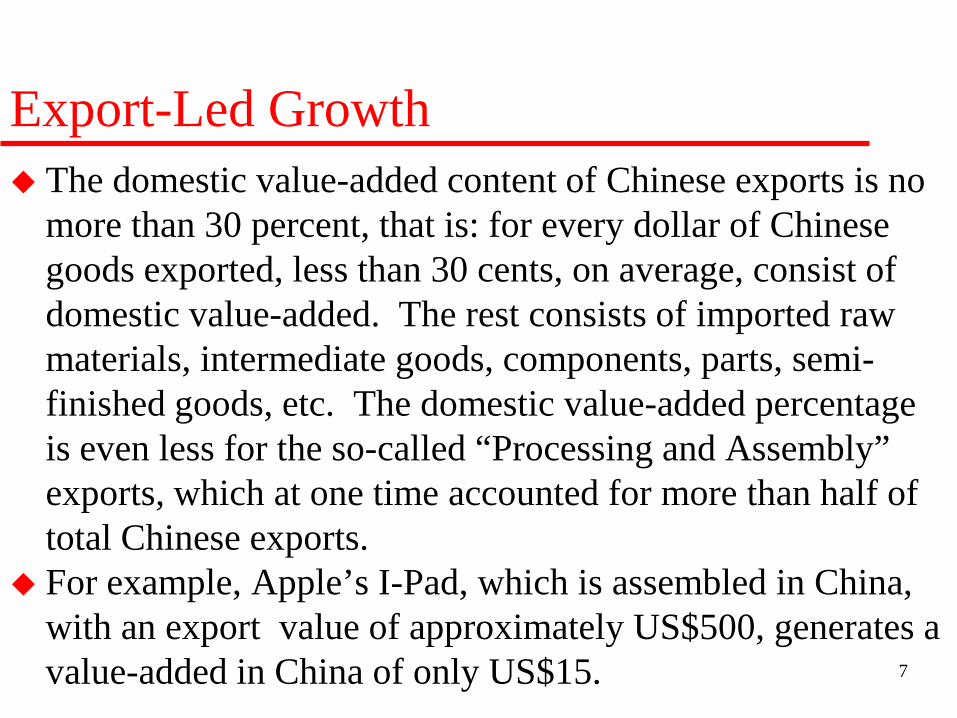
Export-Led Growth The domestic value-added content of Chinese exports is no
more than 30 percent, that is: for every dollar of Chinese goods exported, less than 30 cents, on average, consist of domestic value-added. The rest consists of imported raw materials, intermediate goods, components, parts, semi-finished goods, etc. The domestic value-added percentage is even less for the so-called “Processing and Assembly” exports, which at one time accounted for more than half of total Chinese exports.
For example, Apple’s I-Pad, which is assembled in China, with an export value of approximately US$500, generates a value-added in China of only US$15.

8
Export-Led Growth In any case, it is unlikely that Chinese exports can resume
its rapid growth any time soon with the U.S. and European economies in recession. This is a principal reason for the shift in China from a policy of promotion of exports to a policy of promotion of internal demand, which is the only way to ensure sustained and sustainable economic growth in China. Such a policy shift has been incorporated in the Twelfth Five-Year Plan.

Chinese National Savings and Gross Domestic Investment as Percents of GDP
9 0
10
20
30
40
50
60
1952
1953
1954
1955
1956
1957
1958
1959
1960
1961
1962
1963
1964
1965
1966
1967
1968
1969
1970
1971
1972
1973
1974
1975
1976
1977
1978
1979
1980
1981
1982
1983
1984
1985
1986
1987
1988
1989
1990
1991
1992
1993
1994
1995
1996
1997
1998
1999
2000
2001
2002
2003
2004
2005
2006
2007
2008
2009
2010
2011
2012
Perc
ent
Chinese National Savings and Gross Domestic Investment as a Percent of GDP since 1952
Savings Rate Investment Rate
10
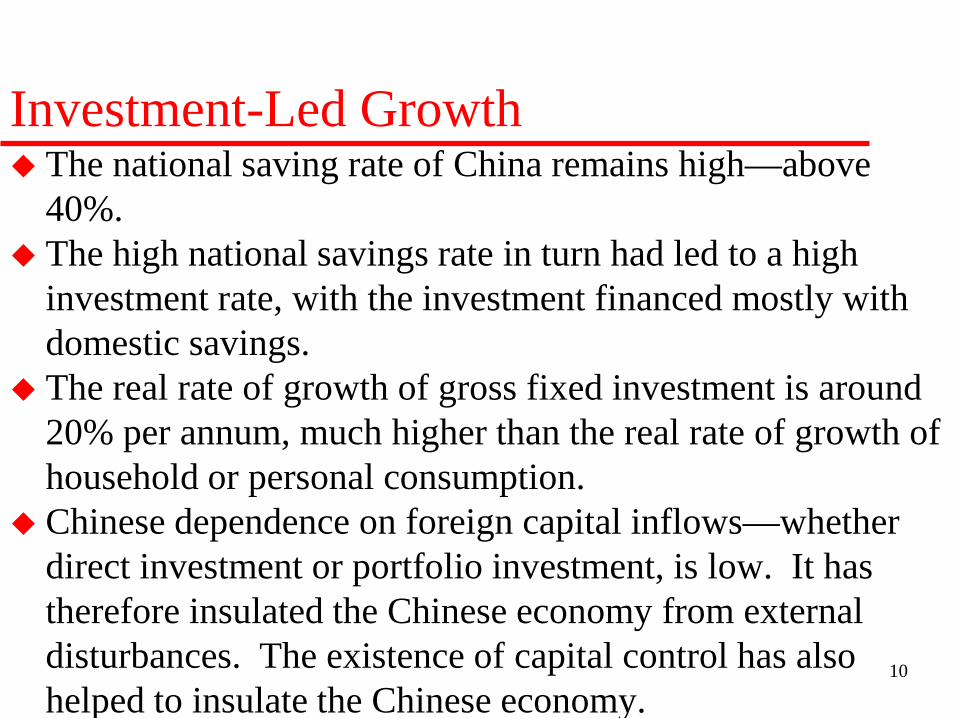
Investment-Led Growth The national saving rate of China remains high—above
40%. The high national savings rate in turn had led to a high
investment rate, with the investment financed mostly with domestic savings.
The real rate of growth of gross fixed investment is around 20% per annum, much higher than the real rate of growth of household or personal consumption.
Chinese dependence on foreign capital inflows—whether direct investment or portfolio investment, is low. It has therefore insulated the Chinese economy from external disturbances. The existence of capital control has also helped to insulate the Chinese economy.

11 11
Monthly Rates of Growth of Chinese Fixed Assets Investment, Y-o-Y
0
10
20
30
40
50
60
Jan-
00Ap
r-00
Jul-0
0Oc
t-00
Jan-
01Ap
r-01
Jul-0
1Oc
t-01
Jan-
02Ap
r-02
Jul-0
2Oc
t-02
Jan-
03Ap
r-03
Jul- 0
3Oc
t-03
Jan-
04Ap
r-04
Jul-0
4Oc
t-04
Jan-
05Ap
r-05
Jul-0
5Oc
t-05
Jan-
06Ap
r-06
Jul-0
6Oc
t-06
Jan-
07Ap
r-07
Jul-0
7Oc
t -07
Jan-
08Ap
r-08
Jul-0
8Oc
t-08
Jan-
09Ap
r-09
Jul-0
9Oc
t-09
Jan-
10Ap
r-10
Jul-1
0Oc
t-10
Jan-
11Ap
r-11
Jul-1
1Oc
t-11
Jan-
12Ap
r-12
Jul-1
2Oc
t-12
Jan -
13Ap
r-13
Jul-1
3
Perc
ent
Monthly Rates of Growth of Chinese Fixed Assets Investment since 2000, Year-over-Year

12
Consumption-Led Growth The real rate of growth of household consumption has been
higher than the rate of growth of real GDP but not high enough to change the national saving rate.
Without a significant increase in the household income, household consumption is unlikely to increase at a significantly higher rate—it has already been increasing at 150% if the rate of growth of real GDP.
A potential source of a significant increase in household income as well as government revenue is a requirement for the publicly listed Chinese enterprises to declare and distribute significant cash dividends to their shareholders, which including households and the government. This should also help to reduce non-essential and non-productive investment on the part of publicly listed Chinese enterprises.
13
Consumption-Led Growth There is, however, significant room for the expansion of
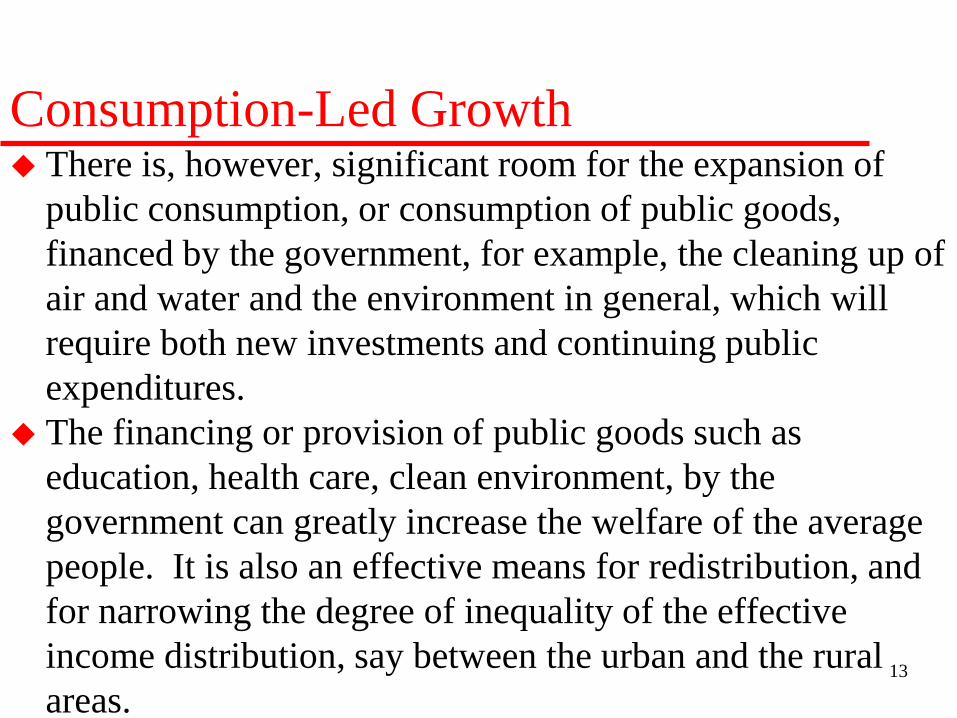
public consumption, or consumption of public goods, financed by the government, for example, the cleaning up of air and water and the environment in general, which will require both new investments and continuing public expenditures.
The financing or provision of public goods such as education, health care, clean environment, by the government can greatly increase the welfare of the average people. It is also an effective means for redistribution, and for narrowing the degree of inequality of the effective income distribution, say between the urban and the rural areas.

14
Consumption-Led Growth Chinese household consumption is sometimes viewed as a
potential sustainable source of growth of Chinese domestic aggregate demand.
Chinese household consumption has actually been growing quite rapidly, as indicated by the double-digit monthly year-over-year rates of growth of real retail sales since the first quarter of 2009.

15 15
Monthly Rates of Growth of Chinese Real Retail Sales, Y-o-Y
0
5
10
15
20
25
30
35
Jan-
00Ap
r-00
Jul-0
0Oc
t-00
Jan-
01Ap
r-01
Jul-0
1Oc
t-01
Jan-
02Ap
r-02
Jul-0
2Oc
t-02
Jan-
03Ap
r-03
Jul-0
3Oc
t-03
Jan-
04Ap
r-04
Jul-0
4Oc
t-04
Jan-
05Ap
r-05
Jul-0
5Oc
t-05
Jan-
06Ap
r-06
Jul-0
6Oc
t-06
Jan-
07Ap
r-07
Jul-0
7Oc
t-07
Jan-
08Ap
r-08
Jul-0
8Oc
t-08
Jan-
09Ap
r-09
Jul-0
9Oc
t-09
Jan-
10Ap
r-10
Jul-1
0Oc
t-10
Jan-
11Ap
r-11
Jul-1
1Oc
t-11
Jan-
12Ap
r-12
Jul- 1
2Oc
t-12
Jan-
13Ap
r-13
Jul-1
3
Perc
ent
Monthly Rates of Growth of Chinese Real Retail Sales since 2000, Year-over-Year
16
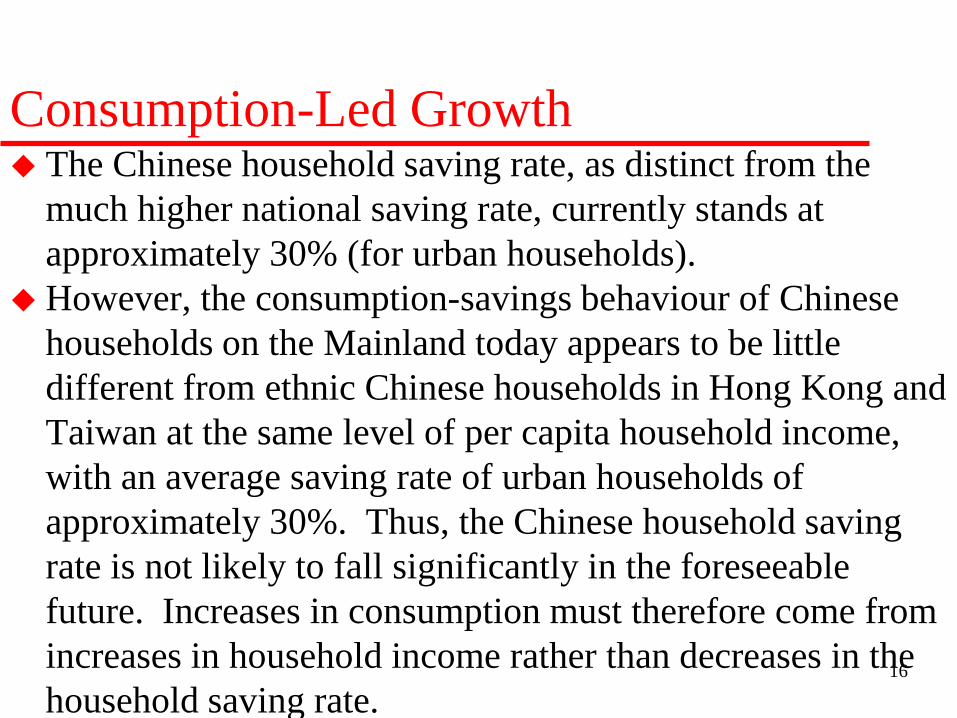
Consumption-Led Growth The Chinese household saving rate, as distinct from the
much higher national saving rate, currently stands at approximately 30% (for urban households).
However, the consumption-savings behaviour of Chinese households on the Mainland today appears to be little different from ethnic Chinese households in Hong Kong and Taiwan at the same level of per capita household income, with an average saving rate of urban households of approximately 30%. Thus, the Chinese household saving rate is not likely to fall significantly in the foreseeable future. Increases in consumption must therefore come from increases in household income rather than decreases in the household saving rate.

Saving Rates of Urban and Rural Households
17 0
5
10
15
20
25
30
35
1992
1993
1994
1995
1996
1997
1998
1999
2000
2001
2002
2003
2004
2005
2006
2007
2008
2009
2010
2011
2012
Perc
ent
Savings Rates of Chinese Urban and Rural Households
Household Savings Rates: Rural
Household Savings Rates: Urban

18
Consumption-Led Growth Chinese household consumption can be expected to increase
significantly faster than GDP only if Chinese household (disposable) income as a share of GDP rises significantly. There are structural reasons why this is unlikely to occur in the short run even though in the longer run, the income share of labour, which currently stands at around 50%, is likely to rise in China.
Continuing Chinese economic growth beyond 2013 will therefore have to depend mostly on the growth of internal demand and not on exports, and, as analysed above, not on the growth of household consumption per se in the absence of a significant sustained increase in the share of household income in GDP.
Household income can be increased through wage increases but also through increases in the cash dividend payouts from publicly listed state-owned enterprises, as mentioned above. Recently, the Chinese Government has called for an increased cash dividend payouts from state-owned enterprises.

19
Consumption-Led Growth Increased cash dividend payouts have many advantages in addition to
increasing household income and thereby household consumption. They increase government revenue, both directly, as the government
is a major shareholder in many publicly listed enterprises and will receive the increased cash dividends, and indirectly, through the increased individual income taxes collected on the cash dividends paid to the other shareholders. The increased government revenue can in turn be used to increase public consumption—e.g., the provision of public services such as education and health care, the preservation and restoration of the environment, etc.
An increased cash dividend payout by the state-owned enterprises reduces their excess retained earnings so that they can no longer make investments at will—it will have to apply for loans and hence their investment projects will have to be justified to and evaluated by the lenders. This may help to reduce over-investment in certain industries.
20
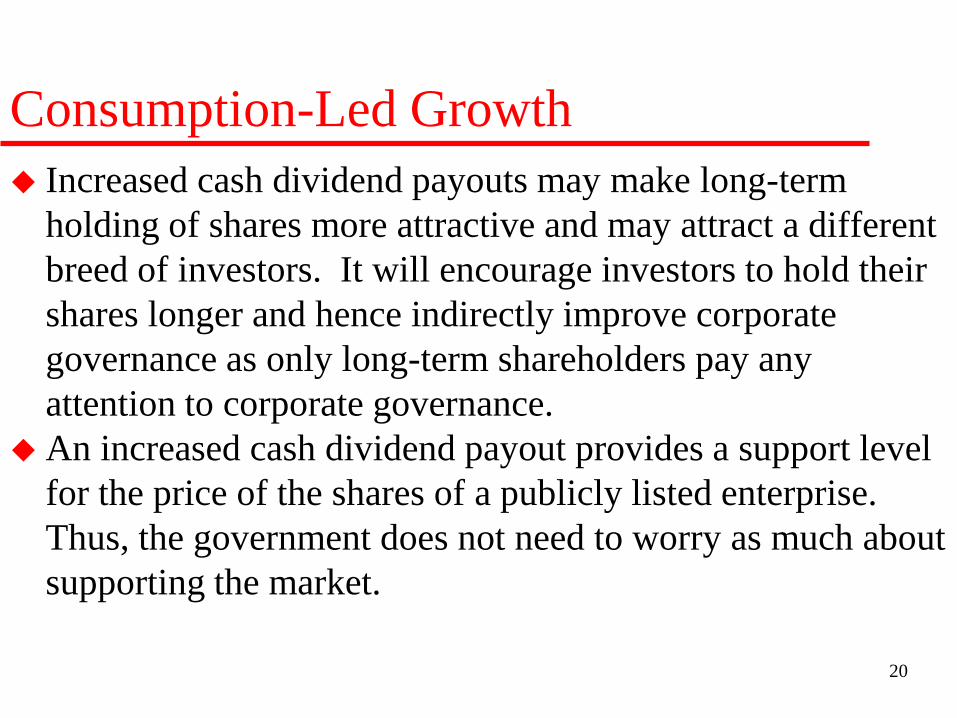
Consumption-Led Growth Increased cash dividend payouts may make long-term
holding of shares more attractive and may attract a different breed of investors. It will encourage investors to hold their shares longer and hence indirectly improve corporate governance as only long-term shareholders pay any attention to corporate governance.
An increased cash dividend payout provides a support level for the price of the shares of a publicly listed enterprise. Thus, the government does not need to worry as much about supporting the market.

21
Consumption-Led Growth However, the high Chinese national saving rate is not due to an
exceptionally high household saving rate. In fact, the Chinese household saving rate is not significantly different from those of ethnically Chinese households in Hong Kong and Taiwan, both market economies and where the social safety nets are not completely adequate, particularly in Hong Kong.
The high Chinese national saving rate is due to the much lower share of GDP received by households as income; in particular, the share of labor is low in China, currently less than 50% of GDP, compared to approximately 70% in the developed economies of the World. The households’ share of national income is not much higher than 50%. Even if the households consume all of their income and do not save at all, household or personal consumption cannot be much more than 50% of GDP. The Chinese household saving rate is currently approximately 30%.

22
Consumption-Led Growth It is also due to the much higher Chinese corporate saving
rates—Chinese enterprises, state-owned as well as non-state-owned, typically reinvest their earnings and distribute little or no cash dividends to their shareholders. (For privately owned enterprises, this is done in part to avoid personal income taxation as cash dividends are taxed at a flat 20% rate.) Thus, the enterprise saving rate out of enterprise income (after taxes) is almost 100%.
The high Chinese national saving rate is thus the result of a weighted average between the household saving rate and the high enterprise saving rate (with the government saving rate—the budget surplus (deficit) as a percentage of GDP—being relatively insignificant until more recently).

23
Tangible Inputs-Driven Growth There will continue to be adequate investment in tangible
capital. The population is aging, and the working age population has
been predicted to fall. However, this is somewhat artificial. If retirement age is raised to 65 (perhaps with the requirement that no one above age 60 can hold senior administrative positions), there should continue to be sufficient labour over the next five to ten years.
The “one-child” population policy may be modified in the longer run.

24
Innovation-Driven Growth Innovation-driven growth depends on investments in
intangible capital such as human capital and R&D capital. China has been increasing its investment in R&D in recent
years, but it still lags behind the U.S. and other economies significantly, certainly as a percent of its GDP.

25
R&D Expenditure and Its Share of GDP: A Comparison of China and the U.S.
0.0
0.5
1.0
1.5
2.0
2.5
3.0
0
50
100
150
200
250
300
350
400
450
1987
1988
1989
1990
1991
1992
1993
1994
1995
1996
1997
1998
1999
2000
2001
2002
2003
2004
2005
2006
2007
2008
2009
2010
2011
2012
Perc
ent
USD
billio
ns
R&D Expenditure and Its Share of GDP, A Comparison of China and the U.S.
U.S. R&D Expenditure
Chinese R&D Expenditure
U.S.R&D Expenditure as a Percentage of GDP
Chinese R&D Expenditure as a Percentage of GDP

R&D Expenditures as a Ratio of GDP: G-7 Countries, 4 East Asian NIES & China
26
1963
1964
1965
1966
1967
1968
1969
1970
1971
1972
1973
1974
1975
1976
1977
1978
1979
1980
1981
1982
1983
1984
1985
1986
1987
1988
1989
1990
1991
1992
1993
1994
1995
1996
1997
1998
1999
2000
2001
2002
2003
2004
2005
2006
2007
2008
2009
2010
2011
2012
Perc
ent
R&D Expenditures as a Percentage of GDP: G-7 Countries, 4 East Asian NIEs and China
U.S. Japan W. Germany U.K.
France Canada Italy South Korea
Singapore Taiwan China Hong Kong

27
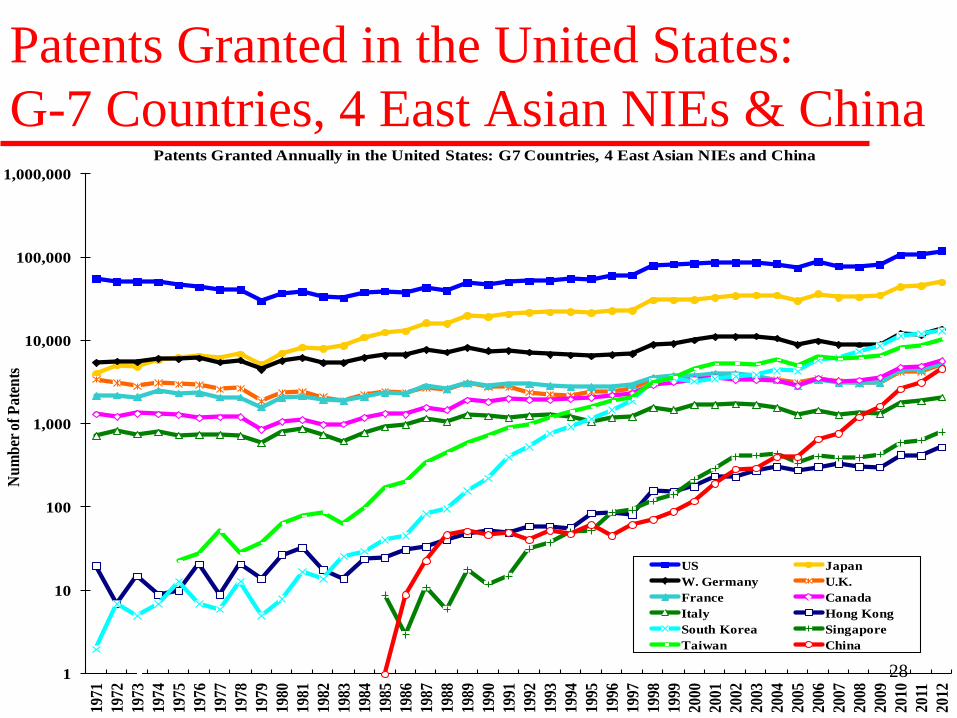
Innovation-Driven Growth One indicator of the potential for technical progress
(national innovative capacity) is the number of patents created each year. In the following chart, the number of patents granted in the United States each year to the nationals of different countries, including the U.S. itself, over time is presented.
The U.S. is the undisputed champion over the past forty years, with 121,026 patents granted in 2012, followed by Japan, with 50,677. The number of patents granted to Chinese applicants each year has increased from 1 in 1985 to 4,637 in 2012.
Patents Granted in the United States: G-7 Countries, 4 East Asian NIEs & China
28 1
10
100
1,000
10,000
100,000
1,000,000
1971
1972
1973
1974
1975
1976
1977
1978
1979
1980
1981
1982
1983
1984
1985
1986
1987
1988
1989
1990
1991
1992
1993
1994
1995
1996
1997
1998
1999
2000
2001
2002
2003
2004
2005
2006
2007
2008
2009
2010
2011
2012
Num
ber o
f Pat
ents
Patents Granted Annually in the United States: G7 Countries, 4 East Asian NIEs and China
US JapanW. Germany U.K.France CanadaItaly Hong KongSouth Korea SingaporeTaiwan China

29
Innovation-Driven Growth The stock of R&D capital, defined as the cumulative past
real investment in R&D less depreciation of 10% per year, can be shown to have a direct causal relationship to the number of patents granted (see the following chart, in which the annual number of patents granted is plotted against the R&D capital stock of that year for each country or region).
The chart shows that the higher the stock of R&D capital of an economy, the higher is the number of patents granted to it by the U.S.

Patents Granted in the United States and R&D Capital Stocks, Selected Economies
The Number of U.S. Patents Granted Annually vs. R&D Capital Stocks
1
10
100
1,000
10,000
100,000
1,000,000
0 1 10 100 1,000 10,000Billions of 2005 Constant U.S. Dollars
Num
ber o
f Pat
ents
USJapanWest GermanyUKFranceCanadaItalySouth KoreaSingaporeChinaHong KongTaiwan
30

31
Innovation-Driven Growth The huge potential domestic market of 1.34 billion
consumers not only enables the realisation of economies of scale but also greatly enhances the productivity of intangible capital (e.g., R&D capital, goodwill). The fixed research and development costs of a new product or process can be easily amortised over a large market. The benefits of investment in goodwill, e.g., brand-building, are also much greater in a large market.
The huge potential domestic market also enables active Chinese participation in the setting of product and technology standards and sharing of the benefits of such standard-setting.
32
Innovation-Driven Growth However, innovation-driven growth also depends on
competition. Monopolies are not very good in innovation, or not very good in making full use of their innovation.
In order to encourage innovation, China also needs to protect intellectual property rights vigorously.
33
Sources of Sustainable Growth of Aggregate Demand The possible areas that have the potential of generating
sustainable increases in aggregate demand, in addition to household consumption and public infrastructural investment (e.g., high speed railroads, mass-transit systems, power plants, etc.), include:
(1) Acceleration of urbanisation; (2) Residential housing; (3) Education and health care and the application of high
technology in these sectors; and (4) Conservation of energy, environmental protection and
preservation (clean air and water), and promotion of the green economy.

34
The Partial De-Coupling Hypothesis Throughout the 2007-2009 global financial crisis, as well as
the subsequent European sovereign debt crisis, the East Asian economies and the economies of the BRICS countries (Brazil, Russia, India, China and South Africa) continued to do reasonably well. China, in particular, has been able to maintain its real rate of growth above 7.5% since 2007, lending credence to the “Partial De-Coupling Hypothesis”, that is, the Chinese and East Asian economies can continue to grow, albeit at slower rates, even as the U.S. and European economies go into economic recession.
This partial de-coupling can occur because of the gradual shift of the economic centre of gravity of the World from the United States and Western Europe to Asia (including both East Asia and South Asia) over the past three decades.

35
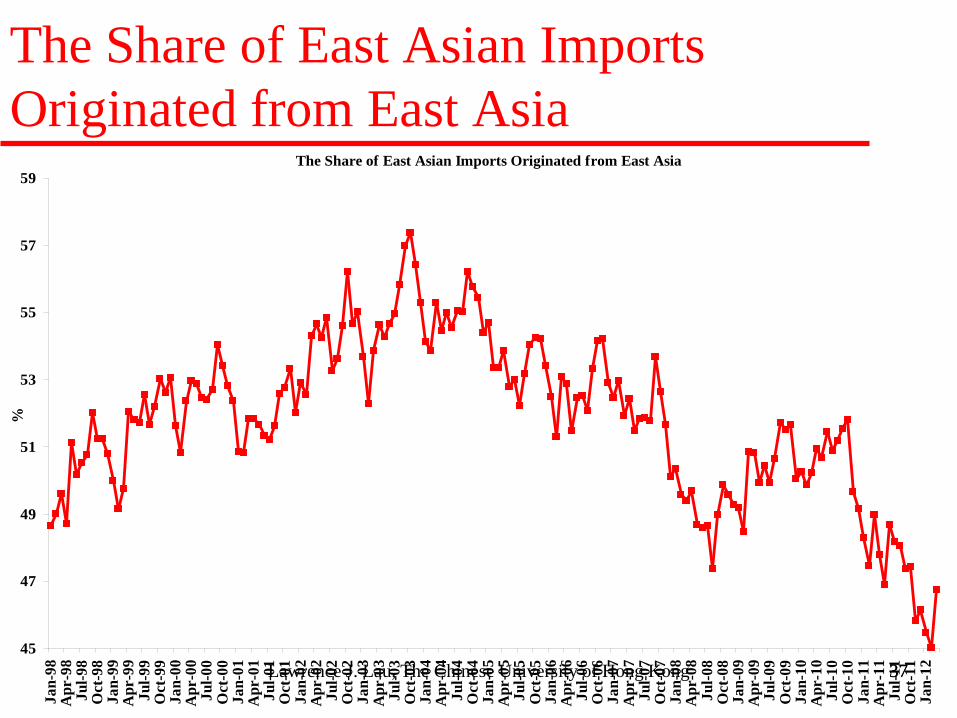
The Partial De-Coupling Hypothesis A particularly interesting development is the rise in intra-
East Asian international trade. The share of East Asian trade destined for East Asia has risen to over 50% in the past decade. This is a sea-change compared to 30 years ago when most of the East Asian exports was destined for either the United States or Western Europe.
Similarly, the share of East Asian imports originated from East Asia has remained above 45%.

36 36
The Share of East Asian Exports Destined for East Asia
The Share of East Asian Exports Destined for East Asia
35
37
39
41
43
45
47
49
51
53
Jan-
98A
pr-9
8Ju
l-98
Oct
-98
Jan-
99A
pr-9
9Ju
l-99
Oct
-99
Jan-
00A
pr-0
0Ju
l-00
Oct
-00
Jan-
01A
pr-0
1Ju
l-01
Oct
-01
Jan-
02A
pr-0
2Ju
l-02
Oct
-02
Jan-
03A
pr-0
3Ju
l-03
Oct
-03
Jan-
04A
pr-0
4Ju
l-04
Oct
-04
Jan-
05A
pr-0
5Ju
l-05
Oct
-05
Jan-
06A
pr-0
6Ju
l-06
Oct
-06
Jan-
07A
pr-0
7Ju
l-07
Oct
-07
Jan-
08A
pr-0
8Ju
l-08
Oct
-08
Jan-
09A
pr-0
9Ju
l-09
Oct
-09
Jan-
10A
pr-1
0Ju
l-10
Oct
-10
Jan-
11A
pr-1
1Ju
l-11
Oct
-11
Jan-
12
%
37 Lawrence J. Lau, The Chinese University of Hong Kong 37
The Share of East Asian Imports Originated from East Asia
The Share of East Asian Imports Originated from East Asia
45
47
49
51
53
55
57
59
Jan-
98A
pr-9
8Ju
l-98
Oct
-98
Jan-
99A
pr-9
9Ju
l-99
Oct
-99
Jan-
00A
pr-0
0Ju
l-00
Oct
-00
Jan-
01A
pr-0
1Ju
l-01
Oct
-01
Jan-
02A
pr-0
2Ju
l-02
Oct
-02
Jan-
03A
pr-0
3Ju
l-03
Oct
-03
Jan-
04A
pr-0
4Ju
l-04
Oct
-04
Jan-
05A
pr-0
5Ju
l-05
Oct
-05
Jan-
06A
pr-0
6Ju
l-06
Oct
-06
Jan-
07A
pr-0
7Ju
l-07
Oct
-07
Jan-
08A
pr-0
8Ju
l-08
Oct
-08
Jan-
09A
pr-0
9Ju
l-09
Oct
-09
Jan-
10A
pr-1
0Ju
l-10
Oct
-10
Jan-
11A
pr-1
1Ju
l-11
Oct
-11
Jan-
12
%

38
The Partial De-Coupling Hypothesis Any doubt that the Chinese economy can be partially de-
coupled from the World economy should be resolved by an examination of the following three charts. Even though Chinese exports and imports fluctuate like those of all the other East Asian economies, the rate of growth of real GDP of the Chinese economy has been relatively stable compared to those of the other East Asian economies.

39 39
Quarterly Rates of Growth of Exports of Goods: Selected East Asian Economies
-60
-50
-40
-30
-20
-10
0
10
20
30
40
50
60
70
Q1 19
97Q2
1997
Q3 19
97Q4
1997
Q1 19
98Q2
1998
Q3 19
98Q4
1998
Q1 19
99Q2
1999
Q3 19
99Q4
1999
Q1 20
00Q2
2000
Q3 20
00Q4
2000
Q1 20
01Q2
2001
Q3 20
01Q4
2001
Q1 20
02Q2
2002
Q3 20
02Q4
2002
Q1 20
03Q2
2003
Q3 20
03Q4
2003
Q1 20
04Q2
2004
Q3 20
04Q4
2004
Q1 20
05Q2
2005
Q3 20
05Q4
2005
Q1 20
06Q2
2006
Q3 20
06Q4
2006
Q1 20
07Q2
2007
Q3 20
07Q4
2007
Q1 20
08Q2
2008
Q3 20
08Q4
2008
Q1 20
09Q2
2009
Q3 20
09Q4
2009
Q1 20
10Q2
2010
Q3 20
10Q4
2010
Q1 20
11Q2
2011
Q3 20
11Q4
2011
Q1 20
12Q2
2012
Q3 20
12Q4
2012
Q1 20
13
Annu
alize
d Per
cent
per
annu
m
Year-over-Year Quarterly Rates of Growth of Exports of Goods in US$ (Percent)
China,P.R.:Hong Kong IndiaIndonesia KoreaMalaysia PhilippinesSingapore ThailandChina,P.R.: Mainland JapanTaiwan Prov.of China

40 40
Quarterly Rates of Growth of Imports of Goods: Selected East Asian Economies
-60
-50
-40
-30
-20
-10
0
10
20
30
40
50
60
70
80
90
Q1 19
97Q2
1997
Q3 19
97Q4
1997
Q1 19
98Q2
1998
Q3 19
98Q4
1998
Q1 19
99Q2
1999
Q3 19
99Q4
1999
Q1 20
00Q2
2000
Q3 20
00Q4
2000
Q1 20
01Q2
2001
Q3 20
01Q4
2001
Q1 20
02Q2
2002
Q3 20
02Q4
2002
Q1 20
03Q2
2003
Q3 20
03Q4
2003
Q1 20
04Q2
2004
Q3 20
04Q4
2004
Q1 20
05Q2
2005
Q3 20
05Q4
2005
Q1 20
06Q2
2006
Q3 20
06Q4
2006
Q1 20
07Q2
2007
Q3 20
07Q4
2007
Q1 20
08Q2
2008
Q3 20
08Q4
2008
Q1 20
09Q2
2009
Q3 20
09Q4
2009
Q1 20
10Q2
2010
Q3 20
10Q4
2010
Q1 20
11Q2
2011
Q3 20
11Q4
2011
Q1 20
12Q2
2012
Q3 20
12Q4
2012
Q1 20
13
Annu
alize
d Per
cent
per
annu
m
Year-over-Year Quarterly Rates of Growth of Imports of Goods in US$ (Percent)
China,P.R.:Hong Kong IndiaIndonesia KoreaMalaysia PhilippinesSingapore ThailandChina,P.R.: Mainland JapanTaiwan Prov.of China

41 41
Quarterly Rates of Growth of Real GDP, Y-o-Y: Selected East Asian Economies
-20
-15
-10
-5
0
5
10
15
20
Q1 19
94Q2
1994
Q3 19
94Q4
1994
Q1 19
95Q2
1995
Q3 19
95Q4
1995
Q1 19
96Q2
1996
Q3 19
96Q4
1996
Q1 19
97Q2
1997
Q3 19
97Q4
1997
Q1 19
98Q2
1998
Q3 19
98Q4
1998
Q1 19
99Q2
1999
Q3 19
99Q4
1999
Q1 20
00Q2
2000
Q3 20
00Q4
2000
Q1 20
01Q2
2001
Q3 20
01Q4
2001
Q1 20
02Q2
2002
Q3 20
02Q4
2002
Q1 20
03Q2
2003
Q3 20
03Q4
2003
Q1 20
04Q2
2004
Q3 20
04Q4
2004
Q1 20
05Q2
2005
Q3 20
05Q4
2005
Q1 20
06Q2
2006
Q3 20
06Q4
2006
Q1 20
07Q2
2007
Q3 20
07Q4
2007
Q1 20
08Q2
2008
Q3 20
08Q4
2008
Q1 20
09Q2
2009
Q3 20
09Q4
2009
Q1 20
10Q2
2010
Q3 20
10Q4
2010
Q1 20
11Q2
2011
Q3 20
11Q4
2011
Q1 20
12Q2
2012
Q3 20
12Q4
2012
Q1 20
13
Annu
alize
d Rat
es in
Per
cent
Quarterly Rates of Growth of Real GDP, Year-over-Year, Selected East Asian Economies
China,P.R.:Hong Kong IndiaIndonesia KoreaMalaysia PhilippinesSingapore ThailandChina,P.R.: Mainland JapanTaiwan Prov.of China

42
Projections of the Future If current trends continue, with the U.S. economy
recovering slowly but surely, Chinese real GDP is projected to catch up to U.S. real GDP in approximately 15 years’ time--around 2028, at which time both Chinese and U.S. real GDP will exceed US$28 trillion (in 2012 prices), almost four times the current Chinese GDP. (Bear in mind that in the meantime, the U.S. economy will also continue to grow, albeit at rates lower than those of the Chinese economy.)
By this time, China and the U.S. will each account for approximately 15% of World GDP.

Lawrence J. Lau 43 Lawrence J. Lau 43
Actual and Projected Chinese and U.S. Real GDPs and Their Rates of Growth
43
-4
-3
-2
-1
0
1
2
3
4
5
6
7
8
9
10
11
12
13
14
15
16
-9
-6
-3
0
3
6
9
12
15
18
21
24
27
30
33
36
1978
1980
1982
1984
1986
1988
1990
1992
1994
1996
1998
2000
2002
2004
2006
2008
2010
2012
2014
2016
2018
2020
2022
2024
2026
2028
2030
PercentU
SD tr
illio
ns, 2
012
price
s
Actual and Projected Real GDP of China and the U.S. and Their Rates of Growth
Growth Rate of U.S. Real GDP (right scale)Growth Rate of Chinese GDP (right scale)U.S. Real GDPChinese Real GDP

44
Concluding Remarks On the basis of its strong economic fundamentals, China should
be able to continue to grow at an average annual rate of at least 7% for the next couple of decades, more or less independently of what happens in the rest of the World.
Chinese economic growth will be marginally, but not critically, affected by a large decline in its exports, as demonstrated by its experience in the past several years as well as during the 1997-1998 East Asian currency crisis. Thus, it will be able to survive even prolonged economic recessions in the European and U.S. economies.
China will develop into a largely internal-demand driven economy like the United States. International trade and international investment will not have a decisive impact on the Chinese economy.

45
Concluding Remarks Exports as a share of Chinese GDP will probably continue
to decline over time, as befitting a large, continental economy. Chinese international trade will become approximately balanced with the rest of the World.
However, China may well become a net overseas direct as well as portfolio investor over the next decade.
46
Concluding Remarks The long-term sustainable sources of Chinese aggregate
demand will all be internal: urbanisation (building new cities), public infrastructure, mass-transit systems, household and public consumption, residential housing, investment in education and health care, environmental protection and preservation, energy conservation and renewable energy, and the green economy.
Chinese household consumption will rise, as GDP per capita and wage rate rise and the social safety net is gradually perfected. But the national saving rate may remain high for a long time.