the children born in 2001 at kindergarten entry children born in 2001 at kindergarten entry: ... and...
TRANSCRIPT

The Children Born in 2001 at Kindergarten Entry: First Findings From the Kindergarten Data Collections of the Early Childhood Longitudinal Study, Birth Cohort (ECLS-B)
FIRST LOOK
NCES 2010-005U.S . DEPARTMENT OF EDUCATION

[Page intentionally blank]

Kristin Denton Flanagan Cameron McPheeEducation Statistics Services Institute – American Institutes for Research
Gail Mulligan Project OfficerNational Center for Educaton Statistics
The Children Born in 2001 at Kindergarten Entry: First Findings From the Kindergarten Data Collections of the Early Childhood Longitudinal Study, Birth Cohort (ECLS-B)
FIRST LOOK
OCTOBER 2009
NCES 2010-005U.S . DEPARTMENT OF EDUCATION

U.S. Department of EducationArne DuncanSecretary
Institute of Education SciencesJohn Q. EastonDirector
National Center for Education StatisticsStuart KerachskyActing Commissioner
The National Center for Education Statistics (NCES) is the primary federal entity for collecting, analyzing, and reporting data related to education in the United States and other nations. It fulfills a congressional mandate to collect, collate, analyze, and report full and complete statistics on the condition of education in the United States; conduct and publish reports and specialized analyses of the meaning and significance of such statistics; assist state and local education agencies in improving their statistical systems; and review and report on education activities in other countries.
NCES activities are designed to address high-priority education data needs; provide consistent, reliable, complete, and accurate indicators of education status and trends; and report timely, useful, and high-quality data to the U.S. Department of Education, the Congress, the states, other education policymakers, practitioners, data users, and the general public. Unless specifically noted, all information contained herein is in the public domain.
We strive to make our products available in a variety of formats and in language that is appropriate to a variety of audiences. You, as our customer, are the best judge of our success in communicating information effectively. If you have any comments or sug-gestions about this or any other NCES product or report, we would like to hear from you. Please direct your comments to:
National Center for Education Statistics Institute of Education Sciences U.S. Department of Education 1990 K Street NW Washington, DC 20006-5651
October 2009
The NCES World Wide Web Home Page address is http://nces.ed.gov.The NCES World Wide Web Electronic Catalog address is http://nces.ed.gov/pubsearch.
Suggested CitationDenton Flanagan, K., and McPhee, C. (2009). The Children Born in 2001 at Kindergarten Entry: First Findings From the Kindergarten Data Collections of the Early Childhood Longitudinal Study, Birth Cohort (ECLS-B) (NCES 2010-005). National Center for Education Statistics, Institute of Education Sciences, U.S. Department of Education. Washington, DC.
For ordering information on this report, write to
U.S. Department of Education ED Pubs P.O. Box 1398 Jessup, MD 20794-1398
or call toll free 1-877-4ED-PUBS or order online at http://www.edpubs.org.
Content ContactGail Mulligan(202) [email protected]

Acknowledgments Many individuals and organizations have contributed to the design and conduct of the Early Childhood Longitudinal Study, Birth Cohort (ECLS-B). While it is not possible to name all the individuals who have made significant contributions to this study, we would like to recognize some of the people and organizations who played a critical role during the development and implementation of the ECLS-B. First and foremost, we thank the parents who invited us into their homes and allowed us to talk with both them and their children. We greatly appreciate the contributions made by the following agencies:
• U.S. Department of Education
− Office of Special Education Programs (OSEP) − National Center for Special Education Research (NCSER) − Office of English Language Acquisition, Language Enhancement, and Academic
Achievement for Limited English Proficient Students (OELA) − Office of Indian Education (OIE)
• U.S. Department of Health and Human Services
− Administration on Children and Families (ACF) − Centers for Disease Control and Prevention (CDC), National Center for Health Statistics
(NCHS) − Health Resources and Services Administration (HRSA), Maternal and Child Health Bureau
(MCHB) − National Institutes of Health (NIH)
− National Institute of Child Health and Human Development (NICHD) − National Institute on Aging (NIA) − National Institute of Mental Health (NIMH) − National Institute of Nursing Research (NINR) − National Institute on Deafness and Other Communication Disorders (NIDCD) − Office of Behavioral and Social Sciences Research (OBSSR) − National Center on Minority Health and Health Disparities (NCMHD)
− Office of the Assistant Secretary for Planning and Evaluation (ASPE) − Office of Minority Health (OMH)
• U.S. Department of Agriculture
iii

[Page intentionally blank]

Contents
Page Acknowledgments .................................................................................................................................... iii List of Tables ........................................................................................................................................... vii Introduction .............................................................................................................................................. 1 Selected Findings ..................................................................................................................................... 3 Estimate Tables ........................................................................................................................................ 5 References ................................................................................................................................................ 13 Appendix A: Survey Methodology and Glossary .................................................................................... 15 Appendix B: Standard Error Tables ......................................................................................................... 31
v

[Page intentionally blank]
List of Tables
Page
Table 1. Percentage distribution of children born in 2001 as they enter kindergarten for the first time, by child and family characteristics: 2006-07 and 2007-08 ............................ 7
Table 2. Average early reading scale scores for children born in 2001 as they enter
kindergarten for the first time, by child and family characteristics: 2006-07 and 2007-08 .......................................................................................................................... 8
Table 3. Average mathematics scale scores for children born in 2001 as they enter
kindergarten for the first time, by child and family characteristics: 2006-07 and 2007-08 .......................................................................................................................... 9
Table 4. Average fine motor scale scores for children born in 2001 as they enter
kindergarten for the first time, by child and family characteristics: 2006-07 and 2007-08 .......................................................................................................................... 10
Table 5. Percentage distribution of children's school and classroom characteristics for
children born in 2001 as they enter kindergarten for the first time: 2006-07 and 2007-08 .......................................................................................................................... 11
Table 6. Percentage distribution of children born in 2001 participating in before- or after-
school care, or both, as they enter kindergarten for the first time, by primary arrangement type and child and family characteristics: 2006-07 and 2007-08 .............. 12
Table B-1. Standard errors of the percentage distribution of children born in 2001 as they enter
kindergarten for the first time, by child and family characteristics: 2006-07 and 2007-08 .......................................................................................................................... 33
Table B-2. Standard errors of average early reading scale scores for children born in 2001 as
they enter kindergarten for the first time, by child and family characteristics: 2006-07 and 2007-08 ............................................................................................................... 34
Table B-3. Standard errors of average mathematics scale scores for children born in 2001 as
they enter kindergarten for the first time, by child and family characteristics: 2006-07 and 2007-08 ............................................................................................................... 35
Table B-4. Standard errors of average fine motor scale scores for children born in 2001 as they
enter kindergarten for the first time, by child and family characteristics: 2006-07 and 2007-08.................................................................................................................... 36
Table B-5. Standard errors of the percentage distribution of children's school and classroom
characteristics for children born in 2001 as they enter kindergarten for the first time: 2006-07 and 2007-08 ............................................................................................ 37
Table B-6. Standard errors of the percentage distribution of children born in 2001 participating
in before- or after-school care, or both, as they enter kindergarten for the first time, by primary arrangement type and child and family characteristics: 2006-07 and 2007-08 .......................................................................................................................... 38
vii

[Page intentionally blank]
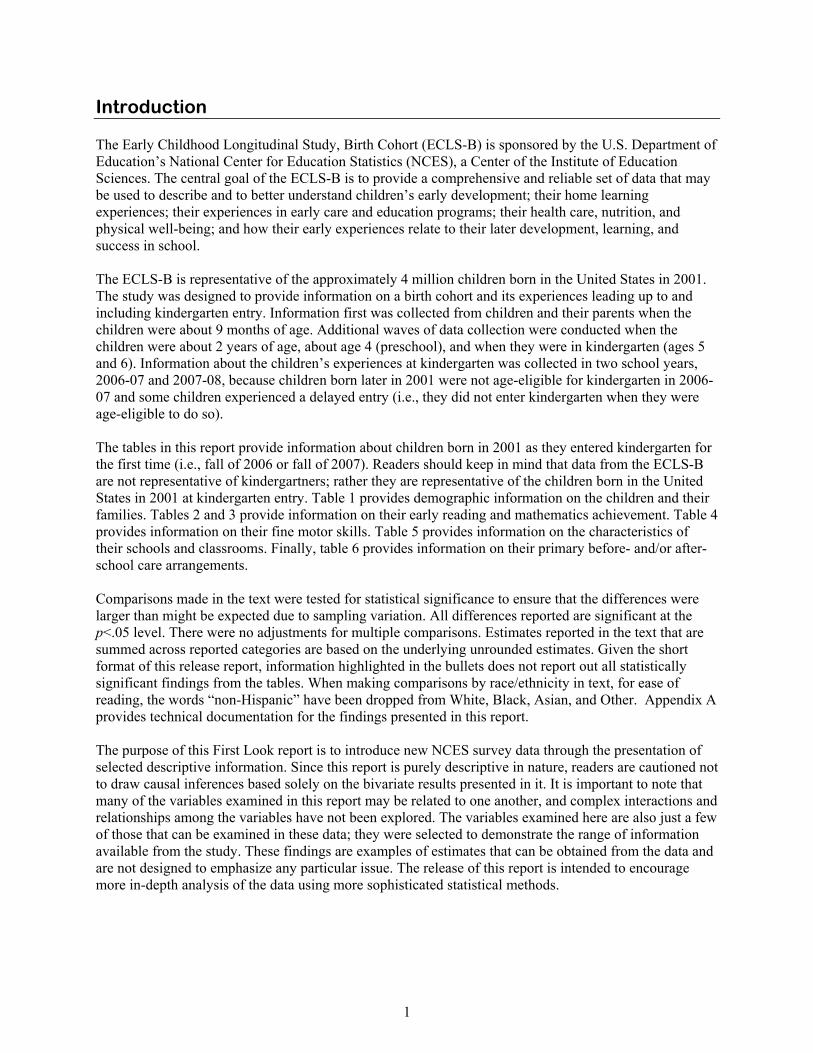
Introduction The Early Childhood Longitudinal Study, Birth Cohort (ECLS-B) is sponsored by the U.S. Department of Education’s National Center for Education Statistics (NCES), a Center of the Institute of Education Sciences. The central goal of the ECLS-B is to provide a comprehensive and reliable set of data that may be used to describe and to better understand children’s early development; their home learning experiences; their experiences in early care and education programs; their health care, nutrition, and physical well-being; and how their early experiences relate to their later development, learning, and success in school. The ECLS-B is representative of the approximately 4 million children born in the United States in 2001. The study was designed to provide information on a birth cohort and its experiences leading up to and including kindergarten entry. Information first was collected from children and their parents when the children were about 9 months of age. Additional waves of data collection were conducted when the children were about 2 years of age, about age 4 (preschool), and when they were in kindergarten (ages 5 and 6). Information about the children’s experiences at kindergarten was collected in two school years, 2006-07 and 2007-08, because children born later in 2001 were not age-eligible for kindergarten in 2006-07 and some children experienced a delayed entry (i.e., they did not enter kindergarten when they were age-eligible to do so). The tables in this report provide information about children born in 2001 as they entered kindergarten for the first time (i.e., fall of 2006 or fall of 2007). Readers should keep in mind that data from the ECLS-B are not representative of kindergartners; rather they are representative of the children born in the United States in 2001 at kindergarten entry. Table 1 provides demographic information on the children and their families. Tables 2 and 3 provide information on their early reading and mathematics achievement. Table 4 provides information on their fine motor skills. Table 5 provides information on the characteristics of their schools and classrooms. Finally, table 6 provides information on their primary before- and/or after-school care arrangements. Comparisons made in the text were tested for statistical significance to ensure that the differences were larger than might be expected due to sampling variation. All differences reported are significant at the p<.05 level. There were no adjustments for multiple comparisons. Estimates reported in the text that are summed across reported categories are based on the underlying unrounded estimates. Given the short format of this release report, information highlighted in the bullets does not report out all statistically significant findings from the tables. When making comparisons by race/ethnicity in text, for ease of reading, the words “non-Hispanic” have been dropped from White, Black, Asian, and Other. Appendix A provides technical documentation for the findings presented in this report. The purpose of this First Look report is to introduce new NCES survey data through the presentation of selected descriptive information. Since this report is purely descriptive in nature, readers are cautioned not to draw causal inferences based solely on the bivariate results presented in it. It is important to note that many of the variables examined in this report may be related to one another, and complex interactions and relationships among the variables have not been explored. The variables examined here are also just a few of those that can be examined in these data; they were selected to demonstrate the range of information available from the study. These findings are examples of estimates that can be obtained from the data and are not designed to emphasize any particular issue. The release of this report is intended to encourage more in-depth analysis of the data using more sophisticated statistical methods.
1

[Page intentionally blank]

Selected Findings Demographics (table 1). As children born in 2001 entered kindergarten for the first time, approximately three-quarters (76.0 percent) were living in two-parent households. About three-quarters (76.1 percent) were living in households with incomes at or above the poverty threshold. Approximately one in five (18.5 percent) was living in a household where the primary language was not English. When the children were assessed for the study early in their kindergarten year, 81.9 percent1 of them were between the ages of 5 and 6 years and 16.4 percent were older than 6 years, with 1.7 percent younger than 5 years. In terms of participation in nonparental early care and education the year prior to kindergarten, about four out of five (83.2 percent) had a regular early care and education arrangement. Early reading and mathematics skills and knowledge (tables 2 and 3). At kindergarten entry, children born in 2001 demonstrated reading and mathematics knowledge and skills that varied by their race/ethnicity, family type, poverty status, primary home language, and their primary early care and education setting the year prior to kindergarten. On average, White and Asian children had higher reading and mathematics assessment scores than did Black, Hispanic, or American Indian/Alaska Native children. Children in households with two parents, with incomes at or above the poverty threshold, or with English as a primary home language, had higher reading and mathematics scores than their counterparts (i.e., children in households with a single parent or some other family structure, living in households in poverty, or with a primary home language that was not English, respectively). Also, children who participated in regular early care and education arrangements the year prior to kindergarten scored higher on the reading and mathematics assessments than children who had no regular experience in early care and education the year prior to entering kindergarten. Fine motor skills (table 4). At kindergarten entry for children born in 2001, females had higher fine motor skill assessment scores than did males. White and Asian children scored higher on the fine motor assessments than Black, Hispanic, or American Indian/Alaska Native children. Children in households with two parents scored higher than children in households with a single parent or some other family structure. Children living in households with incomes at or above the poverty threshold had higher fine motor skill scores than children living in households in poverty. Lastly, children who participated in regular early care and education arrangements the year prior to kindergarten scored higher on the fine motor skill assessments than children who had no regular early care and education the year prior to entering kindergarten. School and classroom characteristics (table 5). Table 5 provides general information about the kinds of schools and kindergarten programs children in the cohort attended for kindergarten. Of the children born in 2001 who first enrolled in kindergarten in the 2006-07 or 2007-08 school year, 89.1 percent were enrolled in public schools, 8.6 percent in religious private schools, and 2.3 percent in nonsectarian private schools. Three-quarters (74.8 percent) were enrolled in full-day kindergarten. Approximately one-half (51.8 percent)2 started school in a school with 500 or more students. About one-half of children attending public school (49.5 percent)3 attended schools in which more than 50 percent of the students were eligible for free or reduced-price lunch.
1This is the sum of the 40.59 percent of children 5 years old to 5 ½ years old and the 41.30 percent of children more than 5 ½ years old to 6 years old at time of assessment, as presented in table 1. 2This is the sum of the 33.45 percent of children in schools with 500 to 749 students and the 18.32 percent of children in schools with 750 or more students, as presented in table 5. 3This is the sum of the 25.92 percent of children who attended schools with 50 to 75 percent of students eligible for free or reduced-price lunch and the 23.62 percent of children who attended schools with more than 75 percent of students eligible, as presented in table 5.
3

Primary before- and/or after-school arrangement during the kindergarten year (table 6). In terms of before- and/or after-school care and education during the kindergarten year, 40.1 percent of children born in 2001 were in some kind of regular arrangement, 16.5 percent were in a center-based arrangement, 16.9 percent were in a home-based arrangement with a relative, and 6.3 percent were in a home-based arrangement with a nonrelative. Participation in before- and/or after-school care and education varied by child and family characteristics. A lower percentage of White children participated in before- and/or after-school care and education than Black children. A higher percentage of children in a single-parent household participated in before- and/or after-school care and education than children in two-parent households. A lower percentage of children living in households in which the primary home language was not English participated in before- and/or after-school care and education than those living in households in which the primary language was English.
4

Estimate Tables
5

[Page intentionally blank]
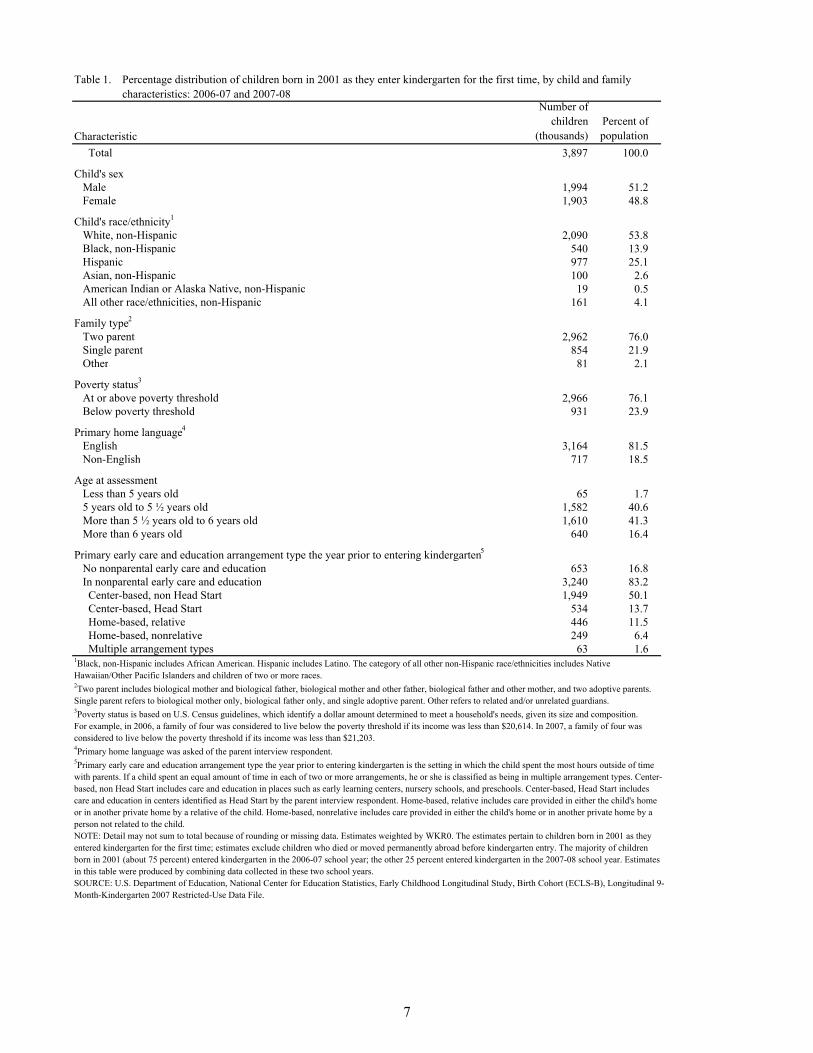
Table 1.
Number of children
(thousands)Percent of population
3,897 100.0
1,994 51.21,903 48.8
2,090 53.8540 13.9977 25.1100 2.6
19 0.5161 4.1
2,962 76.0854 21.9
81 2.1
2,966 76.1931 23.9
3,164 81.5717 18.5
65 1.71,582 40.61,610 41.3
640 16.4
653 16.83,240 83.21,949 50.1
534 13.7446 11.5249 6.4
63 1.6 Multiple arrangement types
Total
American Indian or Alaska Native, non-Hispanic All other race/ethnicities, non-Hispanic
Single parent
Family type2
Black, non-Hispanic
More than 6 years old
Two parent
At or above poverty threshold
Home-based, relative Home-based, nonrelative
Below poverty threshold
Primary home language4
1Black, non-Hispanic includes African American. Hispanic includes Latino. The category of all other non-Hispanic race/ethnicities includes Native Hawaiian/Other Pacific Islanders and children of two or more races.2Two parent includes biological mother and biological father, biological mother and other father, biological father and other mother, and two adoptive parents. Single parent refers to biological mother only, biological father only, and single adoptive parent. Other refers to related and/or unrelated guardians. 3Poverty status is based on U.S. Census guidelines, which identify a dollar amount determined to meet a household's needs, given its size and composition. For example, in 2006, a family of four was considered to live below the poverty threshold if its income was less than $20,614. In 2007, a family of four was considered to live below the poverty threshold if its income was less than $21,203.4Primary home language was asked of the parent interview respondent. 5Primary early care and education arrangement type the year prior to entering kindergarten is the setting in which the child spent the most hours outside of time with parents. If a child spent an equal amount of time in each of two or more arrangements, he or she is classified as being in multiple arrangement types. Center-based, non Head Start includes care and education in places such as early learning centers, nursery schools, and preschools. Center-based, Head Start includes care and education in centers identified as Head Start by the parent interview respondent. Home-based, relative includes care provided in either the child's home or in another private home by a relative of the child. Home-based, nonrelative includes care provided in either the child's home or in another private home by a person not related to the child.NOTE: Detail may not sum to total because of rounding or missing data. Estimates weighted by WKR0. The estimates pertain to children born in 2001 as they entered kindergarten for the first time; estimates exclude children who died or moved permanently abroad before kindergarten entry. The majority of children born in 2001 (about 75 percent) entered kindergarten in the 2006-07 school year; the other 25 percent entered kindergarten in the 2007-08 school year. Estimates in this table were produced by combining data collected in these two school years.SOURCE: U.S. Department of Education, National Center for Education Statistics, Early Childhood Longitudinal Study, Birth Cohort (ECLS-B), Longitudinal 9-Month-Kindergarten 2007 Restricted-Use Data File.
Percentage distribution of children born in 2001 as they enter kindergarten for the first time, by child and family characteristics: 2006-07 and 2007-08
Non-English
No nonparental early care and education
Center-based, non Head Start
Hispanic
White, non-HispanicChild's race/ethnicity1
Characteristic
Male Female
Poverty status3
Asian, non-Hispanic
Child's sex
Other
English
Primary early care and education arrangement type the year prior to entering kindergarten5
Center-based, Head Start
Age at assessment
In nonparental early care and education
Less than 5 years old 5 years old to 5 ½ years old More than 5 ½ years old to 6 years old
7

Table 2.
Averageearly reading
scale score 43.9
43.044.9
46.441.139.451.937.144.2
45.240.138.9
46.037.3
44.840.4
35.039.745.850.4
39.844.847.240.339.545.442.0
Male
Average early reading scale scores for children born in 2001 as they enter kindergarten for the first time, by child and family characteristics: 2006-07 and 2007-08
Characteristic Total
Child's sex
Female
Child's race/ethnicity1
White, non-Hispanic Black, non-Hispanic Hispanic
Home-based, nonrelative
5 years old to 5 ½ years old More than 5 ½ years old to 6 years old More than 6 years old
Below poverty threshold
Single parent Other
Poverty status3
At or above poverty threshold
In nonparental early care and education
Primary early care and education arrangement type the year prior to entering kindergarten5
No nonparental early care and education
Less than 5 years old
Asian, non-Hispanic American Indian or Alaska Native, non-Hispanic All other race/ethnicities, non-Hispanic
Family type2
Two parent
Center-based, non Head Start
Primary home language4
English Non-English
Center-based, Head Start
Age at assessment
Multiple arrangement types1Black, non-Hispanic includes African American. Hispanic includes Latino. The category of all other non-Hispanic race/ethnicities includes Native Hawaiian/Other Pacific Islanders and children of two or more races.2Two parent includes biological mother and biological father, biological mother and other father, biological father and other mother, and two adoptive parents. Single parent refers to biological mother only, biological father only, and single adoptive parent. Other refers to related and/or unrelated guardians. 3Poverty status is based on U.S. Census guidelines, which identify a dollar amount determined to meet a household's needs, given its size and composition. For example, in 2006, a family of four was considered to live below the poverty threshold if its income was less than $20,614. In 2007, a family of four was considered to live below the poverty threshold if its income was less than $21,203.4Primary home language was asked of the parent interview respondent. 5Primary early care and education arrangement type the year prior to entering kindergarten is the setting in which the child spent the most hours outside of time with parents. If a child spent an equal amount of time in each of two or more arrangements, he or she is classified as being in multiple arrangement types. Center-based, non Head Start includes care and education in places such as early learning centers, nursery schools, and preschools. Center-based, Head Start includes care and education in centers identified as Head Start by the parent interview respondent. Home-based, relative includes care provided in either the child's home or in another private home by a relative of the child. Home-based, nonrelative includes care provided in either the child's home or in another private home by a person not related to the child.NOTE: Estimates weighted by WKR0. The estimates pertain to children born in 2001 as they entered kindergarten for the first time; estimates exclude children who died or moved permanently abroad before kindergarten entry. The majority of children born in 2001 (about 75 percent) entered kindergarten in the 2006-07 school year; the other 25 percent entered kindergarten in the 2007-08 school year. Estimates in this table were produced by combining data collected in these two school years. The early reading assessment contained items measuring such skills as children’s letter recognition, letter sound knowledge, recognition of simple words, phonological awareness, receptive and expressive vocabulary knowledge, and knowledge of print conventions. The reading scale score has a potential range of 0 to 85, with a standard deviation of 14.2. For more information on the reading assessment, see appendix A of this report. SOURCE: U.S. Department of Education, National Center for Education Statistics, Early Childhood Longitudinal Study, Birth Cohort (ECLS-B), Longitudinal 9-Month-Kindergarten 2007 Restricted-Use Data File.
Home-based, relative
8
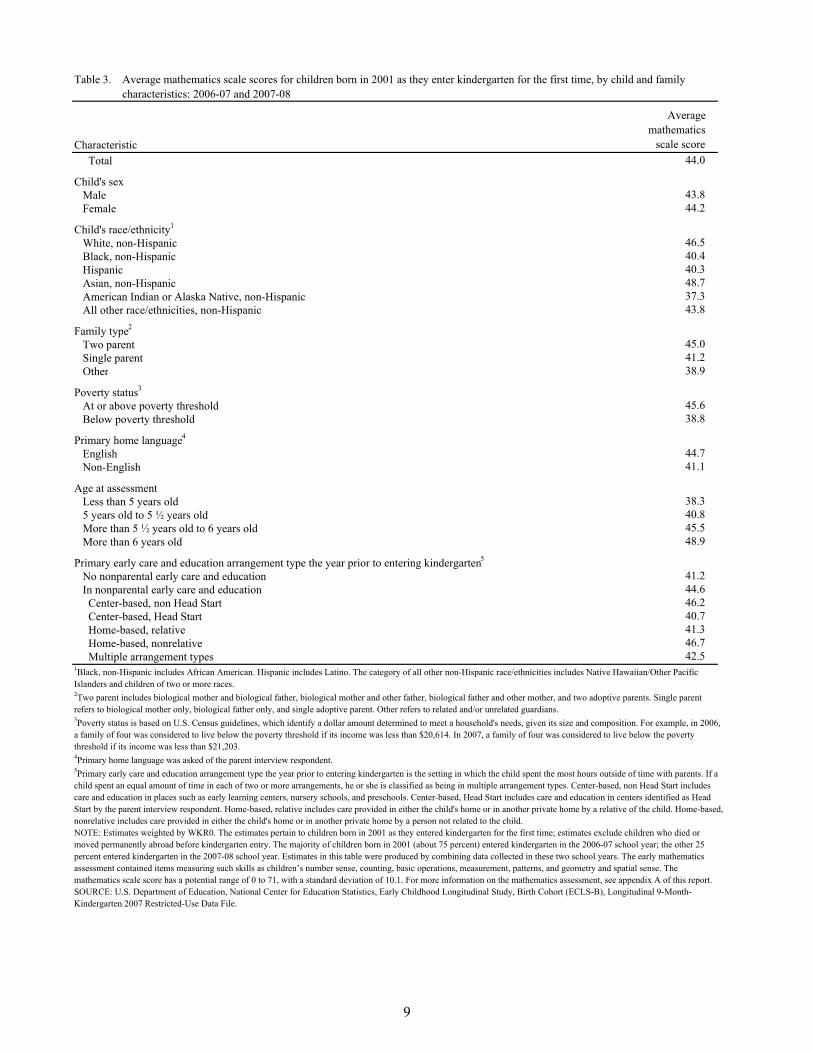
Table 3.
Averagemathematics
scale score 44.0
43.844.2
46.540.440.348.737.343.8
45.041.238.9
45.638.8
44.741.1
38.340.845.548.9
41.244.646.240.741.346.742.5
Female
Average mathematics scale scores for children born in 2001 as they enter kindergarten for the first time, by child and family characteristics: 2006-07 and 2007-08
Characteristic Total
Child's sex Male
Child's race/ethnicity1
White, non-Hispanic Black, non-Hispanic
All other race/ethnicities, non-Hispanic
Family type2
Asian, non-Hispanic American Indian or Alaska Native, non-Hispanic
Hispanic
Two parent Single parent Other
Poverty status3
At or above poverty threshold Below poverty threshold
Home-based, nonrelative
More than 6 years old
Primary home language4
Multiple arrangement types1Black, non-Hispanic includes African American. Hispanic includes Latino. The category of all other non-Hispanic race/ethnicities includes Native Hawaiian/Other Pacific Islanders and children of two or more races.2Two parent includes biological mother and biological father, biological mother and other father, biological father and other mother, and two adoptive parents. Single parent refers to biological mother only, biological father only, and single adoptive parent. Other refers to related and/or unrelated guardians. 3Poverty status is based on U.S. Census guidelines, which identify a dollar amount determined to meet a household's needs, given its size and composition. For example, in 2006, a family of four was considered to live below the poverty threshold if its income was less than $20,614. In 2007, a family of four was considered to live below the poverty threshold if its income was less than $21,203.4Primary home language was asked of the parent interview respondent. 5Primary early care and education arrangement type the year prior to entering kindergarten is the setting in which the child spent the most hours outside of time with parents. If a child spent an equal amount of time in each of two or more arrangements, he or she is classified as being in multiple arrangement types. Center-based, non Head Start includes care and education in places such as early learning centers, nursery schools, and preschools. Center-based, Head Start includes care and education in centers identified as Head Start by the parent interview respondent. Home-based, relative includes care provided in either the child's home or in another private home by a relative of the child. Home-based, nonrelative includes care provided in either the child's home or in another private home by a person not related to the child.NOTE: Estimates weighted by WKR0. The estimates pertain to children born in 2001 as they entered kindergarten for the first time; estimates exclude children who died or moved permanently abroad before kindergarten entry. The majority of children born in 2001 (about 75 percent) entered kindergarten in the 2006-07 school year; the other 25 percent entered kindergarten in the 2007-08 school year. Estimates in this table were produced by combining data collected in these two school years. The early mathematics assessment contained items measuring such skills as children’s number sense, counting, basic operations, measurement, patterns, and geometry and spatial sense. The mathematics scale score has a potential range of 0 to 71, with a standard deviation of 10.1. For more information on the mathematics assessment, see appendix A of this report.SOURCE: U.S. Department of Education, National Center for Education Statistics, Early Childhood Longitudinal Study, Birth Cohort (ECLS-B), Longitudinal 9-Month-Kindergarten 2007 Restricted-Use Data File.
Home-based, relative
English Non-English
Primary early care and education arrangement type the year prior to entering kindergarten5
Center-based, non Head Start Center-based, Head Start
No nonparental early care and education In nonparental early care and education
Age at assessment Less than 5 years old 5 years old to 5 ½ years old More than 5 ½ years old to 6 years old
9

Table 4.
Averagefine motorscale score
2.6
2.52.7
2.72.42.63.22.22.6
2.72.42.2
2.72.3
2.62.7
2.02.42.82.8
2.42.72.82.52.42.72.5
Female
Average fine motor scale scores for children born in 2001 as they enter kindergarten for the first time, by child and family characteristics: 2006-07 and 2007-08
Characteristic Total
Child's sex Male
Child's race/ethnicity1
White, non-Hispanic Black, non-Hispanic
All other race/ethnicities, non-Hispanic
Family type2
Asian, non-Hispanic American Indian or Alaska Native, non-Hispanic
Hispanic
Two parent Single parent Other
Poverty status3
At or above poverty threshold Below poverty threshold
Home-based, nonrelative
More than 6 years old
Primary home language4
Multiple arrangement types1Black, non-Hispanic includes African American. Hispanic includes Latino. The category of all other non-Hispanic race/ethnicities includes Native Hawaiian/Other Pacific Islanders and children of two or more races.2Two parent includes biological mother and biological father, biological mother and other father, biological father and other mother, and two adoptive parents. Single parent refers to biological mother only, biological father only, and single adoptive parent. Other refers to related and/or unrelated guardians. 3Poverty status is based on U.S. Census guidelines, which identify a dollar amount determined to meet a household's needs, given its size and composition. For example, in 2006, a family of four was considered to live below the poverty threshold if its income was less than $20,614. In 2007, a family of four was considered to live below the poverty threshold if its income was less than $21,203.4Primary home language was asked of the parent interview respondent. 5Primary early care and education arrangement type the year prior to entering kindergarten is the setting in which the child spent the most hours outside of time with parents. If a child spent an equal amount of time in each of two or more arrangements, he or she is classified as being in multiple arrangement types. Center-based, non Head Start includes care and education in places such as early learning centers, nursery schools, and preschools. Center-based, Head Start includes care and education in centers identified as Head Start by the parent interview respondent. Home-based, relative includes care provided in either the child's home or in another private home by a relative of the child. Home-based, nonrelative includes care provided in either the child's home or in another private home by a person not related to the child.NOTE: Estimates weighted by WKR0. The estimates pertain to children born in 2001 as they entered kindergarten for the first time; estimates exclude children who died or moved permanently abroad before kindergarten entry. The majority of children born in 2001 (about 75 percent) entered kindergarten in the 2006-07 school year; the other 25 percent entered kindergarten in the 2007-08 school year. Estimates in this table were produced by combining data collected in these two school years. To assess children’s fine motor control and visual-motor integration, children were asked to look at and draw basic shapes and forms. The fine motor scale score has a potential range of 0 to 4, with a standard deviation of 1.2. For more information on the fine motor assessment, see appendix A of this report.SOURCE: U.S. Department of Education, National Center for Education Statistics, Early Childhood Longitudinal Study, Birth Cohort (ECLS-B), Longitudinal 9-Month-Kindergarten 2007 Restricted-Use Data File.
Home-based, relative
English Non-English
Primary early care and education arrangement type the year prior to entering kindergarten5
No nonparental early care and education
Center-based, non Head Start Center-based, Head Start
In nonparental early care and education
Age at assessment Less than 5 years old 5 years old to 5 ½ years old More than 5 ½ years old to 6 years old
10

Table 5.
Percent of population
100.0
89.18.62.3
5.312.530.433.418.3
12.150.337.6
74.825.2
28.138.211.921.8
50.449.6
6.66.09.3
28.525.923.6
Percentage distribution of children's school and classroom characteristics for children born in 2001 as they enter kindergarten for the first time: 2006-07 and 2007-08
Characteristic Total
School sector1
Kindergarten class size2
Public
Private, non-sectarian
Total school enrollment1
0 - 149 students 150 - 299 students
1Estimates weighted by WK45S0.2Estimates weighted by WK45T0.3Percentages are of children enrolled in public school only.NOTE: Detail may not sum to total because of rounding or missing data. The estimates pertain to children born in 2001 as they entered kindergarten for the first time; estimates exclude children who died or moved permanently abroad before kindergarten entry. The majority of children born in 2001 (about 75 percent) entered kindergarten in the 2006-07 school year; the other 25 percent entered kindergarten in the 2007-08 school year. Estimates in this table were produced by combining data collected in these two school years.SOURCE: U.S. Department of Education, National Center for Education Statistics, Early Childhood Longitudinal Study, Birth Cohort (ECLS-B), Longitudinal 9-Month-Kindergarten 2007 Restricted-Use Data File.
Private, religious
16 - 20 students 21 or more students
300 - 499 students 500 - 749 students 750 or more students
1 - 15 students
School locale1
Child enrolled in full- or part-day kindergarten2
Enrolled in full-day kindergarten Enrolled in part-day kindergarten
City Suburb Town Rural
Schoolwide Title I eligibility1,3
More than 10 percent to 20 percent More than 20 percent to 50 percent
More than 75 percent More than 50 percent to 75 percent
Eligible Ineligible
Percent of students eligible for free or reduced-price lunch1,3
0 to 5 percent More than 5 percent to 10 percent
11

Tabl
e 6.
Cen
ter-
base
dH
ome-
base
d,
rela
tive
Hom
e-ba
sed,
no
nrel
ativ
eM
ultip
le
arra
ngem
ent t
ypes
40.1
59.9
16.5
16.9
6.3
0.5
40.0
60.0
17.3
17.0
5.3
0.4
40.2
59.8
15.7
16.7
7.3
0.6
!
36.9
63.1
16.7
12.1
7.6
0.5
!50
.849
.220
.425
.74.
10.
6!
39.0
61.0
12.3
21.3
5.3
0.2
!44
.455
.617
.221
.24.
41.
6!
53.0
47.0
11.6
37.3
4.1
!#
45.7
54.3
23.0
17.6
4.3
0.8
!
34.0
66.0
14.8
12.9
5.9
0.3
61.0
39.0
21.3
30.8
7.9
1.0
!45
.055
.028
.814
.5!
1.8
!#
41.9
58.1
18.4
15.8
7.2
0.6
34.3
65.7
10.6
20.1
3.4
0.2
!
41.8
58.2
18.2
16.6
6.5
0.5
32.8
67.2
9.3
18.0
5.2
0.4
!
Fe
mal
e
Chi
ld's
race
/eth
nici
ty2
W
hite
, non
-His
pani
c
Perc
enta
ge d
istri
butio
n of
chi
ldre
n bo
rn in
200
1 pa
rtici
patin
g in
bef
ore-
or a
fter-
scho
ol c
are,
or b
oth,
as t
hey
ente
r kin
derg
arte
n fo
r the
firs
t tim
e, b
y pr
imar
y ar
rang
emen
t typ
e an
d ch
ild a
nd fa
mily
cha
ract
eris
tics:
200
6-07
and
200
7-08
T
otal
Chi
ld's
sex
M
ale
Cha
ract
eris
tic
Type
of p
rimar
y be
fore
- or a
fter-
scho
ol c
are
arra
ngem
ent1
No
befo
re- o
r afte
r-sc
hool
car
e ar
rang
emen
t
In b
efor
e- o
r afte
r-sc
hool
car
e ar
rang
emen
t
# R
ound
s to
zero
.! I
nter
pret
with
cau
tion.
Sta
ndar
d er
ror i
s mor
e th
an o
ne-th
ird a
s lar
ge a
s est
imat
e.1 Pr
imar
y be
fore
- or a
fter-
scho
ol c
are
is th
e se
tting
in w
hich
the
child
spen
t the
mos
t hou
rs o
utsi
de o
f tim
e w
ith p
aren
ts. I
f a c
hild
spen
t an
equa
l am
ount
of t
ime
in e
ach
of tw
o or
mor
e ar
rang
emen
ts, h
e or
she
is c
lass
ified
as b
eing
in
mul
tiple
arr
ange
men
t typ
es. C
ente
r-ba
sed
incl
udes
car
e an
d ed
ucat
ion
prov
ided
in p
lace
s suc
h as
scho
ols,
lear
ning
cen
ters
, and
recr
eatio
n ce
nter
s. H
ome-
base
d, re
lativ
e in
clud
es c
are
prov
ided
in e
ither
the
child
's ho
me
or in
ano
ther
pr
ivat
e ho
me
by a
rela
tive
of th
e ch
ild. H
ome-
base
d, n
onre
lativ
e in
clud
es c
are
prov
ided
in e
ither
the
child
's ho
me
or in
ano
ther
priv
ate
hom
e by
a p
erso
n no
t rel
ated
to th
e ch
ild.
2 Bla
ck, n
on-H
ispa
nic
incl
udes
Afr
ican
Am
eric
an. H
ispa
nic
incl
udes
Lat
ino.
The
cat
egor
y of
all
othe
r non
-His
pani
c ra
ce/e
thni
citie
s inc
lude
s Nat
ive
Haw
aiia
n/O
ther
Pac
ific
Isla
nder
s and
chi
ldre
n of
two
or m
ore
race
s.3 Tw
o pa
rent
incl
udes
bio
logi
cal m
othe
r and
bio
logi
cal f
athe
r, bi
olog
ical
mot
her a
nd o
ther
fath
er, b
iolo
gica
l fat
her a
nd o
ther
mot
her,
and
two
adop
tive
pare
nts.
Sing
le p
aren
t ref
ers t
o bi
olog
ical
mot
her o
nly,
bio
logi
cal f
athe
r onl
y, a
nd
sing
le a
dopt
ive
pare
nt. O
ther
refe
rs to
rela
ted
and/
or u
nrel
ated
gua
rdia
ns.
4 Po
verty
stat
us is
bas
ed o
n U
.S. C
ensu
s gui
delin
es, w
hich
iden
tify
a do
llar a
mou
nt d
eter
min
ed to
mee
t a h
ouse
hold
's ne
eds,
give
n its
size
and
com
posi
tion.
For
exa
mpl
e, in
200
6, a
fam
ily o
f fou
r was
con
side
red
to li
ve b
elow
the
pove
rty
thre
shol
d if
its in
com
e w
as le
ss th
an $
20,6
14. I
n 20
07, a
fam
ily o
f fou
r was
con
side
red
to li
ve b
elow
the
pove
rty th
resh
old
if its
inco
me
was
less
than
$21
,203
.5 Pr
imar
y ho
me
lang
uage
was
ask
ed o
f the
par
ent i
nter
view
resp
onde
nt.
NO
TE: E
stim
ates
wei
ghte
d by
WK
R0.
The
est
imat
es p
erta
in to
chi
ldre
n bo
rn in
200
1 as
they
ent
ered
kin
derg
arte
n fo
r the
firs
t tim
e; e
stim
ates
exc
lude
chi
ldre
n w
ho d
ied
or m
oved
per
man
ently
abr
oad
befo
re k
inde
rgar
ten
entry
. The
m
ajor
ity o
f chi
ldre
n bo
rn in
200
1 (a
bout
75
perc
ent)
ente
red
kind
erga
rten
in th
e 20
06-0
7 sc
hool
yea
r; th
e ot
her 2
5 pe
rcen
t ent
ered
kin
derg
arte
n in
the
2007
-08
scho
ol y
ear.
Estim
ates
in th
is ta
ble
wer
e pr
oduc
ed b
y co
mbi
ning
dat
a co
llect
ed in
thes
e tw
o sc
hool
yea
rs.
SOU
RC
E: U
.S. D
epar
tmen
t of E
duca
tion,
Nat
iona
l Cen
ter f
or E
duca
tion
Stat
istic
s, Ea
rly C
hild
hood
Lon
gitu
dina
l Stu
dy, B
irth
Coh
ort (
ECLS
-B),
Long
itudi
nal 9
-Mon
th-K
inde
rgar
ten
2007
Res
trict
ed-U
se D
ata
File
.
Prim
ary
hom
e la
ngua
ge5
En
glis
h
Non
-Eng
lish
Si
ngle
par
ent
O
the r
Pove
rty st
atus
4
A
t or a
bove
pov
erty
thre
shol
d
Bel
ow p
over
ty th
resh
old
B
lack
, non
-His
pani
c
A
sian
, non
-His
pani
c
Am
eric
an In
dian
or A
lask
a N
ativ
e, n
on-H
ispa
nic
A
ll ot
her r
ace/
ethn
iciti
es, n
on-H
ispa
nic
Fam
ily ty
pe3
H
ispa
nic
Tw
o pa
rent
12
References Bethel, J., Green, J.L., Nord, C., and Kalton, G. (2005). Early Childhood Longitudinal Study, Birth
Cohort (ECLS-B), Methodology Report for the 9-Month Data Collection (2001–02), Volume 2: Sampling (NCES 2005-147). National Center for Education Statistics, Institute of Education Sciences, U.S. Department of Education. Washington, DC.
Meisels, S.J., Marsden, D.B., Wiske, M.S., and Henderson, L.W. (1997). The Early Screening Inventory–
Revised (ESI-R). New York: Pearson Early Learning. Najarian, M., Snow, K., Lennon, J., and Kinsey, S. (2009). Early Childhood Longitudinal Study, Birth
Cohort (ECLS-B), Preschool–Kindergarten 2007 Psychometric Report (NCES 2010-009). National Center for Education Statistics, Institute of Education Sciences, U.S. Department of Education. Washington, DC.
Snow, K., Derecho, A., Wheeless, S., Lennon, J., Rosen, J., Rogers, J., Kinsey, S, Morgan, K., and
Einaudi, P. (2009). Early Childhood Longitudinal Study, Birth Cohort (ECLS-B), Kindergarten 2006 and 2007 Data File User’s Manual (2010-010). National Center for Education Statistics, Institute of Education Sciences, U.S. Department of Education. Washington, DC.
Wheeless, S., Ault, K., Copello, E., Black, S., and Johnson, R. (2009a). Early Childhood Longitudinal
Study, Birth Cohort (ECLS-B), Methodology Report for the Kindergarten 2006 Data Collection (2006-07), Volume II: Sampling (NCES 2010-007). National Center for Education Statistics, Institute of Education Sciences, U.S. Department of Education. Washington, DC.
Wheeless, S., Ault, K., Copello, E., Black, S., and Johnson, R. (2009b). Early Childhood Longitudinal
Study, Birth Cohort (ECLS-B), Methodology Report for the Kindergarten 2007 Data Collection (2007-08), Volume II: Sampling (NCES 2010-008). National Center for Education Statistics, Institute of Education Sciences, U.S. Department of Education. Washington, DC.
13

[Page intentionally blank]

Appendix A Survey Methodology and Glossary
15

[Page intentionally blank]

Survey Methodology The Early Childhood Longitudinal Study, Birth Cohort (ECLS-B) sponsored by the U.S. Department of Education’s National Center for Education Statistics, a Center of the Institute of Education Sciences, is a multisource, multimethod study that focuses on the early home and educational experiences of children from infancy to kindergarten entry. When properly weighted, the sample is representative of the 3.9 million children born in the United States in 2001.4 The central goal of the ECLS-B is to provide a comprehensive and reliable set of data that may be used to describe and to better understand children’s early development; their preparation for school; key transitions during the early childhood years; their experiences in early care and education programs; their health care, nutrition, and physical well-being; and how their early experiences relate to their later development, learning, and experiences in school. To achieve this goal, the study followed a nationally representative cohort of children born in the United States in 2001 from birth into kindergarten entry. The sample comprises children from different racial/ethnic and socioeconomic backgrounds, including oversamples of Chinese and other Asian and Pacific Islander children and American Indian/Alaska Native children.5 It also includes oversamples of twins and children with moderately low and very low birth weight. The sample of children born in the year 2001 was selected using a clustered, list frame sampling design. The list frame was made up of registered births in the National Center for Health Statistics (NCHS) vital statistics system. Births were sampled from 96 core primary sampling units (PSUs) representing all infants born in the United States in the year 2001.6 The PSUs were counties and county groups. To support the American Indian/Alaska Native oversample, 18 additional PSUs were selected from a supplemental frame consisting of areas where the population had a higher proportion of American Indian/Alaska Native births. Sampling was based on the occurrence of the birth as listed on the birth certificate. Sampled children subsequently identified as having died or who had been adopted after the issuance of the birth certificate were excluded from the sample. Also, infants whose birth mothers were younger than 15 years old at the time of the child’s birth were excluded in response to state confidentiality and sensitivity concerns.7 For more on the ECLS-B sample design, see Early Childhood Longitudinal Study, Birth Cohort (ECLS-B), Kindergarten 2006 and 2007 Data File User’s Manual (Wheeless et al. 2009). Data Collection Procedures There were five waves of data collection in the ECLS-B. Information first was collected from children and their parents when the children were about 9 months of age. Additional waves of data collection were conducted when the children were about 2 years of age, about preschool age (age 4), and when they were in kindergarten (ages 5 and 6). Information about the children’s experiences at kindergarten was collected in two school years, 2006-07 and 2007-08, because children born later in 2001 were not age-eligible for kindergarten in 2006-07 and some children experienced a delayed entry (i.e., they did not enter
4As a result of sampling exclusions, the target population excludes children born to mothers less than 15 years of age, as well as children who died or were adopted prior to the 9-month assessment. 5 Other Asian and Pacific Islander refers to children whose ethnicity is any Indo-Southeastern Asian or Far Eastern Asian except Chinese children. Chinese children are oversampled separately as the largest component of the Asian and Pacific Islander ethnic group. 6The sample design called for the use of the birth certificate records received through the NCHS vital statistics system as the sampling frame to be used for selecting births within selected PSUs. In a few states, state institutional review boards or registrar offices had requirements that placed restrictions on contacting parents based on birth certificate information. In some cases, these restrictions would have resulted in low response rates or even complete nonparticipation. In states that required active consent or that prohibited follow-back research studies, substitution and alternative frames were used. Please see Bethel et al. 2005 for more information. 7In 2001, 0.2 percent of all births were to mothers younger than 15 years old at the time of birth.
17
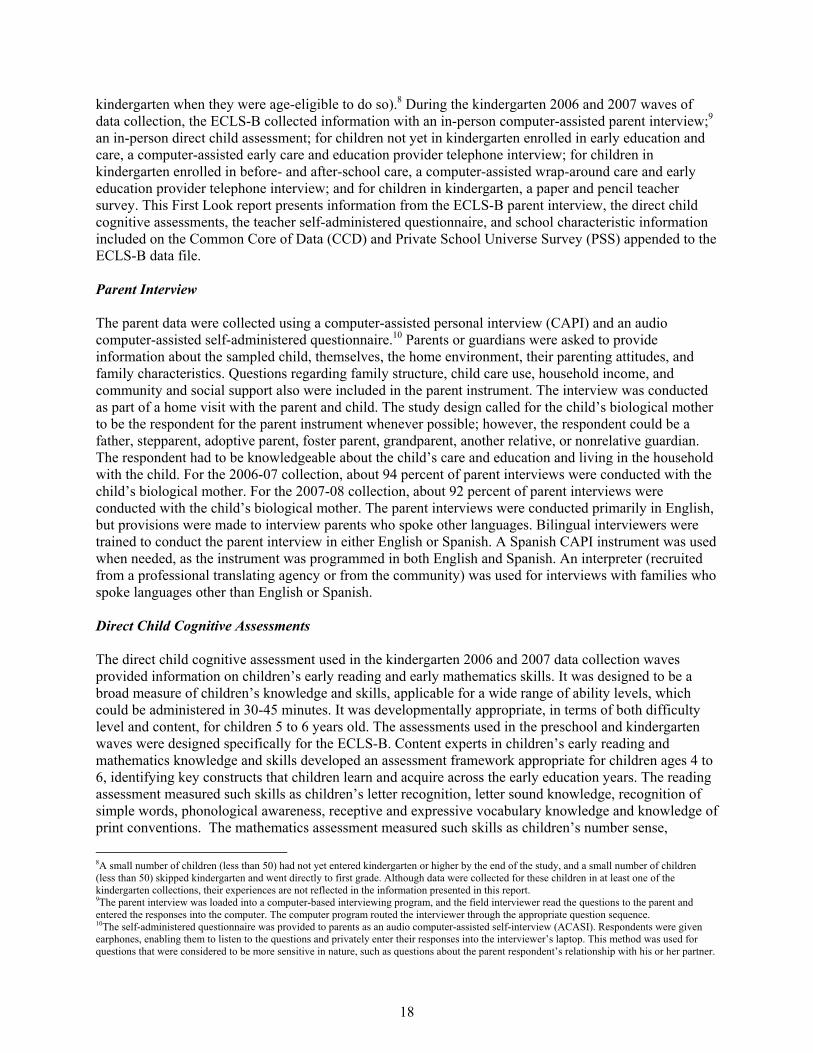
kindergarten when they were age-eligible to do so).8 During the kindergarten 2006 and 2007 waves of data collection, the ECLS-B collected information with an in-person computer-assisted parent interview;9 an in-person direct child assessment; for children not yet in kindergarten enrolled in early education and care, a computer-assisted early care and education provider telephone interview; for children in kindergarten enrolled in before- and after-school care, a computer-assisted wrap-around care and early education provider telephone interview; and for children in kindergarten, a paper and pencil teacher survey. This First Look report presents information from the ECLS-B parent interview, the direct child cognitive assessments, the teacher self-administered questionnaire, and school characteristic information included on the Common Core of Data (CCD) and Private School Universe Survey (PSS) appended to the ECLS-B data file. Parent Interview The parent data were collected using a computer-assisted personal interview (CAPI) and an audio computer-assisted self-administered questionnaire.10 Parents or guardians were asked to provide information about the sampled child, themselves, the home environment, their parenting attitudes, and family characteristics. Questions regarding family structure, child care use, household income, and community and social support also were included in the parent instrument. The interview was conducted as part of a home visit with the parent and child. The study design called for the child’s biological mother to be the respondent for the parent instrument whenever possible; however, the respondent could be a father, stepparent, adoptive parent, foster parent, grandparent, another relative, or nonrelative guardian. The respondent had to be knowledgeable about the child’s care and education and living in the household with the child. For the 2006-07 collection, about 94 percent of parent interviews were conducted with the child’s biological mother. For the 2007-08 collection, about 92 percent of parent interviews were conducted with the child’s biological mother. The parent interviews were conducted primarily in English, but provisions were made to interview parents who spoke other languages. Bilingual interviewers were trained to conduct the parent interview in either English or Spanish. A Spanish CAPI instrument was used when needed, as the instrument was programmed in both English and Spanish. An interpreter (recruited from a professional translating agency or from the community) was used for interviews with families who spoke languages other than English or Spanish. Direct Child Cognitive Assessments The direct child cognitive assessment used in the kindergarten 2006 and 2007 data collection waves provided information on children’s early reading and early mathematics skills. It was designed to be a broad measure of children’s knowledge and skills, applicable for a wide range of ability levels, which could be administered in 30-45 minutes. It was developmentally appropriate, in terms of both difficulty level and content, for children 5 to 6 years old. The assessments used in the preschool and kindergarten waves were designed specifically for the ECLS-B. Content experts in children’s early reading and mathematics knowledge and skills developed an assessment framework appropriate for children ages 4 to 6, identifying key constructs that children learn and acquire across the early education years. The reading assessment measured such skills as children’s letter recognition, letter sound knowledge, recognition of simple words, phonological awareness, receptive and expressive vocabulary knowledge and knowledge of print conventions. The mathematics assessment measured such skills as children’s number sense, 8A small number of children (less than 50) had not yet entered kindergarten or higher by the end of the study, and a small number of children (less than 50) skipped kindergarten and went directly to first grade. Although data were collected for these children in at least one of the kindergarten collections, their experiences are not reflected in the information presented in this report. 9The parent interview was loaded into a computer-based interviewing program, and the field interviewer read the questions to the parent and entered the responses into the computer. The computer program routed the interviewer through the appropriate question sequence. 10The self-administered questionnaire was provided to parents as an audio computer-assisted self-interview (ACASI). Respondents were given earphones, enabling them to listen to the questions and privately enter their responses into the interviewer’s laptop. This method was used for questions that were considered to be more sensitive in nature, such as questions about the parent respondent’s relationship with his or her partner.
18

counting, basic operations, measurement, patterns, and geometry and spatial sense. Based on the content framework, item pools were developed by developing new items and borrowing existing items from assessments such as the Peabody Picture Vocabulary Test–Third Edition, the Preschool Comprehensive Test of Phonological and Print Processing, and the Early Childhood Longitudinal Study, Kindergarten Class of 1998-99 (ECLS-K) for the early reading test and Test of Early Mathematical Ability-3 and the ECLS-K for mathematics. Once the item pools were constructed, the ECLS-B conducted several large scale field tests to better understand the psychometric properties of the items. Analyses of the field test results enabled construction of an adaptive, multi-stage assessment in reading and in mathematics appropriate for the ECLS-B preschool and kindergarten collections. The ECLS-B preschool, kindergarten 2006, and kindergarten 2007 assessment data are scaled together so that scores from each round can be compared to one another. For more information on the development of the assessments and scores derived from these assessments, please see the Early Childhood Longitudinal Study, Birth Cohort (ECLS-B), Preschool–Kindergarten 2007 Psychometric Report (Najarian et al. 2009). The cognitive assessment was adaptive in nature, where each child was administered a set of items that was most appropriate for his or her developmental level. Specifically, the kindergarten assessments had two stages. The first stage was a routing test administered to all children, followed by a second-stage test consisting of three alternative forms ranging in difficulty level. Depending on the number of correct responses on the routing form (stage 1), children were administered a lower-level second-stage form, composed of easier items, a middle-difficulty second-stage form, which included a range of easy and hard items sufficient to accurately measure the skills and knowledge of the majority of the sample, or a higher-level second-stage form, comprising items of higher difficulty. Item Response Theory (IRT) modeling was employed to estimate children’s performance on all of the items in each domain, regardless of whether they were administered all of the items. IRT uses patterns of correct and incorrect answers to obtain estimates on a scale that may be compared for different assessment forms. For more information on scoring the direct child assessments, please see the Early Childhood Longitudinal Study, Birth Cohort (ECLS-B), Preschool–Kindergarten 2007 Psychometric Report (Najarian et al. 2009). Home visits were scheduled at times convenient to parents and children (i.e., not during nap, meal, or family time). The complete cognitive assessment (reading and mathematics) averaged about 45 minutes in length. To conduct the child assessments in a home setting, interviewers worked with the parent respondent to find a well-lit, quiet setting, that was away from sources of noise such as a television or radio, and any other distractions, such as the child’s toys, family pets, and so forth. The presence of other family members was discouraged whenever possible. Interviewers conducted the child assessments with the child seated at a kitchen or dining room table whenever possible. If the household did not have available table space, the assessments were conducted using a small folding table provided by the interviewer for this purpose. Interviewers were trained to sit at a 90-degree angle from the child so that they could see the child’s responses when the assessment item involved pointing; this also limited the opportunity for the child to be distracted from the assessment by the computer screen. Interviewers were trained and certified on the assessments. Certification activities were designed to assess the interviewers’ ability to adhere to the standardized protocol for administration and to correctly score children’s responses. An abbreviated assessment computer program was developed specifically for certification. Selected items from the reading and mathematics assessments were compiled in the certification program. Trainees used a laptop with the program and the assessment administration booklet as they worked through the items. The trainer played the role of the child. For training purposes, trainees said aloud how they scored each item that they administered. Trainers were provided with hard-copy instructions on how to conduct the certifications, which listed different administration and scoring procedures that they were to evaluate during trainee certification. To be certified to administer the
19

assessments, each trainee had to earn at least 85 percent of the total score of the certification exam. During the course of data collection, quality control procedures were implemented to verify adherence to the study protocol. Telephone verification interviews with the parent respondents were conducted to confirm the authenticity of the home visit data. In addition, periodic descriptive analyses on the assessment data were conducted to check for any unusual response distributions. To the extent possible, all children were included in the assessments, including non-native English speakers and those with special needs. The cognitive assessments were administered in English or Spanish. The reading portion of the assessment started with more language-based items. In part, these language-based items were included to provide information on whether the child possessed sufficient English skills to understand the basic instructions and premises required to be assessed in English during the English reading and mathematics components. Based on performance on this opening set of language items, children either continued the reading assessment in English and were administered the mathematics assessment in English, were administered the assessments in Spanish,11 or were routed out into other components of the assessment battery (i.e., physical measures and motor measures).12 Before beginning the assessments, interviewers administered an assessability form to all sample children, with the help of the parent respondent. The assessability form gathered such information as whether or not the child had an Individualized Education Program/Individual Family Service Plan (IEP/IFSP) and, if the child did have such a plan, the services being received. Also, the need for special accommodations (such as special adjustments in order to answer questions, point to pictures, follow directions, draw with a pencil, or move around) was identified. Finally, the assessability form documented whether the child was wheelchair-bound or would need sign language or Braille to participate in the assessments. Interviewers were trained to make a determination of whether or not a child with special needs could be administered a given assessment item on an individual basis, with the goal of maximizing inclusion to the fullest extent possible. To make informed decisions, interviewers were guided by information obtained on the assessability form and discussion with parents about assessment items for which administration might be problematic given the child’s particular needs. Interviewers followed standard administration procedures, but they were allowed to modify the administration of items if necessary to accommodate special needs. For example, parents who used sign language to communicate with a deaf child were encouraged to do so during the course of the motor assessments. If a child could not be fairly assessed for a specific assessment component for reasons such as a severe disability, and appropriate administration accommodations were not feasible, the child was excluded from that component of the assessment.13 Teacher Questionnaire The teacher and classroom data were collected using a self-administered paper and pencil questionnaire that was mailed to the study children’s teachers. Teachers were asked to provide information about the sampled child’s social development, general class and program characteristics and activities, instructional activities in which the sampled child participates (e.g., English as a Second Language or special education), curricular focus in the classroom, methods for evaluating student’s academic performance, school and teacher efforts to facilitate children’s transition to kindergarten, home-school connections, their attitudes about teaching, and their background as a teacher. The teacher questionnaire was designed
11A goal of the ECLS-B was to maximize participation of all children in the English assessment; consequently, the threshold for passing the language items and being routed to the assessments in English was purposely set low. As a result, very few children were not assessed in English. The Spanish assessments ultimately were not scored. Because only a small number of children (less than 50) took them, the IRT analyses necessary to develop scores were not psychometrically appropriate. 12The motor assessments and physical measurements were administered by the interviewer with translation provided by the interpreter or family member. 13Approximately .5 percent of the children assessed required accommodations to participate in some element of the assessment; even fewer were excluded based on lack of accommodations.
20

to accommodate teacher respondents for a variety of grades, including ungraded classrooms and first grade. School Data from the Common Core of Data (CCD) and Private School Universe Survey (PSS) School-level information was not collected directly from school administrators in the kindergarten waves of the ECLS-B. Rather, information about the characteristics of the schools attended by ECLS-B sample children was obtained from the Common Core of Data (CCD) and the Private School Universe Survey (PSS). Also sponsored by the National Center for Education Statistics (NCES), these censuses of public and private primary and secondary schools in the United States collect a wide array of school-level information, such as grade span, school size, enrollment, racial composition of the student population, and the number of students receiving free or reduced-price lunch. The CCD is a census of U.S. public schools, conducted annually by NCES. The PSS, conducted biennially by NCES, is designed to collect data from all private schools in the 50 states and the District of Columbia. The primary purpose of the CCD and PSS is to provide basic information and descriptive statistics on elementary and secondary schools, and schooling in general, in the United States. Together, the complete CCD and PSS include more than 100,000 public schools and 40,000 private schools nationwide. The schools attended by the children in the ECLS-B were matched to the CCD and PSS using the school contact information collected during the kindergarten 2006 and kindergarten 2007 parent interviews. This information was collected for all non-homeschooled children in kindergarten or higher whose parent or guardian provided school contact information as part of the closing section of the parent interview. Children’s schools were matched to the most recent version of the CCD available at the time the data file was developed (collected during the 2006-07 school year) and the two most recently released versions of the PSS (collected during the 2005-06 school year and the 2003-04 school year. Data from the 2003-04 PSS were only used for a small number of cases whose school data matched to a school on the 2003-04 PSS, but not the 2006-07 PSS). Response Rates The target population for the ECLS-B, with minor exclusions, consisted of children born in the United States in 2001. Children born to mothers less than 15 years of age were excluded, as were infants who died or were known to have been adopted before the first data collection, which took place when the children were about 9-months-old. At waves of data collection after 9 months, the target population also excludes children who died or moved permanently out of the United States before that wave of collection. For example, the kindergarten 2006 target population excluded those children born to mothers less than 15 years old, those who died or were adopted before the 9-month data collection, as well as those who died or moved permanently abroad before the kindergarten 2006 assessments. In order to reduce data collection costs, a subsample of approximately 85 percent of eligible cases was selected and fielded for the kindergarten 2006 data collection. All cases with a completed parent component for the preschool collection were eligible for the kindergarten 2006 data collection, with the exception of children who died and children who moved permanently abroad between the preschool and kindergarten 2006 collections. In addition, all children who were sampled in the American Indian/Alaska Native domain and had a completed parent interview at either of the 2-year or preschool waves were eligible for the kindergarten 2006 data collection, with the exception of children who had died or moved permanently abroad since the 9-month interview. American Indian/Alaska Native children who did not have a parent interview at either 2 years or preschool were excluded from the kindergarten 2006 data collection. The kindergarten 2007 data collection included a subset of the ECLS-B sample children with a completed parent interview at kindergarten 2006 who met one of the following conditions: had not started kindergarten at the time of the kindergarten 2006 data collection; was the twin of a child who had not
21

started kindergarten at the time of the kindergarten 2006 data collection; was in kindergarten during the kindergarten 2006 data collection and repeating kindergarten in the 2007–08 school year; or was the twin of a child who was repeating kindergarten in the 2007–08 school year. The information in this report was largely derived from the kindergarten 2006 and kindergarten 2007 parent interviews and child assessments. For the kindergarten 2006 collection, there were about 7,000 parent interviews and 6,900 child assessments. For the kindergarten 2007 collection, there were about 1,900 parent interviews and about 1,900 child assessments. Because children entered kindergarten for the first time across both waves of collection, the information in this report comes from the approximately 5,250 children who entered kindergarten for the first time in 2006 and the approximately 1,600 children who entered kindergarten for the first time in 2007. The weighted unit response rate for the kindergarten 2006 parent interview—calculated as the weighted number of children with completed parent interviews divided by the weighted number of children eligible to participate in the kindergarten 2006 collection—is 91.8 percent. The weighted unit response rate for the kindergarten 2006 child assessment is 98.6 percent, meaning that about 99 percent of the children eligible for the kindergarten 2006 collection have at least some assessment data. The weighted unit response rate for the teacher survey for ECLS-B children with a completed parent interview who were enrolled in kindergarten or higher in 2006-07 and were not homeschooled was 75.6 percent; the weighted unit response rate for school data for these same children was 95.9 percent. The weighted unit response rate for the kindergarten 2007 parent interview—calculated as the weighted number of children with completed parent interviews divided by the weighted number of children eligible to participate in the kindergarten 2007 collection—is 92.5 percent. The weighted unit response rate for the kindergarten 2007 child assessment is 99.4 percent, meaning that about 99 percent of the children eligible for the kindergarten 2007 collection have at least some assessment data. The weighted unit response rate for the teacher survey for ECLS-B children with a completed parent interview who were enrolled in kindergarten or higher in 2007-08 and were not homeschooled was 77.4 percent; the weighted unit response rate for school data for these same children was 96.9 percent. The unit response rate is a round-specific rate in that it indicates the proportion of the eligible sample responding to a survey at a particular time point. For a longitudinal study such as the ECLS-B, it is also useful to calculate a longitudinal response rate, also called an overall unit response rate, which takes into account response for all rounds of collection. The overall weighted14 unit response rate for the parent component after the kindergarten 2006 data collection was 58.0 percent. The overall weighted unit response rates for the child, teacher, and school components after the kindergarten 2006 collection were 57.2 percent, 43.8 percent, and 55.6 percent, respectively. The overall weighted unit response rate for the parent component after the kindergarten 2007 data collection was 53.7 percent. The overall weighted unit response rates for the child, teacher, and school components after the kindergarten 2007 collection were 53.3 percent, 41.5 percent, and 52.0 percent, respectively. In those instances throughout the study where unit response rates below 85 percent led to analyses to measure the potential for nonresponse bias, the weights were adjusted to account for any potential bias that was identified. For more on eligibility requirements, response rates, efforts to improve survey response, and weighting adjustments, see the Early Childhood Longitudinal Study, Birth Cohort (ECLS-B), Kindergarten 2006 and 2007 Data File User’s Manual (Snow et al. 2009); Early Childhood Longitudinal Study, Birth Cohort (ECLS-B), Methodology Report for the Kindergarten 2006 Data Collection (2006–07),Volume II: Sampling (Wheeless et al. 2009); and Early Childhood Longitudinal
14Weighted unit response rates are calculated using the base weight (W1BASEWT).
22

Study, Birth Cohort (ECLS-B), Methodology Report for the Kindergarten 2007 Data Collection (2007–08),Volume II: Sampling (Wheeless et al. 2009). Data Reliability Estimates produced using data from the ECLS-B are subject to two types of error: nonsampling and sampling errors. Nonsampling errors are errors made in the collection and processing of data. Sampling errors occur because the data are collected from a sample rather than a census of the population. Nonsampling Errors Nonsampling error describes variations in the estimates that may be caused by population coverage limitations, as well as data collection, processing, and reporting procedures. The sources of nonsampling errors are typically problems like unit and item nonresponse, differences in respondents’ interpretations of the meaning of the questions, response differences related to the particular time the survey was conducted, and mistakes in data preparation. In general, it is difficult to identify and estimate either the amount of nonsampling error or the bias caused by this error. In the ECLS-B, efforts were made to prevent such errors from occurring and to compensate for them where possible (e.g., field tests, cognitive laboratory sessions testing items new to the surveys, multi-day interviewer training, certification sessions, and monitoring throughout the collection period of interviewer performance and field data quality). Another potential source of nonsampling error is respondent bias, which occurs when respondents systematically misreport (intentionally or unintentionally) information in a study. One potential source of respondent bias in this survey is social desirability bias. An associated error occurs when respondents give unduly positive assessments about those close to them. For example, parents may give a better assessment of their children’s reading ability than might be obtained from a direct assessment. If there are no systematic differences among specific groups under study in their tendency to give socially desirable or unduly positive responses, then comparisons of the different groups will provide reasonable measures of relative differences among the groups. This report uses items from the kindergarten 2006 and 2007 parent interviews and child assessments. Analysis of potential bias due to item nonresponse is typically conducted for those items with less than 85 percent response. None of the information presented in this report is derived from items in the parent interview with response rates less than 85 percent. The child assessment data are not reported out at the item level, so it is not appropriate to discuss item level nonresponse rates for them. However, the child assessments can be evaluated by the unit response rate, which, as noted above, was 98.6 percent for kindergarten 2006 and 99.4 percent for kindergarten 2007. For more on item level response rates, see Early Childhood Longitudinal Study, Birth Cohort (ECLS-B), Kindergarten 2006 and 2007 Data File User’s Manual (Snow et al. 2009). Sampling Errors and Weighting The sample of children born in the United States in 2001 selected for the ECLS-B is just one of many possible samples of births in 2001 that could have been selected. Therefore, estimates produced from the ECLS-B sample may differ from estimates that would have been produced from other samples. This type of variability is called sampling error because it arises from collecting data on a sample of children, rather than all children, born in 2001.
23

The standard error is a measure of variability due to sampling when estimating a statistic. Standard errors can be used as a measure of the precision expected from a particular sample. The probability that a sample estimate would differ from a census count by less than 1 standard error is 68 percent. The probability that the difference would be less than 1.65 standard errors is about 90 percent and that the difference would be less than 1.96 standard errors is about 95 percent. All of the estimates in this report are produced by weighting the observations using weights that adjust for the probabilities of selection of the respondents and include other adjustments to account for nonresponse and noncoverage. Weights were developed to produce unbiased and consistent estimates of national totals. The weight used in tables 1 through 4 and table 6 of this First Look report is WKR0, which was developed for use in analyses of information obtained when children first entered kindergarten (i.e., kindergarten 2006 or kindergarten 2007). The weights used for table 5 of this First Look report are WK45T0 and WK45S0, which were developed for use in analyses of information obtained when children first entered kindergarten (i.e., kindergarten 2006 or kindergarten 2007) and teacher (WK45T0) or school (WK45S0) data are included in the analyses. In addition to weighting the responses properly, special procedures for estimating the standard errors of the estimates were employed because the ECLS-B data were collected using a complex sample design. Complex sample designs result in data that violate some of the assumptions that are normally made when assessing the statistical significance of results from a simple random sample. For example, the standard errors of the estimates from these surveys may vary from those that would be expected if the sample were a simple random sample and the observations were independent and identically distributed random variables. A form of the jackknife replication method using 90 replicate weights was used to compute approximately unbiased estimates of the standard errors of the estimates in the report, using SAS-callable SUDAAN. Jackknife methods were used to estimate the precision of the estimates of the reported national percentages, means, and counts. The purpose of jackknife replication is to construct subsamples (replicates) repeatedly from the whole sample, calculate the statistic of interest for each subsample, and then use the variation in these replicate statistics to estimate the variance of the full-sample statistic. The delete-two jackknife replication method (JK2 method) deletes two units (or two pre-defined groups of units) at a time to form a replicate. Glossary: Constructs and Variables Used in the Analyses A list of definitions and sources for the variables used in this report is presented below (in order of appearance in the tables). Several of the variables were derived by combining information from one or more questions in the ECLS-B parent interview or from other study sources. The names of the source variables as presented on the ECLS-B longitudinal data file are shown in parentheses and in all capital letters. The nomenclature for variables in the ECLS-B presents the data collection wave number as the second character in the variable name. Most variables used in this report come from wave 4 (the kindergarten 2006 collection) or wave 5 (the kindergarten 2007 collection). More information on the derivation of key variables in the ECLS-B longitudinal data file is included in the Early Childhood Longitudinal Study, Birth Cohort (ECLS-B), Kindergarten 2006 and 2007 Data File User’s Manual (Snow et al. 2009). The estimates in this First Look report provide information about children born in 2001 as they entered kindergarten for the first time.15 Children born in 2001 were age-eligible to enter kindergarten in the fall of 2006 and the fall of 2007, depending on their state’s age eligibility requirement. Approximately 75 percent of the sample entered kindergarten for the first time in the fall of 2006. The other 25 percent of
15The majority of child assessments for the kindergarten 2006 and kindergarten 2007 collections occurred in October and November of 2006 and of 2007, respectively, though some child assessments occurred as early as September and some occurred as late as March.
24

the sample entered kindergarten for the first time in the fall of 2007, either because they were born later in 2001 and were not age eligible for kindergarten in 2006-07 or because they experienced a delayed entry (i.e., they did not enter kindergarten when they were age-eligible to do so). The estimates include both children enrolled in school and children being homeschooled. As noted above, because children in the birth cohort entered kindergarten in two different school years (2006-07 and 2007-08), information about the children’s experiences at kindergarten was collected in two different data collection waves (i.e., kindergarten 2006 and kindergarten 2007). Estimates in this report were computed using information from the wave in which each child first entered kindergarten. Specifically, if a child entered kindergarten for the first time in the 2006-07 school year, information from kindergarten 2006 (wave 4) was used. If a child entered kindergarten for the first time in the 2007-08 school year, information from kindergarten 2007 (wave 5) was used. For this reason, most of the variable descriptions below identify comparable variables from waves 4 and 5 as sources of the estimates presented in the report. For example, to determine the mean early reading score for children when they enter kindergarten, an early reading scale score was constructed using the early reading scale score from the kindergarten 2006 collection (X4RSCR2) for those children who were first time kindergartners in 2006 and the early reading scale score from the kindergarten 2007 collection (X5RSCR2) for those children who were first time kindergartners in 2007. Two variables in this report are derived from information obtained in earlier waves of data collection and, therefore, are stable across waves: child’s sex and child’s race/ethnicity.
• Child’s sex [X4CHSEX]. Information for this composite is taken primarily from the birth certificate. However, child’s sex was confirmed in the parent interview. If the parent interview indicated a different sex than the birth certificate, the parent interview information was considered to be most accurate.
• Child’s race/ethnicity [Y1CHRACE]. In the parent interview, respondents indicated whether
their child belonged to one or more of 14 race categories: (1) White, (2) Black or African American, (3) American Indian or Alaska Native (AIAN), (4) Asian Indian, (5) Chinese, (6) Filipino, (7) Japanese, (8) Korean, (9) Vietnamese, (10) Other Asian, (11) Native Hawaiian, (12) Guamanian or Chamorro, (13) Samoan, and (14) Other Pacific Islander. Data were collected on Hispanic ethnicity as well; specifically, respondents were asked whether their child was of Hispanic or Latino origin. In this First Look report, these 14 categories were collapsed to the following mutually-exclusive categories of race/ethnicity: White, non-Hispanic; Black or African American, non-Hispanic; Hispanic; Asian, non-Hispanic; American Indian or Alaska Native, non-Hispanic; and All other races, non-Hispanic (includes Native Hawaiian/Other Pacific Islanders and children of more than one race). A child’s ethnicity was classified as Hispanic if a parent respondent indicated the child’s ethnicity was Hispanic, regardless of the race identified.
• Family type [X4HPARNT, X5HPARNT]. Information collected in the household roster matrix
of the parent interview was used to construct the household composition variables. For this First Look report, the original categories were collapsed as follows:
− two parent (includes biological mother and biological father OR biological mother and
other father [step-, adoptive, foster] OR biological father and other mother [step-, adoptive, foster] OR two adoptive parents OR adoptive parent and stepparent);
− single parent (includes biological mother only OR biological father only OR single
adoptive parent); and
25

− other parent type (includes related guardian(s) OR unrelated guardian(s)).
• Poverty status [X4POVRTY, X5POVRTY]. To compute poverty status, income and total
household size were compared to U.S. Census poverty thresholds in 2006 for the kindergarten 2006 data and the 2007 poverty thresholds for the kindergarten 2007 data. The U.S. Census poverty thresholds provide information in terms of exact income. Therefore, in deriving the poverty composites, information on exact income was used first and, if exact income information was missing, then the midpoint of the imputed household income variable was used. For example, in 2006, a household of four was considered to be in poverty if the household’s income was below $20,614. In 2007, a household of four was considered to be in poverty if the household’s income was below $21,203.
• Primary home language [X4PRMLNG, X5PRMLNG]. Parent interview respondents were
asked “what is the primary language spoken in your home?” For this First Look report, primary language is presented as English and non-English.
• Age at assessment [X4ASAGE, X5ASAGE]. The child’s age at the time of assessment was
calculated by determining the number of days between the date when the child completed the ECLS-B direct child assessments and the child’s date of birth.16 The total number of days was then divided by 365/12 and rounded to the nearest decimal to estimate the child’s age in months. For this report, the variable was collapsed into “less than 5 years old” (less than 59.9 months); “5 years old to 5 ½ years old” (60 through 66.9 months); “more than 5 ½ years old to 6 years old” (67 through 72.9 months); and “more than 6 years old” (73 months or more).
• Primary type of early care and education the year prior to entering kindergarten
[Y3PRIMNW, X4PRIMNW]. In tables 1 through 4, the estimates presented as row variables in this First Look report pertain to the year prior the child entered kindergarten. Therefore, if the child entered kindergarten for the first time during the kindergarten 2006 collection (wave 4), the information was taken from the wave 3 (preschool) data collection. If the child entered kindergarten for the first time during the kindergarten 2007 collection (wave 5), the information was taken from the wave 4 data collection. Parent respondents were asked whether they currently had regular early care and education arrangements for their child and, if so, how many hours per week their child spent in each arrangement. This composite measure presents information on the type of early care and education in which the child spent the most hours per week, which is identified as the primary care arrangement. If a child spent equal time in each of two or more types of arrangements, this variable is coded as “multiple care arrangements.” Children with no regular arrangements are coded as having “no nonparental early care and education.”
There are four main types of early care and education presented in this report: that provided by a relative in the child's home or someone else's home; that provided by a non-relative, such as a nanny, provided in the child's home or someone else's home; Head Start; and center-based care and education, such as preschool, prekindergarten, or a daycare center, that was not part of a Head Start program. Head Start is a federally funded early childhood program that can be housed in a public or private school, religious center, or in a private home. “Regular nonparental care” was defined for parent respondents as arrangements that occurred on a routine schedule (i.e.,
16In the absence of a completed child assessment, X*ASAGE was calculated using the parent interview date. Please note that there are a few cases (061996, 139658, 399376, 454272, and 604329) where X*ASAGE does not match up with the difference between the date of assessment (X*ASMTMM and X*ASMTYY) and the date of birth given on the birth certificate (BCDOBMM and BCDOBYY). These discrepancies occur because the age is calculated based on the date of birth recorded in the Case Management System rather than the date of birth on the birth certificate, as reported on the ECB.
26

occurring at least weekly or on some other schedule), not including occasional babysitting or “back-up” arrangements.
• Children’s reading knowledge and skills [X4RSCR2, X5RSCR2]. The overall reading
knowledge and skills scale score was calculated using item-response theory (IRT) procedures. To reduce burden, children were administered an adaptive test; that is, not all children received the same set of items. Rather, children received a set of items corresponding to their level of knowledge or skills as determined by their performance on an initial set of routing items. The IRT-based scores represent estimates of the number of items children would have answered correctly had they been administered all items. Therefore, the IRT scale scores estimate children’s performance on the whole set of items in the assessment battery that contribute to the score. The scores are not integers. For any given item, the child’s ability estimate (i.e., theta) predicted whether that child would have gotten the item right or wrong, then that information was summed to create the overall scale score. For more information on scoring the direct child assessments please refer to the Early Childhood Longitudinal Study, Birth Cohort (ECLS-B), Kindergarten 2006 and 2007 Data File User’s Manual (Snow et al. 2009). The overall reading knowledge and skills scale score has a possible range of 0 to 85.
• Children’s mathematics knowledge and skills [X4MSCR2, X5MSCR2]. The overall
mathematics knowledge and skills scale score was calculated using item-response theory (IRT) procedures. To reduce burden, children were administered an adaptive test; that is, not all children received the same set of items. Rather, children received a set of items corresponding to their level of knowledge or skills as determined by their performance on an initial set of routing items. The IRT-based scores represent estimates of the number of items children would have answered correctly had they been administered all items. Therefore, the IRT scale scores estimate children’s performance on the whole set of items in the assessment battery that contribute to the score. The scores are not integers. For any given item, the child’s ability estimate (i.e., theta) predicted whether that child would have gotten the item right or wrong, then that information was summed to create the overall scale score. For more information on scoring the direct child assessments please refer to the Early Childhood Longitudinal Study, Birth Cohort (ECLS-B), Kindergarten 2006 and 2007 Data File User’s Manual (Snow et al. 2009). The overall mathematics knowledge and skills score has a possible range of 0 to 71.
• Children’s fine motor skills [X4FMFORM, X5FMFORM]. The ECLS-B assessments provide
information on children’s fine motor control and visual-motor integration. As part of the fine motor assessment, children were asked to copy a selected set of forms. The items were drawn from the kindergarten version of the Early Screening Inventory–Revised (ESI-R) (Meisels et al. 1997). The information presented in this First Look report is a composite score of children’s ability to copy/draw four forms: (1) a square, (2) a circle, (3) an asterisk, and (4) a combination of an open square (a square with three sides) touching a circle. Using standardized scoring rules from the ESI-R, the copy forms items were scored as a “pass” (1 point) or “fail” (0 points). These scoring rules focus on the drawings having an approximate shape or proportion and corners (or lack of corners for rounded figures). These four items were summed, with each item worth a potential point (“pass”), resulting in a fine motor scale with a possible range of 0 to 4.
• School sector [XKCCDPSS, P430 (PSS)]. The schools attended by the children in the ECLS-B
were matched to the Common Core of Data (CCD) and Private School Universe Survey (PSS) using the school contact information collected during the kindergarten 2006 and kindergarten 2007 parent interviews. Those children who were matched to a school listed on the CCD were classified as attending public school. Children whose school was matched to a school included in
27

the PSS were classified as attending private school. As part of the PSS, schools were asked whether the school had a religious orientation or purpose. Those that did were classified as, “private, religious.” Otherwise the school was classified as “private, nonsectarian.”
• Total school enrollment [MEMBER06 (CCD), NUMSTUDS (PSS)]. As part of the CCD and
PSS, schools were asked to report their total school enrollment. For this First Look report, these variables were collapsed into five categories: 0-149 students, 150-299 students, 300-499 students, 500-749 students, and 750 or more students.
• Total kindergarten class size [T4TOTENR, T5TOTENR]. As part of the teacher
questionnaire, teachers were asked to report the number of children enrolled in the ECLS-B sample child’s class at the time they completed the questionnaire. For this First Look report, this variable is collapsed into three categories: 1-15 students, 16-20 students, and 21 or more students.
• Child enrolled in full-day or part-day kindergarten [T4CHFDHD, T5CHFDHD].
Kindergarten teachers of ECLS-B sampled children were asked whether the child was enrolled in a full-day or half-day class.
• School locale [ULOCAL06 (CCD), ULOCALE (PSS)]. This variable, included on the CCD and PSS data files, indicates the school’s location relative to a populous area. These urban-centric locale codes are divided into four main locale types (city, suburb, town, and rural) and each of the four locale types has three subtypes (large, midsize, and small for city and suburb locale types and fringe, distant, and remote for town and rural locale types). The 12 categories are as follows:
- City, Large: Territory inside an urbanized area and inside a principal city with population
of 250,000 or more.
- City, Midsize: Territory inside an urbanized area and inside a principal city with population less than 250,000 and greater than or equal to 100,000.
- City, Small: Territory inside an urbanized area and inside a principal city with population
less than 100,000.
- Suburb, Large: Territory outside a principal city and inside an urbanized area with population of 250,000 or more.
- Suburb, Midsize: Territory outside a principal city and inside an urbanized area with
population less than 250,000 and greater than or equal to 100,000.
- Suburb, Small: Territory outside a principal city and inside an urbanized area with population less than 100,000.
- Town, Fringe: Territory inside an urban cluster that is less than or equal to 10 miles from
an urbanized area.
- Town, Distant: Territory inside an urban cluster that is more than 10 miles and less than or equal to 35 miles from an urbanized area.
- Town, Remote: Territory inside an urban cluster that is more than 35 miles of an
urbanized area.
28
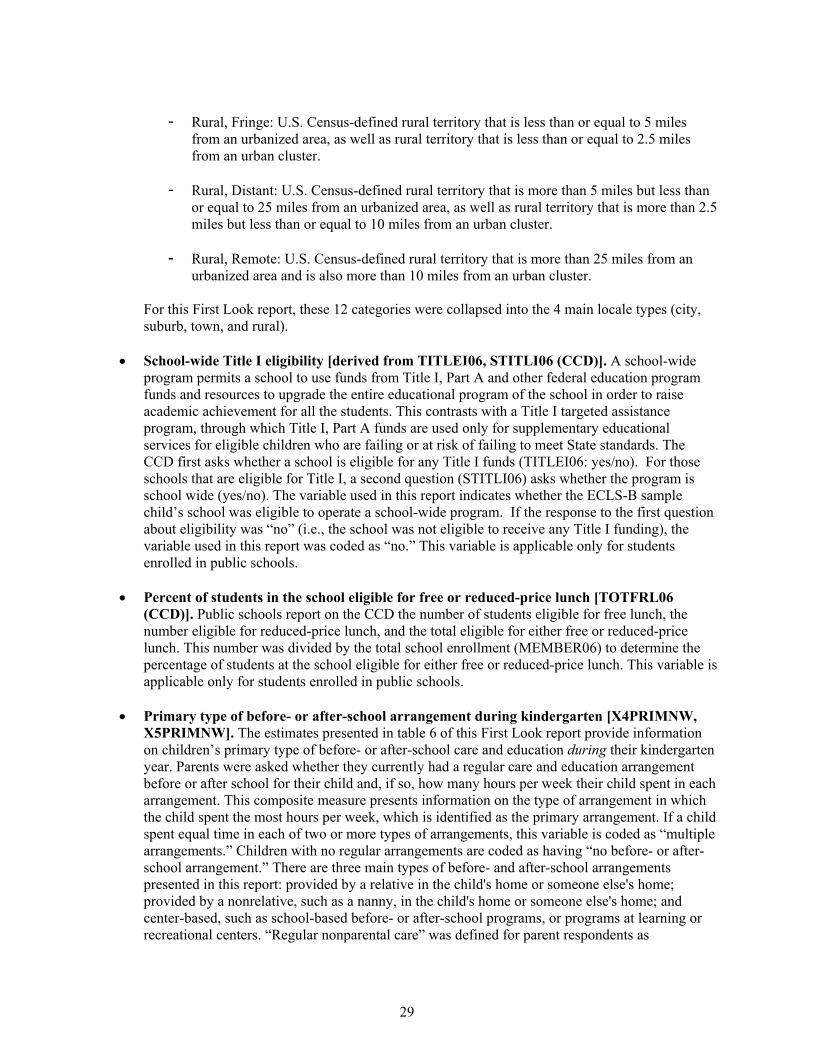
- Rural, Fringe: U.S. Census-defined rural territory that is less than or equal to 5 miles
from an urbanized area, as well as rural territory that is less than or equal to 2.5 miles from an urban cluster.
- Rural, Distant: U.S. Census-defined rural territory that is more than 5 miles but less than
or equal to 25 miles from an urbanized area, as well as rural territory that is more than 2.5 miles but less than or equal to 10 miles from an urban cluster.
- Rural, Remote: U.S. Census-defined rural territory that is more than 25 miles from an
urbanized area and is also more than 10 miles from an urban cluster. For this First Look report, these 12 categories were collapsed into the 4 main locale types (city, suburb, town, and rural).
• School-wide Title I eligibility [derived from TITLEI06, STITLI06 (CCD)]. A school-wide program permits a school to use funds from Title I, Part A and other federal education program funds and resources to upgrade the entire educational program of the school in order to raise academic achievement for all the students. This contrasts with a Title I targeted assistance program, through which Title I, Part A funds are used only for supplementary educational services for eligible children who are failing or at risk of failing to meet State standards. The CCD first asks whether a school is eligible for any Title I funds (TITLEI06: yes/no). For those schools that are eligible for Title I, a second question (STITLI06) asks whether the program is school wide (yes/no). The variable used in this report indicates whether the ECLS-B sample child’s school was eligible to operate a school-wide program. If the response to the first question about eligibility was “no” (i.e., the school was not eligible to receive any Title I funding), the variable used in this report was coded as “no.” This variable is applicable only for students enrolled in public schools.
• Percent of students in the school eligible for free or reduced-price lunch [TOTFRL06
(CCD)]. Public schools report on the CCD the number of students eligible for free lunch, the number eligible for reduced-price lunch, and the total eligible for either free or reduced-price lunch. This number was divided by the total school enrollment (MEMBER06) to determine the percentage of students at the school eligible for either free or reduced-price lunch. This variable is applicable only for students enrolled in public schools.
• Primary type of before- or after-school arrangement during kindergarten [X4PRIMNW,
X5PRIMNW]. The estimates presented in table 6 of this First Look report provide information on children’s primary type of before- or after-school care and education during their kindergarten year. Parents were asked whether they currently had a regular care and education arrangement before or after school for their child and, if so, how many hours per week their child spent in each arrangement. This composite measure presents information on the type of arrangement in which the child spent the most hours per week, which is identified as the primary arrangement. If a child spent equal time in each of two or more types of arrangements, this variable is coded as “multiple arrangements.” Children with no regular arrangements are coded as having “no before- or after-school arrangement.” There are three main types of before- and after-school arrangements presented in this report: provided by a relative in the child's home or someone else's home; provided by a nonrelative, such as a nanny, in the child's home or someone else's home; and center-based, such as school-based before- or after-school programs, or programs at learning or recreational centers. “Regular nonparental care” was defined for parent respondents as
29

arrangements that occurred on a routine schedule (i.e., occurring at least weekly or on some other schedule), not including occasional babysitting or “back-up” arrangements.
30

Appendix B Standard Error Tables
31

[Page intentionally blank]

Table B-1.
Number of children
(thousands)Percent of population
9 0.00
8 0.167 0.16
25 0.6512 0.3220 0.49
5 0.122 0.06
15 0.37
25 0.6425 0.63
9 0.22
29 0.7731 0.77
27 0.6525 0.65
10 0.2735 0.8935 0.8829 0.75
26 0.6829 0.6835 0.8832 0.8325 0.6415 0.39
8 0.22
Primary home language4
English Non-English
Black, non-Hispanic
Standard errors of the percentage distribution of children born in 2001 as they enter kindergarten for the first time, by child and family characteristics: 2006-07 and 2007-08
Characteristic Total
Child's sex Male Female
Child's race/ethnicity1
White, non-Hispanic
Hispanic Asian, non-Hispanic American Indian or Alaska Native, non-Hispanic All other race/ethnicities, non-Hispanic
Family type2
Two parent Single parent Other
Poverty status3
At or above poverty threshold Below poverty threshold
Age at assessment Less than 5 years old
Home-based, relative Home-based, nonrelative Multiple arrangement types
5 years old to 5 ½ years old
1Black, non-Hispanic includes African American. Hispanic includes Latino. The category of all other non-Hispanic race/ethnicities includes Native Hawaiian/Other Pacific Islanders and children of two or more races.2Two parent includes biological mother and biological father, biological mother and other father, biological father and other mother, and two adoptive parents. Single parent refers to biological mother only, biological father only, and single adoptive parent. Other refers to related and/or unrelated guardians. 3Poverty status is based on U.S. Census guidelines, which identify a dollar amount determined to meet a household's needs, given its size and composition. For example, in 2006, a family of four was considered to live below the poverty threshold if its income was less than $20,614. In 2007, a family of four was considered tlive below the poverty threshold if its income was less than $21,203.4Primary home language was asked of the parent interview respondent. 5Primary early care and education arrangement type the year prior to entering kindergarten is the setting in which the child spent the most hours outside of time with parents. If a child spent an equal amount of time in each of two or more arrangements, he or she is classified as being in multiple arrangement types. Center-based, non Head Start includes care and education in places such as early learning centers, nursery schools, and preschools. Center-based, Head Start includes care and education in centers identified as Head Start by the parent interview respondent. Home-based, relative includes care provided in either the child's home or in another private home by a relative of the child. Home-based, nonrelative includes care provided in either the child's home or in another private home by a person not related to the child.NOTE: Estimates weighted by WKR0. The estimates pertain to children born in 2001 as they entered kindergarten for the first time; estimates exclude children who died or moved permanently abroad before kindergarten entry. The majority of children born in 2001 (about 75 percent) entered kindergarten in the 2006-07 school year; the other 25 percent entered kindergarten in the 2007-08 school year. Estimates in this table were produced by combining data collected in these two school years.SOURCE: U.S. Department of Education, National Center for Education Statistics, Early Childhood Longitudinal Study, Birth Cohort (ECLS-B), Longitudinal 9-Month-Kindergarten 2007 Restricted-Use Data File.
More than 5 ½ years old to 6 years old More than 6 years old
Primary early care and education arrangement type the year prior to entering kindergarten5
No nonparental early care and education In nonparental early care and education
Center-based, Head Start Center-based, non Head Start
33

Table B-2.
Averageearly reading
scale score 0.34
0.410.38
0.410.560.590.821.541.29
0.340.601.30
0.360.48
0.370.69
1.960.470.400.64
0.610.350.390.750.741.151.74
Male
Standard errors of average early reading scale scores for children born in 2001 as they enter kindergarten for the first time, by child and family characteristics: 2006-07 and 2007-08
Characteristic Total
Child's sex
Single parent
Female
Child's race/ethnicity1
White, non-Hispanic Black, non-Hispanic Hispanic Asian, non-Hispanic American Indian or Alaska Native, non-Hispanic All other race/ethnicities, non-Hispanic
Family type2
Two parent
More than 5 ½ years old to 6 years old
Other
Poverty status3
At or above poverty threshold Below poverty threshold
Primary home language4
English Non-English
Age at assessment Less than 5 years old 5 years old to 5 ½ years old
Home-based, relative Home-based, nonrelative Multiple arrangement types1Black, non-Hispanic includes African American. Hispanic includes Latino. The category of all other non-Hispanic race/ethnicities includes Native Hawaiian/Other Pacific Islanders and children of two or more races.2Two parent includes biological mother and biological father, biological mother and other father, biological father and other mother, and two adoptive parents. Single parent refers to biological mother only, biological father only, and single adoptive parent. Other refers to related and/or unrelated guardians. 3Poverty status is based on U.S. Census guidelines, which identify a dollar amount determined to meet a household's needs, given its size and composition. For example, in 2006, a family of four was considered to live below the poverty threshold if its income was less than $20,614. In 2007, a family of four was considered to live below the poverty threshold if its income was less than $21,203.4Primary home language was asked of the parent interview respondent. 5Primary early care and education arrangement type the year prior to entering kindergarten is the setting in which the child spent the most hours outside of time with parents. If a child spent an equal amount of time in each of two or more arrangements, he or she is classified as being in multiple arrangement types. Center-based, non Head Start includes care and education in places such as early learning centers, nursery schools, and preschools. Center-based, Head Start includes care and education in centers identified as Head Start by the parent interview respondent. Home-based, relative includes care provided in either the child's home or in another private home by a relative of the child. Home-based, nonrelative includes care provided in either the child's home or in another private home by a person not related to the child.NOTE: Estimates weighted by WKR0. The estimates pertain to children born in 2001 as they entered kindergarten for the first time; estimates exclude children who died or moved permanently abroad before kindergarten entry. The majority of children born in 2001 (about 75 percent) entered kindergarten in the 2006-07 school year; the other 25 percent entered kindergarten in the 2007-08 school year. Estimates in this table were produced by combining data collected in these two school years. The early reading assessment contained items measuring such skills as children’s letter recognition, letter sound knowledge, recognition of simple words, phonological awareness, receptive and expressive vocabulary knowledge, and knowledge of print conventions. For more information on the reading assessment, see appendix A of this report. SOURCE: U.S. Department of Education, National Center for Education Statistics, Early Childhood Longitudinal Study, Birth Cohort (ECLS-B), Longitudinal 9-Month-Kindergarten 2007 Restricted-Use Data File.
More than 6 years old
Primary early care and education arrangement type the year prior to entering kindergarten5
No nonparental early care and education In nonparental early care and education Center-based, non Head Start Center-based, Head Start
34
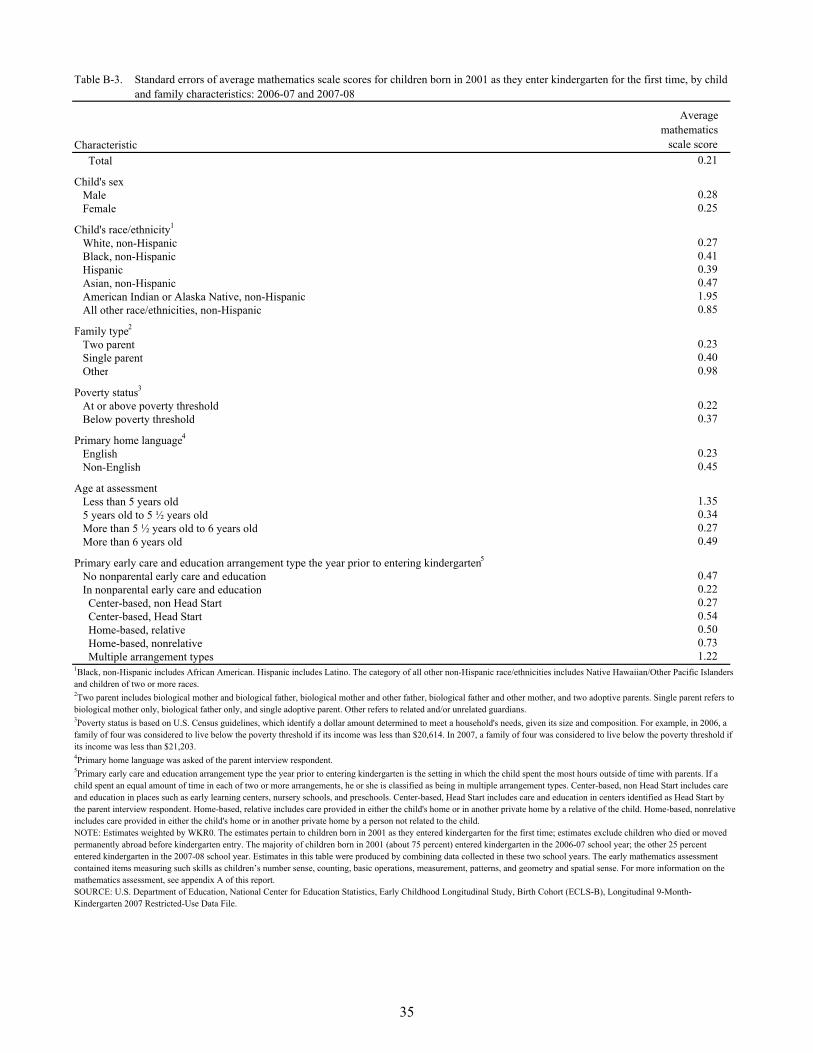
Table B-3.
Averagemathematics
scale score 0.21
0.280.25
0.270.410.390.471.950.85
0.230.400.98
0.220.37
0.230.45
1.350.340.270.49
0.470.220.270.540.500.731.22
Male
Standard errors of average mathematics scale scores for children born in 2001 as they enter kindergarten for the first time, by child and family characteristics: 2006-07 and 2007-08
Characteristic Total
Child's sex
Single parent
Female
Child's race/ethnicity1
White, non-Hispanic Black, non-Hispanic Hispanic Asian, non-Hispanic American Indian or Alaska Native, non-Hispanic All other race/ethnicities, non-Hispanic
Family type2
Two parent
More than 5 ½ years old to 6 years old
Other
Poverty status3
At or above poverty threshold Below poverty threshold
Primary home language4
English Non-English
Age at assessment Less than 5 years old 5 years old to 5 ½ years old
Home-based, relative Home-based, nonrelative Multiple arrangement types1Black, non-Hispanic includes African American. Hispanic includes Latino. The category of all other non-Hispanic race/ethnicities includes Native Hawaiian/Other Pacific Islanders and children of two or more races.2Two parent includes biological mother and biological father, biological mother and other father, biological father and other mother, and two adoptive parents. Single parent refers to biological mother only, biological father only, and single adoptive parent. Other refers to related and/or unrelated guardians. 3Poverty status is based on U.S. Census guidelines, which identify a dollar amount determined to meet a household's needs, given its size and composition. For example, in 2006, a family of four was considered to live below the poverty threshold if its income was less than $20,614. In 2007, a family of four was considered to live below the poverty threshold if its income was less than $21,203.4Primary home language was asked of the parent interview respondent. 5Primary early care and education arrangement type the year prior to entering kindergarten is the setting in which the child spent the most hours outside of time with parents. If a child spent an equal amount of time in each of two or more arrangements, he or she is classified as being in multiple arrangement types. Center-based, non Head Start includes care and education in places such as early learning centers, nursery schools, and preschools. Center-based, Head Start includes care and education in centers identified as Head Start by the parent interview respondent. Home-based, relative includes care provided in either the child's home or in another private home by a relative of the child. Home-based, nonrelative includes care provided in either the child's home or in another private home by a person not related to the child.NOTE: Estimates weighted by WKR0. The estimates pertain to children born in 2001 as they entered kindergarten for the first time; estimates exclude children who died or moved permanently abroad before kindergarten entry. The majority of children born in 2001 (about 75 percent) entered kindergarten in the 2006-07 school year; the other 25 percent entered kindergarten in the 2007-08 school year. Estimates in this table were produced by combining data collected in these two school years. The early mathematics assessment contained items measuring such skills as children’s number sense, counting, basic operations, measurement, patterns, and geometry and spatial sense. For more information on the mathematics assessment, see appendix A of this report.SOURCE: U.S. Department of Education, National Center for Education Statistics, Early Childhood Longitudinal Study, Birth Cohort (ECLS-B), Longitudinal 9-Month-Kindergarten 2007 Restricted-Use Data File.
More than 6 years old
Primary early care and education arrangement type the year prior to entering kindergarten5
No nonparental early care and education In nonparental early care and education Center-based, non Head Start Center-based, Head Start
35

Table B-4.
Averagefine motorscale score
0.02
0.030.03
0.030.050.040.040.200.10
0.030.050.13
0.030.05
0.030.05
0.180.030.030.06
0.050.020.030.060.070.080.18
Male
Standard errors of average fine motor scale scores for children born in 2001 as they enter kindergarten for the first time, by child and family characteristics: 2006-07 and 2007-08
Characteristic Total
Child's sex
Single parent
Female
Child's race/ethnicity1
White, non-Hispanic Black, non-Hispanic Hispanic Asian, non-Hispanic American Indian or Alaska Native, non-Hispanic All other race/ethnicities, non-Hispanic
Family type2
Two parent
More than 5 ½ years old to 6 years old
Other
Poverty status3
At or above poverty threshold Below poverty threshold
Primary home language4
English Non-English
Age at assessment Less than 5 years old 5 years old to 5 ½ years old
Home-based, relative Home-based, nonrelative Multiple arrangement types1Black, non-Hispanic includes African American. Hispanic includes Latino. The category of all other non-Hispanic race/ethnicities includes Native Hawaiian/Other Pacific Islanders and children of two or more races.2Two parent includes biological mother and biological father, biological mother and other father, biological father and other mother, and two adoptive parents. Single parent refers to biological mother only, biological father only, and single adoptive parent. Other refers to related and/or unrelated guardians. 3Poverty status is based on U.S. Census guidelines, which identify a dollar amount determined to meet a household's needs, given its size and composition. For example, in 2006, a family of four was considered to live below the poverty threshold if its income was less than $20,614. In 2007, a family of four was considered to live below the poverty threshold if its income was less than $21,203.4Primary home language was asked of the parent interview respondent. 5Primary early care and education arrangement type the year prior to entering kindergarten is the setting in which the child spent the most hours outside of time with parents. If a child spent an equal amount of time in each of two or more arrangements, he or she is classified as being in multiple arrangement types. Center-based, non Head Start includes care and education in places such as early learning centers, nursery schools, and preschools. Center-based, Head Start includes care and education in centers identified as Head Start by the parent interview respondent. Home-based, relative includes care provided in either the child's home or in another private home by a relative of the child. Home-based, nonrelative includes care provided in either the child's home or in another private home by a person not related to the child.NOTE: Estimates weighted by WKR0. The estimates pertain to children born in 2001 as they entered kindergarten for the first time; estimates exclude children who died or moved permanently abroad before kindergarten entry. The majority of children born in 2001 (about 75 percent) entered kindergarten in the 2006-07 school year; the other 25 percent entered kindergarten in the 2007-08 school year. Estimates in this table were produced by combining data collected in these two school years. To assess children’s fine motor control and visual-motor integration, children were asked to look at and draw basic shapes and forms. For more information on the fine motor assessment, see appendix A of this report.SOURCE: U.S. Department of Education, National Center for Education Statistics, Early Childhood Longitudinal Study, Birth Cohort (ECLS-B), Longitudinal 9-Month-Kindergarten 2007 Restricted-Use Data File.
More than 6 years old
Primary early care and education arrangement type the year prior to entering kindergarten5
No nonparental early care and education In nonparental early care and education Center-based, non Head Start Center-based, Head Start
36

Table B-5.
Percent of population
0.00
0.590.550.25
0.440.640.970.780.83
0.771.521.36
1.301.30
1.341.540.870.88
1.501.50
0.610.580.651.361.191.14
Public
City
More than 10 percent to 20 percent
Standard errors of the percentage distribution of children's school and classroom characteristics for children born in 2001 as they enter kindergarten for the first time: 2006-07 and 2007-08
Characteristic Total
School sector1
16 - 20 students
Private, religious Private, non-sectarian
Total school enrollment1
0 - 149 students 150 - 299 students 300 - 499 students 500 - 749 students 750 or more students
Kindergarten class size2
1 - 15 students
21 or more students
1Estimates weighted by WK45S0.2Estimates weighted by WK45T0.3Percentages are of children enrolled in public school only.NOTE: Detail may not sum to total because of rounding or missing data. The estimates pertain to children born in 2001 as they entered kindergarten for the first time; estimates exclude children who died or moved permanently abroad before kindergarten entry. The majority of children born in 2001 (about 75 percent) entered kindergarten in the 2006-07 school year; the other 25 percent entered kindergarten in the 2007-08 school year. Estimates in this table were produced by combining data collected in these two school years.SOURCE: U.S. Department of Education, National Center for Education Statistics, Early Childhood Longitudinal Study, Birth Cohort (ECLS-B), Longitudinal 9-Month-Kindergarten 2007 Restricted-Use Data File.
Ineligible
Percent of students eligible for free or reduced-price lunch1,3
0 to 5 percent More than 5 percent to 10 percent
More than 20 percent to 50 percent More than 50 percent to 75 percent More than 75 percent
Eligible
Town Rural
Schoolwide Title I eligibility1,3
Child enrolled in full- or part-day kindergarten2
Enrolled in full-day kindergarten Enrolled in part-day kindergarten
School locale1
Suburb
37

Tabl
e B
-6.
Cen
ter-
base
dH
ome-
base
d,
rela
tive
Hom
e-ba
sed,
no
nrel
ativ
eM
ultip
le
arra
ngem
ent t
ypes
0.85
0.62
0.71
0.39
0.10
1.14
0.87
0.93
0.45
0.14
1.27
0.91
0.98
0.63
0.14
1.30
0.88
0.89
0.67
0.16
2.07
1.37
2.26
0.71
0.30
1.79
1.22
1.31
0.74
0.10
2.28
1.86
2.23
0.89
1.29
5.28
1.89
5.76
1.32
#2.
953.
252.
571.
150.
53
0.96
0.70
0.74
0.43
0.10
1.72
1.74
1.90
0.90
0.35
6.37
5.42
4.73
1.48
#
1.04
0.76
0.77
0.49
0.14
1.73
1.08
1.33
0.62
0.13
0.94
0.68
0.73
0.43
0.12
1.77
1.20
1.50
0.88
0.22
B
lack
, non
-His
pani
c
His
pani
c
W
hite
, non
-His
pani
c
Stan
dard
err
ors o
f the
per
cent
age
dist
ribut
ion
of c
hild
ren
born
in 2
001
parti
cipa
ting
in b
efor
e- o
r afte
r-sc
hool
car
e, o
r bot
h, a
s the
y en
ter k
inde
rgar
ten
for t
he fi
rst t
ime,
by
prim
ary
arra
ngem
ent t
ype
and
child
and
fam
ily c
hara
cter
istic
s: 2
006-
07 a
nd 2
007-
08
Cha
ract
eris
tic
No
befo
re- o
r afte
r -sc
hool
car
e ar
rang
emen
t
Type
of p
rimar
y be
fore
- or a
fter-
scho
ol c
are
arra
ngem
ent1
T
otal
Chi
ld's
sex
M
ale
Fe
mal
e
Chi
ld's
race
/eth
nici
ty2
A
sian
, non
-His
pani
c
Am
eric
an In
dian
or A
lask
a N
ativ
e, n
on-H
ispa
nic
A
ll ot
her r
ace/
ethn
iciti
es, n
on-H
ispa
nic
En
glis
h
Non
-Eng
lish
Fam
ily ty
pe3
Tw
o pa
rent
# R
ound
s to
zero
.1 Pr
imar
y be
fore
- or a
fter-
scho
ol c
are
is th
e se
tting
in w
hich
the
child
spen
t the
mos
t hou
rs o
utsi
de o
f tim
e w
ith p
aren
ts. I
f a c
hild
spen
t an
equa
l am
ount
of t
ime
in e
ach
of tw
o or
mor
e ar
rang
emen
ts, h
e or
she
is c
lass
ified
as b
eing
in
mul
tiple
arr
ange
men
t typ
es. C
ente
r-ba
sed
incl
udes
car
e an
d ed
ucat
ion
prov
ided
in p
lace
s suc
h as
scho
ols,
lear
ning
cen
ters
, and
recr
eatio
n ce
nter
s. H
ome-
base
d, re
lativ
e in
clud
es c
are
prov
ided
in e
ither
the
child
's ho
me
or in
an
othe
r priv
ate
hom
e by
a re
lativ
e of
the
child
. Hom
e-ba
sed,
non
rela
tive
incl
udes
car
e pr
ovid
ed in
eith
er th
e ch
ild's
hom
e or
in a
noth
er p
rivat
e ho
me
by a
per
son
not r
elat
ed to
the
child
.2 B
lack
, non
-His
pani
c in
clud
es A
fric
an A
mer
ican
. His
pani
c in
clud
es L
atin
o. T
he c
ateg
ory
of a
ll ot
her n
on-H
ispa
nic
race
/eth
nici
ties i
nclu
des N
ativ
e H
awai
ian/
Oth
er P
acifi
c Is
land
ers a
nd c
hild
ren
of tw
o or
mor
e ra
ces.
3 Two
pare
nt in
clud
es b
iolo
gica
l mot
her a
nd b
iolo
gica
l fat
her,
biol
ogic
al m
othe
r and
oth
er fa
ther
, bio
logi
cal f
athe
r and
oth
er m
othe
r, an
d tw
o ad
optiv
e pa
rent
s. Si
ngle
par
ent r
efer
s to
biol
ogic
al m
othe
r onl
y, b
iolo
gica
l fat
her o
nly,
an
d si
ngle
ado
ptiv
e pa
rent
. Oth
er re
fers
to re
late
d an
d/or
unr
elat
ed g
uard
ians
.
4 Pove
rty st
atus
is b
ased
on
U.S
. Cen
sus g
uide
lines
, whi
ch id
entif
y a
dolla
r am
ount
det
erm
ined
to m
eet a
hou
seho
ld's
need
s, gi
ven
its si
ze a
nd c
ompo
sitio
n. F
or e
xam
ple,
in 2
006,
a fa
mily
of f
our w
as c
onsi
dere
d to
live
bel
ow th
e po
verty
thre
shol
d if
its in
com
e w
as le
ss th
an $
20,6
14. I
n 20
07, a
fam
ily o
f fou
r was
con
side
red
to li
ve b
elow
the
pove
rty th
resh
old
if its
inco
me
was
less
than
$21
,203
.5 Pr
imar
y ho
me
lang
uage
was
ask
ed o
f the
par
ent i
nter
view
resp
onde
nt.
NO
TE: E
stim
ates
wei
ghte
d by
WK
R0.
The
est
imat
es p
erta
in to
chi
ldre
n bo
rn in
200
1 as
they
ent
ered
kin
derg
arte
n fo
r the
firs
t tim
e; e
stim
ates
exc
lude
chi
ldre
n w
ho d
ied
or m
oved
per
man
ently
abr
oad
befo
re k
inde
rgar
ten
entry
. Th
e m
ajor
ity o
f chi
ldre
n bo
rn in
200
1 (a
bout
75
perc
ent)
ente
red
kind
erga
rten
in th
e 20
06-0
7 sc
hool
yea
r; th
e ot
her 2
5 pe
rcen
t ent
ered
kin
derg
arte
n in
the
2007
-08
scho
ol y
ear.
Estim
ates
in th
is ta
ble
wer
e pr
oduc
ed b
y co
mbi
ning
dat
a co
llect
ed in
thes
e tw
osch
ool y
ears
.SO
UR
CE:
U.S
. Dep
artm
ent o
f Edu
catio
n, N
atio
nal C
ente
r for
Edu
catio
n St
atis
tics,
Early
Chi
ldho
od L
ongi
tudi
nal S
tudy
, Birt
h C
ohor
t (EC
LS-B
), Lo
ngitu
dina
l 9-M
onth
-Kin
derg
arte
n 20
07 R
estri
cted
-Use
Dat
a Fi
le.
Si
ngle
par
ent
O
the r
Pove
rty st
atus
4
A
t or a
bove
pov
erty
thre
shol
d
Prim
ary
hom
e la
ngua
ge5
B
elow
pov
erty
thre
shol
d
38