the chief justice’s annual statistics report on criminal ... · the chief justice’s annual...
TRANSCRIPT

THE CHIEF JUSTICE’S ANNUAL STATISTICS REPORT ON
CRIMINAL MATTERS IN THE PARISH COURTS
1

THE CHIEF JUSTICE’S ANNUAL STATISTICS REPORT ON
CRIMINAL MATTERS IN THE PARISH COURTS
2
TABLE OF CONTENTS
The Chief Justice’s Message .......................................................................................................................... 2
Executive Summary ....................................................................................................................................... 5
Methodology ............................................................................................................................................... 10
Chapter 1.0: Criminal Case Activity Statistics ............................................................................................. 12
Chapter 2.0: Criminal Case Demographics.................................................................................................. 30
Chapter 8.0: Conclusion and Recommendations ........................................................................................ 47
THE CHIEF JUSTICE’S ANNUAL STATISTICS REPORT ON
CRIMINAL MATTERS IN THE PARISH COURTS
3
CHIEF JUSTICE’S MESSAGE
Over the last two years significant success has been achieved in developing and deploying
electronic data capture systems in the parish courts which are aimed at capturing data on a range
of variables which chart the progression of criminal cases from initiation to disposition. This was
done with the assistance of a statistician, working closely with the information technology and
other court staff and staff assigned by the Ministry of Justice. This project has so far been
successfully applied for the capture of data on criminal matters in all parish courts and is
supported by a robust data validation system. This initiative forms part of a broader, ongoing
court-wide effort to digitize all records. As a result of these initiatives, the parish courts are now
in a position to extract and report on a range of statistical data, including case load, case
clearance and disposal rates and the length of time that it takes for matters to be disposed.
Among other things, such data provide the parish courts with an opportunity to establish
common time standards for the delivery of justice.
It has always been my desire to create a data driven court system where statistics form the basis
of informing both operational and policy decisions and the recent progress made has been
exceptional. I anticipate that in the coming years these improvements will have a
transformational impact on the Jamaican judiciary, by strengthening and enhancing the
timeliness for the delivery of justice to our citizens.
A comprehensive Statistical Report is prepared on case activity on criminal matters in all parish
courts on a monthly and quarterly basis, in addition to an annual report. The Quarterly and
Annual Statistical Reports are publicly available on the website of the Supreme Court.
THE CHIEF JUSTICE’S ANNUAL STATISTICS REPORT ON
CRIMINAL MATTERS IN THE PARISH COURTS
4
This Annual Statistical Report for 2017 is the first comprehensive Statistical Report of its kind for
the Parish Courts and therefore represents a significant step. It presents a summary of essential
data on criminal case activity in all Parish Courts. The statistical team is committed to working
towards the improvement of our Justice sector in this important area of record keeping.
I would like to thank all members of staff and stakeholders who have contributed to the steady
strides being made in improving data collection and statistics as well as critical supporting
processes such as records and case flow management.
Hon Zaila McCalla, OJ
Chief Justice
THE CHIEF JUSTICE’S ANNUAL STATISTICS REPORT ON
CRIMINAL MATTERS IN THE PARISH COURTS
5
EXECUTIVE SUMMARY
This statistical report on criminal matters in the Parish Courts of Jamaica is for the year ended
December 31, 2017. This report interrogates a number of vital measures which provides insights
into the operations of the parish courts on both an individual and an aggregated basis. The report
forms an important basis for understanding criminal case activity in the parish courts as well as
demographic characteristics of criminal cases. The report disaggregates case activity summaries
for the four quarters and also outlines a range of aggregate measures of case progression in all
Parish Courts.
The aggregate new case count in the parish courts for the year was 32266 cases, 9034 of which
were filed in the first quarter, 8426 in the second quarter, 7968 in the third quarter and 6671 in
the fourth quarter. The larger share of the new cases filed took place in the first half of the year
with 17204 cases while 15062 were filed in the second half. The largest proportion of the new
cases filed in 2017 is accounted for by the Corporate Area Parish Court- Criminal Court with
roughly 6628 or 20.54% of the total, followed by the St. Catherine and St. James Parish Courts
with 4785 or 14.83% and 3324 or 10.30% respectively. The parish courts of Hanover, St. Elizabeth
and Trelawney, all with under 4% of the total case load in 2017, account for the lowest proportion
of the total case load. The average monthly number of new criminal cases filed across all parish
courts in 2017 was 2689.
The overall average disposal rate for cases originating in 2017 was 69.75%, which is fair by
International standards. In many developed jurisdictions, the average annual case disposal rate

THE CHIEF JUSTICE’S ANNUAL STATISTICS REPORT ON
CRIMINAL MATTERS IN THE PARISH COURTS
6
is 80% and over and 75% and over in many of the better performing developing countries. The
Westmoreland Parish Court had the highest criminal disposal rate for 2017, disposing of an
impressive 83.52% of cases filed during the year. The James Parish Court and the St. Catherine
Parish Courts are also pace setters in this respect with case disposal rates of roughly 80.78% and
79.33% respectively, results which are quite interesting considering that these three courts are
among those with the largest criminal case load. The parish courts of Clarendon, Trelawny and
Manchester show overall case disposal rates of fewer than 60% for matters originating in 2017,
with the Clarendon Parish Court recording the lowest rate of 37.66%. These disposal rates are
based only on cases which originated in 2017 and should be interpreted within the context that
many cases which were disposed of in the courts would have originated in prior years.
Nevertheless, the results provide important insights into the movement of cases and thus into
the potential build-up of a criminal case backlog in the respective courts. Despite a standard
deviation of roughly 12% in the case disposal rates across the Parish Courts, the results are
indicative of the potential of the courts to make meaningful inroads into any pre-existing backlog
of cases. It must be reiterated that these disposal rates are for matters originating in 2017 and
may not therefore be seamlessly used for generalization. Nevertheless, they provide critical
insights.
A measure which is closely related to the case disposal rate is the case clearance rate which
provides a measure of the number of cases disposed of for every new case filed in the same
period. This is simply a productivity index as the disposed cases which are included in its
computation could have originated before the period of focus. As with the disposal rates, the
THE CHIEF JUSTICE’S ANNUAL STATISTICS REPORT ON
CRIMINAL MATTERS IN THE PARISH COURTS
7
figures show decisively that most of the parish courts demonstrated moderate to high case
clearance rates for 2017. The Westmoreland and St. Catherine Parish Courts are the leaders in
this respect with clearance rates of 85.36% and 81.23% respectively. They are closely followed
by the Corporate Area Parish Court – Criminal Division which had a case clearance rate of 76.25%
for the year. The parish courts of Clarendon and Trelawny with case clearance rates of 37.73%
and 58.53% respectively rank the lowest, while the Manchester Parish Court has the next lowest
figure with 62.99%. The overall average case clearance rate for the year is roughly 71.53%,
suggesting that approximately 72 cases were disposed for every 100 new ones filed. There is a
direct association between the case disposal and case clearance rates as a poor case disposal rate
will result from the persistence of a poor case clearance rates. The overall average case clearance
rate is well below the typical standard of 85% and over which is observed in many developed
jurisdictions and of 80% and over in many of the better performing developing countries. It is
important to point out that a persistent case clearance rate of fewer than 100% will accelerate
the case backlog and therefore the standard which should be attained on an annual basis is
between 90% and 110%, based on International best practices.
The overall average age of cases originating in 2017 which were pending at the end of the year
was 157.37 days or just over 5 months. The Clarendon Parish Court with an average age of such
pending cases of 216.86 days or just over 7 months has the highest outcome, an unsurprising
result based on the low case clearance and case disposal rates outlined earlier for this court. The
St. James Parish Court with an average age of 186.63 days or just over 6 months ranks next. The
parish courts of Westmoreland and St. Catherine had the lowest average age of pending

THE CHIEF JUSTICE’S ANNUAL STATISTICS REPORT ON
CRIMINAL MATTERS IN THE PARISH COURTS
8
cases which originated in 2017 with 115.09 days or just under 4 months and 130.42 days or 4.5
months respectively. It is of note that the standard deviation is roughly 24 days or 0.8 of a month
which is considered relatively low and suggests that there isn’t a major difference in this variable
among the parish courts as a whole.
The overall average time taken to dispose of criminal cases which originated across the Parish
Courts in 2017 was 157.37 days or just over 5 months. The standard deviation among the courts
was however only 9 days, suggesting that in general a relatively similar length of time was taken
to dispose of criminal cases originating in 2017. The Manchester, Portland and St. Ann Parish
Courts demonstrate the highest time to disposition for criminal cases originating in 2017 while
the Cooperate Area Parish Court – Criminal Division and the St. James and Hanover Parish Courts
have the lowest average times to disposition.
The largest proportion of cases disposed of in the year was by way of cases dismissed with
approximately 21.04% of disposals. This was followed by cases ending in either a guilty verdict or
guilty plea, together accounting for approximately 19.45% of the cases disposed, representing
the criminal conviction rate in the parish courts for 2017. In terms of the distribution of case
types, the report highlights that the largest proportion of the criminal cases filed in the courts
were summary matters with approximately 36.64% of all charges. This is followed by indictments
with a roughly equivalent 36.62% and petty sessions with approximately 15.55% of the total. It is
of note that committal proceedings accounted for 8.17% of all criminal matters filed in the parish
courts in 2017.

THE CHIEF JUSTICE’S ANNUAL STATISTICS REPORT ON
CRIMINAL MATTERS IN THE PARISH COURTS
9
An important factor which affects the efficiency with which cases move towards disposition is
the incidence of adjournments in the parish courts. The report suggests that apart from
adjournments due to some form of ‘continuance’ or for sentencing, the dominant reasons for
adjournments for the year were parties not appearing with an estimated 11.77% of all
adjournments, no evidence offered with an estimated 9.65%, reissued application with
approximately 8% and matters and matters transferred with an estimated 7.27% of the total.
The four most frequent criminal charges filed in the parish courts in 2017 were unlawful
wounding, assault occasioning bodily harm, threats and possession of an offensive weapon. The
overwhelming majority of offences were committed by males, accounting for an estimated
80.43% of all charges filed during the year. The dominant age group of offenders was the 18 - 26
and 27 – 36 age groups accounting for roughly 31.05% and 27.36% respectively of all offences
filed in the Parish Courts in 2017. The most up to date estimated backlog of criminal cases in the
parish courts is 30719 cases which is close to the annual case load. A criminal case is considered
to be in backlog if it has been in the courts for two or more years without disposal.

THE CHIEF JUSTICE’S ANNUAL STATISTICS REPORT ON
CRIMINAL MATTERS IN THE PARISH COURTS
10
METHODOLOGY
Guaranteeing the reliability and validity of the data used to produce the periodic statistical
reports for the Jamaican Courts is of utmost importance as we seek to produce a data driven
enterprise for policy making and operational decisions. As a result, a robust and verifiable system
of data production has been created in both the parish courts and the Supreme Court. At the
parish courts, a data capture system for criminal matters, called the CISS (Case Information
Statistical System) has been fully operational in all courts for the past 18 months. This system
captures a wide range of data on the progression of criminal cases from initiation to disposition
and is manned by at least one dedicated Data Entry Officer in each court. The Data Entry Officers
update the system on a daily basis so that the data produced is as close as possible to real time.
The electronic data sheets for each parish court are then validated and backed-up to the network
at the end of each month and the data submitted to a centralized, secure medium for processing
by the Statistical Unit of the Supreme Court. A robust data validation mechanism is in place to
periodically sample criminal case files in all parish courts on a quarterly basis. A representative
sample of case files are taken in each case and cross-checked against the electronic data to detect
and eliminate errors of omission and commission.
A monthly statistical report is produced using the data submissions, culminating in Quarterly
Reports and eventually the Annual Report of this nature. All Quarterly and Annual Parish Court
reports are published on the website of the Supreme Court; however interim data required by
stakeholders may be requested through the Office of the Chief Justice.

THE CHIEF JUSTICE’S ANNUAL STATISTICS REPORT ON
CRIMINAL MATTERS IN THE PARISH COURTS
11
Structure of report
The report is divided into two main sections. Chapter 1.0 explores case activity statistics by
examining the case load carried by each Parish Court in aggregate and by quarter as well the
associated disposal rates or clearance rates, as appropriate. This section also examines the
distribution of the different types of cases filed in the respective courts as well as the most
commonly occurring charges and the aggregate case clearance rates. The common reasons for
adjournment and the distribution of the methods of case disposition are also examined in this
section along with the overall conviction rate.
Chapter 2.0 examines case demographics including age and gender distribution of offenders as
well as a sample estimate of the geographical distribution of charges based the police station
where matters are reported.
THE CHIEF JUSTICE’S ANNUAL STATISTICS REPORT ON
CRIMINAL MATTERS IN THE PARISH COURTS
12
Chapter 1.0: Criminal Case Activity Statistics in the Parish Courts in 2017
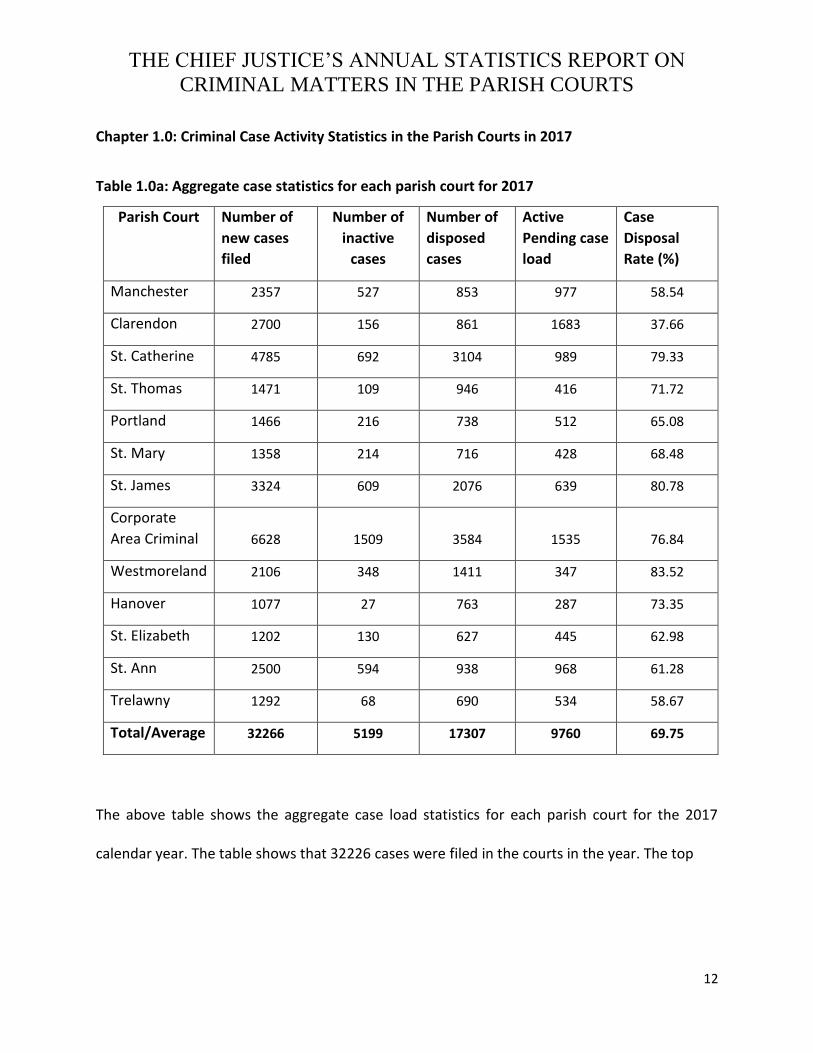
Table 1.0a: Aggregate case statistics for each parish court for 2017
Parish Court Number of
new cases
filed
Number of
inactive
cases
Number of
disposed
cases
Active
Pending case
load
Case
Disposal
Rate (%)
Manchester 2357 527 853 977 58.54
Clarendon 2700 156 861 1683 37.66
St. Catherine 4785 692 3104 989 79.33
St. Thomas 1471 109 946 416 71.72
Portland 1466 216 738 512 65.08
St. Mary 1358 214 716 428 68.48
St. James 3324 609 2076 639 80.78
Corporate
Area Criminal 6628 1509 3584 1535 76.84
Westmoreland 2106 348 1411 347 83.52
Hanover 1077 27 763 287 73.35
St. Elizabeth 1202 130 627 445 62.98
St. Ann 2500 594 938 968 61.28
Trelawny 1292 68 690 534 58.67
Total/Average 32266 5199 17307 9760 69.75
The above table shows the aggregate case load statistics for each parish court for the 2017
calendar year. The table shows that 32226 cases were filed in the courts in the year. The top
THE CHIEF JUSTICE’S ANNUAL STATISTICS REPORT ON
CRIMINAL MATTERS IN THE PARISH COURTS
13
three parish courts with the largest case load during the year were the Corporate Area Court-
Criminal Division and the St. Catherine Parish Court with 20.54% and 14.83% respectively of the
total case load and the St. James Parish Court with 10.30%. On the other hand, the bottom three
parish courts with the smallest case load were the Hanover Parish Court with 3.34%, the St.
Elizabeth Parish Court with 3.74% and the Trelawny Court with 4.0%. The Westmoreland Parish
Court and the St. Catherine Parish Court with 83.50% and 79.40% respectively and the Corporate
Area Court- Criminal Division with 76.80% were the courts with the highest recorded case
disposal rates for the year. On the other hand, the parish courts of Clarendon with 37.66%,
Trelawny with 58.66% and St. Ann with 61.28% had the lowest case disposal rates. It is of interest
to note that some of the parish courts with the larger caseloads also rank among those with the
higher disposal rates. The overall average disposal rate across all parish courts was approximately
69.75% for 2017. The Clarendon Parish Court, the Corporate Area Parish Court – Criminal Division
and the St. Catherine Parish Court had the highest absolute number of cases pending at year end,
from those which originated in 2017.
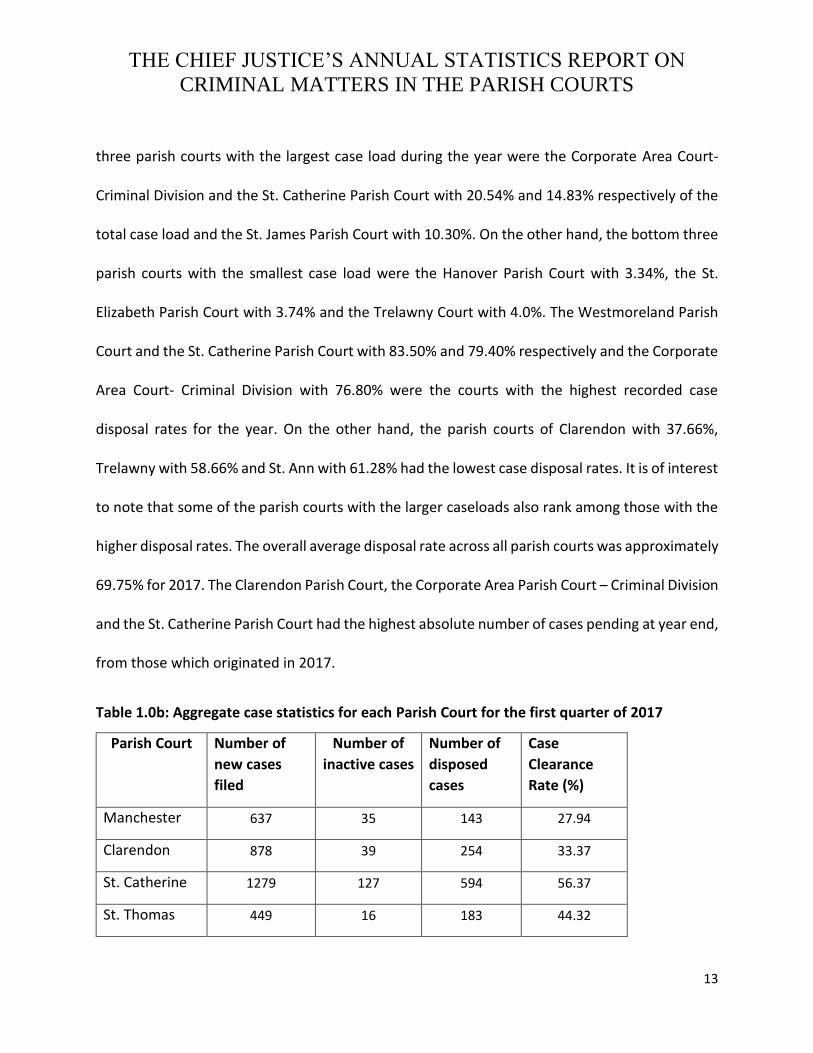
Table 1.0b: Aggregate case statistics for each Parish Court for the first quarter of 2017
Parish Court Number of
new cases
filed
Number of
inactive cases
Number of
disposed
cases
Case
Clearance
Rate (%)
Manchester 637 35 143 27.94
Clarendon 878 39 254 33.37
St. Catherine 1279 127 594 56.37
St. Thomas 449 16 183 44.32
THE CHIEF JUSTICE’S ANNUAL STATISTICS REPORT ON
CRIMINAL MATTERS IN THE PARISH COURTS
14
Portland 381 22 149 44.88
St. Mary 437 53 136 43.25
St. James 756 98 365 61.24
Corporate
Area Criminal 1947 352 833 60.86
Westmoreland 592 51 258 52.2
Hanover 284 8 129 48.24
St. Elizabeth 351 32 118 42.74
St. Ann 764 114 174 37.7
Trelawny 284 17 111 45.07
Total/Average 9034 964 3447 48.83
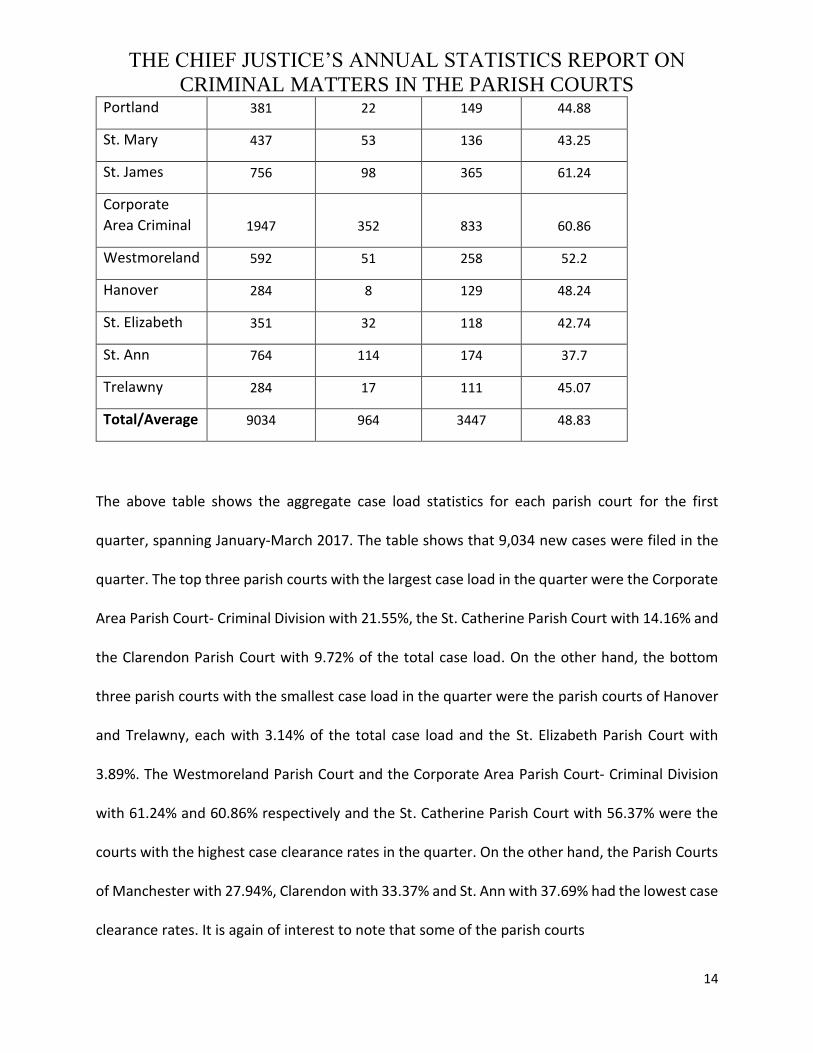
The above table shows the aggregate case load statistics for each parish court for the first
quarter, spanning January-March 2017. The table shows that 9,034 new cases were filed in the
quarter. The top three parish courts with the largest case load in the quarter were the Corporate
Area Parish Court- Criminal Division with 21.55%, the St. Catherine Parish Court with 14.16% and
the Clarendon Parish Court with 9.72% of the total case load. On the other hand, the bottom
three parish courts with the smallest case load in the quarter were the parish courts of Hanover
and Trelawny, each with 3.14% of the total case load and the St. Elizabeth Parish Court with
3.89%. The Westmoreland Parish Court and the Corporate Area Parish Court- Criminal Division
with 61.24% and 60.86% respectively and the St. Catherine Parish Court with 56.37% were the
courts with the highest case clearance rates in the quarter. On the other hand, the Parish Courts
of Manchester with 27.94%, Clarendon with 33.37% and St. Ann with 37.69% had the lowest case
clearance rates. It is again of interest to note that some of the parish courts

THE CHIEF JUSTICE’S ANNUAL STATISTICS REPORT ON
CRIMINAL MATTERS IN THE PARISH COURTS
15
with the larger caseloads also rank among those with the higher disposal rates. The overall
average clearance rate across all parish courts was approximately 48.88% during the quarter.
Table 1.0c: Aggregate case statistics for each Parish Court for 2017
Parish Court Number of
new cases
filed
Number of
inactive cases
Number of
disposed
cases
Case
Clearance
Rate (%)
Manchester 609 52 201 41.54
Clarendon 783 39 297 42.91
St. Catherine 1496 201 960 77.61
St. Thomas 399 26 217 60.9
Portland 377 61 144 54.38
St. Mary 280 53 176 81.79
St. James 659 155 325 72.84
Corporate
Area Criminal 1704 392 922 77.11
Westmoreland 534 106 357 86.7
Hanover 297 4 171 58.92
St. Elizabeth 300 32 135 55.67
St. Ann 625 148 205 56.48
Trelawny 363 17 204 60.88
Total/Gross 8426 1286 4314 66.46

THE CHIEF JUSTICE’S ANNUAL STATISTICS REPORT ON
CRIMINAL MATTERS IN THE PARISH COURTS
16
The above table shows the aggregate case load statistics for each parish court for the second
quarter, spanning April-June 2017. The table shows that 8426 new cases were filed in the quarter.
The top three parish courts with the largest case load in the quarter were the Corporate Area
Parish Court- Criminal Division with 20.22%, the St. Catherine Parish Court with 17.75% and the
Clarendon Parish Court with 9.29% of the total new case load. On the other hand, the bottom
three Parish courts with the smallest case load in the quarter were again the St. Mary Parish
Court with 3.32%, the Hanover Parish Court with 3.52% and the St. Elizabeth Parish Court with
3.56% of total new case load. The Westmoreland Parish Court and the St. Mary Parish Court with
86.70% and 81.78% respectively and the St. Catherine Parish Court with 77.60% were the courts
with the highest case clearance rates in the quarter. On the other hand, the parish courts of
Manchester with 41.54%, Clarendon with 42.29% and Portland with 54.38% had the lowest case
clearance rates. The overall average case clearance rate across all parish courts was
approximately 66.46% during the quarter.
Table 1.0c: Aggregate case statistics for each Parish Court for the third quarter of 2017
Parish Court Number of
new cases
filed
Number of
inactive cases
Number of
disposed
cases
Case
Clearance
Rate (%)
Manchester 637 75 257 52.12
Clarendon 537 39 165 37.99
St. Catherine 1075 179 808 91.81
St. Thomas 333 41 287 98.5
Portland 427 63 207 63.23

THE CHIEF JUSTICE’S ANNUAL STATISTICS REPORT ON
CRIMINAL MATTERS IN THE PARISH COURTS
17
St. Mary 354 54 212 75.14
St. James 855 144 566 83.04
Corporate
Area Criminal 1599 303 1014 82.36
Westmoreland 524 112 368 91.6
Hanover 292 7 247 86.99
St. Elizabeth 299 33 169 67.56
St. Ann 645 167 265 66.98
Trelawny 391 17 221 60.87
Total/Average 7968 1234 4786 75.55
The above table shows the aggregate case load statistics for each parish court for the third
quarter, spanning July-September 2017. The table shows that 7,968 cases were filed in the
quarter. The top three parish courts with the largest case load in the quarter were the Corporate
Area Court- Criminal Division with 20.07%, the St. Catherine Parish Court with 13.49% and the St.
James Parish Court with 10.73% of the total case load. On the other hand, the bottom three
parish courts with the smallest case load in the quarter were the Hanover Parish Court with
3.66%, the St. Elizabeth Parish Court with 3.75% and the St. Thomas Parish Court with 4.18% of
total case load. The St. Thomas Parish Court and the St. Catherine Parish Court with 98.49% and
91.81% respectively and the Westmoreland Parish Court with 91.60% were the courts with the
highest case clearance rates in the quarter. On the other hand, the parish courts of Clarendon
with 37.98%, Manchester with 52.11% and Trelawny with 60.86% had the lowest case clearance
rates. The overall average case clearance rate across all parish courts was approximately 75.55%
during the quarter.

THE CHIEF JUSTICE’S ANNUAL STATISTICS REPORT ON
CRIMINAL MATTERS IN THE PARISH COURTS
18
Table 1.0d: Aggregate case statistics for each Parish Court for the fourth quarter of 2017
Parish Court Number of
new cases
filed
Number of
inactive
cases
Number of
disposed
cases
Case
Clearance
Rate (%)
Manchester 474 365 253 130.38
Clarendon 502 39 145 36.65
St. Catherine 935 185 742 99.14
St. Thomas 290 26 259 98.28
Portland 281 70 238 109.61
St. Mary 287 54 192 85.71
St. James 1054 212 820 97.91
Corporate
Area Criminal 1378 462 815 92.67
Westmoreland 456 78 428 110.96
Hanover 204 8 216 109.8
St. Elizabeth 252 33 205 94.44
St. Ann 304 139 202 112.17
Trelawny 254 17 154 67.32
Total/Average 6671 1688 4669 95.29
The above table shows the aggregate case load statistics for each parish court for the fourth
quarter, spanning from October-December 2017. The table shows that 6671 cases were filed in
the quarter. The top three parish courts with the largest case load in the quarter were the
Corporate Area Court- Criminal Division, the St. James Parish Court and the St. Catherine Parish
Court with 20.66%, 15.80% and 14.02% of the total case load respectively. On the other hand,
THE CHIEF JUSTICE’S ANNUAL STATISTICS REPORT ON
CRIMINAL MATTERS IN THE PARISH COURTS
19
the bottom three parish courts with the smallest case load in the quarter were the Hanover Parish
Court with 3.06%, the St. Elizabeth Parish Court with 3.78% and the Trelawny Parish with 3.81%
of total case load. The Manchester Parish Court and the St. Ann Parish Court with 130.16% and
112.17% respectively and the Westmoreland Parish Court with 110.96% were the courts with the
highest case clearance rates in the quarter. On the other hand, the parish courts of Clarendon
with 36.65%, Trelawny with 67.32% and St. Mary with 85.71% had the lowest case clearance
rates. The overall average case clearance rate across all Parish Courts was approximately 95.29%
during the quarter.
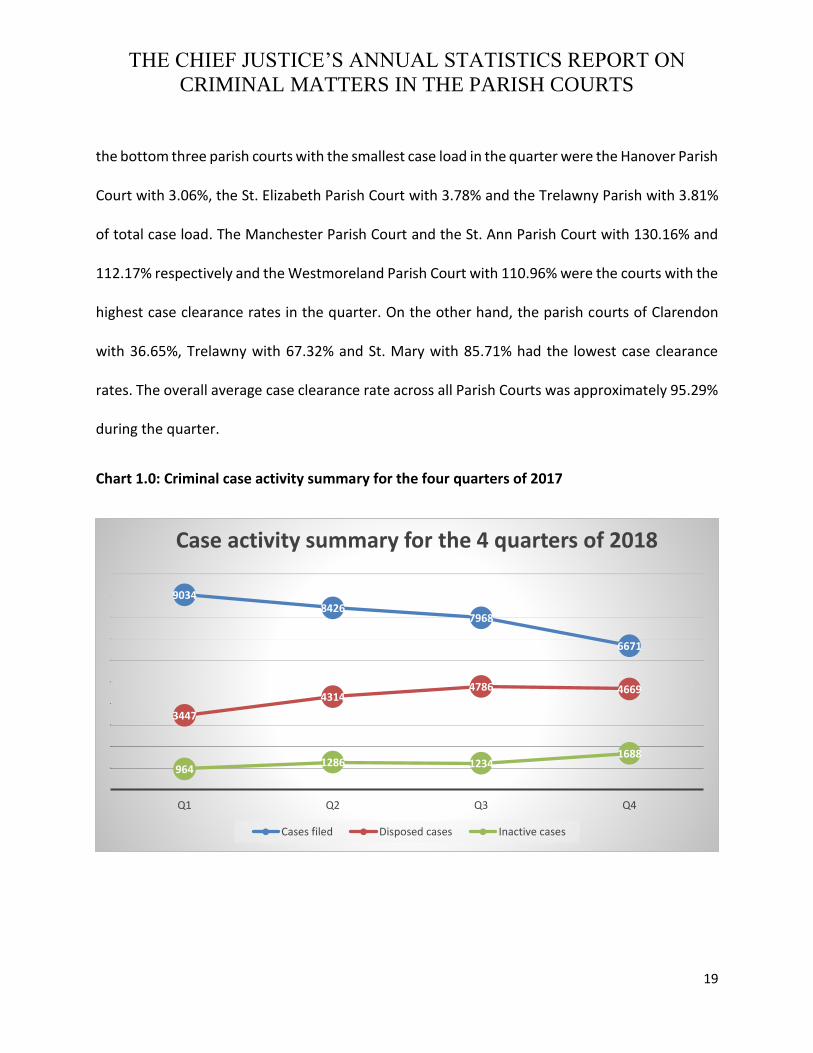
Chart 1.0: Criminal case activity summary for the four quarters of 2017
90348426
7968
6671
3447
43144786 4669
9641286 1234
1688
Q1 Q2 Q3 Q4
Case activity summary for the 4 quarters of 2018
Cases filed Disposed cases Inactive cases

THE CHIEF JUSTICE’S ANNUAL STATISTICS REPORT ON
CRIMINAL MATTERS IN THE PARISH COURTS
20
The above chart summarizes the number of new cases filed, disposed and inactive across the four
quarters of 2017. It is seen that the number of new cases filed throughout the year experienced
a consistent decline across the four quarters, with the highest number recorded in the first
quarter. The number of cases disposed however showed an increasing trend over the first three
quarters, with a particularly sharp rise seen between the first and second quarters. A slight
decline occurred between the third and fourth quarters. The number of inactive cases saw a
sharp increase between the first and second quarters and remained relatively stable in the fourth
quarter, before rising sharply in 2017.
Table 2.0: Average monthly case statistics for each Parish Court for 2017
Parish Court Total
number of
cases
Number of
cases
inactive
Number of
cases
disposed
Active
pending
case load
Case
disposal rate
Manchester 196 44 71 81 58.54
Clarendon 225 13 72 140 37.66
St. Catherine 399 58 259 82 79.33
St. Thomas 123 9 79 35 71.72
Portland 122 18 62 43 65.08
St. Mary 113 18 60 36 68.48
St. James 277 51 173 53 80.78
Corporate
Area Criminal 552 126 299 128 76.84
Westmoreland 176 29 118 29 83.52
Hanover 90 2 64 24 73.35
St. Elizabeth 100 11 52 37 62.98

THE CHIEF JUSTICE’S ANNUAL STATISTICS REPORT ON
CRIMINAL MATTERS IN THE PARISH COURTS
21
St. Ann 208 50 78 81 61.28
Trelawny 108 6 58 45 58.67
Total/Gross 2689 433 1442 813 69.75
*** The averages are calculated using table 1:0a and are approximations.
The above table shows the average monthly case load statistics for each parish court for the 2017
calendar year. The Corporate Area Parish Court-Criminal Division and St. Catherine Parish Court
with 552 and 399 cases respectively and the St. James Parish Court with 277, had the highest
average monthly case load during the year. Similarly, the three courts with the lowest average
monthly case load are the parish courts of Hanover and St. Elizabeth with 90 and 100 cases
respectively and the Trelawny Parish Court with 108 cases.
Case Types
Table 3.0a: Types of charges for each Parish Court for 2017
Case Types
Parish Court Indictment
Petty
Sessions
Committal
Proceedings
Summary
Matters Traffic Tax
Miscellaneou
s LRF NS Total
Manchester 1469 946 368 780 0 216 0 40 0 3819
Clarendon 1321 670 351 1440 0 0 0 0 24 3806
St. Catherine 2278 1013 608 3042 0 152 1 0 0 7094
St. Thomas 781 236 243 798 0 46 0 0 0 2104
Portland 971 321 87 655 0 0 0 0 2 2036
St. Mary 898 321 334 302 0 66 1 0 0 1922
St. James 1341 617 192 2721 0 0 211 0 0 5082
Corporate Area
Criminal 4379 1564 734 4822 82 0 0 0 16 11597
Westmoreland 1044 405 356 976 0 148 2 0 0 2931
Hanover 683 272 126 447 0 0 0 0 3 1531
St. Elizabeth 833 219 195 421 7 134 0 17 0 1826
THE CHIEF JUSTICE’S ANNUAL STATISTICS REPORT ON
CRIMINAL MATTERS IN THE PARISH COURTS
22
St. Ann 1306 747 286 1004 0 313 0 0 0 2656
Trelawny 762 338 149 670 0 0 10 0 0 1929
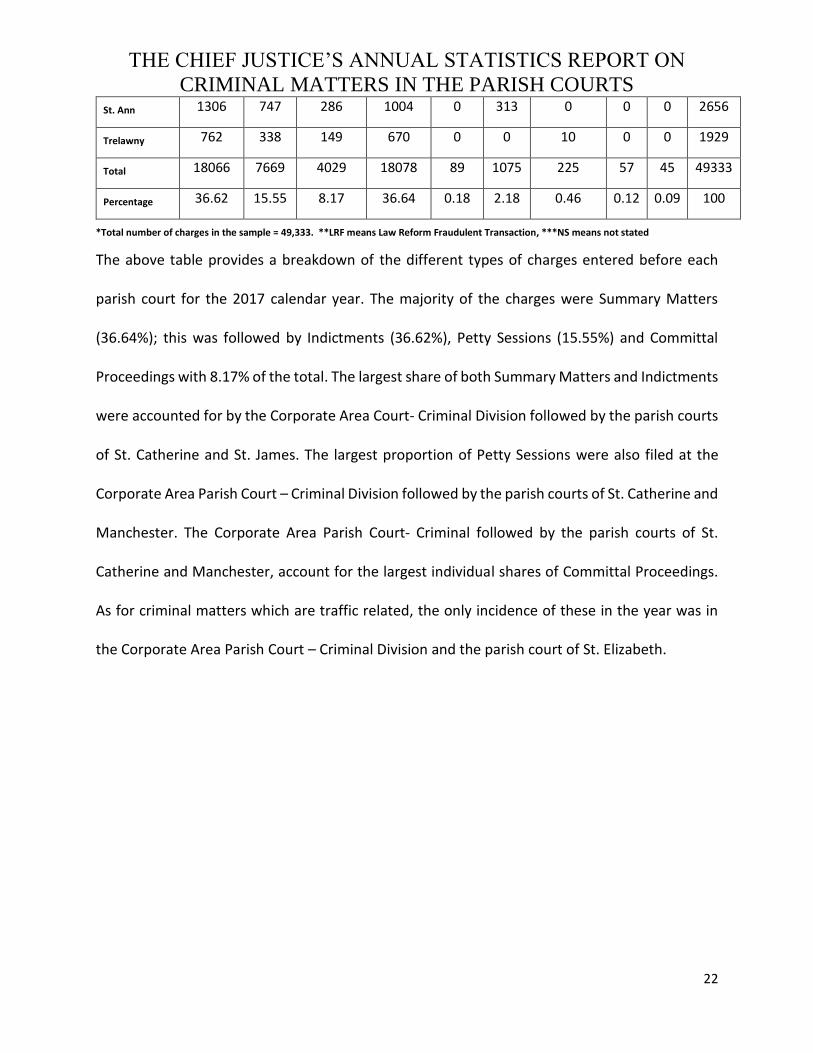
Total 18066 7669 4029 18078 89 1075 225 57 45 49333
Percentage 36.62 15.55 8.17 36.64 0.18 2.18 0.46 0.12 0.09 100
*Total number of charges in the sample = 49,333. **LRF means Law Reform Fraudulent Transaction, ***NS means not stated
The above table provides a breakdown of the different types of charges entered before each
parish court for the 2017 calendar year. The majority of the charges were Summary Matters
(36.64%); this was followed by Indictments (36.62%), Petty Sessions (15.55%) and Committal
Proceedings with 8.17% of the total. The largest share of both Summary Matters and Indictments
were accounted for by the Corporate Area Court- Criminal Division followed by the parish courts
of St. Catherine and St. James. The largest proportion of Petty Sessions were also filed at the
Corporate Area Parish Court – Criminal Division followed by the parish courts of St. Catherine and
Manchester. The Corporate Area Parish Court- Criminal followed by the parish courts of St.
Catherine and Manchester, account for the largest individual shares of Committal Proceedings.
As for criminal matters which are traffic related, the only incidence of these in the year was in
the Corporate Area Parish Court – Criminal Division and the parish court of St. Elizabeth.
THE CHIEF JUSTICE’S ANNUAL STATISTICS REPORT ON
CRIMINAL MATTERS IN THE PARISH COURTS
23
Offence Types
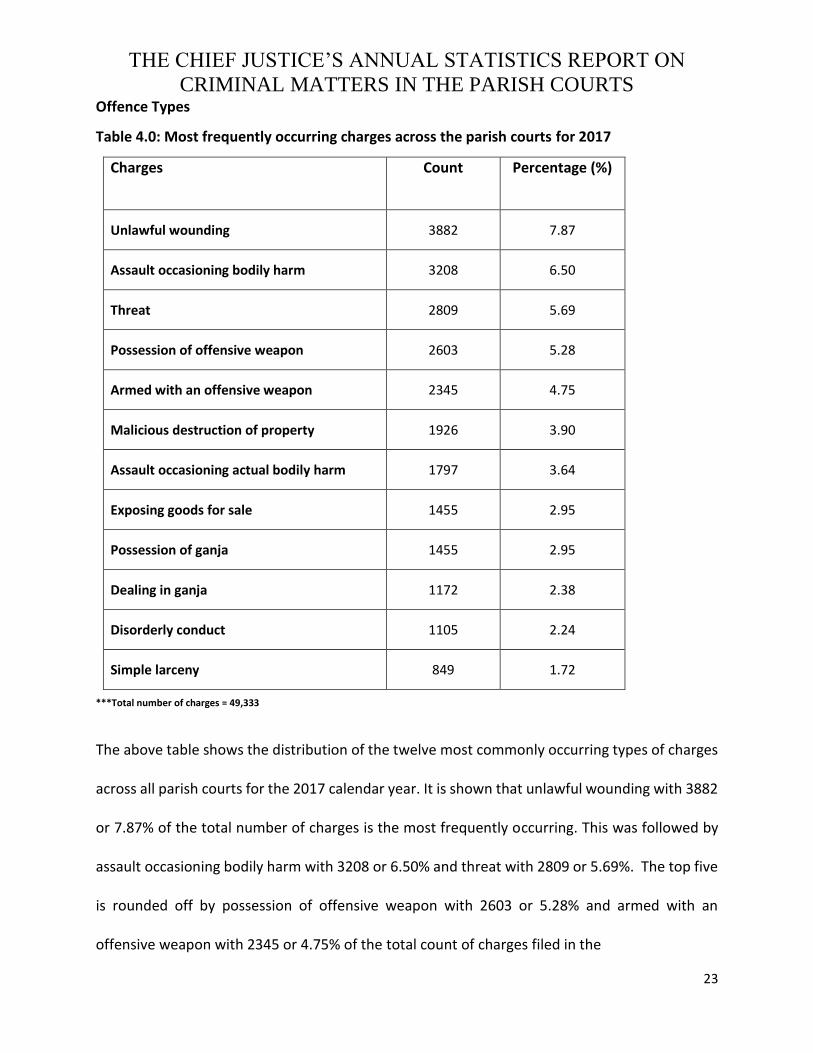
Table 4.0: Most frequently occurring charges across the parish courts for 2017
Charges Count Percentage (%)
Unlawful wounding 3882 7.87
Assault occasioning bodily harm 3208 6.50
Threat 2809 5.69
Possession of offensive weapon 2603 5.28
Armed with an offensive weapon 2345 4.75
Malicious destruction of property 1926 3.90
Assault occasioning actual bodily harm 1797 3.64
Exposing goods for sale 1455 2.95
Possession of ganja 1455 2.95
Dealing in ganja 1172 2.38
Disorderly conduct 1105 2.24
Simple larceny 849 1.72
***Total number of charges = 49,333
The above table shows the distribution of the twelve most commonly occurring types of charges
across all parish courts for the 2017 calendar year. It is shown that unlawful wounding with 3882
or 7.87% of the total number of charges is the most frequently occurring. This was followed by
assault occasioning bodily harm with 3208 or 6.50% and threat with 2809 or 5.69%. The top five
is rounded off by possession of offensive weapon with 2603 or 5.28% and armed with an
offensive weapon with 2345 or 4.75% of the total count of charges filed in the
THE CHIEF JUSTICE’S ANNUAL STATISTICS REPORT ON
CRIMINAL MATTERS IN THE PARISH COURTS
24
parish courts during the calendar. These twelve most frequently occurring types of charges
account for approximately 50% of the total incidence of charges in 2017.
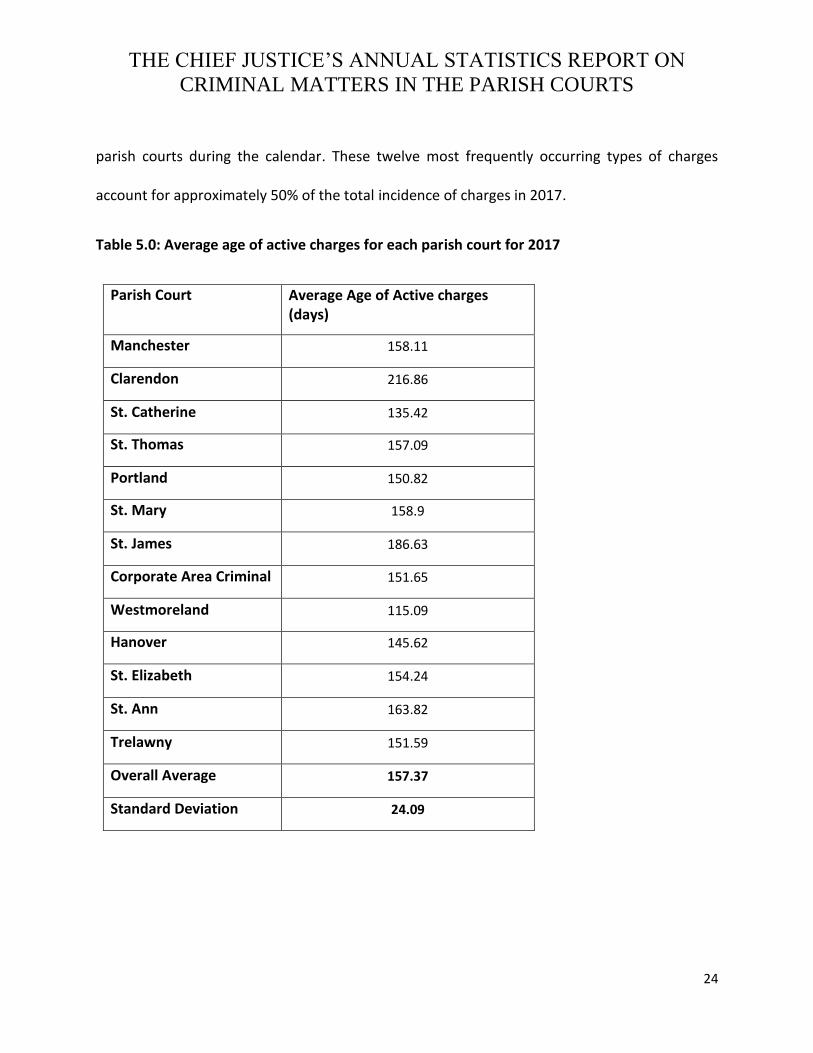
Table 5.0: Average age of active charges for each parish court for 2017
Parish Court Average Age of Active charges (days)
Manchester 158.11
Clarendon 216.86
St. Catherine 135.42
St. Thomas 157.09
Portland 150.82
St. Mary 158.9
St. James 186.63
Corporate Area Criminal 151.65
Westmoreland 115.09
Hanover 145.62
St. Elizabeth 154.24
St. Ann 163.82
Trelawny 151.59
Overall Average 157.37
Standard Deviation 24.09

THE CHIEF JUSTICE’S ANNUAL STATISTICS REPORT ON
CRIMINAL MATTERS IN THE PARISH COURTS
25
The above table shows that the average age of active charges for each parish court as at the end
of 2017, for cases originating in said year. The parish courts of Clarendon, St. James, St. Mary
and Manchester rank highest on the list. On the contrary, the lowest outcomes were observed
for in the parish courts of Westmoreland, St. Catherine, Hanover and St. James.
Table 5.0: Average age of disposed charges for each parish court for 2017
Parish Court Average Age of Disposed charges (days)
Manchester 104.83
Clarendon 92.26
St. Catherine 90.18
St. Thomas 91.46
Portland 98.03
St. Mary 87.23
St. James 74.82
Corporate Area
Criminal 73.99
Westmoreland 78.90
Hanover 77.48
St. Elizabeth 90.07
St. Ann 96.55
Trelawny 81.02
Overall Average 87.44
Standard Deviation 9.60
THE CHIEF JUSTICE’S ANNUAL STATISTICS REPORT ON
CRIMINAL MATTERS IN THE PARISH COURTS
26
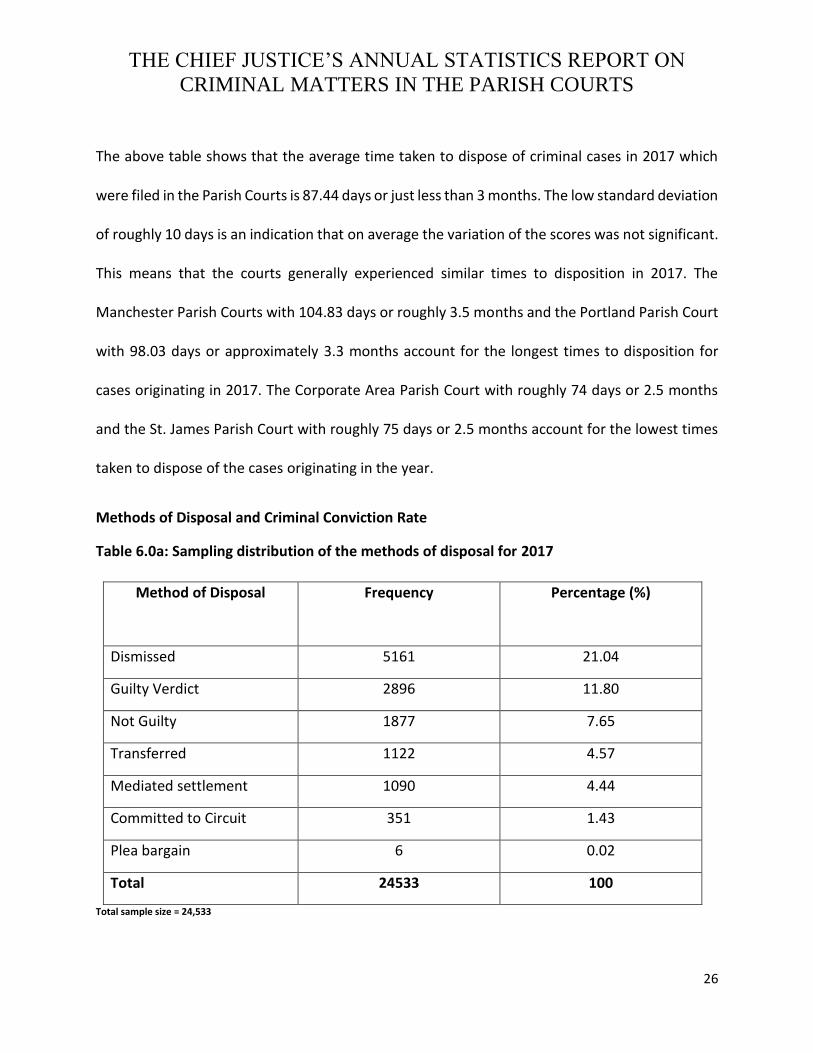
The above table shows that the average time taken to dispose of criminal cases in 2017 which
were filed in the Parish Courts is 87.44 days or just less than 3 months. The low standard deviation
of roughly 10 days is an indication that on average the variation of the scores was not significant.
This means that the courts generally experienced similar times to disposition in 2017. The
Manchester Parish Courts with 104.83 days or roughly 3.5 months and the Portland Parish Court
with 98.03 days or approximately 3.3 months account for the longest times to disposition for
cases originating in 2017. The Corporate Area Parish Court with roughly 74 days or 2.5 months
and the St. James Parish Court with roughly 75 days or 2.5 months account for the lowest times
taken to dispose of the cases originating in the year.
Methods of Disposal and Criminal Conviction Rate
Table 6.0a: Sampling distribution of the methods of disposal for 2017
Method of Disposal
Frequency Percentage (%)
Dismissed 5161 21.04
Guilty Verdict 2896 11.80
Not Guilty 1877 7.65
Transferred 1122 4.57
Mediated settlement 1090 4.44
Committed to Circuit 351 1.43
Plea bargain 6 0.02
Total 24533 100
Total sample size = 24,533
THE CHIEF JUSTICE’S ANNUAL STATISTICS REPORT ON
CRIMINAL MATTERS IN THE PARISH COURTS
27
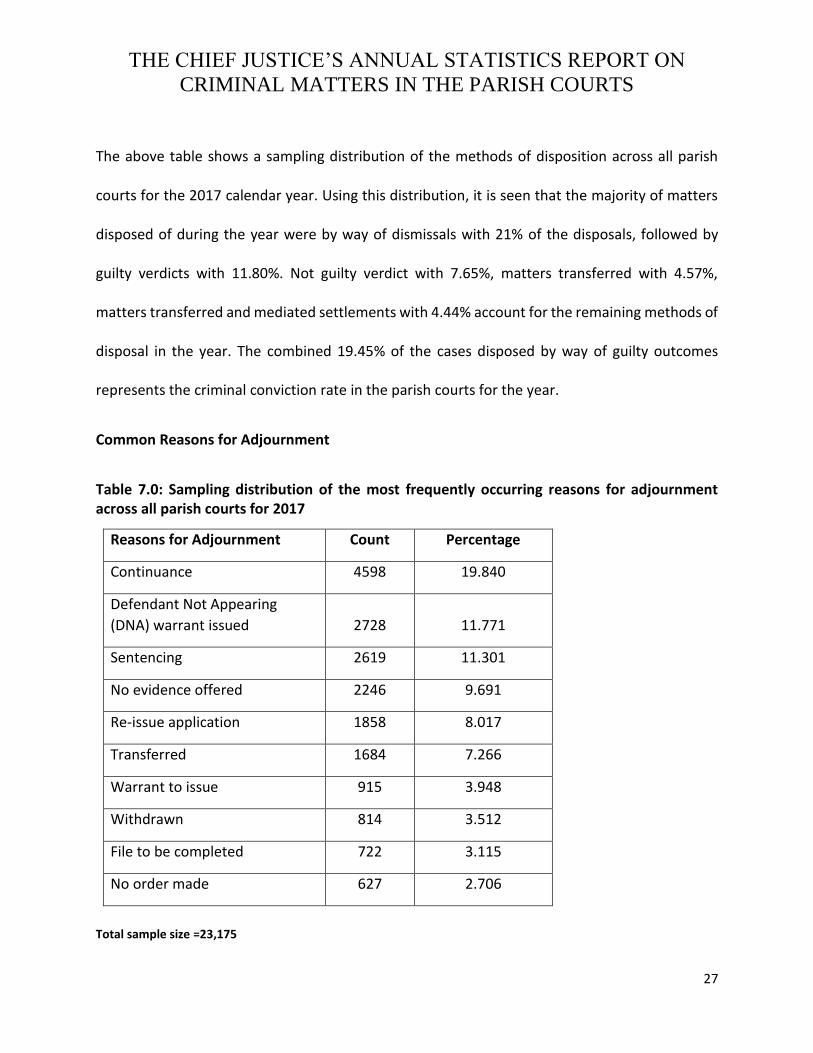
The above table shows a sampling distribution of the methods of disposition across all parish
courts for the 2017 calendar year. Using this distribution, it is seen that the majority of matters
disposed of during the year were by way of dismissals with 21% of the disposals, followed by
guilty verdicts with 11.80%. Not guilty verdict with 7.65%, matters transferred with 4.57%,
matters transferred and mediated settlements with 4.44% account for the remaining methods of
disposal in the year. The combined 19.45% of the cases disposed by way of guilty outcomes
represents the criminal conviction rate in the parish courts for the year.
Common Reasons for Adjournment
Table 7.0: Sampling distribution of the most frequently occurring reasons for adjournment across all parish courts for 2017
Reasons for Adjournment Count Percentage
Continuance 4598 19.840
Defendant Not Appearing
(DNA) warrant issued 2728 11.771
Sentencing 2619 11.301
No evidence offered 2246 9.691
Re-issue application 1858 8.017
Transferred 1684 7.266
Warrant to issue 915 3.948
Withdrawn 814 3.512
File to be completed 722 3.115
No order made 627 2.706
Total sample size =23,175

THE CHIEF JUSTICE’S ANNUAL STATISTICS REPORT ON
CRIMINAL MATTERS IN THE PARISH COURTS
28
The above table shows that from a sample of 23,175 adjournments in the 2017 calendar year,
the majority 19.84% were as a result of matters part-heard which were therefore adjourned for
continuance. Matters adjourned due to DNA warrant issued (non-appearance of the accused)
with 11.77% and matters adjourned due to sentencing with 11.30% of the sample rounds off the
top three reasons for adjournment during the year. Adjournments due to no evidence offered
with 9.69% of the sample and re-issued applications with 8.01% complete the top five reasons
for adjournment for the year.
Table 8.0: Clearance rates for charges filed in the parish courts in 2017
Parish Court Clearance rate (%) Manchester 62.99
Clarendon 37.73
St. Catherine 81.23
St. Thomas 75.5
Portland 68.02
St. Mary 71.47
St. James 78.75
Corporate Area Criminal 76.25
Westmoreland 85.36
Hanover 75.98
St. Elizabeth 65.1
St. Ann 68.33
Trelawny 58.53
Overall average clearance rate 71.53
THE CHIEF JUSTICE’S ANNUAL STATISTICS REPORT ON
CRIMINAL MATTERS IN THE PARISH COURTS
29
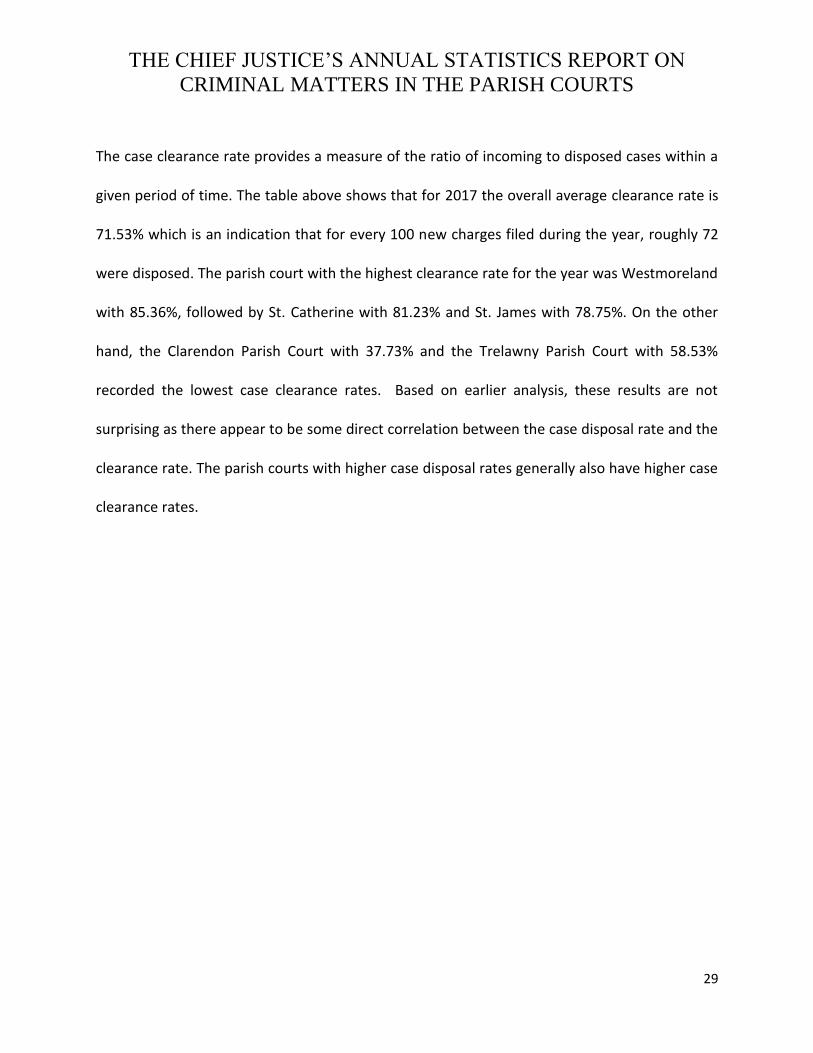
The case clearance rate provides a measure of the ratio of incoming to disposed cases within a
given period of time. The table above shows that for 2017 the overall average clearance rate is
71.53% which is an indication that for every 100 new charges filed during the year, roughly 72
were disposed. The parish court with the highest clearance rate for the year was Westmoreland
with 85.36%, followed by St. Catherine with 81.23% and St. James with 78.75%. On the other
hand, the Clarendon Parish Court with 37.73% and the Trelawny Parish Court with 58.53%
recorded the lowest case clearance rates. Based on earlier analysis, these results are not
surprising as there appear to be some direct correlation between the case disposal rate and the
clearance rate. The parish courts with higher case disposal rates generally also have higher case
clearance rates.

THE CHIEF JUSTICE’S ANNUAL STATISTICS REPORT ON
CRIMINAL MATTERS IN THE PARISH COURTS
30
Chapter 2.0: Criminal Case Demographics in the Parish Courts in 2017
Chart 1.0: Aggregate age distribution of offenders for all parish courts for 2017
The chart above shows the aggregate age distribution of offenders for all parish courts for the
2017 calendar year. The majority of the offenders were between the ages 18 and 26 and the ages
of 27 and 36 years, accounting for 31% and 27% respectively of the total number of offences
filed. This is followed by the age category of 37-50 years old with 22.55%, 17 years and younger
with 9.7% and the oldest age group of 51 years and older accounted for the smallest proportion
with 9.4% of the offenders.

THE CHIEF JUSTICE’S ANNUAL STATISTICS REPORT ON
CRIMINAL MATTERS IN THE PARISH COURTS
31
Chart 2.0: Aggregate gender distribution of offenders for all parish courts for 2017
The above chart shows the gender distribution of offender for all parish courts for the year ended
December 31, 2017. As shown, the majority of the offenders were males accounting for 80.43%
of the total while female offenders account for the remaining 19.57% of the cases brought before
the courts.
0.00
10.00
20.00
30.00
40.00
50.00
60.00
70.00
80.00
90.00
FEMALE MALE
19.57
80.43

THE CHIEF JUSTICE’S ANNUAL STATISTICS REPORT ON
CRIMINAL MATTERS IN THE PARISH COURTS
32
Table 9.0: Sampling distribution of the most frequently occurring charges by gender for 2017
Male Female Total
Charge Count % Count % Count %
Unlawful wounding 2998 77.49 871 22.51 3869 100.00%
Assault occasioning bodily harm 2431 75.68 781 24.32 3212 100.00%
Threat 2108 76.49 648 23.51 2756 100.00%
Possession of offensive weapon 2415 92.96 183 7.04 2598 100.00%
Armed with an offensive weapon 2210 94.69 124 5.31 2334 100.00%
Malicious destruction of property 1484 77.33 435 22.67 1919 100.00%
Assault occasioning actual bodily harm 1289 71.89 504 28.11 1793 100.00%
Possession of ganja 1212 83.07 247 16.93 1459 100.00%
Exposing goods for sale 869 72.06 337 27.94 1206 100.00%
Dealing in ganja 967 82.23 209 17.77 1176 100.00%
Disorderly conduct 708 64.42 391 35.58 1099 100.00%
Assault at common law 698 86.17 112 13.83 810 100.00%
Indecent language 572 75.46 186 24.54 758 100.00%
***The gender of offenders was not available for every matter that was filed in the parish courts
The above table provides a sampling distribution of the most frequently occurring charges by
gender in the 2017 calendar year. Based on the data shown in chart 2.0, it is not surprising that
males account for the dominant proportion of all these charges. Among the offences listed with
the greatest imbalance in the gender distribution are armed with an offensive weapon and
possession of offensive weapon for which over 90% of the offenders were male. Disorderly
conduct, assault occasioning bodily harm and exposing goods for sale saw the highest incidence
of female involvement among the offences which appeared most frequently.

THE CHIEF JUSTICE’S ANNUAL STATISTICS REPORT ON
CRIMINAL MATTERS IN THE PARISH COURTS
33
Sampling distribution of offences by police station for all parish courts for 2017
A series of charts are displayed below for the 2017 calendar year which provides the distribution
of criminal charges based on the police stations at which the matters were reported in each
parish.
Chart 3a: Distribution of criminal offences by the police station of origin at the Corporate
Area Criminal Court
The above chart shows the distribution of crimes at the Corporate Area Parish Court - Criminal
Division using the police stations at which the matters were reported. The data available from a
total of 11,107 records indicate that for the 2017 calendar year the majority of criminal matters,
15.49%, which were brought before the Court, were reported at S.A.C. This was followed by the
Kingston Central Police Station which accounts for 12.85% of total matters reported. The top
three was rounded off by the S.A.N Police Station with 9.23%. This data provides important
insights into the geographical distribution of criminal offences committed in the parish.
0.00
2.00
4.00
6.00
8.00
10.00
12.00
14.00
16.0015.49
12.85
9.238.29
7.456.71
5.01 4.944.25 3.78
2.94 2.73 2.49 2.48 2.38

THE CHIEF JUSTICE’S ANNUAL STATISTICS REPORT ON
CRIMINAL MATTERS IN THE PARISH COURTS
34
Chart 3b: Distribution of criminal charges by the police station of origin at the St. James
Parish Court
The above chart shows the distribution of crimes in the parish of St. James using the police
stations at which the matters were reported. The data available from a total of 2901 records
indicate that for the 2017 calendar year, the majority of criminal matters, 40.57%, which were
brought before the St. James Parish Court, were reported in Barnett Street. This was followed by
the Montego Bay Police Station which accounts for 9.31% of total matters reported. The top
three was rounded off by the Saint James Municipal Police Station with 5.65%. This data provides
important insights into the geographical distribution of criminal offences committed in the
parish.
0.005.00
10.0015.0020.0025.0030.0035.0040.0045.00 40.57
9.315.65 4.17 3.21 3.21 2.76 2.76 2.45 2.45 2.24 2.17 2.14
THE CHIEF JUSTICE’S ANNUAL STATISTICS REPORT ON
CRIMINAL MATTERS IN THE PARISH COURTS
35
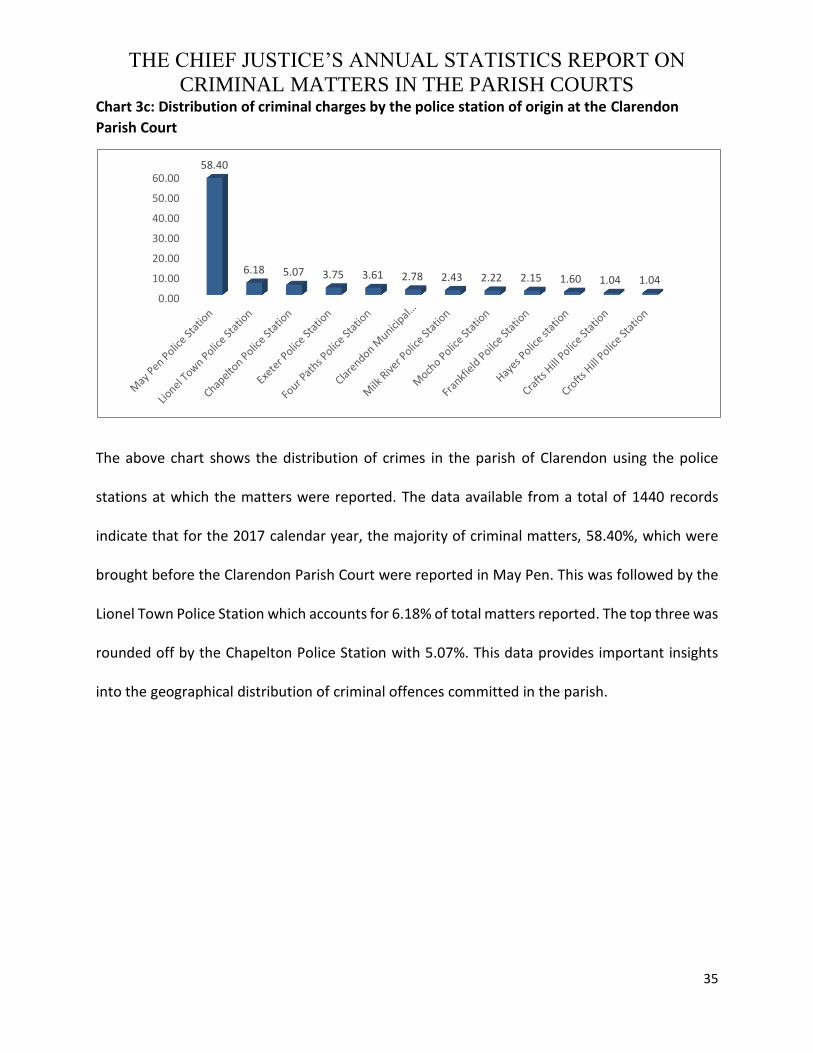
Chart 3c: Distribution of criminal charges by the police station of origin at the Clarendon
Parish Court
The above chart shows the distribution of crimes in the parish of Clarendon using the police
stations at which the matters were reported. The data available from a total of 1440 records
indicate that for the 2017 calendar year, the majority of criminal matters, 58.40%, which were
brought before the Clarendon Parish Court were reported in May Pen. This was followed by the
Lionel Town Police Station which accounts for 6.18% of total matters reported. The top three was
rounded off by the Chapelton Police Station with 5.07%. This data provides important insights
into the geographical distribution of criminal offences committed in the parish.
0.00
10.00
20.00
30.00
40.00
50.00
60.0058.40
6.18 5.07 3.75 3.61 2.78 2.43 2.22 2.15 1.60 1.04 1.04

THE CHIEF JUSTICE’S ANNUAL STATISTICS REPORT ON
CRIMINAL MATTERS IN THE PARISH COURTS
36
Chart 3d: Distribution of criminal charges by the police station of origin at the Trelawny
Parish Court
The above chart shows the distribution of crimes in the parish of Trelawny using the police
stations at which the matters were reported. The data available from a total of 576 records
indicate that for the 2017 calendar year the majority of criminal matters, 43.92%, which were
brought before the Trelawny Parish Court, were reported in Falmouth. This was followed by the
Clarks Town Police Station which accounts for 7.64% of total matters reported. The top three was
rounded off by the Wait-A-Bit Police Station with 6.94%. This data provides important insights
into the geographical distribution of criminal offences committed in the parish.
0.00
5.00
10.00
15.00
20.00
25.00
30.00
35.00
40.00
45.0043.92
7.64 6.94 6.25 6.08 5.56 5.21 4.341.91 1.74 1.56 1.56 1.39 1.04

THE CHIEF JUSTICE’S ANNUAL STATISTICS REPORT ON
CRIMINAL MATTERS IN THE PARISH COURTS
37
Chart 3e: Distribution of criminal charges by the police station of origin at the Westmoreland Parish Court
The above chart shows the distribution of crimes in the parish of Westmoreland using the police
stations at which the matters were reported. The data available from a total of 1944 records
indicate that for the 2017 calendar year the majority of criminal matters, 27.62%, which were
brought before the Westmoreland Parish Court, were reported at the Savanna- La-Mar Police
Station. This was followed by the Negril Police Station which accounts for 27.31% of total matters
reported. The top three was rounded off by the Whithorn Police Station with 7.77%. This data
provides important insights into the geographical distribution of criminal offences committed in
the parish.
0.00
5.00
10.00
15.00
20.00
25.00
30.0027.62 27.31
7.775.81 5.30 4.42 4.37 3.96 3.19 2.06 1.90 1.03

THE CHIEF JUSTICE’S ANNUAL STATISTICS REPORT ON
CRIMINAL MATTERS IN THE PARISH COURTS
38
Chart 3f: Distribution of criminal charges by the police station of origin at the St. Elizabeth
Parish Court
The above chart shows the distribution of crimes in the parish of St. Elizabeth using the police
stations at which the matters were reported. The data available from a total of 1456 records
indicate that for the 2017 calendar year the majority of criminal matters, 30.22%, which were
brought before the St. Elizabeth Parish Court, were reported in Black River. This was followed by
the Santa Cruz Police Station which accounts for 18.48% of total matters reported. The top three
was rounded off by the Junction Police Station with 9.20%. This data provides important insights
into the geographical distribution of criminal offences committed in the parish.
0.00
5.00
10.00
15.00
20.00
25.00
30.00
35.0030.22
18.48
9.207.69 7.62
5.29 5.08 4.40 3.85 3.502.13 1.03

THE CHIEF JUSTICE’S ANNUAL STATISTICS REPORT ON
CRIMINAL MATTERS IN THE PARISH COURTS
39
Chart 3g: Distribution of criminal charges by the police station of origin at the St. Mary Parish
Court
The above chart shows the distribution of crimes in the parish of St. Mary using the police stations
at which the matters were reported. The data available from a total of 1559 records indicate that
for the 2017 calendar year the majority of criminal matters, 36.88%, which were brought before
the St. Mary Parish Court, were reported in Port Maria. This was followed by the Annotto Bay
Police Station which accounts for 11.29% of total matters reported. The top three was rounded
off by the Highgate Police Station with 9.36%. This data provides important insights into the
geographical distribution of criminal offences committed in the parish.
0.00
5.00
10.00
15.00
20.00
25.00
30.00
35.00
40.00 36.88
11.299.36
6.80 5.32 5.32 4.55 4.43 4.04 2.63 2.37 2.31 1.54 1.22

THE CHIEF JUSTICE’S ANNUAL STATISTICS REPORT ON
CRIMINAL MATTERS IN THE PARISH COURTS
40
Chart 3h: Distribution of criminal offences by the police station of origin at the Hanover Parish Court
The above chart shows the distribution of crimes in the parish of Hanover using the police
stations at which the matters were reported. The data available from a total of 1204 records
indicate that for the 2017 calendar year, the majority of criminal matters, 28.07%, which were
brought before the Hanover Parish Court, were reported in Lucea. This was followed by the Green
Island Police Station which accounts for 21.26% of total matters reported. The top three was
rounded off by the Sandy Bay with 15.95%. This data provides important insights into the
geographical distribution of criminal offences committed in the parish.
0.00
5.00
10.00
15.00
20.00
25.00
30.0028.07
21.26
15.95
11.549.05
5.90
2.16 1.41 1.16

THE CHIEF JUSTICE’S ANNUAL STATISTICS REPORT ON
CRIMINAL MATTERS IN THE PARISH COURTS
41
Chart 3i: Distribution of criminal offences by the police station of origin at the St. Catherine
Parish Court
The above chart shows the distribution of crimes in the parish of St. Catherine using the police
stations at which the matters were reported. The data available from a total of 6354 records
indicate that for the 2017 calendar year the majority of criminal matters, 24.55%, which were
brought before the St. Catherine Parish Courts, were reported in Spanish Town. This was followed
by the Linstead Police Station which accounts for 18.56% of total matters reported and the
Portmore Police Station with 7.18%. This data provides important insights into the geographical
distribution of criminal offences committed in the parish.
0.00
5.00
10.00
15.00
20.00
25.0024.55
18.56
7.18 6.67 5.46 4.42 4.12 3.31 2.25 2.20 1.76 1.73 1.57

THE CHIEF JUSTICE’S ANNUAL STATISTICS REPORT ON
CRIMINAL MATTERS IN THE PARISH COURTS
42
Chart 3j: Distribution of criminal offences by the police station of origin at the Manchester
Parish Court
The above chart shows the distribution of crimes in the parish of Manchester using the police stations at
which the matters were reported. The data available from a total of 3144 records indicate that for the
2017 calendar year the majority of criminal matters, 34.67%, which were brought before the Manchester
Parish courts, were reported in Mandeville. This was followed by the Parish Council which accounts for
13.49% of total matters reported and the Christiana Police Station with 10.59%. This data provides
important insights into the geographical distribution of criminal offences committed in the parish.
0.00
5.00
10.00
15.00
20.00
25.00
30.00
35.0034.67
13.4910.59
7.734.64 4.36 3.50 3.05 3.02 2.93 1.91 1.65 1.21 1.18

THE CHIEF JUSTICE’S ANNUAL STATISTICS REPORT ON
CRIMINAL MATTERS IN THE PARISH COURTS
43
Chart 3k: Distribution of criminal charges by the police station of origin at the Portland Parish
Court
The above chart shows the distribution of crimes in the parish of Portland using the police stations at
which the matters were reported. The data available from a total of 1332 records indicate that for the
2017 calendar year, the majority of criminal matters, 36.94% of which were brought before the Portland
Parish Court were reported at the Port Antonio Police Station. This was followed by the Buff Bay Police
Station which accounts for 22.82% of total matters reported and the Hope Bay Police Station with 9.53%.
This data provides important insights into the geographical distribution of criminal offences committed in
the parish.
0.00
5.00
10.00
15.00
20.00
25.00
30.00
35.00
40.0036.94
22.82
9.53 9.167.21
4.95 3.53 2.93 1.58

THE CHIEF JUSTICE’S ANNUAL STATISTICS REPORT ON
CRIMINAL MATTERS IN THE PARISH COURTS
44
Chart 3l: Distribution of Criminal Offences by the Police station of Origin at the St. Thomas
Parish Court
The above chart shows the distribution of crimes in the parish St. Thomas using the police stations
at which the matters were reported. The data available from a total of 1816 records indicate that
for the 2017 calendar year, the majority of criminal matters, 58.92%, which were brought before
the St. Thomas Parish Court, were reported in Mordant Bay. This was followed by the Dallas
Police Station which accounts for 10.24% of total matters reported and the Golden Grove Police
Station with 6%. This data provides important insights into the geographical distribution of
criminal offences committed in the parish.
0.00
10.00
20.00
30.00
40.00
50.00
60.00
MorantBay
Yallahs GoldenGrove
Seaforth PortMorant
Bath Trinityville GoldenGrove,Bath &
PortMorant
Llandewey
58.92
10.246.00 6.00 4.90 3.41 2.20 1.76 1.49
THE CHIEF JUSTICE’S ANNUAL STATISTICS REPORT ON
CRIMINAL MATTERS IN THE PARISH COURTS
45
Chart 3m: Distribution of criminal charges by the police station of origin at the St. Ann Parish
Court
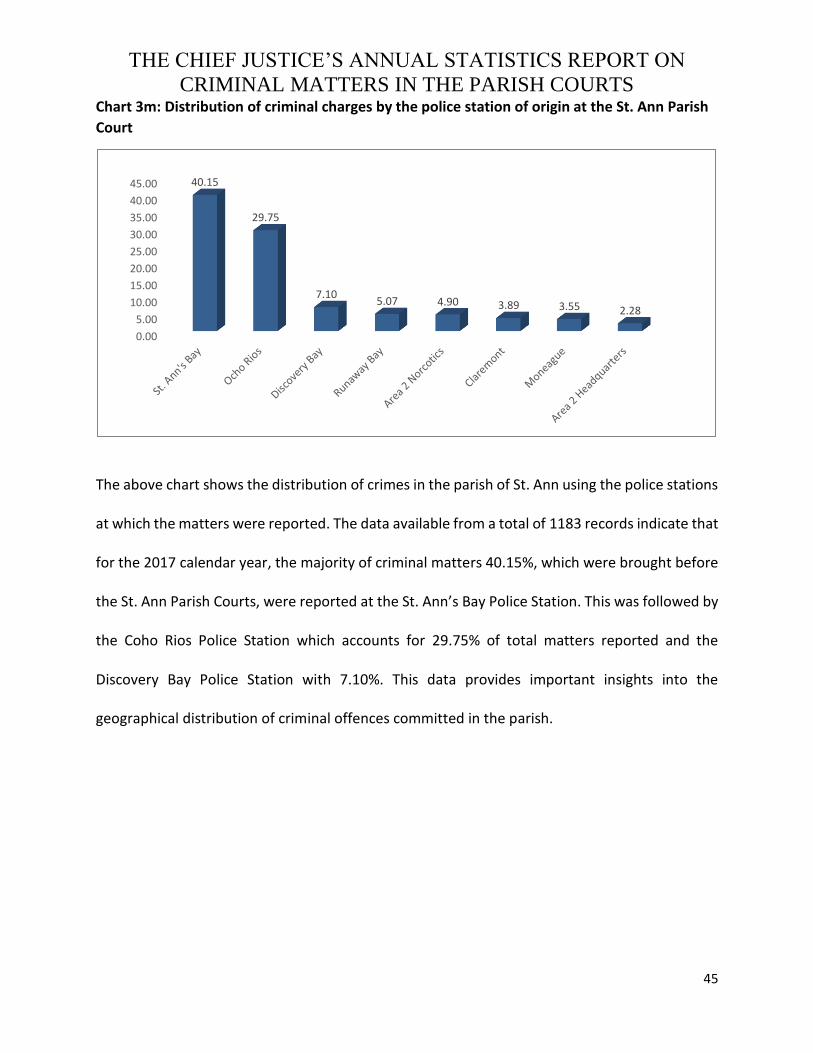
The above chart shows the distribution of crimes in the parish of St. Ann using the police stations
at which the matters were reported. The data available from a total of 1183 records indicate that
for the 2017 calendar year, the majority of criminal matters 40.15%, which were brought before
the St. Ann Parish Courts, were reported at the St. Ann’s Bay Police Station. This was followed by
the Coho Rios Police Station which accounts for 29.75% of total matters reported and the
Discovery Bay Police Station with 7.10%. This data provides important insights into the
geographical distribution of criminal offences committed in the parish.
0.00
5.00
10.00
15.00
20.00
25.00
30.00
35.00
40.00
45.00 40.15
29.75
7.105.07 4.90 3.89 3.55 2.28

THE CHIEF JUSTICE’S ANNUAL STATISTICS REPORT ON
CRIMINAL MATTERS IN THE PARISH COURTS
46
Chart 3m: Distribution of criminal charges by the police station of origin at the Brown’s Town
Court
The above chart shows the distribution of crimes in the Brown’s Town area using the police stations at
which the matters were reported. The data available from a total of 616 records indicate that for the 2017
calendar year, the majority of criminal matters 57.14%, which were brought before the Brown’s Town
Courts, were reported in Brown’s Town Police Station. This was followed by the Alexandria Police Station
which accounts for 17.37% of total matters reported and the Cave Valley Police Station with 8.93%. This
data provides important insights into the geographical distribution of criminal offences committed in the
parish.
0.00
10.00
20.00
30.00
40.00
50.00
60.0057.14
17.37
8.93 7.312.11 1.95 1.46 1.46
THE CHIEF JUSTICE’S ANNUAL STATISTICS REPORT ON
CRIMINAL MATTERS IN THE PARISH COURTS
47
Conclusion and Recommendations This report provides a range of essential insights into case activity in the parish courts for the year
ended December, 2017. Among other things, it allows for the establishment of a firm indication
of the case load being carried by the different parish courts as well as the relative clearance and
disposal rates and the current estimated criminal case backlog. An understanding of the key
contributors to the adjournment of cases, the distribution of case types and methods of disposal
are also clearly established. Also established are the dominant offence types and important
demographics measures, among other indicators. Several vital findings emerged from the report,
among which is that some of the courts with the larger caseloads also generally have the higher
disposal and clearance rates and some with the smallest caseloads have the lower case disposal
and clearance rates. Among the highlights of this report is that the parish courts of Westmoreland
and St. James with disposal rates of over 80% for matters originating in 2017, are broadly in line
with the commonly benchmarked International standard in many developed jurisdictions.
Similarly, the Westmoreland and St. Catherine Parish Courts with case clearance rates of over
80% are also generally consistent with some International benchmarks. More generally, the data
suggests that many of the parish courts are showing good potential with the disposal and
clearance of criminal cases, though there is much room for improvement. The exceptional
performance of the Westmoreland Parish Court seems to be due in part to its strong use of
mediation a method of disposition, decidedly outdoing all other parish courts in this regard.

THE CHIEF JUSTICE’S ANNUAL STATISTICS REPORT ON
CRIMINAL MATTERS IN THE PARISH COURTS
48
Among the findings which have the greatest implications for the efficiency with which matters
progress through the courts system is that a large proportion of the reasons for adjournment are
due to the non-attendance of the accused, medical reports outstanding and files to be
completed. These deficiencies require special operational interventions and stakeholder
collaboration to produce the desired solutions. The proportionately large incidence of male and
youth involvement in nearly all types of criminal offences are also quite telling from a
demographic and social standpoint. It is also notable that the ratio of mediated settlements to
other methods of disposition is generally quite low, which could suggest either an under-usage
of existing provisions for mediation or a high incidence of failed attempts at mediation.
These findings could form the nucleus of important operational and policy interventions which
are needed to bolster efficient flow of criminal cases throughout the court system and therefore
constitute the basis for an empirically driven approach to case management in the courts.
The recent employment of Case Progression Officers (CPOs) in the parish courts with
responsibility for aiding the readiness of cases for court is a step in the right direction. The Case
Information Statistical System (CISS) supports the work of the CPOs and case management more
generally in the courts through the wide range of data that it provides. I strongly recommend
that a Case Management Steering Committee (CMSC) be formed to establish targets, monitor
case management progression in the respective parish courts and undertake special
interventions which are necessary to strengthen the support mechanisms. This Steering
THE CHIEF JUSTICE’S ANNUAL STATISTICS REPORT ON
CRIMINAL MATTERS IN THE PARISH COURTS
49
Committee will need to be supported by a Judge led Case Management Subcommittees in each
court. A clearly articulated and widely communicated backlog reduction strategy will also need
to be advanced as part of the work of the CSMC.
The fact that the high disposal and clearance rates seen at the Westmoreland Parish Court are at
least partly a result of their heavy use of mediation as a method of disposition, suggests that this
area needs to be explored and more robustly utilized, along with dispute resolution facilities
more generally. Additionally, there needs to a strong engagement of external stakeholders such
as the police and hospitals to reduce the incidence of adjournments which are due to
investigative deficiencies and medical reports outstanding respectively. There also needs to be a
greater standardization of case flow and record keeping processes across the parish courts, thus
the argument for stronger support for the work of the existing Case Management Team. A
general revisiting of infrastructural capacity of the different courts and a more efficient alignment
of resources to the specific needs of these courts also need to be aggressively pursued. The
plethora of statistical data which is currently being produced in the court system should inform
an empirically driven approach to Court and Case Management at both the operational and policy
levels.