the characteristics and determinants of entrepreneurship
TRANSCRIPT

131
The Characteristics and Determinants ofEntrepreneurship in Ethiopia
Wolday Amha1, Tassew Woldehanna2, Eyoual Tamrat3, andAregawi Gebremedhin4
Abstract
Using Global Entrepreneurship Monitor (GEM) approach, the study
analyzes the characteristics and determinants of entrepreneurship in
Ethiopia. Primary data are collected through the Adult Population Survey
(APS) and analyzed using Probit model. To overcome the hetroscedasticity
problem, which is prevalent in cross-section studies, robust standard errors
were employed. The findings of the study reveal that about 53% of the adults
in Ethiopia are potential entrepreneurs. The perceived opportunity rate in
Ethiopia (65%) is above the average for factor-driven economies (63%);
while the perceived capabilities rate (69%) is below the average for factor-
driven economies (71%). Ethiopia’s rate of entrepreneurial intention (22%),early-stage entrepreneurial activity rate (12.2%), and established business
activity rate (8.3%) are below the average for both factor-driven economies
and Sub-Saharan African countries. The econometric analysis indicates that
demographic variables such as age, level of education, societal attitude
towards entrepreneurship, and social networks (knowing someone in
business) are significant in influencing potential entrepreneurship and
entrepreneurial intensions in Ethiopia. In early-stage entrepreneurial
activity (TEA),"Fear of failure" is found to have a negative and statistically
significant effect. On the other hand, the probability of engaging in TEA
significantly differs between those living in urban and rural areas.
Furthermore, the results provide basic data to develop national
entrepreneurship strategy, consistent with the MSE development strategy and
other macro and sectoral level strategies. Thus, the low rate of TEA and
1 PhD, CEO of the Association of Ethiopian Microfinance Institutions (AEMFI) andthe Ethiopian Inclusive Finance Training and Research Institute (EIFTRI).2 PhD Associate Professor, Economics Department, Addis Ababa University.3 Part time lecturer, Economics Department, Addis Ababa University4 Part time lecturer, Economics Department, Addis Ababa University

Wolday, Tassew, Eyoual, and Aregawi: The Characteristics and Determinants of Entrepreneurship
132
established business in Ethiopia can be improved by expanding the quantity
and quality of support services. Moreover, there is also a need to develop
region-specific entrepreneurial development plan to reduce region to region
or urban-rural differences.
Keywords: Global Entrepreneurship Monitor (GEM), Perceived Opportunities andCapabilities, Total Early-Stage Entrepreneurial Activity (TEA)
JEL codes: L26.
1. Introduction
The government of Ethiopia has developed a five-year Growth andTransformation Plan (GTP) (2010/11 - 2014/15), which aims at maintaininga two-digit economic growth per year that has been achieved over the pastseven years. The GTP focuses on: (i) equitable or inclusive economicgrowth; (ii) support the development of agriculture to serve as a majorsource of growth; and (iii) promotion of women and youth employment. Aspart of GTP, the government has implemented the five-year Micro and SmallEnterprise (MSE) Development Strategy (2010/11-2014/15), whichemphasizes on expanding youth employment in urban areas. To this end, thegovernment has been providing support services to MSE operators in fivemajor areas: (a) providing production and marketing space; (b) skill andbusiness development services; (c) technology support; (d) marketdevelopment and linkage; and (e) financial access.
Although the government has been committed and spent huge resources toimplement the mega-MSE development program, interventions to improvethe entrepreneurial ability and capabilities of MSE operators were hardlygiven any focus in the strategy. With the exception of a smallentrepreneurship development program implemented recently, supported byUNDP, there have not been any tailored support programs by governmentand others to promote entrepreneurship in the country. Moreover, there ishardly any evidence and baseline survey to show the current status,characteristics and determinants of entrepreneurship in Ethiopia, whichwould assist policymakers to make informed decisions and formulate astrategy or program to promote entrepreneurship. This is a modest attempt to

Ethiopian Journal of Economics Vol. XXIV No 1, April 2015
133
fill the research gap by applying the approach and methodology of theGlobal Entrepreneurship Monitor (GEM), which uses standard and similarquestionnaire for the adult population survey and the national expert surveyin all the 69 countries, participating in GEM surveys.
The present study is related to the broad literature on determinants ofentrepreneurship. Early empirical studies identified liquidity constraints as acrucial factor affecting the probability of starting a business (Evans andJovanovic 1989; Evans and Leighton 1989). Thus, lack of institutions thatcan provide the necessary start-up restrain entrepreneurship (Nykvist, 2008).Institutions also influence entrepreneurial activity through the legal system,which affects investor protection laws and private property development(Stephen et al., 2005). In addition, socio-political variables are shown to bevital in enhancing social entrepreneurship (Griffiths et al., 2013).
Even though, previous studies documented certain factors that can stimulateor impede the emergence of entrepreneurship, little is known about the stateof entrepreneurship and its determinants in Ethiopia. Besides, the influenceof the entrepreneurial activity depends on a county’s level of development(Stephen et al., 2005). Using GEM 2012 data set, the present study makesan attempt to contribute to the literature by exploring the characteristics anddeterminants of entrepreneurship in Ethiopia.
The Global Entrepreneurship Monitor (GEM) is a research program whichwas initiated in 1997 as a joint venture between London Business School andBabson College, with the aim of obtaining an internationally comparablehigh quality data on entrepreneurial activity. The academic researchconsortium made its first survey in 1999 with 10 participating countries andcontinued to increase the number of participating countries every year.While the first GEM reports included high-income countries only, theambition has always been to include as many countries as possible in orderto support policymakers in their efforts to stimulate economic developmentthrough entrepreneurial activities. In 2012, the number of countriesparticipating in GEM rose to 69, where Ethiopia was included as one of theparticipating countries.

Wolday, Tassew, Eyoual, and Aregawi: The Characteristics and Determinants of Entrepreneurship
134
The aim of GEM is to investigate the role of entrepreneurship in theeconomic growth of a nation. GEM defines entrepreneurship as “any attemptat new business or new venture creation, such as self-employment, a newbusiness organization, or the expansion of an existing business, by anindividual, a team of individuals, or an established business” (Global GEMreport, 2012). Furthermore, GEM captures both informal and formal activitythat encompasses those in the process of starting as well as those runningnew and established businesses which have a comprehensive account ofbusiness activities. Traditional analyses of economic growth andcompetitiveness have tended to neglect the role played by new and smallfirms in national economies. In contrast, GEM takes a comprehensiveapproach and considers the degree of involvement in entrepreneurial activitywithin a country, identifying different types and phases of entrepreneurship.
1.1 Objectives of the Study
The main objective of this paper is to analyze the status, characteristics anddeterminants of entrepreneurship in Ethiopia by applying the GEM approachand comparing the results with the rest of the world. The specific objectivesinclude:
(i) providing baseline information on the status of entrepreneurship inEthiopia;
(ii) studying the characteristics of entrepreneurial activity in Ethiopiaand compare the results with countries participating in GEMsurveys;
(iii) identifying factors which encourage and/or hinder entrepreneurialactivity; and
(iv) contribute towards the formulation of effective and targeted policiesaimed at stimulating entrepreneurship in Ethiopia.

Ethiopian Journal of Economics Vol. XXIV No 1, April 2015
135
1.2 Sampling and Method of Data Collection
One of the key purposes of GEM is to provide reliable data onentrepreneurship which will be useful in making meaningful comparisonsovertime, both internally and between economies. For this reason, allparticipating economies make use of standard research instruments. The datafor this study are collected through the Adult Population Survey (APS).TheEthiopian team conducted the Adult Population Survey (APS) using arandom representative sample of 3,005(18 to 64-yearoldage cohort adults)from all regions. The survey was conducted using a standardizedquestionnaire developed by the GEM consortium. The raw data were sentdirectly to the GEM data team for inspection and uniform statisticalcalculations before being made available to the Ethiopian team for analysisand interpretation, and, ultimately, compilation of the annual national report.
1.3 GEM's Conceptual and Empirical Framework to StudyEntrepreneurship
The GEM approach views entrepreneurship as a process comprisingdifferent phases, from intending to start a business, to just starting, runningnew or established enterprises and even discontinuing a business. To thisend, data are collected across several phases of entrepreneurship. Sinceindividuals may respond differently to policy interventions depending on thespecific position in the entrepreneurship process, a dynamic approach ofanalyzing entrepreneurship activities provides valuable information topolicymakers. For example, it might be the case that substantial awarenessfor entrepreneurship as a career choice exists within a country and that manypeople expect to start a business within the next few years. In that samecountry, however, low rates of nascent entrepreneurship may exist ascompared to countries with similar level of economic development. Such adiscrepancy in entrepreneurship involvement rates across several phases maycall for targeted policy interventions to ameliorate the transformationbetween phases, from intentions to actual steps to start a new business.According to the 2012GEM report, the entrepreneurship process andframework of GEM’s approach are defined as follows:

Wolday, Tassew, Eyoual, and Aregawi: The Characteristics and Determinants of Entrepreneurship
136
Potential entrepreneurs: potential entrepreneurs are individuals who havenot yet taken steps to start a business, but they have the beliefs and abilitiesto start a business. In other words, individuals are considered to be potentialentrepreneurs when they believe they have the knowledge and skills to start abusiness and/or when they see opportunities for setting up a business in thearea where they live in. Furthermore, potential entrepreneurs should not beafraid of business failure. It should also be emphasized that any supportprovided to potential entrepreneurs should not have high expectation onsuccess rates.
Entrepreneurial intent: potential entrepreneurship is followed byentrepreneurial intent. This phase includes individuals who have actualintentions, alone or together with other individuals, to start a new businesswithin the next three years.
Total early-stage entrepreneurial activity: GEM’s primary measure ofentrepreneurship is total early-stage entrepreneurial activity (TEA), whichconsists of nascent entrepreneurs and new business owners. Nascententrepreneurs include individuals who are actively involved in setting up abusiness they will own or co-own; and this business has no paid salaries,wages, or any other payments to the owners for more than three months. Onthe other hand, new business entrepreneurship refers to individuals who arecurrently owner-managers of new businesses, i.e. owning and managing arunning business that has paid salaries, wages, or any other payments formore than three months, but not more than 42 months.
Established entrepreneurship: the early-stage entrepreneurial activity(TEA) is followed by established business ownership. Owners of establishedbusiness entrepreneurs are individuals who are currently owner-managers ofestablished businesses, i.e. owning and managing a running business that haspaid salaries, wages, or any other payments for more than 42 months.
Business discontinuance: this includes individuals who have, in the past 12months, discontinued a business, either by selling, shutting down, or

Ethiopian Journal of Economics Vol. XXIV No 1, April 2015
137
otherwise discontinuing an owner/management relationship with thebusiness. However, this is not a measure of business failure.
GEM approach takes a comprehensive snapshot of entrepreneurs around theworld, measuring the attitudes of a population and the activities andattributes of individuals participating in various phases of this activity. Theapproach also considers the aspirations of these entrepreneurs regarding theirbusinesses, along with other key features of their ventures. GEM's TotalEarly-stage Entrepreneurial Activity (TEA) index gauges the level ofdynamic entrepreneurial activity in an economy by considering the incidenceof start-up businesses (nascent entrepreneurs) and new firms (up to3.5 yearsold) owned by the adult population (i.e. individuals aged18–64 years).
Another important feature of GEM's approach is the distinction it makesbetween different types of entrepreneurship and how these contribute toeconomic growth and job creation. Individuals who start businesses inresponse to a lack of other options for earning an income are deemed to benecessity-driven entrepreneurs, while those who start businesses with theintention of exploiting an opportunity are identified as opportunity-drivenentrepreneurs. The latter may include individuals whose aim is to maintainor improve their income, or to enhance their independence.
Since economic development and entrepreneurship differs along the differentphases of economic development, the GEM experts categorized theparticipating countries into three groups: factor-driven, efficiency-driven andinnovation-driven economies. Moreover, productivity and competitivenessare influenced by various factors and the intensity of their effect depends onthe country’s stage of economic development.
Factor-driven economies: countries in this phase are dominated bysubsistence agriculture and extraction businesses, with a heavy reliance on(unskilled) labor and natural resources. The factor-driven economies arecountries with less than 2,000 USD GDP per capita, while those in transitionfrom factor to efficiency-driven countries have a GDP per capita, rangingfrom 2,000 to 2,999 USD (World Economic Forum’s Global

Wolday, Tassew, Eyoual, and Aregawi: The Characteristics and Determinants of Entrepreneurship
138
Competitiveness Report 2012/13).Countries in this phase are characterizedby massive unemployment which forces individuals into self-employment soas to make a living, which creates necessity-driven entrepreneurship. Thefocus of factor-driven economies is geared towards building a sufficientfoundation for basic requirements such as infrastructure, health and primaryeducation, institutional development and macroeconomic stability. Ethiopiais classified as a factor-driven economy.
Efficiency-driven economies: countries in this phase are more competitivewith further development accompanied by industrialization and an increasedreliance on economies of scale, with more dominant large organizationswhich are capital-intensive. The efficiency-driven economies have a GDPper capita, ranging between 3,000 and 8,999 USD, while those in transitiontowards innovation-driven have a GDP per capita ranging from 9,000 to17,000 USD (World Economic Forum’s Global Competitiveness Report
2012/13). This phase is generally accompanied by improved (and improving)basic requirements, and attention is then directed towards developing highereducation and training, financial market, labor and goods market efficiency,technological readiness and market size.
Innovation-driven economies: these countries are characterized by moreknowledge intensive and expanded businesses. The innovation-driveneconomies have a GDP per capita of more than 17,000 USD (WorldEconomic Forum’s Global Competitiveness Report 2012/13). The key focusfor innovation-driven economies is business sophistication and innovation.Business sophistication consists of two elements that are intricately linked:the quality of a country’s overall business networks and the quality ofindividual firms’ operations and strategies. Innovation, on the other hand,includes sufficient investment in Research and Development (R&D),presence of high-quality scientific research institutions which deliver newtechnologies and protection of intellectual property rights.

Ethiopian Journal of Economics Vol. XXIV No 1, April 2015
139
2. Entrepreneurial Characteristics of the Adult Population inEthiopia
This section focuses on the analysis of entrepreneurial perceptions andintentions among the Ethiopian sample adult population. Attempts are alsomade to compare the results of the survey with the averages of the 13 factor-driven economies and 10 Sub-Saharan African countries which serve asbenchmarks. The analysis of entrepreneurial perceptions indicates whetherindividuals perceive entrepreneurial opportunities in their environment, howthey perceive their own entrepreneurial ability, and what their perception istowards business failure. The entrepreneurial intentions are expected toprovide concrete dynamic measures of entrepreneurial activity in Ethiopia.To this end, individuals were asked about their intentions to start a businesswithin the next three years. Attempts are also made to assess thecharacteristics of adults, who are in the process of starting a new business orrunning an existing new business, which is measured using the rate of Early-stage Total Entrepreneurial Activity (TEA). The whole objective is toinvestigate the prevalence rate of TEA in different demographic categoriesof the early-stage entrepreneurs.
2.1 Potential Entrepreneurs in Ethiopia
Individuals in the survey are considered to be potential entrepreneurs whenthey perceive that they have good opportunities in their living area for settingup a business, and when they have the required capabilities to start abusiness. The first step in the entrepreneurship process occurs when peopleperceive favorable business opportunities in their area. Businessopportunities originate as perceptions on what individuals believe can bedone to earn a profit. Opportunities are therefore both real and subjective(Lewin, 2012). Perceived capabilities refer to the percentage of individualswho believe they have the required skills, knowledge and experience to starta new business.
Table 1 indicatesthat65% of the adult population perceives a good businessopportunity to start a business in the next six months. Ethiopia’s perceived

Wolday, Tassew, Eyoual, and Aregawi: The Characteristics and Determinants of Entrepreneurship
140
opportunity rates are higher compared to factor-driven economies (63%) butit is lower when compared with the average for Sub-Saharan economiesinvolved in GEM surveys (70%). On the other hand, individuals in Sub-Saharan African countries are likely to believe that they have the skills andknowledge necessary to start businesses (76%). Of the sample adultpopulation in the Ethiopia, 69% of the respondents believe that they have theskills to pursue a business opportunity. Nevertheless, Ethiopia’s perceivedcapability rate is lower as compared with the average for both factor-driveneconomies and Sub-Saharan African countries. In terms genderdifferentiation, the rate of perceived opportunities for female respondents(62%) in Ethiopia is lower compared to their male counterpart (68%), andregarding the belief on one’s entrepreneurial capability to pursue a business,the rates for female respondents (65%) are lower as compared with theirmale counterparts (72%).
Table 1: Perceived opportunities and capabilities of the adult populationin Ethiopia and other economies
Phase of economic developmentPerceived
opportunitiesPerceived
capabilities
Factor-driven economies: averages 63%* 71%
Ethiopia (as factor-driven economy) 65% 69%
Efficiency-driven economies: averages 41% 52%
Innovation-driven economies: averages 31% 36%
Sub-Saharan Average 70% 76%
* Read as: On average factor-driven economies have a perceived opportunity rate of63%.
As depicted in Figure 1, cross-tabulating the number of adults who perceivethat there is good business opportunities (65%) with those who believe thatthey have entrepreneurial capabilities(69%) shows that there is a clearoverlap of the two responses (53%). This constitutes the size of Ethiopia’spool of potential entrepreneurs, meaning the pool of those who see enoughopportunities in their living area for setting up a business and believe thatthey have entrepreneurial capabilities to start a business. In other words,entrepreneurial perception rates are high suggesting that individuals are

Ethiopian Journal of Economics Vol. XXIV No 1, April 2015
141
willing to act on the opportunities they perceive by applying theirentrepreneurship capabilities to start businesses. However, since this is basedentirely on self-reported perceptions, there is a need to compare it with thereality. It should be noted that believing that one has the skills to start abusiness and actually having them are two different things.
Figure 1: Ethiopia’s pool of potential entrepreneurs
The quality of the educational system in a factor-driven economy, such asEthiopia, affects the quality and characteristics of entrepreneurship. Theresult of the adult population survey indicates that the perceivedentrepreneurial capability increases as one’s education level increases. All ofthe adults with a second degree believed that they are capable of pursuingnew business; whereas only half of the individuals with pre-primaryeducation believed that they have the skill to pursue a new business (53%). Itshould be noted that Ethiopia’s primary education net enrolment is amongthe lowest in the world, 122 out of 144 countries (World Economic Forum’sGlobal Competitiveness Report 2012/13), which contributed to lowentrepreneurial quality. For Ethiopia, as being a factor-driven economy,meeting basic access to health services and primary education is one of thecriteria to improve entrepreneurship.
2.2 Entrepreneurial Intentions of Adults in Ethiopia
Once a potential entrepreneur expresses his/her intention to start a newbusiness in the foreseeable future, understanding the entrepreneurialintentions of respondents provide valuable information about the dynamicsof entrepreneurial activity in Ethiopia. To this end, respondents were askedwhether they intend to start a business, alone or with others, in the coming
Perceivedopportunities
65%
65%
65%
Perceivedcapabilities
69%
PotentialEntrepreneurs
53%

Wolday, Tassew, Eyoual, and Aregawi: The Characteristics and Determinants of Entrepreneurship
142
three years. As per the survey results (Table 2), Ethiopia’s rate ofentrepreneurial intention is found to be 22%, which is much lower than theaverage rate for factor-driven economies (49%) and the average rate for Sub-Saharan African countries (53%).Although Ethiopia has relatively thehighest perception in entrepreneurial opportunities and capabilities, theintention to start a new business is relatively very low.
The result of the adult population survey in Ethiopia indicates that femalerespondents (19%) have relatively lower entrepreneurial intensionscompared to male respondents (24%). However, given the socio-cultural andother barriers of women in Ethiopia, one would have expected much lowerrate of entrepreneurial intentions, perceived opportunities and capabilities.With regard to regional differences, the survey result indicates that the adultpopulation in Gambela region has the highest entrepreneurial intentions(82%), followed by Dire Dawa (50%), Addis Ababa (28.6%), Oromia(25.2%), Amhara (18.6%), and Tigray (17.5%). The adult populations ofHarari and Somali regions have the lowest entrepreneurial intensionscompared to other regions.
Table 2: Entrepreneurial intentions in Ethiopia and other economies,2012
Phase of economic development Entrepreneurial intentions
Factor-driven economies: averages 49%*
Ethiopia (as factor-driven economy) 22%
Efficiency-driven economies: averages 27%
Innovation-driven economies: averages 13%
Sub-Saharan Africa: Average 53%
* Read as: On average factor-driven economies have an entrepreneurial intentionrate of 49%.
According to the 2012 GEM report of South Africa, an individual’sentrepreneurial intention is influenced firstly by the perception of the extentto which it is desirable (attractive and credible) to become an entrepreneur.Secondly, it is influenced by perceptions of feasibility, which focus on the

Ethiopian Journal of Economics Vol. XXIV No 1, April 2015
143
individual’s ability to adopt entrepreneurial behavior.GEM distinguishesbetween three entrepreneurial attitudes: individuals’ opinions aboutentrepreneurship being a desirable career option, individuals’ opinions aboutthe level of respect and status that entrepreneurs have, and respondents’assessments of the media attention on successful entrepreneurs. The threeattitudinal measurements assess societal impressions and the visibility andattractiveness of entrepreneurship in a specific community. Positive views onthese measures can influence not only the willingness of individuals tobecome entrepreneurs, but also the likelihood that others in society willsupport their efforts, with some, possibly, becoming stakeholders such asinvestors, suppliers, customers and advisors.
Table 3 shows the entrepreneurial attitudes of the Ethiopian sample adultpopulation by comparing the results with Sub-Saharan Africa and otherGEM participating countries. As per the survey results, entrepreneurship isconsidered as a desirable career option for 74% of the adults in Ethiopia,which is slightly lower than the average for factor-driven economies (76%)and Sub-Saharan Africa countries (76%). Moreover, about 91% of the adultpopulation believes that the society gives a high status to successfulentrepreneurs, which is much greater than the averages for factor-driveneconomies (80%) and Sub-Saharan Africa countries (80%). About 72% ofthe respondents have a positive attitude towards media attention forentrepreneurs, which is higher than the average for factor-driven economies(68%) but less than the Sub-Saharan Africa average (77%).
Even though society’s attitude towards entrepreneurship is positive inEthiopia, only 22% of the respondents intend to engage in business,whenever they have opportunities. Potential entrepreneurs may not beencouraged to take risk and start a new business if they fear humiliation bytheir peers, in the event of business failure. The findings of the adultpopulation survey in Ethiopia prove that fear of failure is a disincentive tostart a new business. Out of the 65% who perceive that there are goodbusiness opportunities, 35% fear failure, and only 22% of the respondentsreported that they have entrepreneurial intentions.

Wolday, Tassew, Eyoual, and Aregawi: The Characteristics and Determinants of Entrepreneurship
144
Table 3: Entrepreneurial attitudes in Ethiopia and other economies,2012
Phase of economicdevelopment
Entrepreneurshipas good career
choice
High status tosuccessful
entrepreneurs
Media attentionfor
entrepreneurshipFactor-driven economies: averages 76%* 80% 68%
Ethiopia (as factor-driven economy) 74% 91% 72%
Efficiency-driven economies:averages
70% 69% 60%
Innovation-driven economies:averages
55% 70% 56%
Sub-Saharan Africa: Average 76% 80% 77%
* Read as: On average 76% of individuals in factor-driven economies consideredEntrepreneurship as good career choice
The result of the survey depicts that entrepreneurial intention of the adultpopulation in Ethiopia increases with the level of education. Adults with asecond degree have a higher entrepreneurial intention rate of 50% whereasindividuals with a pre-primary education have only 5% rate ofentrepreneurial intention. However, the entrepreneurial intention rate forrespondents, who have secondary and preparatory level of education, ishigher (38%) than the respondents with technical and vocational level(23%), which could be partly the result of inadequate awareness regardingentrepreneurship in technical and vocational schools.
2.3. Entrepreneurial Activity in Ethiopia
GEM studies have attempted to study the relationship between economicgrowth, measured in terms of GDP per capita, and the level and nature ofentrepreneurial activity in an economy. According to 2012 GEM report,economies with low GDP per capita tend to have high TEA rates with arelatively high proportion of necessity-motivated entrepreneurship.However, as the GDP per capita increases, economies tend to have moreestablished firms and lower TEA rates. Table 4 shows that the threemeasures of entrepreneurial activity decrease as the stage of economicdevelopment increases. Since Ethiopia has a low GDP per capita, one would

Ethiopian Journal of Economics Vol. XXIV No 1, April 2015
145
expect higher level of entrepreneurial activity. However, Ethiopia’s TEA rateof 12.2% is far below compared to the average for factor-driven economies(23.7%). The average rates of the adult population, who are taking steps tostart a business or nascent businesses (5.6%), and those engaged inbusinesses for less than 3.5 years or new business owners (6.8%) are lowercompared to the average for factor-driven economies, which are 11.8% and12.7%, respectively.
Entrepreneurs may have different motivations for starting a business. Somepeople may be pushed into starting a business because they have no otherwork options and need a source of income which GEM classifies asnecessity-driven entrepreneurs. Others start their own business primarily totake the advantage of the good opportunity, which GEM identifies asopportunity-driven entrepreneurs. Furthermore, others may desire greaterindependence in their work or seek to maintain or improve their income,which GEM identifies as improvement-driven entrepreneurs. The relativeprevalence of opportunity-motivated versus necessity-motivatedentrepreneurial activity can provide useful insights into the quality of early-stage entrepreneurial activity in Ethiopia.
Table 4: Nascent, new entrepreneurship and TEA rates in Ethiopia andother economies
Phase of economic developmentNascent
entrepreneurshipNew
entrepreneurshipTEA
Factor-driven economies: averages 11.8% 12.7% 23.7%Ethiopia (as factor-driven economy) 5.6% 6.8% 12.2%Efficiency-driven economies:
averages7.8% 5.6% 13.1%
Innovation-driven economies:averages
4.2% 3.0% 7.1%
The percentage of Ethiopian adult population that starts a business out ofopportunity has outnumbered the percentage of adults that start out ofnecessity. It is encouraging enough that 61% of early-stage entrepreneurs inEthiopia are driven by business opportunity, while 29% are driven bynecessity. This could be partly the result of the mega-program of the

Wolday, Tassew, Eyoual, and Aregawi: The Characteristics and Determinants of Entrepreneurship
146
government, which has been providing diverse support (working place, skilltraining, extension support, market development, technology support, andaccess to finance) for MSE operators, particularly in urban areas. Theimportance of opportunity-driven entrepreneurship in Ethiopia can beassessed by considering the number of jobs that have been created, incomparison to those that have been created by necessity-driven businesses.Table 5 shows that about 52% of the jobs were created through opportunity-driven businesses. On the other hand, 40% of the jobs were created bynecessity-driven businesses.
The result of the adult population survey portrays that about 71% of adultswith pre-primary education are driven into business by opportunity.However, the percentage of adults involved in opportunity-driven businessesdeclines as the level of education goes up to the first cycle primary education(52%) and second cycle primary education (48%). The results of the surveyalso reveal that there is a positive correlation between opportunity-drivenbusiness and higher educational attainment - completing secondary andpreparatory school (69.7%), technical and vocational education (72.7%), andfirst degree (70.6%).
Table 5: Percentage of jobs created by opportunity- and necessity-driven businesses in the early-stage entrepreneurial activity(TEA) in Ethiopia, 2012
Number of current jobsOpportunity-driven
businessesNecessity-driven
businesses
No employees 47.73%* 59.68
1 – 5 employees 47.73% 35.48
6 – 19 employees 3.03% 3.23%
20+ employees 1.52% 1.61%
Total 100.00% 100.00%
The findings of the adult population survey in Ethiopia shows that maleadults are more likely to engage in the early-stage entrepreneurial activity(opportunity and necessity-driven businesses) than the female adults. Out of

Ethiopian Journal of Economics Vol. XXIV No 1, April 2015
147
the total adult population engaged in TEA, about 53% of the respondents aremale and the remaining 47% are female adults. On the other hand, femaleadults are more likely to be motivated into entrepreneurship by opportunitycompared to their male counterparts. Of the total female adults involved inTEA, about 62% of them are motivated by business opportunity, while 29%of them are motivated by necessity. On the other hand, 59% of male adults inTEA are driven by business opportunity and 27% of them are motivated bynecessity.
Table 6 shows the number of jobs which were created by early-stage maleand female entrepreneurs in Ethiopia. The early-stage male entrepreneurs(73%) have created a higher number of jobs than the early-stage femaleentrepreneurs (64%), which is consistent with the GEM findings in othercountries over the years. Thus, policies and programs which increaseemployment access to female adults and their involvement inentrepreneurship should focus on the development of skills to exploit highgrowth opportunities.
Table 6: Jobs created in the early-stage entrepreneurial activity inEthiopia by gender, 2012
Number of current jobsMale early-stageentrepreneurs
Female early-stageentrepreneurs
No employees 27.32%* 36.05%
1 – 5 employees 24.74% 25.00%
6 – 19 employees 3.09% 1.16%
20+ employees 44.85% 37.79%
Total 100.00% 100.00%
The GEM results entails that entrepreneurial endeavors can be started at anytime in a person’s life, although entrepreneurial activity is mostly prevalentamong persons in the 25–34 years age group. These individuals are likely tohave had some time to develop their skills and knowledge through educationand work experience. The result of the survey indicates that the highestentrepreneurship rates in Ethiopia occur among the 25–34 years age group,

Wolday, Tassew, Eyoual, and Aregawi: The Characteristics and Determinants of Entrepreneurship
148
with TEA rate of about 15%. The second highest participation occurs in theage group of 18-24 years with 14% TEA rate. The prevalence of early-stageentrepreneurial activity tends to be relatively low in the 55-64 years cohort(4.5% TEA rate) followed by 45-54 age group (6.9% TEA rate). Thefindings of the survey show that the relatively higher rate of TEA by theyouth is encouraging which might help to reduce the unemploymentchallenge in the country.
The result of the survey indicates that Dire Dawa has the highest percentageof early-stage entrepreneurs (43%),out of which about 80% is driven bybusiness opportunity and 20% by necessity. Addis Ababa has a TEA rate of32%, out of which, about 72% and 12% are opportunity-driven andnecessity-driven entrepreneurs, respectively. Tigray, SNNP, Oromia andAmhara regions have TEA rates of 19.3%, 16.5%, 10.6%, and 7.1%,respectively. About 55% to 62% of the new businesses created in the fourlarge regions are opportunity-driven. However, Gambela region has thelowest rate of early-stage entrepreneurs. Though Somali region has one ofthe lowest TEA rates, about 83% of the early-stage entrepreneurs are drivenby business opportunity which is the highest compared to the rest of theregions.
The result of adult population survey also shows the positive correlationbetween level of education of adults and their involvement in early-stageentrepreneurial activities. For example, out of the adult population inEthiopia with pre-primary level of education, only 3% are involved in early-stage entrepreneurship activities. On the other hand, about 29% of the adultswith first degree are likely to be involved in early-stage entrepreneurialactivities.
2.4 Established Business Ownership in Ethiopia
Established business ownership refers to the percentage of 18-64-year-oldpeople, who are owner-managers of established businesses, i.e. owning andmanaging a running business that has paid salaries, wages, or any otherpayments for more than 42 months. As indicated in Table 7, Ethiopia’s

Ethiopian Journal of Economics Vol. XXIV No 1, April 2015
149
established business activity rate is 8.3%, which is lower compared to theaverage for factor-driven countries (11%) and the average for Sub-SaharanAfrica participating in GEM (12.8%). Moreover, Ethiopia’s rate of businessdiscontinuity is 3%.
Table 7: The rate of established business ownership in Ethiopia andother economies
Phase of economic development Established Business ownership
Factor-driven economies: averages 11.4%*
Ethiopia (as factor-driven economy) 8.3%
Efficiency-driven economies: averages 7.8%
Innovation-driven economies: averages 6.7%
Sub-Saharan Africa: averages 12.8%
The results of the adult population survey reveal that about 8.6% of male and7.9% of female adults are involved in established businesses. The rate ofestablished business is consistent with the rate of early-stage entrepreneurialactivity of male and female adults. However, the rates of establishedbusinesses for the adult population vary from region to region.
3. Determinants of Entrepreneurship in Ethiopia3.1 The Model
Examining the factors that affect potential entrepreneurs (entrepreneurialintentions and capabilities) and early-stage entrepreneurial activity providesa useful insight in identifying tailored interventions aiming at promotingentrepreneurship in Ethiopia. The analysis is also expected to predict theconditional probability that an adult in Ethiopia will be a potentialentrepreneur, has entrepreneurial intention and capability to start his/her ownbusiness or involve in early-stage entrepreneurial activity. This is analyzedusing binary choice models, where the dependent variable has tworesponses: whether an adult is a potential entrepreneur, has anentrepreneurial intention, or engaged in early-stage entrepreneurial activity.The latent variable potential entrepreneurship level (y*) is the outcome of

Wolday, Tassew, Eyoual, and Aregawi: The Characteristics and Determinants of Entrepreneurship
150
the model which depends on a vector of regressors or explanatory variablesX. Since we cannot observe full level of entrepreneurship, the probabilitythat an individual is entrepreneur (Pr (yi=1) has to be defined and as thescale of probability is not identified, a normalization on the distribution of
i is required. Let our model is given by:= ′ +Where the dependent variable is a dichotomous taking values 0 or 1.Given this one can consider three models: the Linear Probability Model(LPM), the Probit model and the Logit model. The first model, LPM, isestimated using the OLS regression and works like a normal linear
regression except interpretations change as is binary. However, one of themajor problems of LPM is that the predicted probability {Pr ( | ) =
′ }can go below 0 or above 1, which is logically inconsistent with the
theory of probability. Besides, as the Var( | ) = ′ (1 − ′ ), theregression has variances which varywith the observations and hence thelinear probability model violates the assumptionof homoscedasticity. Due tothese problems, it is better to resort to Logit or Probit models, which yieldssimilar results but based on different distributional assumptions. And in thecurrent paper, the Probit model is considered.
Our binary choice model (Probit model) used in our paper is described asfollows.
*
*
* ' , ~ (0,1)
1 if 0
0 if 0
i i i i
i i
i i
y x NID
y y
y y
Where the si are independent of all xi. The parameters in Probit models is
estimated by the method of maximum likelihood. Consequently, theprobability that an individual is entrepreneur (Pr(yi=1)) is defined as:
*{ 1} { 0} { ' 0} { ' } { ' } ( ' ),i i i i i i i i iP y P y P x P x P x x

Ethiopian Journal of Economics Vol. XXIV No 1, April 2015
151
Where denotes the Standard Normal distribution function of i , or, in
the common case of a symmetric distribution, the distribution function of i
.
Since the model is non-linear in parameters, the partial effect of explanatory
variables are derived as( ' )
( ' )ii k
ik
xx
x
for contentious
explanatory variables and ( ' | 1) ( ' | 0)i k i kx x x x for discrete
(dummy explanatory variables).
3.2 Estimation Results
The data used in this study are obtained from the Adult Population Survey(APS) conducted using a random representative sample of 3,005 (18 to 64years old age) from all regions and a standardized questionnaire developedby the GEM consortium. A probit model is employed to analyze the data.The regressions on the determinants of potential entrepreneurship,entrepreneurial intention and TEA are carried out by taking dummy variablesfor the three measures of entrepreneurship as dependent variables. The mostcommon problem in cross-section data is heteroscedasticity of the errorterms and it results in inefficient estimates. In the current study, an attempt ismade to correct for heteroscedasticity by using robust standard errors.
The regression results of potential entrepreneurship along with the marginaleffects are presented in Table 8. The coefficients of age and age squared aresignificant but only at 10% level of significance. The difference in potentialentrepreneurship among male and female adults in the survey is statisticallyinsignificant. On the other hand, proxies that were used to measure thesocietal attitude towards entrepreneurship such as media attention given tosuccessful entrepreneurs and whether the society considers entrepreneurshipas a preferred carrier choice or not, have a significant and positive effect onthe likelihood of an adult becoming a potential entrepreneur.
Adults who know someone already engaged in a business, have a higherprobability of being potential entrepreneurs than those who do not. Similarly,

Wolday, Tassew, Eyoual, and Aregawi: The Characteristics and Determinants of Entrepreneurship
152
individuals living in urban areas have 0.07 higher probability of beingpotential entrepreneurs than adults living in rural areas. Except for adultswith pre-primary schooling and traditional education, the likelihood that anindividual becomes a potential entrepreneur decreases as the level ofeducation increases. For instance, adults with first cycle primary level ofeducation have 0.12 higher probability of being potential entrepreneurs thanthose that have degree and above level of education. One can further noticethat the probability an adult becomes potential entrepreneur varies amongregions in Ethiopia.

Ethiopian Journal of Economics Vol. XXIV No 1, April 2015
153
Table 8: Probit regression results: determinants of potential entrepreneurship
Coefficient estimates Marginal effectAge in years 0.0252* -0.00126
(0.0149) (0.000892)Age squared -0.000438**
(0.000191)Male dummy 0.0848 0.0241
(0.0552) (0.0157)Dummy for media attention given to successful entrepreneurs 0.257*** 0.0750***
(0.0656) (0.0196)Dummy for considering entrepreneurship as a good career choice 0.688*** 0.204***
(0.0678) (0.0198)Dummy for knowing someone in the business 0.962*** 0.311***
(0.0602) (0.0196)Urban dummy 0.235*** 0.0666***
(0.0862) (0.0244)Dummy for pre-primary education -0.227 -0.0649
(0.167) (0.0480)Dummy for first cycle primary education 0.426*** 0.118***
(0.150) (0.0402)Dummy for second cycle primary education 0.241* 0.0676*
(0.142) (0.0393)Dummy for secondary and preparatory school 0.320** 0.0903**
(0.136) (0.0378)Dummy for technical and vocational training 0.427** 0.117**
(0.180) (0.0473)Dummy for traditional/religious school 0.112 0.0315
(0.156) (0.0434)

Wolday, Tassew, Eyoual, and Aregawi: The Characteristics and Determinants of Entrepreneurship
154
Coefficient estimates Marginal effectRegion dummy for Tigray 1.002*** 0.284***
(0.176) (0.0490)Region dummy for Afar 0.119 0.0337
(0.277) (0.0783)Region dummy for Amhara -0.275* -0.0777*
(0.142) (0.0402)Region dummy for Oromia 0.371*** 0.105***
(0.138) (0.0390)Region dummy for Somalia 1.217*** 0.345***
(0.192) (0.0535)Region dummy for SNNP 0.571*** 0.162***
(0.148) (0.0415)Region dummy for Benishangul Gumuz -0.0104 -0.00295
(0.241) (0.0682)Region dummy for Harari 1.008* 0.285*
(0.567) (0.161)Region dummy for Dire Dawa - -
Constant -2.047***(0.326)
Number of observations 2,852 2,852Pseudo R2 0.274
Robust standard errors in parenthesesThe standard errors of the marginal effects are calculated using Delta method.*** p<0.01, ** p<0.05, * p<0.1

Ethiopian Journal of Economics Vol. XXIV No 1, April 2015
155
The results in Table 9 show that demographic variables such as age, agesquared, gender and urban dummy were found to have insignificant effect onthe entrepreneurial intention of adults. The variables which were taken asproxies for societal attitudes: media attentions given to entrepreneurs andsociety’s attitude on entrepreneurship as a preferred carrier choice have apositive impact on the entrepreneurial intention of the adult population.Similarly, knowing someone who started a business has a positive effect oninculcating entrepreneurial intentions in the adult population. In other words,adults who know someone involved in business have 0.035 higherprobability of entrepreneurial intention than those who do not know anyonein business. The results in Table 9 also indicate there is no significantdifference among the regions in terms of entrepreneurial intention except forSNNP.
The coefficients of all education variables were negative and significantcompared to individuals having degree and above level of education,implying that the probability of having entrepreneurial intention increases aseducation level increases. Surprisingly, the probability of havingentrepreneurial intention for adults with annual combined household incomeof less than 5,000 and from 5, 0001 to 10,000 Birr is higher than people withannual income of more than 100,000 Birr. In other words, as the annualhousehold income declines the probability of having entrepreneurialintention increases.

Wolday, Tassew, Eyoual, and Aregawi: The Characteristics and Determinants of Entrepreneurship
156
Table 9: Probit Regression results: Determinants of entrepreneurial intentionCoefficient estimates Marginal effect
Age in years 0.00622 -0.00171**(0.0183) (0.000852)
Age squared -0.000231(0.000243)
Male dummy 0.00453 0.000925(0.0654) (0.0133)
Dummy for media attention given to successful entrepreneurs 0.168** 0.0331**(0.0784) (0.0149)
Dummy for considering entrepreneurship as a good career choice 0.271*** 0.0516***(0.0803) (0.0143)
Dummy for knowing someone in the business 0.173** 0.0352**(0.0709) (0.0144)
Urban dummy -0.147 -0.0287(0.0998) (0.0188)
Dummy for pre-primary education -1.086*** -0.141***(0.204) (0.0155)
Dummy for first cycle primary education -0.582*** -0.0998***(0.163) (0.0233)
Dummy for second cycle primary education -0.460*** -0.0833***(0.155) (0.0249)
Dummy for secondary and preparatory school -0.244* -0.0465*(0.145) (0.0257)
Dummy for technical and vocational training -0.681*** -0.100***(0.211) (0.0206)
Dummy for traditional/religious school -0.649*** -0.108***(0.177) (0.0237)
Dummy for individuals in the income group 0 to 5,000 0.856*** 0.223***(0.274) (0.0832)
Dummy for individuals in the income group 5,001 to 10,000 0.698*** 0.164**(0.269) (0.0707)

Ethiopian Journal of Economics Vol. XXIV No 1, April 2015
157
Coefficient estimates Marginal effectDummy for individuals in the income group 10,001 to 20,000 0.451* 0.0982
(0.268) (0.0619)Dummy for individuals in the income group 20,001 to 40,000 0.444 0.103
(0.270) (0.0698)Dummy for individuals in the income group 40,001 to 100,000 0.214 0.0476
(0.287) (0.0689)Region dummy for Tigray -0.252 -0.0515
(0.219) (0.0447)Region dummy for Afar 0.397 0.0810
(0.305) (0.0622)Region dummy for Amhara 0.222 0.0453
(0.179) (0.0365)Region dummy for Oromia 0.287 0.0585
(0.177) (0.0361)Region dummy for Somalia - -Region dummy for SNNP -0.618*** -0.126***
(0.196) (0.0399)Region dummy for Benishangul Gumuz -0.327 -0.0667
(0.394) (0.0804)Region dummy for Harari - -Region dummy for Dire Dawa -0.451 -0.0921
(0.536) (0.109)Constant -1.540***
(0.447)Number of observations 2,671 2,671Pseudo R2 0.094
Robust standard errors in parentheses.The standard errors of the marginal effects are calculated using Delta method.*** p<0.01, ** p<0.05, * p<0.1

Wolday, Tassew, Eyoual, and Aregawi: The Characteristics and Determinants of Entrepreneurship
158
Table 10 presents the probit estimation results for TEA and indicates that agehas a positive effect on the early-stage entrepreneurial activity of adults butonly at 10% significance level. As age increases by 1 year, the probabilitythat an individual will be involved in early-stage entrepreneurial activity, onaverage, decreases by0.0013. Although male adults have a higher probabilityof being involved in TEA or new businesses, the difference is found to bestatistically insignificant. It is expected that society’s attitude onentrepreneurship as a preferred carrier choice and media attention on thesuccess of the early-stage entrepreneurial activities have a positive effect oninvolvement of the adult population in TEA. However, the regression resultsindicate that media attention and society's attitude towards entrepreneurshipas a preferred carrier choice were found to be statistically insignificant inaffecting TEA.
On the other hand, the probability that adults with fear of failure will beengaging in TEA or new businesses is lower than those who stated that fearof failure will not prevent them from starting a new business by 0.03. Adults,who know individuals involved in business activities, have 0.08 higherprobability of being engaged in TEA than those who do not know anyone.Moreover, individuals living in urban areas were found to have 0.12higherprobability of being engaged in TEA or new business than individuals livingin rural areas.

Ethiopian Journal of Economics Vol. XXIV No 1, April 2015
159
Table 10: Probit Regression result: determinants of total early stage entrepreneurship (TEA)Coefficient estimates Marginal effect
Age in years 0.0419* -0.00139*(0.0220) (0.000712)
Age squared -0.000788**(0.000306)
Male dummy 0.0382 0.00659(0.0684) (0.0118)
Dummy for media attention given to successful entrepreneurs 0.0486 0.00837(0.0875) (0.0151)
Dummy for considering entrepreneurship as a good career choice -0.0264 -0.00455(0.0796) (0.0137)
Dummy for knowing someone in the business 0.485*** 0.0837***(0.0808) (0.0139)
Urban dummy 0.677*** 0.117***(0.0905) (0.0152)
Dummy for pre-primary education -0.434** -0.0749**(0.201) (0.0347)
Dummy for first cycle primary education -0.0108 -0.00187(0.155) (0.0267)
Dummy for second cycle primary education 0.0620 0.0107(0.142) (0.0245)
Dummy for secondary and preparatory school 0.0726 0.0125(0.131) (0.0227)
Dummy for technical and vocational training -0.00756 -0.00130(0.188) (0.0324)
Dummy for traditional/religious school -0.133 -0.0230(0.174) (0.0301)
Dummy for individuals in the income group 0 to 5,000 0.0781 0.0135(0.205) (0.0354)
Dummy for individuals in the income group 5,001 to 10,000 0.0553 0.00954(0.195) (0.0336)
Dummy for individuals in the income group 10,001 to 20,000 0.111 0.0192(0.192) (0.0331)

Wolday, Tassew, Eyoual, and Aregawi: The Characteristics and Determinants of Entrepreneurship
160
Coefficient estimates Marginal effectDummy for individuals in the income group 20,001 to 40,000 0.147 0.0253
(0.194) (0.0335)Dummy for individuals in the income group 40,001 to 100,000 0.373* 0.0643*
(0.198) (0.0342)Region dummy for Tigray 0.350* 0.0604*
(0.183) (0.0314)Region dummy for Afar 0.522* 0.0899*
(0.309) (0.0532)Region dummy for Amhara -0.239 -0.0412
(0.161) (0.0276)Region dummy for Oromia -0.126 -0.0218
(0.149) (0.0258)Region dummy for Somalia -0.568** -0.0980**
(0.227) (0.0393)Region dummy for SNNP 0.0658 0.0113
(0.155) (0.0267)Region dummy for Benishangul Gumuz -0.535 -0.0922
(0.371) (0.0642)Region dummy for Harari -0.712 -0.123
(0.635) (0.109)Region dummy for Dire Dawa 0.225 0.0388
(0.369) (0.0636)Dummy for fear of failure -0.182*** -0.0306***
(0.0701) (0.0115)Constant -2.107***
(0.442)Number of observations 2,827Pseudo R2 0.167
Robust standard errors in parenthesesThe standard errors of the marginal effects are calculated using Delta method.*** p<0.01, ** p<0.05, * p<0.1

Ethiopian Journal of Economics Vol. XXIV No 1, April 2015
161
4. Conclusions
The findings of the study reveal that about 53% of the adults in Ethiopia arepotential entrepreneurs. The perceived opportunity rate in Ethiopia (65%) isabove the average for factor-driven economies (63%); while the perceivedcapabilities rate (69%) is below the average for factor-driven economies(71%). Ethiopia’s rate of entrepreneurial intention (22%) is much lower thanthe average rate for factor-driven economies (49%) and Sub-Saharan Africancountries (53%). The early-stage entrepreneurial activity rate (12.2%) is alsofar below the average for factor-driven economies (23.7%). Similarly, theestablished business activity rate (8.3%) is below the average for factor-driven countries (11%) and for Sub-Saharan Africa(12.8%).Furthermore,demographic variables such as age, level of education, societal attitudetowards entrepreneurship, and social networks (knowing someone inbusiness) are significant in influencing potential entrepreneurship andentrepreneurial intensions in Ethiopia. Besides, adults living in urban areasare found to have a higher probability of being engaged in early-stageentrepreneurial activity (TEA) than individuals living in rural areas. "Fear offailure" is found to have a negative and statistically significant effect onearly-stage entrepreneurial activity (TEA).
The low rate of perceived capabilities, entrepreneurial intension and higherpercentage of adults who fear a failure in starting and running business canbe partly addressed by revisiting and developing tailored interventions in theeducational system as a whole. There is also a need to promoteentrepreneurial education in order to change the attitude of the entire society.The low rate of early-stage entrepreneurial activity (TEA) and establishedbusiness in Ethiopia can be improved by expanding the quantity and qualityof support services, such as: training (technical and business developmentservices); extension and mentoring services; production and marketingservices; infrastructure support; backward and forward market linkages;access to sub-contracting; technological support; one-stop-shop services;access to finance; creating an enabling policy and regulatory environment;and developing incentive mechanisms to small and new businesses. Sincethe rate of potential entrepreneurship, early-stage entrepreneurial activity,and established businesses vary from region to region or between urban andrural areas, there is a need to develop region-specific entrepreneurial

Wolday, Tassew, Eyoual, and Aregawi: The Characteristics and Determinants of Entrepreneurship
162
development plan. Moreover, the study provides a unique data base (the firstof its kind) on the characteristics and determinants of entrepreneurship inEthiopia, which can be used to develop national entrepreneurship strategy,consistent with the MSE development strategy and other macro and sectorallevel strategies.

Ethiopian Journal of Economics Vol. XXIV No 1, April 2015
163
References
Evans, D. S., & Jovanovic, B. (1989). An estimated model of entrepreneurial choiceunder liquidity constraints. The Journal of Political Economy, 808-827.
Evans, D. S., & Leighton, L. S. (1989). Some empirical aspects ofentrepreneurship. The American Economic Review, 79(3), 519-535.
Federal Democratic Republic of Ethiopia Ministry of Finance and EconomicDevelopment. (2013). Annual Progress Report for F.Y. 2011/12 Growthand Transformation Plan.
Griffiths, M. D., Gundry, L. K., & Kickul, J. R. (2013). The socio-political,economic, and cultural determinants of social entrepreneurship activity: Anempirical examination. Journal of Small Business and EnterpriseDevelopment, 20(2), 341-357.
Lewin, P. (2012). Perceptions of Opportunities – Part 1. Retrieved fromOrganizations and Markets: http://organizationsandmarkets.com
Nykvist, J. (2008). Entrepreneurship and liquidity constraints: Evidence fromSweden. The Scandinavian Journal of Economics, 110(1), 23-43.
Stephen, F. H., Urbano, D., & van Hemmen, S. (2005). The impact of institutions onentrepreneurial activity. Managerial and Decision Economics,26(7), 413-419.
Turton, N. and Herrington, M. (2012).Global Entrepreneurship Monitor 2012 SouthAfrica report.
World Economic Forum. (2012). The Global Competitiveness Report 2012.Xavier, S., Kelley, D., Kew, J., Herrington, M., and Vorderwülbecke, A. (2012).The
Global Entrepreneurship Monitor2012 Global report.
Wolday, Tassew, Eyoual, and Aregawi: The Characteristics and Determinants of Entrepreneurship
164
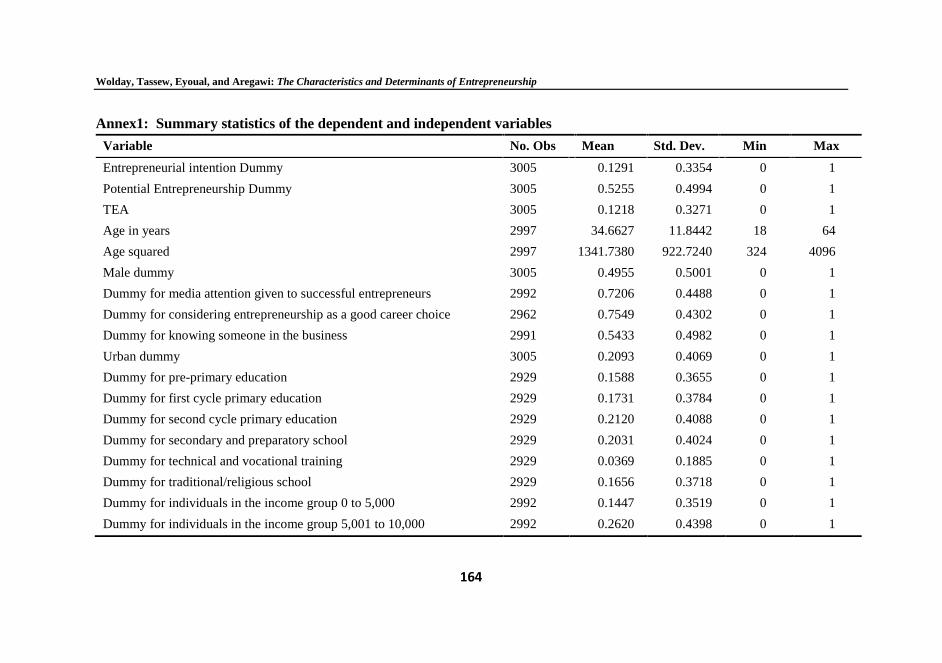
Annex1: Summary statistics of the dependent and independent variables
Variable No. Obs Mean Std. Dev. Min Max
Entrepreneurial intention Dummy 3005 0.1291 0.3354 0 1
Potential Entrepreneurship Dummy 3005 0.5255 0.4994 0 1
TEA 3005 0.1218 0.3271 0 1
Age in years 2997 34.6627 11.8442 18 64
Age squared 2997 1341.7380 922.7240 324 4096
Male dummy 3005 0.4955 0.5001 0 1
Dummy for media attention given to successful entrepreneurs 2992 0.7206 0.4488 0 1
Dummy for considering entrepreneurship as a good career choice 2962 0.7549 0.4302 0 1
Dummy for knowing someone in the business 2991 0.5433 0.4982 0 1
Urban dummy 3005 0.2093 0.4069 0 1
Dummy for pre-primary education 2929 0.1588 0.3655 0 1
Dummy for first cycle primary education 2929 0.1731 0.3784 0 1
Dummy for second cycle primary education 2929 0.2120 0.4088 0 1
Dummy for secondary and preparatory school 2929 0.2031 0.4024 0 1
Dummy for technical and vocational training 2929 0.0369 0.1885 0 1
Dummy for traditional/religious school 2929 0.1656 0.3718 0 1
Dummy for individuals in the income group 0 to 5,000 2992 0.1447 0.3519 0 1
Dummy for individuals in the income group 5,001 to 10,000 2992 0.2620 0.4398 0 1

Ethiopian Journal of Economics Vol. XXIV No 1, April 2015
165
Dummy for individuals in the income group 10,001 to 20,000 2992 0.3132 0.4639 0 1
Dummy for individuals in the income group 20,001 to 40,000 2992 0.1668 0.3728 0 1
Dummy for individuals in the income group 40,001 to 100,000 2992 0.0876 0.2827 0 1
Region dummy for Tigray 3005 0.0586 0.2349 0 1
Region dummy for Afar 3005 0.0196 0.1388 0 1
Region dummy for Amhara 3005 0.2346 0.4238 0 1
Region dummy for Oromia 3005 0.3651 0.4815 0 1
Region dummy for Somalia 3005 0.0606 0.2386 0 1
Region dummy for SNNP 3005 0.2023 0.4018 0 1
Region dummy for Benishangul Gumuz 3005 0.0106 0.1027 0 1
Region dummy for Harari 3005 0.0027 0.0515 0 1
Region dummy for Dire Dawa 3005 0.0047 0.0681 0 1