the changing population of texas government finance officers association of texas october 25, 2012...
TRANSCRIPT

The Changing Population of Texas
Government Finance Officers Association of Texas
October 25, 2012San Marcos, TX

2
Growing States, 2000-2010
2000Population*
2010Population*
NumericalChange
2000-2010
PercentChange
2000-2010
United States 281,421,906 308,745,538 27,323,632 9.7%
Texas 20,851,820 25,145,561 4,293,741 20.6%
California 33,871,648 37,253,956 3,382,308 10.0%
Florida 15,982,378 18,801,310 2,818,932 17.6%Georgia 8,186,453 9,687,653 1,501,200 18.3%
North Carolina 8,049,313 9,535,483 1,486,170 18.5%
Arizona 5,130,632 6,392,017 1,261,385 24.6%
Population values are decennial census counts for April 1 for 2000 and 2010.
Source: U.S. Census Bureau. 2000 and 2010 Census Count.
65% (2.8 million) of this change can be attributed to growth of the Hispanic population

3
Percent Change Due to
Year* PopulationNumerical
ChangePercentChange
NaturalIncrease
NetMigration
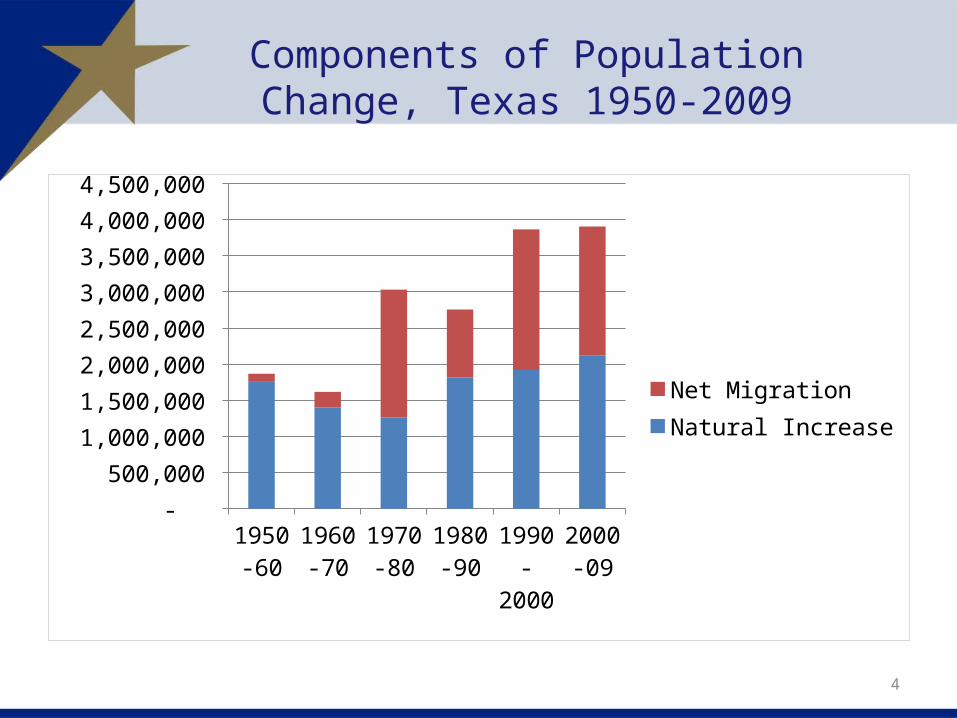
1950 7,711,194 -- -- -- --
1960 9,579,677 1,868,483 24.2 93.91 6.09
1970 11,196,730 1,617,053 16.9 86.74 13.26
1980 14,229,191 3,032,461 27.1 41.58 58.42
1990 16,986,510 2,757,319 19.9 65.85 34.15
2000 20,851,820 3,865,310 22.8 49.65 50.35
2009 24,782,302 3,930,484 18.8 54.04 45.33
2010 25,145,561 4,293,741 20.6
2011 25,674,681 529,120 2.1 54.79 44.99
* All values for the decennial dates are for April 1st of the indicated census year. Values for 2009 and 2011 are for July 1 as estimated by the U.S. Census Bureau.
Source: Derived from U.S. Census Bureau Estimates for dates indicated by the Texas State Data Center, University of Texas at San Antonio.Note: Residual values are not presented in this table.
Total Population and Components of Population Change in Texas, 1950-2011
4
Components of Population Change, Texas 1950-2009
1950-60 1960-70 1970-80 1980-90 1990-2000
2000-09 -
500,000
1,000,000
1,500,000
2,000,000
2,500,000
3,000,000
3,500,000
4,000,000
4,500,000
Net MigrationNatural Increase

5
0
50,000
100,000
150,000
200,000
250,000
2000 to 2001
2001 to 2002
2002 to 2003
2003 to 2004
2004 to 2005
2005 to 2006
2006 to 2007
2007 to 2008
2008 to 2009
International
State-to-State
Source: U.S. Bureau of the Census 2009 Estimates
Estimated Annual Net Migration to Texas, 2000 to 2009

6
Percent of Migrants to Texas between 2000 and 2009 by Race and Ethnicity
Net domesti
c migr
ation
Internati
onal migr
ation
Total0%
10%20%30%40%50%60%70%80%90%
100%
44%24% 33%
28%50% 40%
23% 8% 15%
5%18% 12%
OtherBlackHispanicWhite
67% of all migrants
Sources: Percentages of domestic and international migrants by race and ethnicity derived from the 2006-2008 American Community Survey. Total numbers of domestic and international migrants between 2000-2009 are from Table 4. Cumulative Estimates of the Components of Resident Population Change for the United States, Regions, States, and Puerto Rico: April 1, 2000 to July 1, 2009, U.S. Census Bureau
(848,702 migrants ) (933,083 migrants)
52% of all migrants were international

7
Estimated domestic migration (2000-2008) by county as a percentage of 2000 population
Source: Population Division, U.S. Census Bureau, March 19, 2009. Map produced by the Texas State Data Center
Legend
-20 to -45%
-19 to -10%
-9 to -5%
-4 to 0%
1 to 5 %
6 to 20%
21 to 30%
31 to 65%

8
Estimated international migration (2000-2008) by county as a percentage of 2000 population
Source: Population Division, U.S. Census Bureau, March 19, 2009. Map produced by the Texas State Data Center
Legend
0-1%
1-2.5%
2.5-3.5%
3.5-5%
5-10%

9http://www.forbes.com/special-report/2011/migration.html

10
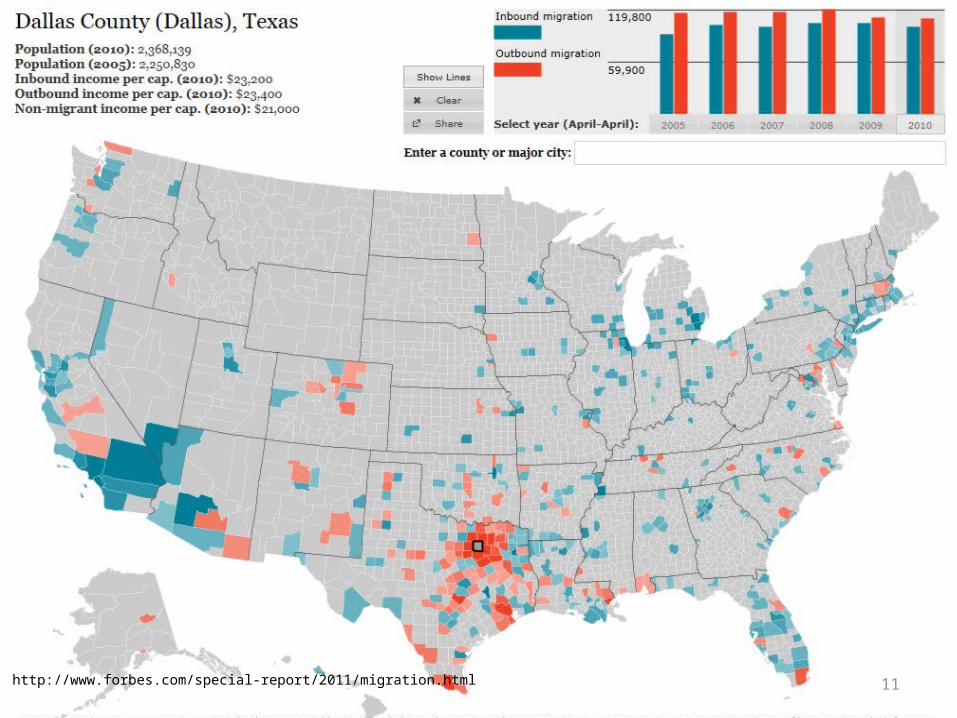
11http://www.forbes.com/special-report/2011/migration.html

12http://www.forbes.com/special-report/2011/migration.html

13
http://www.forbes.com

14
States with Largest Estimated Unauthorized Immigrant Populations, 2010
State Estimate (thousands)
Range
California 2,550 (2,350 - 2,750)
Texas 1,650 (1,450 - 1,850)
Florida 825 (725 - 950)
New York 625 (525 - 725)
New Jersey 550 (425 - 650)
Illinois 525 (425 - 625)
Georgia 425 (300 - 550)
Arizona 400 (275 - 500)
Source: Pew Hispanic Center estimates based on residual methodology applied to March Supplements to the Current Population Survey (February 1, 2011).
6.5% of Texas’ 2010 Population

Texas Racial and Ethnic Composition, 2000 and 2010
NH White53%
NH Black12%
NH Other
4%
Hispanic or Latino
32%
2000
NH White45%
NH Black11%
NH Other
6%
His-panic or Latino38%
2010
Source: U.S. Census Bureau. 2000 and 2010 Census count

16
Texas White (non-Hispanic) and Hispanic Populations by Age, 2010
Under 1 year13 years 26 years 39 years 52 years 65 years 78 years 91 years0
50000
100000
150000
200000
250000
White (non-Hispanic)
Hispanic
Age
Popu
latio
n
Source: U.S. Census Bureau 2010 Decennial Census, SF1

Under 1 year4 years8 years
12 years16 years20 years24 years28 years32 years36 years40 years44 years48 years52 years56 years60 years64 years68 years72 years76 years80 years84 years88 years92 years96 years
100 to 104 years
200,000 150,000 100,000 50,000 0 50,000 100,000 150,000 200,000
White M Hispanic M Black M Asian M Other MWhite F Hispanic F Black F Asian F Other F
Texas Population Pyramid by Race/Ethnicity, 2010
17Source: U.S. Census Bureau 2010 Decennial Census, SF1

18Under 1 year
4 years8 years
12 years16 years20 years24 years28 years32 years36 years40 years44 years48 years52 years56 years60 years64 years68 years72 years76 years80 years84 years88 years92 years96 years
100 to 104 years
200,000 150,000 100,000 50,000 0 50,000 100,000 150,000 200,000
White Male White Female
Texas Population Pyramid by Race/Ethnicity, 2010
Source: U.S. Census Bureau 2010 Decennial Census, SF1

19Under 1 year
4 years8 years
12 years16 years20 years24 years28 years32 years36 years40 years44 years48 years52 years56 years60 years64 years68 years72 years76 years80 years84 years88 years92 years96 years
100 to 104 years
200,000 150,000 100,000 50,000 0 50,000 100,000 150,000 200,000
Hispanic M Black M Asian M Other MHispanic F Black F Asian F Other F
Texas Population Pyramid by Race/Ethnicity, 2010
Source: U.S. Census Bureau 2010 Decennial Census, SF1

20
Total Population by County, 2010
Source: U.S. Census Bureau 2010 Decennial Census
Legend
co48_d00
'PROJECTIONS X$'.totpop10
82 - 10,000
10,001 - 50,000
50,001 - 100,001
100,001 - 500,001
500,001 - 1,000,000
1,000,001 - 4,100,000

21
Change of the Total Population by County, 2000 to 2010
Source: U.S. Census Bureau 2000 and 2010 Decennial Census
Legend
co48_d00
'PROJECTIONS X$'.totpopch0010
-3,200 - 0
1 - 10,000
10,001 - 50,000
50,001 - 100,000
100,001 - 700,000

22
Percent Change of Total Population in Texas Counties, 2000-2010
Population increase for Texas was 20.6% during this period
Source: U.S. Census Bureau, 2000 and 2010 Decennial Census
Water'PROJECTIONS X$'.pctch0010
-20%-0%
1%-10%
10.1-25%
25.1%-50%
50.1%-82%
Physicians per 1,000 Population 2010'PROJECTIONS X$'.difphys
-3 to -0.5
-0.49 to -.001
0
.001 to .5
.51-2.1

23Source: Texas State Data Center 2008 Population Projections
Year
Projected Population Growth in Texas, 2000-2040

24
0%
10%
20%
30%
40%
50%
60%
70%
2000
2002
2004
2006
2008
2010
2012
2014
2016
2018
2020
2022
2024
2026
2028
2030
2032
2034
2036
2038
2040
AngloBlackHispanicOther
Source: Texas State Data Center 2008 Population Projections, 2000-2007 Migration Scenario
Projected Racial and Ethnic Percent, Texas, 2000-2040

Percent Projected Change of Total Population in Texas Counties, 2008-2040
25

26
Educational Attainment in Texas, 2010
Level of Educational Attainment
Percent of persons aged 25 years and older
State Ranking
High school diploma or equivalency or greater
80.7% 49/50 (tied with CA)
Bachelors or greater 25.9% 31
Source: U.S. Census Bureau, American Community Survey, 2010.

27
Race/Ethnic Composition by Education Level aged 25 years and more, Texas, 2009
19%
6%
71%
3%
67%
8%
15%
9%
Source: Derived from 2009 American Community Survey 1-Year Estimates by the Office of the State Demographer.
Less Than High SchoolCollege and Greater

Projected Percent of Labor Force by Educational Attainment in Texas, 2000 and 2040
* Projections are shown for the 1.0 scenario
18.8
29 28.7
18.2
5.3
30.128.7
23.9
12.9
4.4
No High School Diploma
High School Graduate
Some College
Bachelor's Degree
Graduate/Prof.Degree
0
5
10
15
20
25
30
35
Percent
2000 2040

$18,000-30,000
$ 30,000-35,000
$ 35,000-40,000
$40,000-50,000
$ 50,000-76,000
Median Household Income by County, 2006-2008
Source: U.S. Census Bureau, American Community Survey, 3-Year Sample 2006-200829

Percent of Population Less than 18 Years of Age, Living Below Poverty During Past 12 Months,
2006-2008
Source: U.S. Census Bureau, American Community Survey, 3-Year Sample 2006-2008
5-20%
20-30%
30-40%
40-55%
30

Latino Anglo Black Asian Other0
10
20
30
40
50
60
70
80
38
14
23 21 2125
2228
11
21
40
76
54
7064
None Public Private
Source: American Community Survey Microdata, 2008
% Health Insurance Coverage by EthnicGroup and Type, Texas, 2008
31

32
Teen Birth Rate by State, 2010
Source: National Center for Health Statistics at the Centers for Disease Control and Prevention
Rank State Birth rate per 1,000 women ages 15-19
1 Mississippi 552 New Mexico 52.93 Arkansas 52.54 Texas 52.25 Oklahoma 50.46 Louisiana 47.77 Kentucky 46.28 District of Columbia 45.49 West Virginia 44.8
10 Alabama 43.6

33
Projected Increase in Obesity in Texas by Ethnicity, 2006 to 2040
Source: Office of the State Demographer projections, using 2000-2004 migration scenario population projections

34
Demographics and Destiny

35
Contact
Office: (512) 463-8390 or (210) 458-6530Email: [email protected]: http://osd.state.tx.us
Lloyd Potter, Ph.D.