the changing polish food consumer - agecon...
TRANSCRIPT

Advancing Knowledge AboutProcessing, Distribution,Sales, and Food Service
Working Paper 98-02The Retail Food Industry Center
University of MinnesotaPrinted Copy $22.50
THE CHANGING POLISH FOOD CONSUMER *
Michal Sznajder and Benjamin Senauer**
August 1998
* A Polish version of this paper appears as the final chapter in the book, "Zmieniajacy SieKonsument Zywnosci" by Michal Sznajder, Ben Senauer, Elaine Asp and Jean Kinsey, Poznan,Poland: Horyzont, 1998. This paper is also to be presented at The Fifth Congress of the PolishAssociation of Agricultural and Agribusiness Economists to be held in Wroclaw, Poland andPrague, September 22-25, 1998. The authors wish to thank The Retail Food Industry Center forits financial support of this project.
** The authors are Professor and Chair of the Department of Agricultural Economics at PoznanUniversity in Poland and Professor of Applied Economics and Director of the Center forInternational Food and Agricultural Policy at the University of Minnesota, respectively.

THE CHANGING POLISH FOOD CONSUMER
Michal Sznajder and Benjamin Senauer
ABSTRACT
This paper provides an overview of major demographic and food trends in Poland and therapid changes in Polish food retailing. The demographic changes include the size of thepopulation; birth, death, marriage and divorce rates; the age distribution, education and householdtypes. Two important demographic factors that will affect food consumption are the agingpopulation and the major gap in education between urban and rural areas. In the next 20 years,the number of children will decrease radically, whereas the number of people over 64 years of agewill rise significantly. Education levels are much lower in rural than in urban areas.
The average household budget share for food was 44.6% in 1988. It reached 55.3% in1990 at the beginning of the transition to a market economy and fell to 37.8% in 1996. Undercentral planning, consumers had to adjust to what was made available. There was a limitedassortment of goods and many people relied on home-produced food. Since 1989 and thetransition to a market economy, food consumption patterns have undergone some substantialchanges. Butter consumption has fallen sharply, while plant fat consumption has increased withthe introduction of high quality margarine.
The change from central planning to a market economy has had a major impact on foodretailing. U.S. fast food companies, such as McDonald's, have opened numerous outlets inPoland during the 1990s. Fast food is very popular, especially among young Poles. Under centralplanning, three government-owned chains dominated grocery retailing in Poland. The foodmarketing system was producer, not consumer driven. When the right to own private businesseswas restored, many new food retailing stores were opened.
In 1996, final sales by food retailing stores in Poland were about $100 billion. A largeportion of the sales is by small shops. However, foreign-owned grocery retailers have beenexpanding in Poland and had sales of $5 billion in 1997. The foreign-owned chains open largerstores, supermarkets and even hypermarkets. Many of the major Western European food retailersare now operating in Poland, such as Ahold, a big Dutch company, and Tengelman, a largeGerman company.

Working Paper 98-02The Retail Food Industry CenterUniversity of Minnesota
THE CHANGING POLISH FOOD CONSUMER
Michal Sznajder and Benjamin Senauer
The analysis and views reported in this paper are those of the authors. They are not necessarilyendorsed by the Department of Applied Economics, by The Retail Food Industry Center, by theState of Minnesota, or by the University of Minnesota.
The University of Minnesota is committed to the policy that all persons shall have equal access toits programs, facilities, and employment without regard to race, color, creed, religion, nationalorigin, sex, age, marital status, disability, public assistance status, veteran status, or sexualorientation.
For information on other titles in this series, write The Retail Food Industry Center, University ofMinnesota, Department of Applied Economics, 1994 Buford Avenue, 317 Classroom OfficeBuilding, St. Paul, Minnesota 55108-6040, USA, phone Mavis Sievert (612) 625-7019, or [email protected]. Also, for more information about the Center and for full text ofworking papers, check our World Wide Web Site [http://trfic.umn.edu].

�
THE CHANGING POLISH FOOD CONSUMER
Michal Sznajder and Benjamin Senauer
Major food trends have been changing over time in Poland, especially within the last ten
years. The system of a centrally planned economy effectively hampered development of
consumption and consumers' needs. The transition from a centrally planned economy to a market
economy brought a revolution in the eating patterns of the Polish people. Many different factors
affect food consumption. The most important are: demographic trends, the structure of
households and their incomes, eating habits, and finally development of the food industry and
trade.
DEMOGRAPHIC CHANGES
Population changes and other demographic factors are of great importance in determining
food consumption trends. Demographic indicators and analyses are crucial knowledge for
marketing. Demography gives essential information about potential customers, provides a basis
for segmentation of the market and indicates consumer trends.
Size of the population
Poland with a population of about 38.6 million in 1996 was the 8th largest country in
Europe and 29th largest in the world. Following the population's development over time is very
difficult because of the frequent changes in Poland's borders. It was estimated that just before
World War II about 35.1 million people lived in Poland, of this about 60% were of Polish

�
ancestry. After the War in 1946, Poland´s population was about 23.9 million. Because of the
Nazi policy demanding the extermination of the Polish nation, warfare, border shifts and
migration, Poland suffered substantial population losses. In addition to the losses during the War,
there was also a decrease in births typical in periods of extreme hardship. However, after the
War, from 1946 Poland's population increased. The urban population grew more than three fold
while the rural population remained almost constant. Depopulation of some rural areas occurred
and decreases in the rural population may become more significant in the future.
The distribution of population in Poland is quite unequal and concentrated in certain areas.
Warsaw, Lodz, Katowice, Cracow and Bielsko-Biala voivodships (regions) have the highest
population density. On the other hand, the Suwalki region has the lowest population density.
Depopulation has intensified in some areas of Poland, affecting larger and larger areas of the
country, especially Jelenia Góra, Walbrzych, Olsztyn and Suwalki voivodships. At present, the
area of greatest depopulation is near the eastern border of Poland. Depopulation of rural areas is
occurring in a considerable part of the country.
8KVCN UVCVKUVKEU QH VJG RQRWNCVKQP
6JG XKVCN UVCVKUVKEU QH C RQRWNCVKQP KPENWFG DKTVJU� FGCVJU� OCTTKCIG CPF FKXQTEGU� $KTVJU
CPF FGCVJU FGVGTOKPG VJG RQRWNCVKQP ITQYVJ TCVG� 9KVJKP VJG URCEG QH VJG NCUV EGPVWT[ VJGTG
YCU C U[UVGOCVKE FGETGCUG KP VJG DKTVJ TCVG HTQO �� RGT ����� RGQRNG KP ���� VQ ���� KP ����
CPF KP VJG FGCVJ TCVG HTQO �� VQ �� RGT ����� RGQRNG� 1XGT VJG UCOG VKOG VJG DKTVJ TCVG JCU
DGGP OQTG XCTKCDNG� JQYGXGT KP IGPGTCN� KV JCU DGGP FGETGCUKPI� # TCRKF KPETGCUG KP VJG DKTVJ
TCVG QEEWTTGF CHVGT 9QTNF 9CT ++ YJKEJ YCU FGHKPGF CU C FGOQITCRJKE GZRNQUKQP� +P TGEGPV

�
[GCTU VJG DKTVJ TCVG FGENKPGF CPF RQRWNCVKQP ITQYVJ KU PGCT \GTQ� 6JG EQPUGSWGPEGU QH VJKU YKNN
CRRGCT KP VJG UVTWEVWTG QH VJG RQRWNCVKQP�
6JG OCTTKCIG TCVG RGT ����� RGQRNG FGENKPGF SWKVG UJCTRN[ QXGT VKOG� GXGP OQTG KP
WTDCP CTGCU VJCP TWTCN CTGCU� 6JG FKXQTEG TCVG KU XGT[ NQY YJGP EQORCTGF YKVJ 9GUVGTP
'WTQRG CPF VJG 7PKVGF 5VCVGU� CNVJQWIJ VJG TCVG JCU KPETGCUGF GURGEKCNN[ KP WTDCP CTGCU� 6CDNG
� EQPVCKPU VJG XKVCN UVCVKUVKEU QH RQRWNCVKQP KP 2QNCPF HTQO ���� VQ ����� KPENWFKPI EJCPIGU KP
TWTCN CPF WTDCP CTGCU� $QVJ DKTVJ CPF FGCVJ TCVGU CTG JKIJGT KP TWTCN CTGCU VJCP KP WTDCP CTGCU�
Table 1. Vital statistics of population in Poland from 1946 to 1995 (per 1,000 people)
Years 1946 1955 1969 1976 1995Total
Marriages 11.9 9.5 8.3 9.5 5.4Divorces 0.3 0.5 1.0 1.1 1.0Births 26.2 29.1 16.3 19.6 11.2Deaths 10.2 9.6 8.1 8.9 10.0
Urban areas
Marriages 13.8 10.8 8.3 9.5 5.1Divorces 0.8 0.9 1.7 1.6 1.3Births 25.2 28.6 14.1 18.2 9.8Deaths 9.9 8.9 7.7 8.5 9.4
Rural areas
Marriages 10.9 8.4 8.3 9.5 5.8Divorces 0.1 0.2 0.3 0.4 0.4Births 26.7 29.5 18.7 21.3 13.5Deaths 10.3 10.1 8.5 9.5 11.0
Source: Statistical Yearbook, Central Statistical Office (CSO) 1997.

�
Age distribution of the Polish population
The age distribution of a population usually shows the percentage composition of people
by age and often by gender. A diagram of the age distribution can have different shapes
depending on the structure. The age distribution of young societies resembles a pyramid with a
wide base and a sharp vertex. For societies with little population growth and a large older
population, the shape may be closer to a rectangle with no more young than older people. The
age structure of the population in Poland changed quite considerably since World War II. In 1950
the age distribution of the Polish population was almost a pyramid with two distinct narrow bands
for 5-9 year olds and for 30-34 year old people, which resulted from both of the World Wars. By
1995 the structure changed from a pyramid to almost a rectangle. The age distribution of the
Polish population in 1995 is typical for an ageing society.
Projections of population development for the next 20-30 years are extremely important
for determining future economic activity. Table 2 shows projections of the age structure of the
Polish population for the years 2000, 2010, and 2020. According to those projections the
population is expected to increase by 1.8 million people during the next 20 years. However, the
number of children will decrease radically. The share of the population between 15 and 24 years
old will decrease substantially. The number of people over 64 years old will increase significantly
(by 1.8 million). The changes in the age structure of the Polish population will have a major
influence on food marketing. The food industry will need to focus increasingly on the needs of
older people.
�
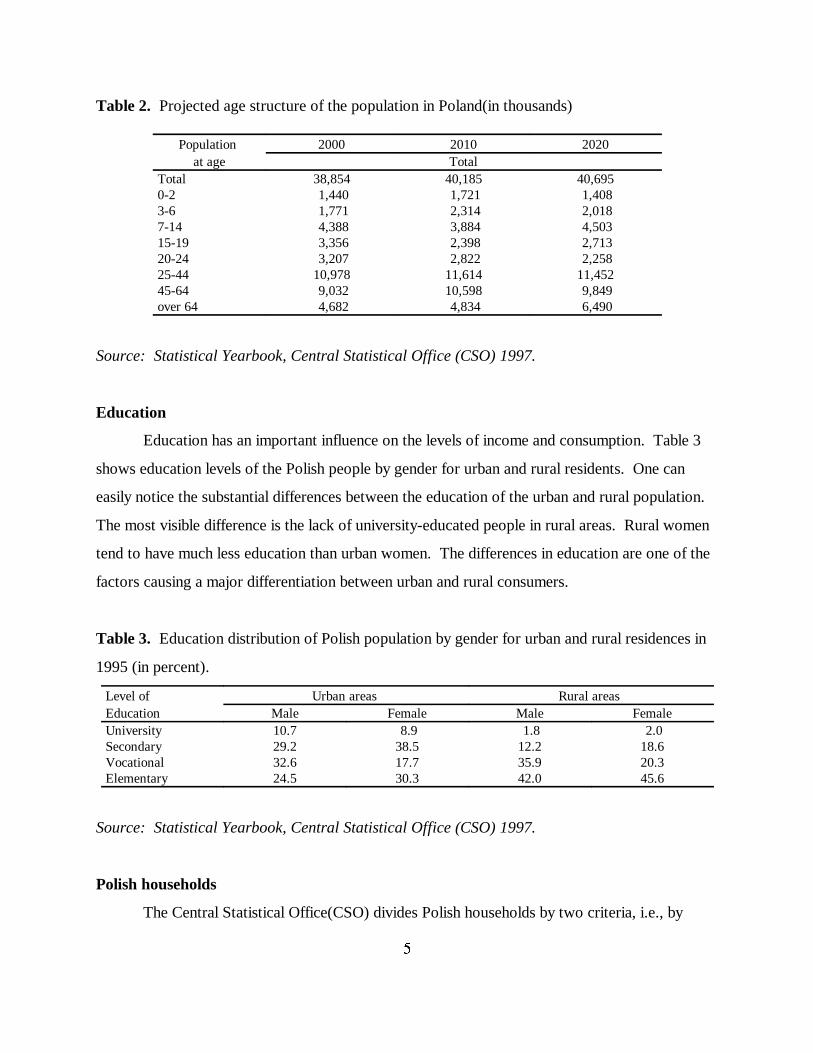
Table 2. Projected age structure of the population in Poland(in thousands)
Population 2000 2010 2020at age Total
Total 38,854 40,185 40,6950-2 1,440 1,721 1,4083-6 1,771 2,314 2,0187-14 4,388 3,884 4,50315-19 3,356 2,398 2,71320-24 3,207 2,822 2,25825-44 10,978 11,614 11,45245-64 9,032 10,598 9,849over 64 4,682 4,834 6,490
Source: Statistical Yearbook, Central Statistical Office (CSO) 1997.
Education
Education has an important influence on the levels of income and consumption. Table 3
shows education levels of the Polish people by gender for urban and rural residents. One can
easily notice the substantial differences between the education of the urban and rural population.
The most visible difference is the lack of university-educated people in rural areas. Rural women
tend to have much less education than urban women. The differences in education are one of the
factors causing a major differentiation between urban and rural consumers.
Table 3. Education distribution of Polish population by gender for urban and rural residences in
1995 (in percent).
Level of Urban areas Rural areas Education Male Female Male FemaleUniversity 10.7 8.9 1.8 2.0Secondary 29.2 38.5 12.2 18.6Vocational 32.6 17.7 35.9 20.3Elementary 24.5 30.3 42.0 45.6
Source: Statistical Yearbook, Central Statistical Office (CSO) 1997.
Polish households
The Central Statistical Office(CSO) divides Polish households by two criteria, i.e., by

�
source of income or socio-economic group and by the number of persons in a household. The
CSO used five socio-economic groups: workers' households, workers-farmers' households,
farmers' households, pensioners' households, and those working on their own. Since 1993
households of people receiving unearned sources of income have also been distinguished. Table 4
compares the number of households in Poland by socio-economic group and by number of
persons in the household.
Table 4. Number and structure of households by number of persons in 1996
Number of Householdspersons in ahousehold
Total Employee Employee- Farmer Pensioners Working Owningfarmers on their non-
own earnedsources
Workers Non-workers
Total 31,907 8,788 5,220 1,637 2,120 11,013 1,816 1,2771-person 4,399 303 423 7 59 3,392 49 1662-person 7,889 1,193 1,112 100 312 4,716 224 2323-person 6,739 2,291 1,489 223 430 1,562 427 3174-person 7,050 2,991 1,566 419 434 668 689 2835-person 3,389 1,323 468 397 402 380 275 144
6-person and 2,441 687 162 527 483 295 152 135more
Source: Statistical Yearbook, Central Statistical Office (CSO) 1997
*QWUGJQNF DWFIGVU CPF EQPUWORVKQP
6JG %51 UWTXG[ RTQXKFGU KPHQTOCVKQP CDQWV DWFIGVU CPF GZRGPFKVWTGU QH VJG
JQWUGJQNFU KP 2QNCPF� KPENWFKPI�
P #XGTCIG OQPVJN[ HQQF CPF DGXGTCIG GZRGPFKVWTGU D[ UQEKQ�GEQPQOKE CPF KPEQOG
ITQWR� KPENWFKPI OQTG VJCP �� ENCUUGU QH HQQFUVWHHU�
P #XGTCIG OQPVJN[ HQQF EQPUWORVKQP D[ UQEKQ�GEQPQOKE CPF KPEQOG ITQWR HQT VJG
HQQFUVWHHU OGPVKQPGF DGNQY 6CDNG ���

�
Table 5. Per capita average monthly consumption of selected food products by households in 1996
Specification Total Households ofEmployees Employe Farmers Working Pensioners Owning
e-farmers on their non-own earned
sourcesWorkers Non-
workersBakery products (kg)* 7.50 7.25 6.32 8.17 8.52 6.13 8.34 7.21Potatoes (kg) 8.50 7.50 6.06 9.08 9.88 6.36 11.14 8.52Fresh and processed 5.76 4.84 5.37 5.96 6.45 5.12 7.18 4.70leguminous, vegetables andmushrooms (kg)Fresh and processed fruits 3.76 3.04 4.80 3.14 3.37 4.56 4.42 2.26(kg)Meat (kg) 5.23 4.67 4.85 5.30 6.30 4.93 6.03 3.85Fats and oils (kg) 1.60 1.44 1.38 1.58 1.73 1.31 2.03 1.36Milk and dairy products (l) 6.80 5.05 5.33 8.91 9.72 5.38 8.66 5.28Cheese (kg) 0.80 0.65 0.96 0.78 0.72 0.84 0.96 0.48Eggs (pieces) 14.79 12.62 13.69 15.92 18.18 13.03 17.45 11.60 Sugar (kg) 1.94 1.64 1.49 2.29 2.47 1.42 2.48 1.53Fish and processed fish 0.45 0.40 0.47 0.34 0.40 0.45 0.58 0.30(kg)
Source: Statistical Yearbook. Central Statistical Office (CSO) 1997.
*1 kg = 2.2 pounds

�
Household budgets
The share of household income spent on overall food expenditures is lower in richer
societies, in accordance with Engel's Law. Engel's Law also states that the household budget
share of total food expenditures falls as household income rises. Table 6 shows the average
percentage of disposable household income devoted to total food expenditures in Poland from
1988 to 1996. Real incomes and living standards fell in 1990 at the beginning of the transition to
a market economy, but have risen since then.
Table 6. Household Budget Shares for Food (percent)
1988 1989 1990 1991 1992 1993 1994 1996
44.6 46.9 55.3 45.7 44.8 42.6 39.9 37.8
The Institute of Labor and Social Welfare (Instytut Pracy i Spraw Socjalnych) has
announced the poverty income guidelines (so-called minimum living wage) for Poland for about
20 years. A fixed consumer goods basket represents people's needs and prices of goods in the
basket are collected. There are four separate baskets for four family types, namely: one-person
and four-person workers' households, and one-person and two-person pensioners' households. A
so-called minimum existence level is also calculated. It was estimated in 1994 that 43.2% of the
people did not obtain a minimum living wage and 23.3% did not reach the minimum existence
level. The status of people receiving unearned sources of income was the most difficult and up to
89% of those households did not obtain even the minimum. In spite of the prevailing opinion,
pensioners were situated better than average and only 38.6% of them did not obtain the minimum.

�
CHANGES IN POLISH CONSUMER EATING BEHAVIOR
Eating patterns in Poland has been changing continuously over time. Over many centuries
distinct regional and social differences appeared. In the Nineteenth Century potatoes became very
popular and a major part of the diet. In periods of shortage, potatoes were even used for baking a
type of bread. Flour was the other basic product, especially rye flour. Since the beginning of the
Twentieth Century bread has been an important part of the diet. Traditionally, food processing
and preparation took place mainly on farms and in homes. Only in the last few years has the
purchase of prepared foods become popular.
Consumption patterns during the centrally planned economy
Consumer trends and development of the food processing industry and trade in Poland
reflect many of the changes in other parts of the world. However, under the two totalitarian
systems imposed first during World War II by the Nazis and then by the Communists with a
centrally planned economy, Polish consumers, industry and trade were excluded from the
mainstream of changes for almost 50 years. Losses caused by that situation were more painful
because those years were a period of revolutionary changes in consumer tastes and preferences, in
food processing technologies and systems of trade.
During that period in Poland, knowledge and analysis of the food consumer seemed
absolutely pointless. Consumers had to adjust to what the centrally planned economic system
made available. Very low earnings, about $10 to $20 a month, also limited consumption.
However, it does not mean that consumers did not change in spite of the difficult conditions.
Consumer behavior in that period was conditioned by the following factors:
��
• Arbitrary government decisions regarding the level of consumption with a system of
coupons or availability of commodities with a limited assortment of goods,
• The need to ensure family food security through own home-produced food and household
reserves of food,
• The appreciation of cooking ability as a way to achieve variety and quality in the diet even
with the limited availability of foodstuffs.
Several examples of changing consumer behavior in that time can be given. The state
promotion of low-fat milk is one of the most interesting examples of shaping consumer tastes in
Poland in the 1960s. At that time in democratic countries with market economies, low-fat milk
was promoted as healthier and consumers were encouraged to buy such milk. The dairy industry
responded to that new food trend by delivering low-fat milk to the market. In Poland, the
Communist authorities arbitrarily decided to limit the whole milk supply. Unprepared for such a
change, Polish consumers were very dissatisfied because of the decision and viewed it as another
symptom of economic crisis. After 20 years when the free market was restored, Polish consumers
could freely return to whole milk. However, tastes had changed and very few people wanted to
buy whole milk then. In general, consumers' wants and needs did not develop under the centrally
planned economy. The collapse of the system was the beginning of revolutionary changes in
consumption patterns and the emergence of a new Polish consumer.

��
Present consumption patterns
In 1997, several years after the introduction of a market economy,2QNGU YGTG UWTXG[GF
D[ VJG %GPVGT HQT VJG 5WTXG[ QH 2WDNKE 1RKPKQP %1$15� CDQWV EJCPIGU KP VJGKT HQQF GCVKPI
RCVVGTPU� #NOQUV JCNH QH VJG RGQRNG ���� VJQWIJV VJG[ CVG JGCNVJKGT HQQF VJCP VGP [GCTU CIQ�
YJGTGCU ��� QH VJQUG KPVGTXKGYGF JCF PQV QDUGTXGF CP[ EJCPIGU KP VJGKT FKGV� #DQWV ��
EQWNF PQV EQORCTG VJGKT RTGUGPV HQQF EQPUWORVKQP RCVVGTPU YKVJ VJGKT QNF RCVVGTPU� ;QWPI
RGQRNG� K�G� RWRKNU CPF UVWFGPVU� OQUV QHVGP FKF PQV PQVKEG CP[ EJCPIGU� #DQWV ��� QH
KPFKXKFWCNU VJQWIJV VJCV VJGKT HCOKNKGU CVG NGUU JGCNVJ[ HQQF VJCP VGP [GCTU GCTNKGT� 6JG QRKPKQPU
CDQWV HQQF EQPUWORVKQP RCVVGTPU YGTG ENGCTN[ EQPPGEVGF YKVJ VJG NGXGN QH GFWECVKQP CPF
JQWUGJQNF KPEQOG� 6JG JKIJGT VJG GFWECVKQP NGXGN CPF VJG DGVVGT VJGKT GEQPQOKE UKVWCVKQP VJG
OQTG QHVGP RGQRNG HGNV VJGKT EWTTGPV FKGV YCU JGCNVJKGT�
6JG NCTIG RTKEG KPETGCUGU HQT OCP[ HQQFUVWHHU� VJG KPVTQFWEVKQP QH OCP[ PGY HQQF
RTQFWEVU CPF GXGP YJQNG PGY ECVGIQTKGU QH RTQFWEVU� CPF VJG RGTOCPGPV CXCKNCDKNKV[ QH CNN
HQQFUVWHHU YKVJ C OCTMGV GEQPQO[ JCXG NGF VQ C UWFFGP CPF FGGR EJCPIG KP HQQF EQPUWORVKQP
RCVVGTPU CPF PWVTKGPV KPVCMG� 6JG ECNQTKE XCNWG QH VJG HQQF GCVGP JCU FGETGCUGF HTQO �����
MKNQECNQTKGU MECN� RGT FC[� RGT ECRKVC KP ���� VQ ����� MECN RGT FC[ KP ����� %QPUWORVKQP QH
CPKOCN HCVU JCU FGETGCUGF HTQO ��� ITCOU VQ �� ITCOU� 6JG OCKP TGCUQP HQT VJKU YCU VJG TCRKF
FGENKPG KP DWVVGT EQPUWORVKQP HTQO ��� MKNQITCOU MI� CPPWCNN[ RGT RGTUQP KP ���� VQ ��� MI
KP ���� CPF VJG FGETGCUG KP OGCV CPF YJQNG OKNM EQPUWORVKQP 6CDNG ���
*QYGXGT� VQVCN HQQF EQPUWORVKQP JCU TGOCKPGF CV PGCTN[ VJG UCOG NGXGN DGECWUG RNCPV
HCVU CPF QKNU TGRNCEGF CPKOCN HCVU� $GVYGGP ���� CPF ���� RNCPV HCV EQPUWORVKQP KPETGCUGF

��
HTQO CDQWV � MI RGT ECRKVC RGT [GCT VQ CNOQUV �� MI� YJKEJ YCU EQPPGEVGF YKVJ VJG KPETGCUG KP
OCTICTKPG EQPUWORVKQP� #HVGT ����� UQHV� GCU[�VQ�URTGCF OCTICTKPG� RTQFWEGF CEEQTFKPI VQ
9GUVGTP VGEJPQNQIKGU� CRRGCTGF QP VJG 2QNKUJ OCTMGV HQT VJG HKTUV VKOG� 6JG KPVTQFWEVKQP QH
DGVVGT CPF TGNCVKXGN[ EJGCR OCTICTKPG KP TGNCVKQP VQ DWVVGT YCU EQPPGEVGF YKVJ C PCVKQPCN
CFXGTVKUKPI ECORCKIP� 5WTXG[U QH JQOG DWFIGVU EQPHKTO VJG UJKHV�
Table 7. Per capita food consumption of selected products in kg, from 1988 to 1996
Years Cereals Meat and Fish Milk Butter Sugar Fruits andand processed vegetables
bakery meatproducts
1988* 117 68.3 6.5 271 8.8 50.0 1471989* 118 68.6 6.1 260 7.0 46.9 1471990* 115 68.6 5.4 241 6.2 44.1 1481991* 116 73.2 6.2 231 5.0 35.4 1631992* 119 70.3 6.4 217 4.1 36.3 1571993* 122 67.6 6.7 209 3.6 27.9 1671994* 120 62.6 6.7 202 3.8 24.7 1501995 118 61.6 6.5 196 3.7 23.7 1521996 118 62.8 6.5 193 3.7 23.5 149
Source: *Kramer J., Statistical Yearbooks, Central Statistical Office (CSO), 1989-1997.
Eating customs
In November 1997, the Center for the Survey of Public Opinion (COBOS) conducted a
survey of the eating habits of 1,000 adults in Poland. The results of the survey can be used to
characterize Polish eating behavior. More than a half of the people surveyed (about 52%) were
convinced that they eat a healthy diet whereas 38% claimed their diet was not very healthy. Only
about 5% thought their diet was very bad.

��
In general Poles were satisfied with their diet. Most were convinced that their diet
contained all the nutrients in the proper quantities. However, they felt they ate too little fish.
More than 56% of the people said they eat too little fish and 22% said that they consumed too
little milk, vegetables, and fruits. Some 10% claimed they eat too many vegetables and cereal
products. Almost 27% estimated they ate too many sweets, but one in seven would have liked to
eat them more. Only 20% of those interviewed considered their meals too fatty. It suggests that
Poles are not very aware of the danger of excess fat consumption given the high fat content of the
average diet.
Polish people appear to be rather conservative consumers. Some 70% of those
interviewed said they are not going to change their food consumption pattern and eating customs.
Of course, it depended on gender, age and place of residence. Women more often wanted to
change their eating behavior (33%) than men (26%), younger persons below 24 years old (34%)
than older people over 65 (13%), and urban residents than rural ones. Willingness to change
eating habits also depended on level of education, socio-economic position and income level.
Better educated and younger people, and individuals with higher incomes tended to be more
willing to change their eating patterns.
The freshness of purchased food was the most important attribute for the average
consumer. Some 31% of Poles always checked the expiration date and 26% often did it. Only
15% almost never checked the date of expiration. It was usually those over age 65 with only a
primary education, and more often men than women who never checked the expiration date.
Most Polish people (70%) never read information about the ingredients of food or they did it very
randomly. The purchase of so-called healthy food in Poland is not very popular. Some 32% of

��
interviewed Poles admitted that the appearance of fast food chains in Poland had influenced their
eating patterns (especially young people - about 56%).
FAST FOOD SERVICE
As a consequence of the collapse of the centrally planned economy, the Polish market
opened to foreign food retail chains and food service chains. Almost at once McDonald's, Burger
King, Kentucky Fried Chicken, Pizza Hut and other companies appeared in Poland. During the
1990s, they opened several outlets in different cities and they have become extremely popular
especially among young people. As the fast food markets in Western Europe and America
became saturated, the fast food companies expanded into Central and Eastern Europe and the
emerging economies in the Third World. Similar to other countries, as the value of time has risen
in Poland with better wages and salaries, people demanded more convenience food and wanted to
do less cooking. The prospects for fast food restaurants look very good in Poland as these trends
continue.
FOOD STORE RETAILING
During the period of central planning in Poland, food retailing was almost entirely
controlled by three state chains: PSS (General Consumers' Cooperative), GS (Village
Cooperative), and MHD (Municipal Retail Trade). PSS was responsible for food retailing in
Polish towns and cities, GS served rural areas, and MHD was responsible for the non-food retail
trade. In addition, there existed some small store chains, like Pewex or Baltona. Other small
private traders were involved in the marketing of fruits and vegetables.

��
Food marketing in a centrally planned economy was considered from the producer's
perspective, but not from the consumers'. Food supply was a result of arbitrary decisions
undertaken by state officials and it was particularly visible in the form of a central distribution list.
Those decisions had nothing in common with consumer demand. The activity of food wholesaling
was considered a state secret. The food retailing system in Poland consisted of numerous small
units.
Restoring a common right to undertake economic activity to the Polish people in the late
1980s resulted in an avalanche of interest in retail trade. Thousands of food retailing stores and
wholesalers were created during that time. At present there is not one universal system of food
retail stores in Poland. The food retailers can be divided into two general groups: traditional
small food stores and large stores -- supermarkets and hypermarkets. Final sales by all food
retailing stores in Poland were valued at 213 billion Polish zloty (about US $80 billion) in 1996
and around 300 billion zloty (about $100 billion) in 1997.
According to the results of the COBOS survey mentioned above, 80% of the Polish
people claim that low price is the most important attribute of a food product and then quality.
Because of that, up to 72% of surveyed consumers said they did their major foodstuff shopping
only in supermarkets. Some 16% chose bazaars or open air markets and 12% used conventional
shops not far from their homes. However, the proportion of people actually doing their shopping
in supermarkets and the other stores are exactly reversed.
Conventional shops
A large portion of final food retail sales is by small shops. There are 220 stores per every

��
10,000 inhabitants in Poland and that is above average for Europe. Usually these are very small
food shops with an average size up to 50 square meters (about 540 square feet). There are very
few stores over 400 square meters (about 4,300 square feet) in size, in all only 2,560 such stores.
Table 8 shows the number of food stores by their size. The size of stores has been increasing and
the process is expected to continue.
Table 8. Number of food stores in Poland by their size (in square meters)
Years Size of food stores > 50m 51-100 101-200 201-300 301-400 >400 m2 2
1993 347,650 19,875 8,189 2,075 867 1,9261994 383,064 10,421 8,072 2,035 863 1,9941995 391,297 20,268 8,563 2,238 1,003 2,2311996 369,976 20,661 8,929 2,377 1,110 2,560
Source: Mejssner M.
Supermarkets
In 1996 foreign-owned retail food store chains had sales of about 5 billion zloty ($1.90
billion) and it was estimated that in 1997 their sales reached 15 billion zloty ($5 billion). Table 9
shows the development of retail food stores with foreign capital in Poland.
Table 9. Number of stores with foreign capital from 1992 to 1997
Years 1992 1993 1994 1995 1996 1997Number of stores 331 336 483 748 925 1,100Share in total number of stores 0.09 0.09 0.12 0.18 0.23 0.30
Source: Mejssner M.
Foreign food retail chains entering the Polish market rarely adapt or build small stores.

��
Usually they build supermarkets which range in size from about 950 to 1,500 square meters
(about 10,000 to 16,000 square feet), hypermarkets of more than 2000 square meters (21,500
square feet), and discount stores with over 400 square meters (4,300 square feet) in area. They
organize shopping centers, distribution centers, and chains consisting of large self-service stores.
Some chains have only mail-order stores or use direct store delivery. Every year for the past
several years, the number of supermarkets and hypermarkets in Poland has almost doubled.
Among the chains which have already entered the Polish food market the following play the most
important role: Ahold & Allkauf Poland (a joint venture of the Dutch Royal Ahold and German
Allkauf group), Auchan, Biedronka, Billa Polen Ltd. (the Austrian concern Billa), EuroCash
Poland, Gent (a French commercial firm), Hit (the German Dohle group), Jumbo (the Portuguese
concern Geronimo Martins), Leclerc (a French association of traders), Makro Cash & Carry,
Metro AG (a German commercial firm), miniMAL (owned by the German firm Rewe), Netto (the
Danish Dank Supermarket), Plus Discount (the German firm Tengelman), Real Poland (the
German Metro group), Rema (the company of Norwegian Reitangruppen and Czech
Interkontakt), Savia (a joint-stock company with the main shareholder British Tesco corp.), and
Tip Discount (the German Metro AG group).
CONCLUSIONS
The eating patterns of Polish consumers are continuing to change rapidly, and thus, major
changes in the system of food sales and marketing will continue. Following these consumer
changes and projecting their future directions are of great importance for food processing and
manufacturing, and for food wholesaling and food retailing. The food industry both influences the

��
behavior of food consumers and, on the other hand, should be flexible enough to recognize and
meet the needs and wishes of the changing Polish food consumer.

��
REFERENCES
Baumann M. (1992) Po) ywienie ludowe i zwyczaje ) ywieniowe w Wielkopolsce w opracowaniu
zbiorowym Kuchnia wielkopolska wczoraj i dziœ. Wyd. Interfund Poznañ. (Country food and
food customs in Wielkopolska in a collective elaboration "Wielkopolska kitchen yesterday and
today," ed. Interfund Poznan).
COBOS - Centrum Badania Opinii Spolecznej (1997) komunikat z badañ Nawyki) ywieniowe:
Oceny, opinie, zachowania (COBOS B Centre for Survey of Public Opinion, the
announcement of eating habit survey: appraisal of the situation, opinions and behaviour).
Dlugosz Z. (1997) Ludnoœæ w Encyklopedii Geograficznej Œwiata, tom X - Polska. OPRES
Kraków (Population, Geographical Encyclopaedia of the World, volume X - Poland, ed.
OPRES, Cracow).
Kramer J. (1997) Konsumpcja w gospodarce rynkowej. PWE Warszawa (Consumption in
market economy, ed. PWE, Warsaw).
Mejssner M. (1998) Wielkie sieci handlowe B wymagajocy partner B raport. Rolnictwo nr 2
(417) BOSS (Food store chains - the demanding partner - report. Agriculture No 2 (417)
BOSS).
Mynarski S. i inni (1992) Badania przestrzenne rynku i konsumpcji. PWN Warszawa. (Spatial
survey of the market and consumption, ed. PWN, Warsaw).
Zatoñski W.A. (1997) Czy w demokracji ) yje siê zdrowiej?. Fundacja ̀Promocja Zdrowia@
Warszawa (Does one live more healthily in democracy? Ed. Health Promotion Foundation,
Warsaw).