the champ extended stellar survey (chess): photometric and
TRANSCRIPT
THE ChaMP EXTENDED STELLAR SURVEY (ChESS): PHOTOMETRIC AND SPECTROSCOPICPROPERTIES OF SERENDIPITOUSLY DETECTED STELLAR X-RAY SOURCES1
K. R. Covey,2,3,4
M. A. Agueros,2,5
P. J. Green,3D. Haggard,
6W. A. Barkhouse,
7J. Drake,
3
N. Evans,3V. Kashyap,
3D.-W. Kim,
3A. Mossman,
3D. O. Pease,
8and J. D. Silverman
9
Received 2008 March 16; accepted 2008 May 15
ABSTRACT
We present 348 X-ray-emitting stars identified from correlating the Extended Chandra Multiwavelength Project(ChaMP), a wide-area serendipitous survey based on archival X-ray images, with the SloanDigital Sky Survey (SDSS).We use morphological star/galaxy separation, matching to an SDSS quasar catalog, an optical color-magnitude cut, andX-ray data-quality tests to create our catalog, the ChaMP Extended Stellar Survey (ChESS), from a sample of 2121matched ChaMP/SDSS sources. Our cuts retain 92% of the spectroscopically confirmed stars in the original samplewhile excluding 99.6% of the 684 spectroscopically confirmed extragalactic sources. Fewer than 3% of the sources inour final catalog are previously identified stellar X-ray emitters. For 42 catalogmembers, spectroscopic classificationsare available in the literature.We present new spectral classifications and H�measurements for an additional 79 stars.The catalog is dominated by main-sequence stars; we estimate the fraction of giants in ChESS is�10%. We identifyseven giant stars (including a possible Cepheid and an RR Lyrae star) as ChaMP sources, as well as three cataclysmicvariables. We derive distances from �10 to 2000 pc for the stars in our catalog using photometric parallax relationsappropriate for dwarfs on the main sequence and calculate their X-ray and bolometric luminosities. These stars lie in aunique space in the LX-distance plane, filling the gap between the nearby stars identified as counterparts to sources inthe ROSATAll Sky Survey and the more distant stars detected in deep Chandra and XMM-Newton surveys. For 36newly identifiedX-ray-emittingM stars we calculate LH� /Lbol. The quantities LH� /Lbol and LX/Lbol are linearly relatedbelow LX/Lbol � 3 ; 10�4, while LH� /Lbol appears to turn over at larger LX/Lbol values. Stars with reliable SDSSphotometry have an �0.1 mag blue excess in u� g, likely due to increased chromospheric continuum emission.Photometric metallicity estimates suggest that the sample is evenly split between the young and old disk populationsof the Galaxy; the lowest activity sources belong to the old disk population, a clear signature of the decay of magneticactivity with age. Future papers will present analyses of source variability and comparisons of this catalog to modelsof stellar activity in the Galactic disk.
Subject headinggs: stars: activity — stars: chromospheres — stars: coronae — stars: flare — surveys —X-rays: stars
Online material: color figures, machine-readable tables
1. INTRODUCTION
While X-ray source counterparts are now known to rangefrom distant quasars to nearby active M dwarfs (e.g., Stockeet al. 1983, 1991; Schmitt et al. 1995; Zickgraf et al. 2003; Greenet al. 2004; Anderson et al. 2007), X-ray data alone are frequentlyinsufficient to determine unambiguously whether a given sourceis Galactic or extragalactic, or to make finer distinctions about itsnature. Campaigns to find optical counterparts to X-ray sourceshave therefore been natural companions to the creation of X-raysource lists since the days of the Einstein Observatory.
The Medium Sensitivity Survey (MSS; Gioia et al. 1984) andExtended Medium-Sensitivity Survey (Gioia et al. 1990) both
required painstaking programs to identify counterparts to sourcesserendipitously detected in Einstein observations. To find coun-terparts to 63 of the 112 MSS sources, Stocke et al. (1983) ob-tained spectra for all of the optical objects inside or just outsidethe X-ray 90% confidence positional error circles: areas of radius�3000 to 7000. Once they found a plausible counterpart by com-paring its fX/ fV to that of similar objects detected in pointedEinstein observations, Stocke et al. (1983) continued to collectspectra until they reached objects at least 4 times fainter than theproposed counterpart or the�20.5 mag limit of the Palomar Ob-servatory Sky Survey (POSS). They found that �25% of MSSsources were coronally emitting stars, primarily late-type dwarfs;they also found one cataclysmic variable (CV).
Similar efforts have been undertaken to identify some of the�125,000 sources included in theROSATAll SkySurvey (RASS)Bright and Faint Source Catalogs (BSC and FSC; Voges et al.1999).10 Only a relatively small fraction of RASS sources can beidentified from correlations to existing databases. Bade et al.(1998) found that 35% of the 80,000 RASS sources they consid-ered had counterparts in SIMBAD and the NASA/IPAC Extra-galacticDatabase. To identify otherBSC sources, Bade et al. (1998)used objective-prism spectra obtained as part of the HamburgQuasar Survey (HQS; Hagen et al. 1995) and found candidate
A
1 Observations reported here were obtained at the MMTObservatory, a jointfacility of the Smithsonian Institution and the University of Arizona.
2 The first two authors contributed equally to this study.3 Harvard-Smithsonian Center for Astrophysics, 60 Garden Street, Cam-
bridge, MA 02138.4 Spitzer Fellow.5 NSF Astronomy and Astrophysics Postdoctoral Fellow; Columbia Univer-
sity, Department of Astronomy, 550 West 120th Street, New York, NY 10027.6 NASA Harriett G. Jenkins Predoctoral Fellow; University of Washington,
Department of Astronomy, Box 351580, Seattle, WA 98195.7 Physics Department, University of North Dakota, Grand Forks, ND 58202.8 Space Sciences Lab, 7 Gauss Way, Berkeley, CA 94720-7450.9 Max-Planck-Institut fur extraterrestrische Physik,D-84571Garching,Germany. 10 For FSC, see Vizier Online Data Catalog, 9029 (W. Voges et al. 2000).
339
The Astrophysical Journal Supplement Series, 178:339–358, 2008 October
# 2008. The American Astronomical Society. All rights reserved. Printed in U.S.A.

counterparts for 81.2% of the 3847 sources within the HQS foot-print.11 One hundred fifty-five (4%) are M stars, 136 (3.5%)K stars, and four (0.1%) F or G stars. Another 956 (24.9%) aresaturated stars (B � 14 mag) for which no spectral class is avail-able. There are also 31 white dwarfs (WDs; 0.8%) and 16 cat-aclysmic variables (CVs; 0.4%). There are uncertainties associatedwith these identifications, e.g., because of the resolution of thespectra (R � 100 at H�). But the RASS/HQS program suggeststhat�33% of the X-ray sources detected by ROSAT are Galacticstars, a result confirmed by later efforts (e.g., Zickgraf et al. 2003).
The Chandra X-ray Observatory and XMM-Newton are bothequipped with more sensitive X-ray detectors than ROSAT (al-beit in different energy bands) but were designed primarily toconduct pointed observations. However, growing data archiveshave enabled a number of fairly deep, relatively small-area sur-veys, with X-ray source lists assembled and optical counterpartsidentified in much the same way as for the Einstein surveys. Inaddition, a few deep pencil-beam surveys have been completedwithChandra andXMM-Newton. Brandt &Hasinger (2005) com-pare the flux limits and solid angles for a number of these surveys;see their Figure 1.
The selection of optical counterparts for follow-up spectros-copy is generally simpler in these more recent surveys: the X-raypositional uncertainties are very small (typically less than 100 forChandra). However, the focus of these surveys is often to char-acterize faint extragalactic X-ray emitters, and the stellar samplesthey provide are quite small.
For example, the XMM Bright Serendipitous Survey (BSS;Della Ceca et al. 2004) includes just under 400 sources. The BSSreaches a flux limit of �7 ; 10�14 ergs cm�2 s�1 in the 0.5–4.5 keV energy band for an area of 28.10 deg2. Of the opticalcounterparts 90% have magnitudes brighter than the POSS IIlimit of R � 21mag (Della Ceca et al. 2004), and close to 90% ofthese counterparts now have spectra (Lopez-Santiago et al. 2007).Of these, Lopez-Santiago et al. (2007) identified 58 as stars, whichtherefore constitute�15% of the X-ray counterparts—a smallerfraction than in the Einstein or ROSAT samples but one which isconsistent with the positions on the sky of the BSS fields, whichare >20� from the Galactic plane. These authors compare thecolors of their 58 stars to those predicted by the X-ray Galacticmodel XCOUNT (Favata et al. 1992). They find that model anddata agree fairly well for the M stars in the sample but disagreerather dramatically for F, G, and K stars. They infer that the dis-crepancy is due to a stellar population currently absent from theirmodel, possibly known X-ray-emitting binaries such as RS CVnor BY Dra systems.
Feigelson et al. (2004) collected a smaller stellar sample fromthe Chandra Deep Field–North (CDF-N) survey. The CDF-Nhas an area of�448 arcmin2; individual exposures were as longas�2 ; 106 s, resulting in a flux limit of 3 ; 10�17 ergs cm�2 s�1
in the 0.5–2.0 keV band (Alexander et al. 2003). Of the �500sources in the CDF-N, only �3% are stars, and Feigelson et al.(2004) use 11 of these to construct a statistically complete sam-ple and study the evolution of X-ray properties. These stars be-long primarily to an old disk population (ages between 3 and11 Gyr), and their X-ray properties are consistent with a fasterthan expected decline in magnetic activity ( log LX / t�2 ratherthan t�1, where t is age; Feigelson et al. 2004).
Studies such as these would clearly benefit from a larger sam-ple of X-ray-emitting stars to analyze. The XMM Slew Survey(Freyberg et al. 2006), constructed from �15 s exposures as
the satellite slewed, is one such survey. The recently releasedXMM-Newton Slew Survey Source Catalog (XMMSL1) cov-ers �5800 deg2 to a relatively shallow flux limit of 6 ;10�13 ergs s�1 cm�2 and includes 2692 sources in its ‘‘clean’’version (Saxton et al. 2008). A search of the currently availableXMMSL1 database finds that 410 XMM sources have a starcataloged in SIMBAD within 600, and it is clear that this programwill eventually yield a large number of stellar X-ray sources.However, this stellar sample is still largely undefined. For ex-ample, rematching the 410 sources to SIMBAD reveals that 35%have previously been identified as RASS sources. More work isnecessary before we know exactly how many new stellar X-raysources will come from this survey or the similarly serendipitous2XMM survey (Watson & the XMM-Newton Survey ScienceCentre Consortium 2006).We have collected from Chandra or XMM data the largest
sample of stellar X-ray emitters in the field of the Galaxy identi-fied and characterized to date. The X-ray data are from the Ex-tendedChandraMultiwavelength Project (ChaMP), considerablyeasing the challenge of identifying the X-ray sources. Chandraprovides subarcsecond astrometry over most of its field of view(Aldcroft et al. 2000), greatly facilitating unambiguous matchingto optical counterparts, as does the lack of crowding at the highGalactic latitudes of the survey (jbj > 20�). In addition, the Ex-tendedChaMP survey is designed to have significant overlap withthe SloanDigital SkySurvey (SDSS),which affordswell-calibratedmulticolor imaging and spectroscopy crucial both for elimina-tion of extragalactic objects and for classification of stars.We describe the ChaMP and SDSS in x 2, and the process by
which we identify candidate stellar counterparts in x 3. In x 4 wediscuss the various tests we use to confirm that these candidatesare in fact stellar X-ray emitters. In x 5 we analyze the propertiesof our resulting sample of 348 X-ray-emitting stars; we concludein x 6. Future work will analyze the X-ray variability of thesestars and compare the properties of this catalog to stellar populationmodels of the Galaxy incorporating evolution of time-dependentcoronal X-ray emission.
2. THE SURVEYS
2.1. The Extended Chandra Multiwavelength Project
The Chandra Multiwavelength Project (ChaMP) is a wide-area serendipitous survey based on archival X-ray images of thejbj > 20
�sky observed with the Advanced CCD Imaging Spec-
trometer (ACIS) on board Chandra (described in Weisskopfet al. 2002). The full 130-field Cycle 1–2X-ray catalogs are pub-lic (Kim et al. 2004b, 2007b), and the most comprehensiveX-ray number counts ( log N - log S) to date have been produced,thanks to 6600 sources and massive X-ray source–retrieval sim-ulations (Kim et al. 2004a, 2007a). The simulations added 1000artificial X-ray point sources across a wide range of fluxes toeach actual Chandra ACIS image. The resulting images weresubjected to the identical source detection and characteriza-tion as used for the actual survey, and a comparison of input andoutput properties allowed a full calculation of the ChaMP’sX-ray sky coverage and completeness as a function of, e.g., sourceflux and off-axis angle (Kim et al. 2007a).Green et al. (2004) used deep imaging (r � 25 mag) with the
National Optical Astronomy Observatory (NOAO) 4 m tele-scopes at Kitt Peak National Observatory (KPNO) and CerroTololo Interamerican Observatory (CTIO) and follow-up spec-troscopy with telescopes ranging from 1.5 to 10 m in diameterto obtainX-ray source identifications over 14 deg2 of theCycle1 –2 survey. Sixty-six ChaMP fields were imaged in the g, r, and
11 The unidentified sources are likely to be faint active galactic nuclei andclusters (Bade et al. 1998).
COVEY ET AL.340 Vol. 178

i bands; these data and photometric catalogs are available on theChaMP Web page12 (see also W. A. Barkhouse et al. 2008, inpreparation). Optical spectra to r � 22 were obtained for as manyobjects as feasible in 27 prime fields, using primarily the WIYN3.5 m on Kitt Peak, the MMT with the Blue Channel spectro-graph on Mount Hopkins, Arizona, and the Magellan/Baade6.5 m telescope with both the LRIS and IMACS spectrographs.A significant number of spectroscopic identifications were alsoobtained for r � 18 objects using the Fred Lawrence WhippleObservatory 1.5 m telescope with the FASTspectrograph. Greenet al. (2004) classified 125 X-ray counterparts with optical spec-troscopy. Of these, 90% are extragalactic in nature, as expected(63 are broad-line active galactic nuclei [AGNs]). Silverman et al.(2008) describe the spectroscopic effort in more detail in theirpaper on the AGN X-ray luminosity function, and a full ChaMPspectroscopic catalog is in preparation.
Given the need for an even wider survey area to accumulatesignificant samples of rare objects, and the time-consuming na-ture of deep imaging and spectroscopy, the ChaMP area hasbeen extended to cover archival images from Cycles 1–6 butonly to include Chandra images within the SDSS footprint (seex 2.2). The Extended ChaMP now includes 392 ACIS fieldscovering a total area of roughly 33 deg2 (see Fig. 1) and cata-logs �17,000 X-ray sources.13 The median exposure time is21 ks, but individual exposures range from1 to 119 ks. Because ofthe lowChandra background rates, the formal statistical errors innet counts for each band are consistent within 2% of Poisson.Herewe adopt themore conservative Gehrels (1986) prescription:�cts ¼ 1þ (N þ 0:75)0:5.
SDSS photometry within about 200 of the aim point for eachcataloged Chandra observation were obtained to cover the com-bined ACIS-I and ACIS-S fields of view.14 Because theChandrapoint-spread function (PSF) increases with off-axis angle, com-paratively fewX-ray sources are detected beyond this radius, and
source centroids also tend to be highly uncertain. We note thatsome SDSS imaging strips do not completely cover theChandrafield of view. Detailed X-ray sky coverage versus sensitivitymapsrepresent a major ongoing effort of the ChaMP, described in P. J.Green et al. 2008 (in preparation), which will facilitate accuratevolume-limit estimates and allow for, e.g., luminosity-functioncalculations and stellar-population modeling.
While most ChaMP research to date has emphasized extraga-lactic objects (e.g., Silverman et al. 2005; Barkhouse et al. 2006;Kim et al. 2006; P. J. Green et al. 2008, in preparation), theChaMPlends itself well to stellar research. Compared to Galactic planestudies, counterpart identification is very secure at the ChaMPsurvey’s high Galactic latitudes, crowded-field photometry is notan issue, and reddening is quite moderate. In addition, a morebalanced ratio of thin/ thick-disk populations is sampled. How-ever, the expected fraction of stellar X-ray sources detected in theChaMP fields is relatively low: ChaMP fields, like those in theBSS, are away from the plane and stars are on averageweakX-rayemitters.
2.2. The Sloan Digital Sky Survey
The SDSS (Fukugita et al. 1996; Gunn et al. 1998; Hogg et al.2001; Smith et al. 2002; Gunn et al. 2006) is the deepest large-scale optical survey to date and provides uniform photometric(to a depth of r � 22:5 and an accuracy of �0.02 mag; Ivezicet al. 2004) and spectroscopic (R � 1800) data sets with which toidentify ChaMP sources. The latest data release (DR6; Adelman-McCarthy et al. 2008) includes imaging for �9600 deg2 andphotometry for close to 3 ; 108 unique objects. The SDSS spec-troscopic footprint is smaller (�7400 deg2); spectra over the3800–9200 8 range are available for >106 objects. The mainspectroscopic samples are for galaxies with Petrosian r < 17:77(>790,000 objects) and quasars with PSF i < 19:1 (>100,000 ob-jects). The DR6 database also includes spectra for close to300,000 stars, of which nearly 70,000 are of spectral type M orlater.
SDSS photometry and spectroscopy has been used to system-atically identify RASS sources (e.g., Popesso et al. 2004; Andersonet al. 2007; Parejko et al. 2008; M. Agueros et al. 2008, in prepa-ration).While theChaMP is a very different survey from theRASS,
Fig. 1.—Extended ChaMP footprint in Galactic coordinates: open circles, fields observedwith the ACIS-I detector; filled circles, fields observedwith the ACIS-S detector.The symbol size is proportional to the log of the exposure time; the symbol in the upper left corner corresponds to a 100 ks exposure. The SDSS footprint is the shaded region.
12 See http://hea-www.harvard.edu/CHAMP/.13 Some of the weakest sources may be associated with, or contaminated by,
cosmic-ray afterglows. Afterglows rarely affect brighter sources or those withbright optical counterparts as in the current sample. See also x 4.5.
14 For some observations, this was extended to a radius of 280 to achieve fullcoverage of the Chandra footprint.
ChaMP EXTENDED STELLAR SURVEY 341No. 2, 2008
the SDSS data are equally useful in identifying ChaMP sources,particularly stellar sources. Typical classes of X-ray emitters, in-cluding coronally emitting stars, normal galaxies, quasars, andBLLac objects, havemaximumX-ray-to-optical flux ratios corre-sponding to log ( fX/fopt) values of about �1, 0, +1, and +1.5(e.g., Stocke et al. 1991; Zickgraf et al. 2003). Given the typicalChaMP 0.5–2 keV flux,15 fX ¼ 10�14 ergs cm�2 s�1, this impliesthat an optical counterpart for each of these categories of typicalX-ray sources will be brighter than 19, 21, 24, and 25mag, respec-tively. As a result, all but the very faintest stellar optical counter-parts toChaMP sources are bright enough to have confident SDSSphotometric detections. Furthermore, such targetsmay be targetedfor SDSS spectroscopy, allowing for secure identifications.
3. IDENTIFYING CANDIDATE STELLAR SOURCES
3.1. Matching to SDSS
We begin by searching the ChaMP catalog for sources withSDSS counterparts within 2000 of each X-ray source centroid.Weidentify all potential SDSS matches to a ChaMP source, and werecord their distance from the X-ray centroid, along with a ratioof that distance to a radius characterizing the 95%X-ray positionerror. The latter depends on both the number of X-ray sourcecounts and the Chandra off-axis angle (Kim et al. 2004b). Wethen inspect each X-ray source on the smoothed Chandra X-rayimage and flag potentially contaminated sources, e.g., those thatlie in the outskirts of bright X-ray sources. Detections that appearto be X-ray artifacts are also flagged, but not removed at this stage(see x 4.5). Using the SDSS Image Tool (Nieto-Santisteban et al.2004), we simultaneously create SDSS finders for each possibleoptical match to the X-ray source. Here again, contaminants andpotential artifacts (saturation spikes, chip edges, high-backgroundregions, etc.) are noted.
During this visual inspection, a confidence rating is attachedto each match from 0 to 3, with 3 being the highest confidencematch. While we flag optically saturated objects during visualinspection, these are not rejected. A match confidence of 3 typ-ically represents a single optical counterpart with a position off-set (X-ray to optical ) no greater than 200 and/or less than the 95%X-ray position error.
We restrict our analysis here to ChaMP sources with a matchconfidence of 3 and SDSS counterparts with r < 20:5, a conser-vative estimate of the faintest magnitude for which SDSS performsrobust morphological star/galaxy separation (see x 4.2) even underpoor observing conditions (Scranton et al. 2002). The resultingcatalog contains 2121 ChaMP sources, of which 1320 are classi-fied by SDSS as point sources.
3.1.1. Estimating the Fraction of Spurious SDSS Matches
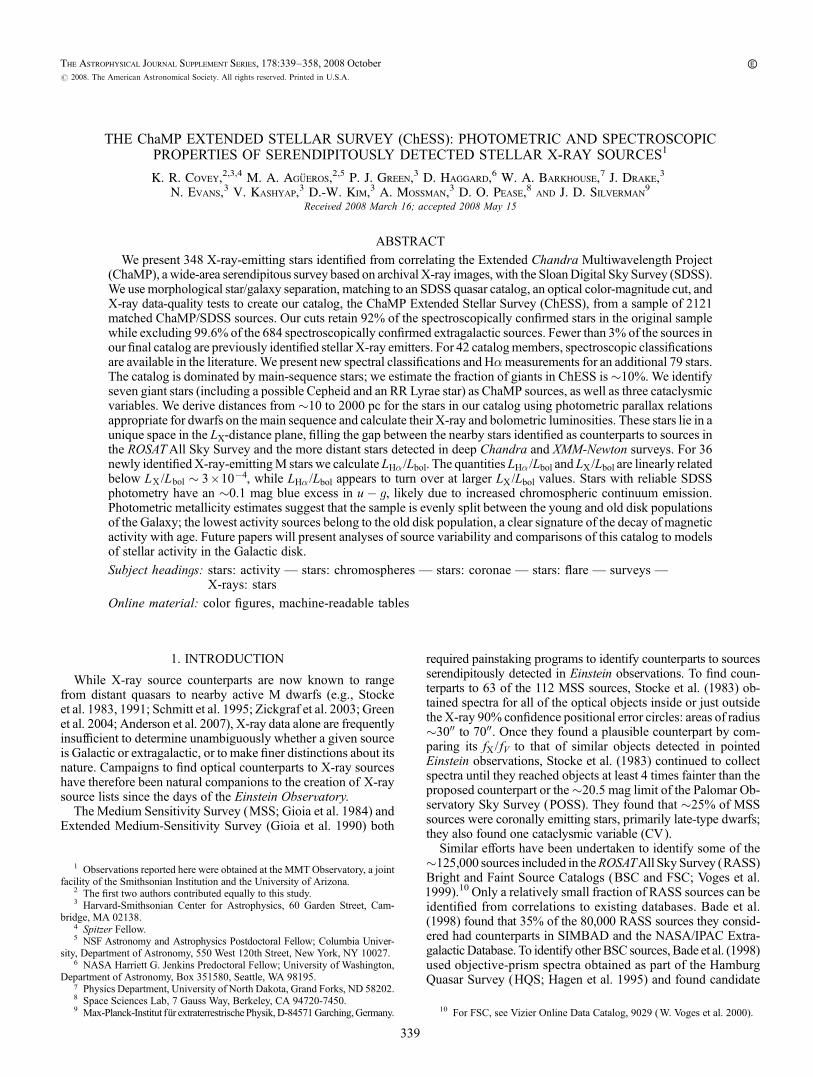
We calculated the separation between the X-ray and opticalpositions of the 2121 matched objects selected in x 3.1, finding amedian X-ray/optical separation of 0.3700 with � ¼ 1:3400. InFigure 2 we show the normalized cumulative histogram of theseseparations; 90% of the matched sources have positions in theX-ray and optical catalogs within 300 of each other.
We then shifted the X-ray source declinations by +3000 andsearched for SDSSmatcheswith r < 20:5within 800 of these newpositions, since only 1 of our original 2121matched objects haveseparations larger than this. This procedure yields a control sam-ple of 833 matches to these offset X-ray positions.
Figure 2 shows the cumulative normalized histogram for thiscontrol sample; as expected, the cumulative fraction rises with
separation. Note that the normalization used here is also 2121, sothat the dashed histogram shows an upper limit to the fractionalcontamination of our sample by chance superpositions of inde-pendent X-ray and optical sources. At 300, the contamination isabout 7%. At 400, an X-ray/optical separation larger than or equalto that for 99% of our sources, the contamination is about 12%.This represents a conservative upper limit, since no SDSS cutsother than r < 20:5 have been made.
3.2. Matching to 2MASS
The Two Micron All Sky Survey (2MASS) obtained near-infrared images of 99.998% of the sky between 1997 and 2001(Skrutskie et al. 1997, 2006; Cutri et al. 2003). The limiting(Vega-based) magnitudes for 10 � detections of point sourcescorrespond roughly to J ¼ 15:8,H ¼ 15:1, andKs ¼ 14:3 mag.Positional uncertainties are <0.200.We used the Gator interface16 to identify 2MASS counterparts
for objects in our catalog, using a 300 matching radius centeredon the X-ray/optical source’s SDSS position. For objects withmultiple 2MASS sources within 300, only the closest match wasretained. This identified 2MASS counterparts for 889 of the2121 objects in our initial catalog.We also performed a test similarto that described in x 3.1.1 to estimate the likelihood of spuriousSDSS/2MASS matches by applying a 3000 offset to each source’sSDSS position and then identifying 2MASS counterparts within1000. These false matches tend to have SDSS/2MASS separationsof 700–900, with 90% lying outside of 300. The real matches, on theother hand, are all within 300; 97% are within 100.
4. CONFIRMING THE STELLAR SOURCES
4.1. ChaMP Spectroscopy
We queried the ChaMP spectroscopic database for existing ob-servations and/or classifications of objects in our catalog. All of
Fig. 2.—Histograms of source separations between ChaMP and SDSS: solidhistogram: cumulative distribution of separations between X-ray and opticalcounterparts for real ChaMP/SDSS sources with r < 20:5 mag; dashed line, dis-tribution of separations returned by matching shifted X-ray sources to catalog ofSDSS objects with r < 20:5.
15 This flux is the peak of an fX histogram of ChaMP sources and correspondsapproximately to a 50% completeness limit across the survey. 16 See http://irsa.ipac.caltech.edu /applications /Gator /.
COVEY ET AL.342 Vol. 178

the spectra in the ChaMP database have been inspected and vi-sually classified by members of the ChaMP collaboration as ei-ther AGN/QSOs, galaxies, or stars. In the ChaMP spectroscopicdatabase 773 sources in our sample have high confidence classi-fications: of these, 92 have been classified as stellar sources, withthe remaining 681 classified as extragalactic and possessing red-shifts measured using the IRAF task xcsao. These spectral clas-sifications informed the criteria we develop to remove nonstellarcontamination from our sample.
4.2. SDSS Star/Galaxy Separation
While SDSS provides automated morphological informationfor all objects it detects, many of the X-ray sources in our samplehave optical counterparts significantly brighter than the SDSSsaturation limit (�15 mag). The image flux distribution of sat-urated stars deviates strongly from a standard PSF, and saturatedstars are often classified as extended objects. To ensure accuratemorphological classifications, we visually classified the 503 ob-jects with r < 18. We identified 53 saturated stars misclassifiedas extended sources by the SDSS pipeline, and we adjusted theirentries in our catalog.
We also checked the accuracy of the automated SDSS mor-phological classification by comparing the spectroscopic and pho-tometric classifications of the 298 morphologically extendedobjects in our catalog with ChaMP spectra. All but five are clas-sified spectroscopically as extragalactic: 115 are classified asgalaxies and 176 as AGN/QSOs. Visual inspection of the SDSSimages of these five objects reveals that three (CXOMPJ143819.2+033349, J112740.4+565309, and J113311.9+010017) are ex-tended galaxies, suggesting their spectroscopic classification asstars is erroneous. By contrast, CXOMP J142429.9+225641 andJ235645.8�010138 are likely stars: they are only marginallyresolved and may be either visual binaries or objects with pho-tometric flaws resulting in morphological misclassification.
Of the 298 optically extended objects for which we have spec-tra, therefore, only two appear to be misclassified stars based ontheir photometry. This implies that P0.7% of the objects clas-sified as extended by the SDSS photometric pipeline are actuallypoint sources. Given this, we exclude from further analysis the748 sources whose optical counterpart has been identified as ex-tended by the pipeline. This increase in sample purity comes atthe cost of excluding�5 real point sources fromour sample, whichdoes not significantly affect our completeness.
Figure 3 presents the 1373 point sources in our initial catalogin various optical and infrared color-color and color-magnitudespaces. Of these point sources 475 have spectroscopic classi-fications; 87 are identified as stars and 388 as extragalactic in na-ture. We highlight these two spectroscopic samples in Figure 3.
4.3. The SDSS Photometric QSO Catalog
The SDSS provides the largest, most uniform sample ofphotometrically selected quasars to i < 21, assembled using anonparametric Bayesian classification based on kernel densityestimation (Richards et al. 2004, 2006, 2007). Each object inthe catalog is assigned a photometric redshift according to theempirical algorithm described by Weinstein et al. (2004); thedifference between the measured color and the median colors ofquasars as a function of redshift is minimized. The quasar catalogutilized in this work includes �10,000 SDSS Data Release 5(DR5; Adelman-McCarthy et al. 2007) photometrically selectedQSOs that fall within 200 of a ChaMP field center (G. Richards2006, private communication; P. J. Green et al. 2008, in prepara-tion). To minimize QSO contamination, we eliminate from con-
sideration the 827 candidate stellar X-ray sources that are listedin the DR5 QSO catalog.
4.4. A Color-Magnitude Cut
While matching to the photometrically selected DR5 QSOcatalog excludes the vast majority of QSOs in our sample, 47 ofthe remaining 546 stellar candidates are identified as QSOs in theChaMP spectroscopic database. As the g� i versus i color-mag-nitude diagram (CMD) in Figure 3 shows, these QSOs are sig-nificantly fainter (�2mag) than spectroscopically confirmed starswith similar g� i colors. This suggests that a color-magnitude cutcan be used to separate stars from QSOs. However, 175 objectsstill under consideration at this stage are bright enough to saturatepixels in one or more of the five SDSS images, and their SDSS-based colors are untrustworthy.
We therefore restrict our final sample to the 363 sources whoseoptical counterparts are either flagged as SATURATED in theSDSS database (for a detailed discussion of the SDSS flags, seeStoughton et al. 2002) or are unsaturated and satisfy the i <16:2þ 0:7( g� i ) color-magnitude cut shown in Figure 3. Visualinspection confirms that the 27 objects that are saturated and donot meet our color-magnitude cut are in fact stars.
4.5. X-Ray Quality Cuts
We now examine the X-ray properties of the 363 remainingChaMP sources to identify potential contaminants.
1. Twenty-seven sources are more than 120 from theChandraoptical axis and are subject to larger photometric and astrometricerrors. Since almost all have a large number of counts, we pre-serve them in our sample. We do flag these sources in our finalcatalog, however, and we conservatively increase their X-rayflux errors by 50%.
2. Sixteen sources are detected on ACIS S4, which suffersfrom increased noise and streaking relative to the other ChandraCCDs. These sources are flagged in our final catalog; we con-servatively increase their X-ray flux errors by 20%.
3. We find that 14 sources overlap according to the criteria ofKim et al. (2007b). For eight, the overlap is small (as defined byKim et al. 2007b), and the X-ray photometry is reliable. For theother six, the overlap is large: we flag these sources in our catalogand conservatively double their X-ray flux errors.
4. The exposure times for nine sources are typically less thanhalf the maximum exposure time for their respective CCDs, in-dicating that the source extraction region encompasses an edgeor gap. These sources have unreliable fluxes, andwe remove themfrom our sample.
5. We checked a time-ordered list of photons inside the ex-traction region for each source in our catalog.We searched for twoconsecutive photons for which the chip coordinates are the sameor differ by 1 pixel, the exposure frames (typically 3.2 s) increaseby 1 or 2, and the energies decrease monotonically; these are fea-tures associated with cosmic-ray afterglows.17 We remove thethree false sources (all with<10 counts) we found in this mannerfrom our catalog.
In summary, we remove 12 sources from our catalog based ontheir X-ray properties.
5. THE ChaMP/SDSS STELLAR CATALOG: ChESS
Imposing the criteria described above on our initial catalog of2121 ChaMP detections results in a high-confidence sample of
17 For a description of this problem, see http://asc.harvard.edu /ciao /caveats /acis_caveats_071213.html..
ChaMP EXTENDED STELLAR SURVEY 343No. 2, 2008

351 stellar X-ray emitters. This sample excludes 99.6% (681/684) of the spectroscopically identified extragalactic objects andincludes 91% (81/89) of the spectroscopically identified stars.Of the eight spectroscopic stars eliminated from our sample, twolack SDSS counterparts with point-source morphology, one iserroneously listed as having a photometric z in the SDSS QSOcatalog, four fail to meet our color-magnitude cut, and one has an
X-ray detection on the edge of a Chandra CCD. We discussthe six eliminated stars with point-source SDSS counterparts inx 5.2.We remove the three remaining spectroscopically identified
QSOs from our sample to produce a final catalog of 348 stellarX-ray emitters, which we define as the ChaMP Extended StellarSurvey (see Table 1 for a summary of the stages in the catalog
Fig. 3.—Location of our initial catalog in color-color and color-magnitude spaces. All 1373 ChaMP/SDSS point sources are shown as filled symbols, with stars andcircles indicating saturated and unsaturated counterparts, respectively. The 87 spectroscopically identified stars are dark gray, while the 388 extragalactic sources arelight gray. Objects in the DR5 QSO catalog are shown with half-sized symbols; the box in the top left panel is the area of color space typically inhabited by z < 2:5 QSOs.Gray-scale contours and black dots show the high-quality sample of SDSS/2MASS point sources presented by Covey et al. (2007); the solid line is the median color-colorrelation of this sample. The color-magnitude cut described in x 4.4 to eliminate QSOs is shown as a dotted line in the i vs. g� i CMD. Extinction vectors corresponding toAV ¼ 1 are shown with a arrow in the top left corner of each color-color diagram, and in the upper right of the color-magnitude diagram. The dashed lines along each axisrepresent the typical photometric errors. [See the electronic edition of the Supplement for a color version of this figure.]
COVEY ET AL.344 Vol. 178
construction). The 348 ChESS stars represent 17% of the ChaMPsources with SDSS counterparts, a fraction consistent with thatfound by Lopez-Santiago et al. (2007) as expected. X-ray andoptical /near-infrared properties of objects in this catalog arepresented in Tables 2 and 3.
5.1. Previously Cataloged Stars
A number of ChESS stars are optically bright enough to havebeen previously cataloged.We search for entries in the SIMBADcatalog within 1000 of the ChESS position for the 348 stars andfind that 89 have matches. These stars are discussed in more de-tail in the Appendix.
The 89 stars can be divided into three groups. The largest group,66 stars, is made up of optically bright stars that have yet to beidentified as X-ray emitters. The first group’s natural complementis the small number of stars that have already been identified asX-ray sources; there are only 10 stars for which this is the case.The third group is of ChESS sources included in previous X-raycatalogs but not yet identified; there are 13 such sources. The vastmajority of the objects in our catalog, therefore, represent new stel-lar identifications: previously known stellar X-ray sources makeup <3% of our sample.
5.2. Spectroscopic Stellar Sample
We used the Hammer (Covey et al. 2007), an Interactive DataLanguage code18 to obtain spectral types for the 81 stars in oursample for which we have spectra. The Hammer predicts theMorgan-Keenan (for stars earlier thanM) or Kirkpatrick (for laterstars) spectral type for a given star on the basis of a fit to a set of30 spectral indices. In addition, the user can interactively modifythe assigned spectral type. Employing this tool, every spectrumwas checked by eye and stars were assigned types independentlyby two authors (M. A. A., K. R. C.). Cases where the types dis-agreed by more than two subclasses were reexamined. The spec-tral types ultimately assigned are in Table 4.
Figure 4 (top) shows the relationship between the assignedspectral types and each star’s g� Ks color; the close relation be-tween the two quantities (especially for unsaturated stars) sug-gests that the assigned types are accurate. As an additional testof this accuracy, we plot in Figure 4 (bottom) the difference be-tween the two types initially assigned to each star. The mean dif-ference is slightlymore than one subclass, although the quality of
the agreement is dependent on the spectral type of the star. Theinitial independent classifications for K and M class stars typi-cally disagree by one subclass or less, while initial classificationsfor earlier F andG class stars typically disagree by 2–4 subclasses.We note that while eight of these stars have SIMBADentries, onlythree have previously cataloged spectral types and only one is apreviously knownX-ray emitter.We identify CXOMP J025951.7+004619 as [BHR2005] 832�7, which we classify as an M5 starandwhich SIMBAD lists as anM5.5V star. CXOMP J122837.1+015720 is the knownX-ray emitter GSC00282�00187, classifiedas an M2 star; we have it as an M1 star. Finally, we identifyCXOMP J231820.3+003129 as the F2 star TYC 577�673�1;SIMBAD lists this star as an F5.
We list H� equivalent widths (EqWs) for each star in Table 4,which we measure by dividing the line flux within a 20 8 win-dow centered at 65638with the continuum flux level determinedfrom a linear fit to two regions (6503–65438 and 6583–66238).We then use the � factor (Walkowicz et al. 2004) to calculateLH� /Lbol from these EqWs for the M stars with H� emission.
As mentioned above (x 4.2), the cuts we use to identify a high-confidence sample of stellar X-ray sources remove five spectro-scopically confirmed stars fromour catalog. CXOMP J114119.9+661006 and J234828.4+005406 are optically faint main-sequencestars with spectral types K7 and M2 and are eliminated by ourcolor-magnitude cut; we remove anM2 star, CXOMP J161958.8+292321, because its X-ray detection falls on the edge of aChandraCCD.The remaining three sources are rarerCVs,which frequentlyshare color space with QSOs:
1. SDSS J020052.2�092431 is a previously unknown CV.Follow-up optical observations are required to determine the na-ture of the system and its period. Its soft (0.5–2.0 keV) flux is3:13 � 0:28ð Þ ; 10�14 ergs cm�2 s�1, while its broadband (0.3 –8.0 keV) flux is 9:04 � 0:65ð Þ ; 10�14 ergs cm�2 s�1. This CVis eliminated by our color-magnitude cut.
2. SDSS J150722.33+523039.8 was identified as a CV bySzkody et al. (2005). Follow-up photometry revealed that it is aneclipsing system with an extremely short orbital period of only67 minutes. Furthermore, observations of systems with similarlybroad absorption in the Balmer lines suggest that this CV maycontain a pulsating WD (e.g., Woudt et al. 2004). An initialmatch to the RASS did not return an X-ray counterpart to thisCV (Szkody et al. 2005). It was the target of a Chandra obser-vation that is included in the ChaMP database. The CV’s softflux is 2:36 � 0:84ð Þ ; 10�14 ergs cm�2 s�1, while its broadband
TABLE 1
Stages in Catalog Construction
Spectroscopic
Catalog
(1)
Total Objects
(2)
Stars
(3)
Galaxies
(4)
Matched ChaMP/SDSS catalog ......................... 2121 89 (100%) 684 (100%)
Matched ChaMP/SDSS point sources ............... 1373 87 (98%) 388 (57%)
Not in DR5 QSO catalog ............................... 546 86 (97%) 47 (7%)
With i < 16.2 + 0.7(g�i ) .............................. 363a 82 (92%) 3 (<0.1%)
With clean X-ray properties ........................... 351 81 (91%) 3 (<0.1%)
Final catalog........................................................ 348b 81 (91%) 0 (0%)
Notes.—Columns (3) and (4) give the number of spectroscopically confirmed stars and galaxies, respectively,present in the catalog at each stage. The numbers in parentheses correspond to the fraction of the original number ofthese objects that is retained.
a Includes 27 saturated stars that do not meet this color-magnitude cut.b Three spectroscopically confirmed QSOs and 11 sources with substandard X-ray detections are removed
manually.
18 Available from http://www.cfa.harvard.edu /~kcovey / thehammer.html.
ChaMP EXTENDED STELLAR SURVEY 345No. 2, 2008

TABLE 2
ChaMP Stellar Catalog (X-Rays)
Source
(CXOMP)
Chandra
Obs. ID
fBc
(10�13 ergs cm�2 s�1)
NetBc
(counts)
fSc
(10�13 ergs cm�2 s�1)
NetSc
(counts) HRa
log (LXs)
(ergs s�1) log (LXs /Lbol)
log (LXb)
(ergs s�1) log (LXb /Lbol)
J000155.4+004819................... 4861 0.08 � 0.08 3.5 � 3.4 0.01 � 0.03 0.6 � 2.3 1.00 28.60 � 1.30 �4.44 � 1.30 29.60 � 1.47 �3.45 � 1.47
J001107.9+144153................... 3957 0.19 � 0.10 7.7 � 4.0 0.10 � 0.05 7.9 � 4.0 �1.00 28.34 � 0.30 �3.07 � 0.30 28.61 � 0.31 �2.80 � 0.31
J001313.2+000250................... 4829 0.10 � 0.05 8.5 � 4.1 0.05 � 0.02 7.8 � 4.0 �1.00 29.08 � 0.31 �4.40 � 0.31 29.41 � 0.29 �4.07 � 0.29
J003151.4+003233................... 2101 0.59 � 0.12 34.7 � 7.0 0.29 � 0.06 33.9 � 6.9 �0.90 28.27 � 0.10 �3.45 � 0.10 28.59 � 0.10 �3.13 � 0.10
J004238.8�091043.................. 4886 0.97 � 0.13 66.4 � 9.2 0.54 � 0.08 62.6 � 9.0 �0.93 29.73 � 0.07 �3.11 � 0.07 29.98 � 0.07 �2.86 � 0.07
J010615.6+004814................... 2180 0.36 � 0.11 16.5 � 5.2 0.18 � 0.06 15.9 � 5.1 �0.81 28.73 � 0.17 �3.31 � 0.17 29.03 � 0.16 �3.01 � 0.16
J011818.5�005642 .................. 4963 0.14 � 0.03 36.0 � 8.5 0.09 � 0.02 37.5 � 7.6 �1.00 29.25 � 0.10 �3.43 � 0.10 29.44 � 0.12 �3.23 � 0.12
J014821.7+000446................... 4098 0.09 � 0.07 4.0 � 3.2 0.04 � 0.03 3.0 � 2.9 �0.71 28.31 � 1.67 �3.11 � 1.67 28.73 � 0.69 �2.70 � 0.69
J015939.2�084409.................. 6106 0.01 � 0.02 2.2 � 4.3 0.01 � 0.01 6.2 � 4.0 �1.00 27.06 � 0.44 �5.57 � 0.44 26.85 � 1.30 �5.79 � 1.30
J015941.6�084506.................. 6106 0.11 � 0.03 31.1 � 7.1 0.07 � 0.01 30.5 � 6.7 �1.00 27.82 � 0.11 �5.11 � 0.11 28.05 � 0.11 �4.88 � 0.11
Notes.—Table 2 is published in its entirety in the electronic edition of the Astrophysical Journal Supplement. A portion is shown here for guidance regarding its form and content.a Since we do not include any scientific results based on HR, we simply characterize the typical errors here by noting that the mean error on HR is well fit for sources with HR > �0:98 by HRerr ¼
0:36(� 0:027)HRþ 0:40( � 0:022), with rms residuals of � ¼ 0:074. Sources with HR < �0:98 have median HR errors of 0.106, with RMS residuals of � ¼ 0:073.
346

TABLE 3
ChaMP Stellar Catalog (Optical/ IR)
Source
SDSS Sep.
(arcsec)
i
(mag)
u�g(mag)
g�r
(mag)
r�i
(mag)
i�z
(mag)
Syn. g(mag)
Sat.
Flag
J
(mag)
J�H
(mag)
H�Ks
(mag)
J000155.4+004819.............. 5.58 14.20 � 0.01 1.41 � 0.03 0.55 � 0.02 0.20 � 0.02 0.07 � 0.03 15.47 � 0.30 1 13.24 � 0.02 0.38 � 0.03 0.07 � 0.04
J001107.9+144153.............. 0.72 17.16 � 0.01 2.02 � 0.23 1.51 � 0.03 1.63 � 0.02 0.89 � 0.02 20.49 � 0.30 0 14.72 � 0.03 0.65 � 0.05 0.26 � 0.07
J001313.2+000250.............. 0.47 12.56 � 0.01 1.17 � 0.01 0.31 � 0.01 0.10 � 0.01 �0.01 � 0.03 13.42 � 0.30 1 11.73 � 0.03 0.24 � 0.04 0.04 � 0.04
J003151.4+003233.............. 0.87 14.97 � 0.03 2.32 � 0.06 1.49 � 0.03 1.46 � 0.03 0.79 � 0.03 17.91 � 0.30 0 12.70 � 0.02 0.56 � 0.04 0.28 � 0.04
J004238.8�091043............. 0.24 13.36 � 0.01 1.85 � 0.07 �2.25 � 0.07 3.22 � 0.02 0.14 � 0.02 14.82 � 0.30 1 12.14 � 0.02 0.45 � 0.04 0.13 � 0.04
J010615.6+004814.............. 0.23 15.75 � 0.03 2.48 � 0.08 1.40 � 0.04 1.24 � 0.04 0.67 � 0.03 18.26 � 0.30 0 13.61 � 0.03 0.60 � 0.04 0.23 � 0.04
J011818.5�005642 ............. 1.61 15.28 � 0.02 2.35 � 0.04 1.15 � 0.04 0.52 � 0.03 0.31 � 0.03 17.25 � 0.30 0 13.72 � 0.02 0.61 � 0.04 0.16 � 0.04
J014821.7+000446.............. 1.10 18.10 � 0.01 2.40 � 0.80 1.62 � 0.05 1.58 � 0.03 0.82 � 0.03 20.70 � 0.30 0 15.77 � 0.07 0.76 � 0.10 0.18 � 0.13
J015939.2�084409............. 1.40 15.18 � 0.02 2.64 � 0.03 �0.96 � 0.04 �0.54 � 0.04 3.62 � 0.02 13.76 � 0.30 1 10.41 � 0.02 0.62 � 0.04 0.16 � 0.03
J015941.6�084506............. 0.33 10.18 � 0.01 1.87 � 0.01 0.82 � 0.01 0.30 � 0.01 �1.97 � 0.02 11.82 � 0.30 1 9.34 � 0.02 0.41 � 0.06 0.09 � 0.06
Notes.—Table 3 is published in its entirety in the electronic edition of the Astrophysical Journal Supplement. A portion is shown here for guidance regarding its form and content.
347

flux is 7:33 � 1:81ð Þ ; 10�14 ergs cm�2 s�1. This CV is listed inthe SDSS QSO catalog as having a nonzero z and also is elim-inated by our color-magnitude cut.3. SDSS J170053.29+400357.6 is a known X-ray-emitting
polar, in which the accretion stream flows directly onto theWD’smagnetic poles, with a period of 115minutes (Szkody et al. 2003).Szkody et al. (2003) convert RASS counts into a flux assumingthat for 2 keV bremsstrahlung spectrum, 1 count s�1 correspondsto a 0.1–2.4 keV flux of about 7 ; 1012 ergs cm�2 s�1. In thiscase, the resulting X-ray flux is�4:9 ; 10�13 ergs cm�2 s�1. Bycontrast, the softChandraflux is 2:07 � 0:27ð Þ ; 10�13 ergs cm�2
TABLE 4
ChaMP Stars with Spectra
CXOMP Type
H� EqW
(8) log LH� /Lbolð Þ
J001107.9+144153................... M5 6.09 �3.78
J001313.2+000250................... F7 �3.67 . . .
J003151.4+003233................... M4 5.01 �3.50
J010615.6+004814................... M3 2.71 �3.70
J011818.5�005642 .................. K5 0.71 . . .
J015941.6�084506a................. K2 �1.76 . . .J020643.7+121851................... M5 6.07 �3.78
J022429.5�000020.................. M4 3.43 �3.66
J023206.6�073032.................. M4 2.75 �3.76
J025951.7+004619b ................. M5 14.47 �3.40
J030014.0+004729................... K1 �1.52 . . .
J072501.4+371351a ................. K3 �1.15 . . .
J074108.8+311346a.................. M6 1.24 �4.66
J074112.3+311446 ................... M4 8.60 �3.26
J074118.8+311434 ................... M3 3.53 �3.58
J074433.8+393027................... F2 �3.55 . . .
J074437.0+392503................... M5 5.71 �3.81
J074444.6+392931................... F5 �3.69 . . .J074705.1+274006................... G1 �2.53 . . .
J075549.9+405728................... M2 +0.09 �5.08
J075937.3+300846................... G7 �0.88 . . .J080046.6+360416................... M2 �0.05 . . .
J080048.1+360722................... F1 �3.54 . . .
J080101.0+360549................... G2 �2.57 . . .
J080157.1+441438................... K2 �0.74 . . .J082702.2+291531................... G4 �0.94 . . .
J082718.9+291841................... M0 �0.45 . . .
J082726.2+291601................... G2 �1.50 . . .
J082729.8+291905................... K2 �1.11 . . .J082815.2+291132................... G5 �2.25 . . .
J084039.0+130916................... M0 �0.30 . . .
J084044.7+130713a ................. G1 �2.78 . . .J084055.8+130800................... M4 2.97 �3.72
J084913.8+444758................... M0 �0.42 . . .
J085325.7+232919a ................. M4 6.47 �3.39
J091047.6+541505................... M2 2.62 �3.60
J091104.1+542208................... M2 �0.52 . . .
J093411.0+551143 ................... F4 �4.09 . . .
J111504.7+403706 ................... M3 1.04 �4.12
J111802.3+074325 ................... G0 �2.88 . . .J112045.7+232536................... M2 3.67 �3.45
J112116.2+232622 ................... M3 0.17 �4.90
J114007.3+660659................... M2 2.43 . . .J114101.7+661246................... M3 0.80 �4.23
J114129.7+660250................... K3 �1.29 . . .
J114149.5+661123 ................... K7 �0.31 . . .
J120439.4�001650.................. G8 �1.98 . . .J122155.2+490743................... M4 4.79 �3.52
J122738.8+442132................... M4 3.28 �3.68
J122837.1+015720b ................. M1 1.19 . . .
J125152.2+000528................... M3 5.23 �3.41
J131231.0+423106................... M3 2.47 �3.74
J134433.5�000536.................. M4 7.23 �3.34
J134434.8+554956................... M3 3.95 �3.53
J134449.1+555812................... F8 �1.81 . . .J134521.5�000118 .................. M3 2.43 �3.75
J140654.3+340949................... M4 3.81 �3.62
J141120.7+521411 ................... K7 �0.94 . . .J141715.2+445420................... G7 �1.86 . . .
J144553.5+012552................... M0 0.55 �4.20
J150639.4+521856................... M6 3.43 �4.22
J151031.7+074248................... K2 �0.07 . . .J151423.8+363511................... M3 1.35 �4.00
J153245.2�004012.................. G8 �1.97 . . .
TABLE 4—Continued
CXOMP Type
H� EqW
(8) log LH� /Lbolð Þ
J153519.7+233152................... M2 �0.32 . . .
J154905.1+213319................... K3 �1.23 . . .J154947.2+212857................... G3 �2.57 . . .
J161958.8+292321................... M2 3.56 �3.46
J162306.8+311236................... M4 3.85 �3.61
J162415.4+263728................... K2 �0.90 . . .
J214218.8+122524................... G2 �1.72 . . .
J214229.3+123317................... M2 3.63 �3.45
J214229.3+123322................... M4 13.54 �3.06
J214235.6+122701................... K0 �1.83 . . .
J221513.1�004828.................. M2 1.39 �3.87
J221513.2�004927.................. G4 �2.77 . . .
J221516.8�005129.................. M4 5.51 �3.46
J221716.9+002208................... K5 �1.04 . . .
J221719.1+001428................... K4 0.41 . . .
J224339.9�093348.................. K3 �0.65 . . .J231818.7+003842................... K7 �0.96 . . .
J231820.3+003129b ................. F2 �3.78 . . .
a Counterpart is cataloged in SIMBAD but lacks a stellar type.b Counterpart is cataloged in SIMBAD and has a stellar type.
Fig. 4.—Top: Assigned spectral types as a function of g� Ks; saturated andunsaturated sources are shown as stars and circles, respectively. Bottom: Initialspectral type uncertainty as a function of assigned type.
COVEY ET AL.348 Vol. 178

s�1, while its broadband flux is 6:81 � 0:62ð Þ ; 10�13 ergs cm�2
s�1. This CV is eliminated by our color-magnitude cut.
For all three of these CVs, the broadband flux suggests there isa hard tail to the X-ray emission.
5.3. Giant Stars
In order to estimate the fraction of ChESS stars that is likely tobe made up of evolved X-ray emitters, we generate simulatedSDSS/2MASS observations using the TRILEGAL code (Girardiet al. 2005) and standardGalactic parameters. In Figure 5we showthe resulting J versus J � Ks CMD. Dwarf stars are definedas having surface gravities log g � 3:5 and their distribution isshown by the density contours and points. The positions of thesimulated giant stars are given by asterisks. TRILEGAL predictsthat most giants (78%) should reside in a fairly narrow locus inJ versus J � Ks color-magnitude space that stretches from J � 4and 0:625 � J � Ks � 0:825 down to J � 16 and 0:4 � J�Ks � 0:6; we highlight this region of the CMD. We then plotthe positions of the ChESS stars; 57 inhabit the giant region.However, the relative fraction of giants is not uniform across thisregion. For stars with J > 12 mag, giants represent no more than11% of our simulated SDSS/2MASS detections, while they dom-inate the simulated stellar population at brighter magnitudes.Naively we would therefore only expect 3 of the 29 ChESS starsin the giant region with J > 12 to be giants; conversely, all 28ChESS J < 12 stars in this region are strong giant candidates.Overall, this implies that�10%of our sample ismade up of giantstars. Our matching to SIMBAD, discussed in x 5.1, identified
five known luminosity class III and IV counterparts to ChaMPsources, as well as an RR Lyrae and a candidate Cepheid (see theAppendix), implying that the minimum fraction of ChESS giantsis 2%.
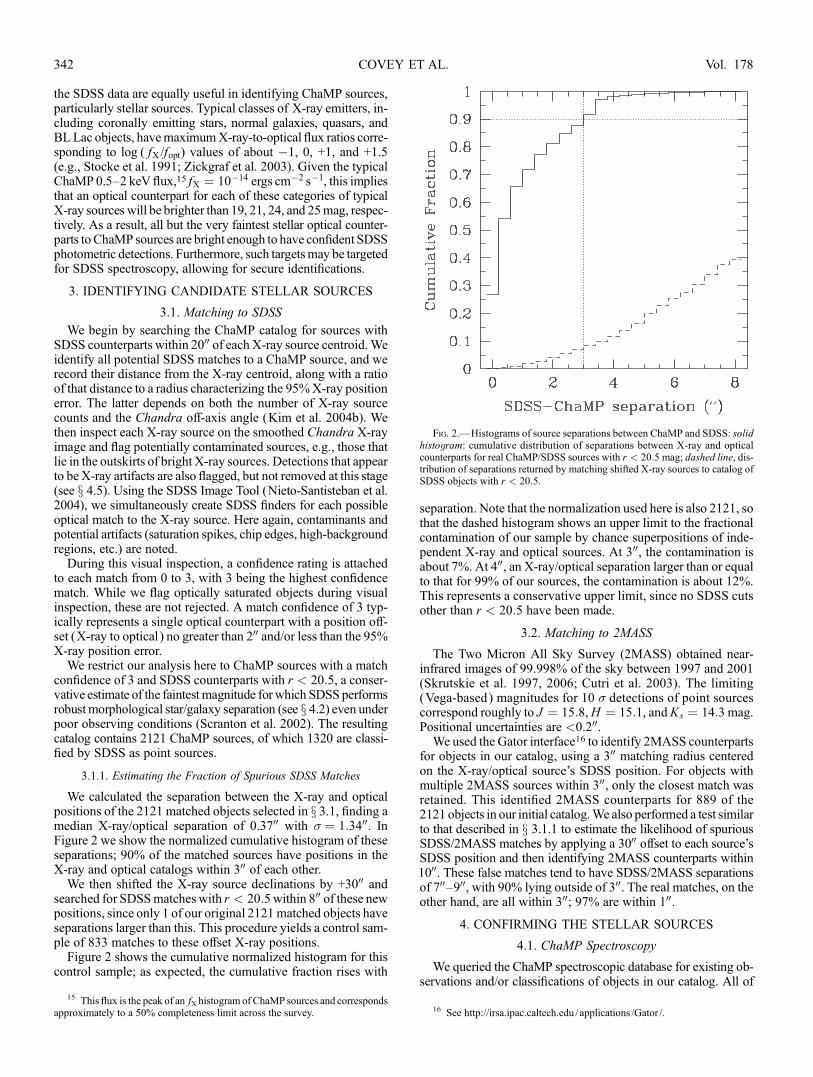
5.4. Stellar Distances
We wish to derive distances for the ChESS stars using pho-tometric parallax relations appropriate for dwarfs on the mainsequence, since these dominate our sample. However, distanceestimates based on SDSS photometry are unreliable for the 175saturated stars in our sample. Fortunately, the SDSS photometricpipeline identifies each object’s counterpart in the USNO-B cat-alog (Monet et al. 2003); similarly, 2MASS uses a 500 matchingradius to identify counterparts in the Tycho 2 or USNO-A2.0catalogs. As a result, we have either USNO or Tycho counterpartsfor 347 of the 348 stars in our sample.
We use the Tycho/USNO B magnitudes to construct B� Ks
colors for each source in the catalog and derive a relationship be-tween g� Ks and B� Ks for the unsaturated stars:
g� Ks ¼ 0:93(B� Ks)þ 0:25: ð1Þ
Comparisons of the synthetic g� Ks obtained using equation (1)to the measured g� Ks for the unsaturated stars reveals thatthe synthetic g� Ks color is accurate to within 0.3 mag (1 �),which we adopt as the characteristic uncertainty for our syntheticg� Ks.
We then generate synthetic g� Ks for the 165 saturated SDSSstars with B magnitudes. We include in Table 3 the synthetic gpredicted for each star (calculated from its synthetic g� Ks andthe observed Ks), as well as a saturation flag that indicates if astar is unsaturated (0), saturated in SDSS with a synthetic g fromTycho/USNO photometry (1), or saturated in SDSS and lackinga Tycho/USNO counterpart (2).
Finally, we use a preliminary fit to theMKsversus g� Ks CMD
of D. Golimowski et al. (2008, in preparation), which agreeswell with the tabulations of Kraus & Hillenbrand (2007) to de-rive distances to each star, using synthetic g� Ks colors for starswith saturated SDSS photometry when possible. One star in oursample, CXOMP J153203.5+240501, is undetected in 2MASS,so we estimate its distance using a preliminary fit to theMi versusg� i CMD of D. Golimowski et al. (2008, in preparation).
The resulting distances are shown in Figure 6 as a function ofg� Ks; formal uncertainties in these distances are<10%, but weadopt conservative uncertainties of 20% to account for poten-tial systematic errors in the underlying parallax relations. Anestimate of the distance limit imposed by the i versus g� i cutdescribed in x 4.4, calculated as a function of g� Ks via thecolor-magnitude data tabulated by Kraus & Hillenbrand (2007)is shown in Figure 6 as a dashed line. This limit matches the ob-served upper envelope of the ChESS catalog well. The optical/near-infrared CMD cut imposes implicit distance limits of be-tween 2000 and 1000 pc for G and K stars and between 1000 and200 pc for stars with spectral types M0 to M6.
Five stars in the ChESS catalog have formal distance esti-mates placing them within 20 pc; all five have SIMBAD coun-terparts. Two, CXOMP J080500.8+103001 and J144232.8+011710, are identified as giant stars, rendering our main-sequencedistance estimates invalid. Two others, CXOMP J171954.1+263003 and J171952.9+263003, appear to be members of abinary system, despite rather different photometric distance es-timates (8.2 and 5 pc); a trigonometric parallax has been de-rived for the brighter component (J171954.1+263003/V647Her),placing the system at a distance of 12 pc. The last of the five,
Fig. 5.—Simulated J vs. J � KS color-magnitude diagram, produced by theTRILEGAL galaxy model for SDSS/2MASS observations of a 10 deg2 field,with the ChESS stars overplotted ( plus signs). The contours and points corre-spond to the distribution of 10,254 dwarf stars (log g � 3:5); 368 giants arehighlighted as asterisks. The solid lines enclose the area of the diagram in whichgiants are most populous. The dot-dashed line is J ¼ 12; fainter than this mag-nitude, giants make up only �10% of the total number of stars, while brighterthan this value they dominate the stellar population. We estimate that �10% ofthe ChESS stars are giants. [See the electronic edition of the Supplement for acolor version of this figure.]
ChaMP EXTENDED STELLAR SURVEY 349No. 2, 2008
CXOMP J080813.5+210608/LHS 5134, is also likely to benearby: it is identified in SIMBAD as an M2.5 star, with a dis-tance estimate of �10 pc from spectroscopic parallax.
5.5. Stellar X-Ray Luminosities
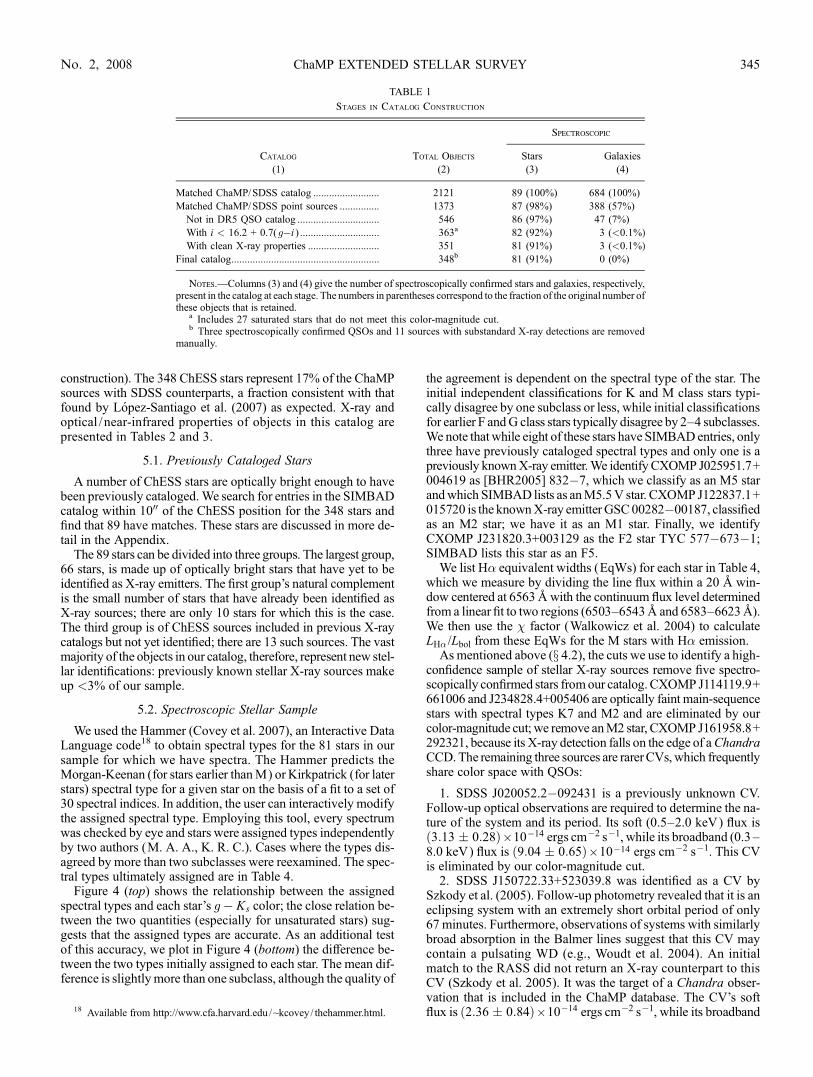
Having estimated the distances to our stars, we determine theirX-ray luminosities using both the soft (0.5–2.0 keV) and broad-band (0.5–8 keV) ChaMPfluxes, whose construction is describedin Kim et al. (2007b).19 The resulting LX values are included inTable 2; herewe limit our discussion to soft X-ray luminosities forcomparison purposes. These luminosities are shown in Figure 7 asa function of distance, along with data from several other catalogsof stellar X-ray emitters. The primary source of the comparisondata presented here is ROSAT: we include the Schmitt & Liefke(2004) and Hunsch et al. (1999) catalogs (0.1–2.4 keV luminos-ities). We also include the 11 stars identified by Feigelson et al.(2004) in the CDF-N (0.5–2 keV) and the nine stars in the Lopez-Santiago et al. (2007)XMMBSS sample (0.5–4.5 keV) for whichthey provide distances. Compared to these surveys, the ChESScatalog samples a unique area in the LX-distance plane, cover-ing the ranges of 2 ; 1026 ergs s�1PLXP 2 ; 1031 ergs s�1 and30 pcP dP 3000 pc.
The ChESS stars are for the most part more luminous thanthose in the volume-complete sample assembled by Schmitt &Liefke (2004). Despite their low intrinsic luminosities, the near-est stars have moderately large X-ray fluxes (�10�12 ergs cm�2
s�1). Fields in the Chandra archive including such sources areexplicitly excluded from the ChaMP survey: the increased like-lihood of saturation in X-ray and optical imaging reduces theability to detect and classify other X-ray sources in the field and
greatly complicates the calculation of the effective area sampledby the observation.The larger catalog of stellar X-ray emitters assembled by
Hunsch et al. (1999) provides a more natural comparison to ourChESS catalog. The LX lower limit of each sample increaseswith distance, as expected for flux-limited catalogs. While thedistance limit of the ChESS catalog is fundamentally optical innature (due to the CMD cut described in x 4.4), a crude com-parison of the relative sensitivities of the surveys can be madeby comparing the distances to which each instrument can detectstars of a given LX: the Hunsch et al. (1999) sample includes starswith LX ¼ 1028 ergs s�1 to a distance of 30 pc, while the ChESScatalog contains such stars out to 200 pc. The surface density ofstars in the ChESS catalog (�10 deg�2) exceeds that of theHunsch et al. (1999) catalog (3 ; 10�4 deg�2) by nearly 5 ordersof magnitude.Figure 7 shows that the ChESS stars’ properties are most sim-
ilar to those of stars included in otherChandra andXMM catalogs.These catalogs are not interchangeable, however. For example,while the luminosities of the Feigelson et al. (2004) CDF-N starsare comparable to those of the least luminous members of theChESS catalog, that sample’s effective distance limit is beyondthat of the ChESS catalog for equivalent X-ray luminosities. Con-versely, because the Lopez-Santiago et al. (2007) sample relies ontrigonometric parallax measurements for distances, these XMM-detected stars, while also comparably X-ray luminous to theChESS stars, make up a shallower sample.We also present in Table 2 the hardness ratio (HR) for each
source, where HR ¼ (Hc � Sc)/(Hc þ Sc) and Hc and Sc are thenumber of hard and soft counts, respectively (Kim et al. 2007b).The stars in our catalog are quite soft, with typical HRs from�1.0to �0.6; HR shows no clear correlation with LX or g� Ks.
5.6. Stellar Bolometric Luminosities
For each star, we derive the bolometric luminosity using theg� Ks color and the appropriate Kraus & Hillenbrand (2007)bolometric correction. The resulting LX/Lbol ratios are presentedin Table 2 and shown in Figure 6 (bottom) as a function ofg� Ks.
Fig. 7.—Values of LX as a function of distance for several samples of X-ray-emitting stars: filled circles, ChESS stars with unsaturated SDSS photometryand clean X-ray detections; stars, those with saturated SDSS photometry and/orflaggedX-ray detections. Also shown are the samples of Schmitt& Liefke (2004)(open dark gray circles), Hunsch et al. (1999) (open light gray circles), Feigelsonet al. (2004) (diamonds), and Lopez-Santiago et al. (2007) (asterisks). [See theelectronic edition of the Supplement for a color version of this figure.]
Fig. 6.—Top: Distance to ChESS stars as a function of g� Ks color: points,stars with unsaturated SDSS photometry and clean X-ray detections; stars, thosewith saturated SDSS photometry and/or flagged X-ray detections; dashed line,the distance limit imposed by the i vs. g� i CMD cut described in x 4.4. Bottom:LX/Lbol as a function of g� Ks.
19 Note that this conversion assumes a � ¼ 1:7 power-law X-ray spectrum;variations in coronal temperature and metallicity can produce count to flux-conversion factors that differ by a factor of 2.
COVEY ET AL.350 Vol. 178

The lower limit to the LX/Lbol values in the ChESS catalogis shaped by the sample’s effective LX limit, which is a functionof the exposure times of the Chandra images used to build theChaMP. The presence of an upper envelope at LX/Lbol � 10�3,however, reflects a physical characteristic of the stars. Previousinvestigators have found a similar empirical upper limit to the ef-ficiency of stellar X-ray emission (e.g., Vilhu & Rucinski 1983;Vilhu 1987; Herbst & Miller 1989; Stauffer et al. 1994). Whilethe cause of this so-called saturation is still unknown, it is mostcommonly attributed to feedback processes that quench the ef-ficiency of the stellar dynamo and/or the ability of the dynamo toheat the coronal plasma (Collier Cameron & Jianke 1994) or tocentrifugal stripping of the coronal plasma at the high rotationalvelocities associated with large LX (Jardine 2004).
Figure 8 compares nonsimultaneous measures of the strengthof the H� emission line, a common diagnostic of chromosphericactivity, with LX/Lbol, a tracer of coronal activity for stars in ourspectroscopic sample. Similarmeasurements fromMstars in youngclusters and the solar neighborhood (e.g., Reid et al. 1995) havefound LX ¼ (3 5)LH� but were typically made using ROSATdata. As stellar coronae produce very soft X-ray emission, it is un-surprising that the ChESS data, measuring harder X-rays, pro-duces an LX/Lbol ratio of�2/3, lower than the ROSAT-measuredratio by a factor of 5.
The correlation between LX/Lbol and LH� /Lbol in the ChESSdata, however, is highly significant by Cox proportional hazard(P ¼ 0:0008), Kendall’s � (P ¼ 0:0027), and Spearman’s � tests(P ¼ 0:0064), as implemented in the Astronomy Survival Anal-ysis Package (Lavalley et al. 1992). We perform bivariate linearregressions with log (LX/Lbol) as the dependent variable, usingthe parametric emission measure (EM) algorithm, and find thebest-fit relationship
log LH�=Lbolð Þ ¼ 0:58 � 0:13ð Þ log LX=Lbolð Þ � 1:69 � 0:48ð Þ
ð2Þ
with rms residuals of 0.39; this relationship is shown as the so-lid line in Figure 8. When restricting the sample to LX/Lbol <3 ; 10�4, the best-fit regression line steepens to
log (LH�=Lbol) ¼ (1:27 � 0:24) log (LX=Lbol)þ (1:13 � 0:94);
ð3Þ
shown as the dot-dashed line in Figure 8, with rms residuals of0.31.
The steepening of the LX/Lbol versus LH� /Lbol relation whenhigh LX/Lbol sources are excluded and the turnover in LH� /Lbol atlarge LX/Lbol that is clearly visible in Figure 8 reveal that starswith very active coronae can possess very pedestrian chromo-spheres, at least when viewed at distinct epochs. To ensure thatthis effect is not merely an effect of uncertain H�measurementsin low signal-to-noise ratio (S/N) spectra, we visually inspectedthe H� region in the stars with LX/Lbol > 3 ; 10�4. We find thatthese spectra are of high enough quality to confirm that only verylow levels of H� emission are present in these stars. We alsoverified that there are no significant differences in the spectraltype or Galactic height of stars when the sample is divided atLX/Lbol ¼ 3 ; 10�4.
There exist at least two plausible explanations for this seemingdisconnect between the chromospheric and coronal properties ofthe stars with the most active coronae:
1. Our X-ray-selected sample is biased toward detecting flar-ing stars, whose nonsimultaneous optical spectra may be obtained
when the star has returned to quiescence. The seeming disconnectbetween the coronal and chromospheric properties would thensimply reflect the temporal disconnect in the observations of thesestars. If this is the case, an extremely crude indicator of the dutycycle of X-ray flares onM stars in the Galactic disk can be derivedfrom the �45% (19/43) of the sample with low, and presumablyquiescent, H� luminosity: the failure to observe significant H�emission during spectroscopic exposures with a median lengthof 720 s would imply a upper limit on the typical flare rate of5 H� flares hr�1.
2. Alternatively, the lack of correlation between chromosphericand coronal emissionmay be a sign that these two types of activitydecouple as coronal activity levels approach the saturated re-gime. This hypothesis has been advanced previously (e.g., Cram1982; Pettersen 1987; Mathioudakis & Doyle 1989; Houdebineet al. 1996); in this scenario, the relative efficiencies of radiativeprocesses that cool the corona and chromosphere (e.g., H�, Ca ii,and Mg emission, highly ionized X-ray line emission, and ultra-violet continuum emission) are sensitive to the strength of stellaractivity. To explain the effect seen here, extreme levels of stellaractivity would have to quench cooling of the chromosphere viaH� emission even as the corona continues to be cooled efficientlyby X-rays.
The relatively weak coronae implied by the LX/LH� relation-ship measured from the low-activity portion of our sample andits apparent breakdown at high activity levels present intriguingclues to the temporal behavior of coronal activity over timescalescharacteristic of both the nonsimultaneity effects (t < 10 yr) andpopulation effects (t > 1 Gyr) discussed above. The current sam-ple of stars with measurements of both LX/Lbol and LH� /Lbol istoo small, however, to draw firm conclusions. We defer a fullanalysis of these effects to follow-up studies.
5.7. Stellar Colors
While the clearest signatures of magnetic activity are spec-troscopic in nature, stellar activity can impact a star’s broadbandcolors as well. In particular, magnetically active stars appear topossess ultraviolet (UV) excesses of 0.03–0.1 mag in U � B
Fig. 8.—Top: H� EqW vs. LX /Lbol for stars with ChaMP spectra. NegativeEqWs indicate the presence of absorption lines. F, G, and K stars are shown withplus signs; M stars are indicated with diamonds. The downward-pointing ar-rows indicate the EqW upper limits for M stars with no detected H� emission.Bottom: LH� /Lbol vs. LX /Lbol for the M stars in the spectroscopic sample, withsymbols as above. The solid line is the best-fit relation between LH� /Lbol andLX /Lbol for the entire sample. The dot-dashed line is the relation for the stars withLX /Lbol < 3 ; 10�4, a value indicated by the vertical dashed line. [See the elec-tronic edition of the Supplement for a color version of this figure.]
ChaMP EXTENDED STELLAR SURVEY 351No. 2, 2008

compared to nonactive stars. This excess has been attributed tocontinuum emission generated from hot, active chromospheres(Houdebine et al. 1996; Houdebine & Stempels 1997; Amado&Byrne 1997; James et al. 2000; Sung et al. 2002; Amado 2003;Bochanski et al. 2007).
The u� g versus g� r color-color diagram in Figure 9 showsevidence for a similar shift, with X-ray-emitting, optically un-saturated ChESS stars lying systematically lower than the me-dian u� g versus g� r locus measured by Covey et al. (2007)from a sample of optically selected SDSS/2MASS stars. Thisshift in color-color space, however, is not unambiguous proof ofa u� g excess, as the offset could be caused by a red excess ing� r, particularly since active stars can have strong H� emis-sion that contributes additional flux to the r band. Our spectro-scopic sample, however, does not include any stars with H�equivalent widths significantly larger than 10 8 (see Table 4),and even such strong H� emission lines contribute only a smallfraction to the flux transmitted through a �1000 8 wide filter,brightening a star in the r band by only 0.01 mag.
To confirm that the offset in u� g versus g� r is due to thestars’ anomalous u� g colors, we compare the offsets betweenthe u� g and g� r colors of unsaturated stars in our sample andthe median colors of nonactive stars with the same i� Ks colortabulated by Covey et al. (2007) (see Fig. 10, top). While thespread is large, active stars are systematically bluer by 0.12 magin u� g than inactive stars. By contrast, the g� r colors of activestars are consistent with those of inactive stars to within 0.03mag,and there the difference is that active stars are bluer than inactivestars. This is inconsistent with the idea of a redshift caused by theaddition of H� emission into a star’s r band.
While stellar u� g colors are sensitive to metallicity and thepresence of unresolved WD companions, neither effect is likelyto explain the offset seen here. The sensitivity of u� g to met-allicity is due to line blanketing, where absorption by a largenumber of metal lines in the u band leads to preferentially redderu� g colors formoremetal-rich stars. Interpreted as ametallicityeffect, however, the �0.1 mag blue u� g offset implies thatX-ray luminous stars havemetallicities more than half a dex lowerthan the standard field population (Karaali et al. 2005), exceed-
ingly unlikely given the well-known link between stellar age andX-ray luminosity.Similarly, while main-sequence stars with an unresolved WD
companion have anomalously blue u� g colors, as well as thepotential for enhanced X-ray luminosity, the colors of the stars inour sample disagree with those expected for such binaries. TheSDSS colors of WD/main sequence binaries found by Smolcicet al. (2004) and Silvestri et al. (2006) are shown in Figure 9.While there may be a handful of such systems in our sample, thebulk of the ChESS stars are redder in u� g than would be ex-pected for systems with WD components.To investigate the cause of this u� g offset, Figure 10 also
shows the magnitude of the u� g offset as a function of LX, LX/Lbol, and i� Ks , a proxy for stellar temperature and mass. Aslight tendency for the offset to increase with LX/Lbol may bepresent, particularly when considering only stars of a given spec-tral type, but linear regression does not return a statistically sig-nificant correlation between the two variables. Onewould expectthe u� g excess to be most prominent for M stars, which typi-cally have the highest activity and the lowest quiescent UV flux,allowing contributions from the chromosphere to affect the stars’u� g most significantly. Instead, the u� g excess reaches amaximum for K stars (at i� Ks � 2:0) and then decreases intothe M regime. Whether this effect is real or the result of obser-vational bias is hard to access, in part because of the increaseduncertainties in u� g for late-type stars caused by the red leak inthe SDSS camera.20 The additional scatter in the u� g colors ofthese stars may wash out evidence for trends of �(u� g) witheither LX or color. Follow-up studies with more reliable u pho-tometry are needed to reveal the nature of any correlation be-tween u� g excess and coronal or chromospheric activity.
5.8. Stellar Populations
Previous studies have found that magnetically active stars havea smaller Galactic scale height than nonactive stars (e.g., Westet al. 2008). To determine how the stars in our catalog are dis-tributed between the different Galaxy components, we use eachstar’s distance and Galactic latitude to calculate its height in theGalactic disk.We show in Figure 11 the resulting Galactic heightsas a function of both Galactic latitude and stellar color. If ourcatalog were probing a spherically symmetric halo population,the color-magnitude cut imposed in x 4.4 would limit the catalogmainly as a function of the heliocentric distance to each star.Sight lines probing higher Galactic latitudes would sample starsat larger Galactic heights. The distribution of Galactic heights inthe sample is independent of Galactic latitude, however, indi-cating that the distribution of stars within the disk of the MilkyWay imposes a stricter distance limit than the color-magnitudecut imposed in x 4.4.Stauffer & Hartmann (1986) and Leggett (1992) have corre-
lated the near-infrared colors of M stars and their metallicitiesand kinematics, allowing them to define regions of J � H versusH � Ks color-color space dominated by young and old disk stars.In Figure 12 (top), we compare the JHKs colors of M stars in oursample to the boundary defined by Leggett (1992) between young
Fig. 9.—Values of u� g vs. g� r for the ChESS stars with unsaturated SDSSphotometry and unflagged X-ray detections ( filled circles) with the opticallyselected SDSS/2MASS sample constructed by Covey et al. (2007) shown forcomparison, as in Fig. 3. The line running through the contours is the medianstellar colors of the Covey et al. (2007) sample; the lower, dot-dashed line showsthe locus of WD/M dwarf pairs identified by Smolcic et al. (2004). [See theelectronic edition of the Supplement for a color version of this figure.]
20 The red leak describes an instrumental effect whereby the u-band filtertransmits flux longward of 7100 8 due to changes in the filter’s interferencecoating under vacuum. This instrumental effect depends on a star’s raw u and rmag-nitudes, which in turn are dependent on the air mass, seeing, and the sensitivity ofeach u filter as a function of wavelength and stellar spectrum. Given the complexityof this effect, the SDSS photometric pipeline does not attempt to correct each star’su-band photometry, resulting in increased u uncertainties of 0.02 mag for K stars,0.06mag forM0 stars, and 0.3mag for stars with r � i > 1:5. Formore informationsee http://www.sdss.org /dr6 /products /catalogs.
COVEY ET AL.352 Vol. 178

and old disk stars. This boundary nearly bisects our sample, sug-gesting that the ChESS catalog contains both young stars and thehigh-activity tail of the old disk population. Figure 12 (bottom)also shows LX/Lbol for these M stars as a function of their offsetfrom the young/old-disk boundary. The lowest activity sources(LX/Lbol � 10�5) are uniformly identified with the old disk pop-ulation, a clear signature of the decay of magnetic activity withage. Interpreting the significance of the many old disk stars withlarge LX/Lbol values is less straightforward, particularly becausethese active old disk stars are likely merely color outliers of the
vastly more numerous young disk population. If these high LX/Lbol stars are truly members of the old disk, however, they wouldrepresent a new and very significant population of stars that ex-perience little decay of magnetic activity over their lifetimes.
6. CONCLUSIONS
We have correlated the Extended Chandra MultiwavelengthProject with the Sloan Digital Sky Survey to identify the 348X-ray-emitting stars of the ChaMP Extended Stellar Survey.We used morphological star /galaxy separation, matching to an
Fig. 10.—Top: Histograms of color differences between unsaturated ChESS stars and optically selected stars with identical i� Ks. Differences for u� g (solid line)and g� r (dashed line) are shown. Second from top: u� g differences for unsaturated stars as a function of LX. M stars are shown as crosses, while F, G, and K stars areshown as diamonds; lighter diamonds indicate later-type stars. Third from top: u� g differences for unsaturated stars as a function of LX /Lbol. Bottom: u� g differences forunsaturated stars as a function of i� Ks. [See the electronic edition of the Supplement for a color version of this figure.]
ChaMP EXTENDED STELLAR SURVEY 353No. 2, 2008

SDSS quasar catalog, an optical color-magnitude cut, and X-raydata-quality tests to identify the ChESS stars from a sample of2121 matched ChaMP/SDSS sources.
1. Our cuts retain 91% of the spectroscopically confirmed starsin the original sample while excluding 99.6% of the 684 spec-troscopically confirmed extragalactic sources. Fewer than 3% ofthe sources in our final catalog are previously identified stellarX-ray emitters.
2. For 42 catalog members, spectroscopic classifications areavailable in the literature. We present new spectral classifica-tions and H�measurements for an additional 79 stars. We derivedistances to the stars in our catalog using photometric parallaxrelations appropriate for dwarfs on the main sequence and cal-culate their X-ray and bolometric luminosities. For 36 newlyidentifiedX-ray -emittingM stars we also providemeasurementsof LH� /Lbol.
3. The stars in our catalog lie in a unique space in the LX-distance plane, filling the gap between the nearby stars identifiedas counterparts to sources in the ROSATAll Sky Survey and themore distant stars detected in other Chandra and XMM-Newtonsurveys.
4. The ChESS catalog is dominated by main-sequence stars.By comparing the distribution of the ChESS sample in J versusJ � KS space to that of simulated SDSS/2MASS observationsgenerated by TRILEGAL, we estimate that the total fraction ofgiants in the catalog is �10%. In addition to seven confirmedgiant stars (including a possible Cepheid and an RR Lyrae star),we identify three cataclysmic variables.
5. We find that LH� /Lbol and LX/Lbol are linearly related be-low LX/Lbol � 3 ; 10�4, while LH� /Lbol appears to turn over atlarger LX/Lbol values.
6. Stars with reliable SDSS photometry have an �0.1 magblue excess in u� g, likely due to increased chromospheric con-tinuum emission. Photometric metallicity estimates suggest thatour sample is evenly split between the young and old disk pop-ulations of the Galaxy; the lowest activity sources are identifiedwith the old disk population, a clear signature of the decay ofmagnetic activity with age.
Future papers will present analyses of ChESS source vari-ability and comparisons of the ChESS catalog to models of stel-lar activity in the Galactic disk.
We thank Suzanne Hawley, Andrew West, Steven Saar, andThomas Fleming for useful discussions of stellar magnetic ac-tivity; we also thank the anonymous referee and editor for usefulcomments that improved thework presented here.We are indebtedto the staffs at the National Optical Astronomy Observatories(NOAO), LasCampanas, and theMMT for assistancewith opticalspectroscopy. Special thanks to observers includingWarrenBrown,Perry Berlind, and Michael Calkins, for FAST spectroscopyfrom the Fred Lawrence Whipple Observatory 1.5 m on MountHopkins, and to Susan Tokarz and Nathalie Marthimbeau forreductions.Support for this work was provided by the National Aeronau-
tics and Space Administration (NASA) through Chandra, awardAR4-5017X and AR6-7020X issued by the Chandra X-ray Ob-servatory Center, which is operated by the Smithsonian Astro-physical Observatory for and on behalf of NASA under contractNAS 08-03060. Further NASA support was provided to K. R. C.through the Spitzer Space TelescopeFellowship Program, througha contract issued by the Jet Propulsion Laboratory, CaliforniaInstitute of Technology under a contract with NASA. M. A. issupported by anNational Science Foundation (NSF)Astronomyand Astrophysics Postdoctoral Fellowship under award AST 06-02099. D. H. is supported by a NASA Harriett G. Jenkins Pre-doctoral Fellowship.This work is based in part on observations obtained at CTIO
and KPNO, NOAO, operated by the Association of Universitiesfor Research in Astronomy, Inc. under cooperative agreementwith the NSF.
Fig. 11.—Left: Height in the Galactic disk (in parsecs) as a function of Galacticlatitude. Right: Height in the Galactic disk (in parsecs) as a function of g� Ks.Symbols are as in Fig. 7. Fig. 12.—Top: Values of J � H vs.H � Ks for ChESSM stars with unflagged
X-ray detections. The dashed line is the boundary between the regions identifiedby Stauffer & Hartmann (1986) and Leggett (1992) as populated preferentiallyon one side by relatively high-metallicity young-disk stars and on the other byrelatively low-metallicity old-disk stars. Bottom: LX /Lbol as a function of offset inJ � H from the young-disk /old-disk boundary in the top panel.
COVEY ET AL.354 Vol. 178

This research has made use of NASA’s Astrophysics DataSystem Bibliographic Services, the SIMBAD database, operatedat CDS, Strasbourg, France, the NASA/IPACExtragalactic Data-base, operated by the Jet Propulsion Laboratory, California In-stitute of Technology, under contract with NASA, and the VizieRdatabase of astronomical catalogs (Ochsenbein et al. 2000). IRAF(Image Reduction andAnalysis Facility) is distributed byNOAO,which are operated by the Association of Universities for Re-search in Astronomy, Inc., under cooperative agreement with theNSF.
Funding for the SDSS and SDSS-II has been provided bythe Alfred P. Sloan Foundation, the Participating Institutions,the NSF, the U.S. Department of Energy, NASA, the JapaneseMonbukagakusho, the Max Planck Society, and the Higher Edu-cation Funding Council for England. The SDSS Web Site ishttp://www.sdss.org/.
The SDSS is managed by the Astrophysical Research Consor-tium for the Participating Institutions. The Participating Institu-tions are the AmericanMuseum of Natural History, Astrophysical
Institute Potsdam, University of Basel, University of Cambridge,Case Western Reserve University, University of Chicago, DrexelUniversity, Fermilab, the Institute for Advanced Study, the JapanParticipation Group, Johns Hopkins University, the Joint Institutefor Nuclear Astrophysics, the Kavli Institute for Particle Astro-physics and Cosmology, the Korean Scientist Group, the ChineseAcademy of Sciences (LAMOST), Los Alamos National Lab-oratory, the Max-Planck-Institute for Astronomy (MPIA), theMax-Planck-Institute forAstrophysics (MPA), NewMexico StateUniversity, Ohio State University, University of Pittsburgh, Uni-versity of Portsmouth, Princeton University, the United StatesNaval Observatory, and the University of Washington.
The Two Micron All Sky Survey was a joint project of theUniversity of Massachusetts and the Infrared Processing andAnalysis Center (California Institute of Technology). The Uni-versity of Massachusetts was responsible for the overall man-agement of the project, the observing facilities, and the dataacquisition. The Infrared Processing and Analysis Center wasresponsible for data processing, distribution, and archiving.
APPENDIX A
ChaMP SOURCES WITH SIMBAD COUNTERPARTS
In Table 5 we present the optical data for the 66 stars cataloged in SIMBAD that we have identified as ChaMP X-ray sources, andinclude additional information (spectral type, binarity, variability) where available. We searched the literature for evidence that thesestars had been identified as X-ray sources and could find no previous X-ray detections; we therefore consider these all to be new X-raysource identifications. Four stars are positionally coincident with X-ray sources in otherChandra catalogs but are not explicitly listedin SIMBAD as X-ray emitters or identified in these catalogs as stars, and we therefore consider them also to be new identifications.CXOMP J084944.7+445840 is among the sources detected in Lynx (Stern et al. 2002) and listed in the Serendipitous Extragalactic X-RaySource Identification (SEXSI; Harrison et al. 2003) catalog but is unidentified in both catalogs. CXOMP J085005.3+445819 andJ090941.7+541939 are both unidentified SEXSI sources. Finally, CXOMP J162157.2+381734 is less than 1000 from 1RXS J162157.6+381727, an unidentified RASS source.
Thirteen ChaMP stellar sources do not have SIMBAD optical counterparts but are included in other X-ray catalogs. However, ourexamination of these catalogs reveals no additional information about the nature of these sources, and we also consider these to be newX-ray-source identifications. For example, CXOMP J084854.0+450230 is within 100 of the X-ray source [STS2002] 43 (Stern et al.2002), but the catalog for that survey does not include an identification for this X-ray source or for two other ChaMP sources.Similarly, eight ChaMP sources listed in the SEXSI catalog and two observed in Bootes by Wang et al. (2004) are not identified.CXOMP J141120.7+521411 is included in three catalogs and unidentified in all three, although a magnitude is given for the counterpartby Zickgraf et al. (2003) in their catalog of RASS BSC sources. CXOMP J125152.2+000528 is listed by Zickgraf et al. (2003) but isunidentified. CXOMP J214229.3+123322 is within 400 of the unidentified RASS source 1RXS J214229.5+123323. These sources arelisted in Table 6. In total, we have 79 ChESS stars with cataloged optical or X-ray data but which had not previously been identified asstellar X-ray sources.
Finally, 10 ChESS stars are previously known stellar X-ray sources. We list these in Table 7. A full examination of the properties ofthese stars (e.g., a comparison of their previously reported fluxes to those detected by Chandra) is beyond the scope of this paper.
TABLE 5
ChaMP Sources with SIMBAD Counterparts
CXOMP
SIMBAD
Counterpart
Sep.
(arcsec)
B
(mag)
V
(mag) Comments
J015941.6�084506............................ BD�09 375 0.4 11.90 10.80 . . .
J015959.7+003220............................. [BHR2005] 829�29 1.8 . . . . . . M3.5 V
J023132.5�072724............................ TYC 4704�81�1 1.1 11.70 11.20 . . .J025951.7+004619............................. [BHR2005] 832�7 0.0 . . . . . . M5.5 V
J072501.4+371351............................. TYC 2464�396�1 0.9 10.55 9.52 . . .
J072545.4+365905............................. BD+37 1715 0.6 10.72 10.28 F5
J074108.8+311346............................. 2MASS J07410881+3113463 0.0 19.20 . . . . . .
J080500.8+103001............................. HD 66686 1.9 8.17 7.29 G5 III
J080853.8+201641............................. BD+20 2009 2.3 10.86 10.60 F5
J080920.5+202322............................. BD+20 2011 1.2 10.82 10.14 F0
J081539.2+364742............................. TYC 2482�1192�1 1.7 11.70 11.10 . . .
J084044.7+130713............................. TYC 805�471�1 1.2 11.80 11.20 . . .
J084944.7+445840a,b ......................... HD 75117 0.8 8.45 7.98 G0
ChaMP EXTENDED STELLAR SURVEY 355No. 2, 2008

TABLE 5—Continued
CXOMP
SIMBAD
Counterpart
Sep.
(arcsec)
B
(mag)
V
(mag) Comments
J085005.3+445819b ........................... HD 75172 4.2 9.24 8.98 F5
J085318.2+281106............................. TYC 1949�1327�1 1.5 11.20 10.39 . . .
J085325.7+232919............................. 2MASS J08532577+2329194 1.1 . . . . . . . . .
J085711.0+085651............................. TYC 811�1921�1 2.6 11.10 10.70 . . .
J090941.7+541939b ........................... TYC 3805�167�1 2.5 10.95 10.50 . . .J091432.7+561238............................. HD 237796 0.6 10.65 9.61 K5
J091444.7+562104............................. TYC 3809�904�1 1.8 11.40 10.90 . . .
J093342.5+340154............................. TYC 2497�1154�1 0.8 11.70 11.30 . . .
J093905.4+005146............................. TYC 235�1240�1 2.1 11.50 11.00 . . .J095427.2+410515............................. BD+41 2023 1.7 11.10 10.36 K0
J095721.0+465821............................. TYC 3433�1205�1 2.0 11.60 10.90 . . .
J103857.9+400335............................. TYC 3005�806�1 1.3 10.50 10.22 . . .J104320.6+005954............................. TYC 254�1148�1 3.3 11.90 11.10 . . .
J105202.9+160544............................. CCDM J10520+1606AB 0.6 8.68 8.31 F5 ��
J105211.8+161002............................. BD+16 2181 0.9 9.93 9.66 F5
J111446.9+532038 ............................. TYC 3824�287�1 1.2 11.19 10.71 . . .J111548.9+532234 ............................. 2MASS J11154905+5322345 1.4 12.80 . . . . . .
J111607.3+013512 ............................. CCDM J11161+0135AB 0.8 9.48 9.01 F8 ��
J111607.3+013509 ............................. CCDM J11161+0135AB 3.2 9.48 9.01 F8 ��
J114144.3+654114 ............................. HD 101557 1.5 9.65 8.97 G5
J115931.2+553109............................. GPM 179.879716+55.519459 1.2 12.00 11.50 . . .
J120041.3+290512............................. BD+29 2244 4.1 11.08 10.57 F6
J120154.0+575636............................. HD 104482 0.9 9.48 9.02 F5
J120205.1+575539............................. HD 238063 0.4 10.37 9.97 F5
J124533.5+005914............................. HD 110935 1.5 9.98 9.08 G5
J125152.0+000505............................. HD 111816 1.0 8.31 7.83 F8
J125605.1+260117............................. BD+26 2407 2.3 10.09 9.73 F2
J125615.7+564817............................. GSC 03845�00748 1.2 12.50 . . . . . .
J130115.9+002958............................. NLTT 32614 2.6 10.45 9.59 K0 PM�
J130549.6+035341............................. LSPM J1305+0353 0.4 18.80 . . . PM�
J130908.5+212721............................. CCDM J13091+2127AB 0.9 8.93 8.34 G5 ��
J130955.3+573403............................. HD 114505 1.1 9.80 9.21 G
J131043.9�031731............................ HD 114465 0.7 9.12 8.71 F8
J131057.7+011553............................. StKM 1�1052 3.2 . . . 11.40 K5
J133143.4+111132 ............................. BD+11 2580 0.7 11.00 9.96 K0
J141345.7+000710............................. 2MASS J14134569+0007068 2.8 18.96 . . . . . .
J141349.2+000806............................. 2MASS J14134944+0008055 3.5 15.97 . . . . . .
J141808.1+264743............................. HD 125320 0.8 8.93 8.19 G5 IV
J143800.1+033528............................. HD 128645 0.5 9.72 9.40 F5
J144232.8+011710............................. BD+01 2965 0.7 10.41 9.10 K0 III
J144300.8+012423............................. 2MASS J14430071+0124239 1.8 15.30 . . . . . .
J144430.1�012826............................ 2MASS J14443011�0128261 0.3 15.30 15.29 RR�
J144848.7+474041............................. GSC 03477�01108 1.1 14.00 . . . . . .
J152209.8+524435............................. HD 137146 1.9 9.70 9.26 F8
J153203.6+240505............................. BD+24 2880 0.8 9.86 9.42 F8
J153658.6+120011............................. GPM 234.244393+12.002844 0.7 12.40 11.30 . . .J160234.6+423021............................. HD 144129 0.6 9.85 9.46 F5
J162157.2+381734c ........................... TYC 3062�1317�1 0.2 11.80 10.50 Ce�d
J162357.2+311253............................. TYC 2580�796�1 0.7 11.70 11.50 . . .J170137.9+400548............................. TYC 3076�801�1 3.0 10.93 10.11 . . .
J171952.9+263003............................. NLTT 44615 1.0 13.80 13.60 PM�
J231820.3+003129............................. HD 219752 1.1 9.54 9.11 F5
J231956.4+003418............................. TYC 577�673�1 1.0 11.90 11.20 . . .
Notes.—The double asterisks (��) indicate a double or multiple star, ‘‘PM�’’ indicates a high proper motion stars,‘‘RR�’’ a RR Lyrae-type variable, and ‘‘Ce�’’ a Cepheid-type variable.
a Source cataloged in Stern et al. (2002).b Source cataloged in Harrison et al. (2003).c Source cataloged in Vizier Online Data Catalog, 9029 (W. Voges et al. 2000).d While this star is classified as a Cepheid byAkerlof et al. (2000), inspection of the Northern SkyVariability Survey
(Wozniak et al. 2004) light curve for this object suggests that this is not a classical Cepheid.
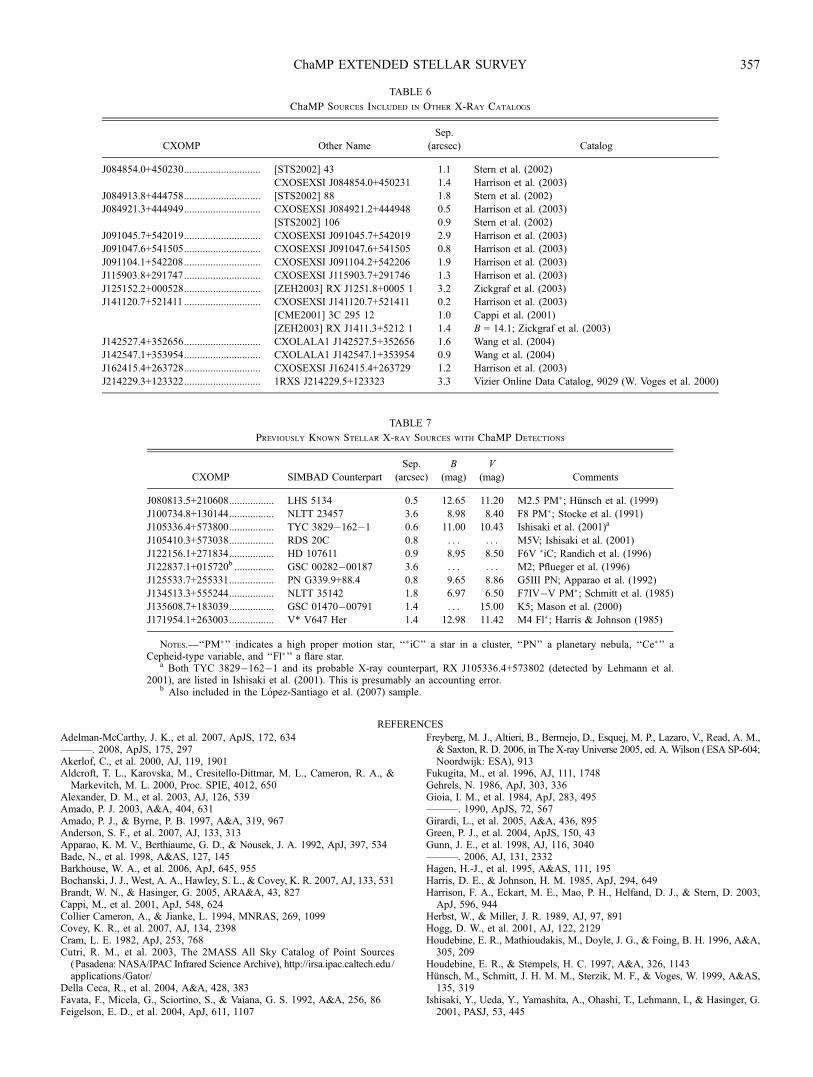
REFERENCES
Adelman-McCarthy, J. K., et al. 2007, ApJS, 172, 634———. 2008, ApJS, 175, 297Akerlof, C., et al. 2000, AJ, 119, 1901Aldcroft, T. L., Karovska, M., Cresitello-Dittmar, M. L., Cameron, R. A., &Markevitch, M. L. 2000, Proc. SPIE, 4012, 650
Alexander, D. M., et al. 2003, AJ, 126, 539Amado, P. J. 2003, A&A, 404, 631Amado, P. J., & Byrne, P. B. 1997, A&A, 319, 967Anderson, S. F., et al. 2007, AJ, 133, 313Apparao, K. M. V., Berthiaume, G. D., & Nousek, J. A. 1992, ApJ, 397, 534Bade, N., et al. 1998, A&AS, 127, 145Barkhouse, W. A., et al. 2006, ApJ, 645, 955Bochanski, J. J., West, A. A., Hawley, S. L., & Covey, K. R. 2007, AJ, 133, 531Brandt, W. N., & Hasinger, G. 2005, ARA&A, 43, 827Cappi, M., et al. 2001, ApJ, 548, 624Collier Cameron, A., & Jianke, L. 1994, MNRAS, 269, 1099Covey, K. R., et al. 2007, AJ, 134, 2398Cram, L. E. 1982, ApJ, 253, 768Cutri, R. M., et al. 2003, The 2MASS All Sky Catalog of Point Sources(Pasadena: NASA/IPAC Infrared Science Archive), http://irsa.ipac.caltech.edu/applications /Gator/
Della Ceca, R., et al. 2004, A&A, 428, 383Favata, F., Micela, G., Sciortino, S., & Vaiana, G. S. 1992, A&A, 256, 86Feigelson, E. D., et al. 2004, ApJ, 611, 1107
Freyberg, M. J., Altieri, B., Bermejo, D., Esquej, M. P., Lazaro, V., Read, A. M.,& Saxton, R. D. 2006, in The X-ray Universe 2005, ed. A. Wilson (ESA SP-604;Noordwijk: ESA), 913
Fukugita, M., et al. 1996, AJ, 111, 1748Gehrels, N. 1986, ApJ, 303, 336Gioia, I. M., et al. 1984, ApJ, 283, 495———. 1990, ApJS, 72, 567Girardi, L., et al. 2005, A&A, 436, 895Green, P. J., et al. 2004, ApJS, 150, 43Gunn, J. E., et al. 1998, AJ, 116, 3040———. 2006, AJ, 131, 2332Hagen, H.-J., et al. 1995, A&AS, 111, 195Harris, D. E., & Johnson, H. M. 1985, ApJ, 294, 649Harrison, F. A., Eckart, M. E., Mao, P. H., Helfand, D. J., & Stern, D. 2003,ApJ, 596, 944
Herbst, W., & Miller, J. R. 1989, AJ, 97, 891Hogg, D. W., et al. 2001, AJ, 122, 2129Houdebine, E. R., Mathioudakis, M., Doyle, J. G., & Foing, B. H. 1996, A&A,305, 209
Houdebine, E. R., & Stempels, H. C. 1997, A&A, 326, 1143Hunsch, M., Schmitt, J. H. M. M., Sterzik, M. F., & Voges, W. 1999, A&AS,135, 319
Ishisaki, Y., Ueda, Y., Yamashita, A., Ohashi, T., Lehmann, I., & Hasinger, G.2001, PASJ, 53, 445
TABLE 6
ChaMP Sources Included in Other X-Ray Catalogs
CXOMP Other Name
Sep.
(arcsec) Catalog
J084854.0+450230............................. [STS2002] 43 1.1 Stern et al. (2002)
CXOSEXSI J084854.0+450231 1.4 Harrison et al. (2003)
J084913.8+444758............................. [STS2002] 88 1.8 Stern et al. (2002)
J084921.3+444949............................. CXOSEXSI J084921.2+444948 0.5 Harrison et al. (2003)
[STS2002] 106 0.9 Stern et al. (2002)
J091045.7+542019............................. CXOSEXSI J091045.7+542019 2.9 Harrison et al. (2003)
J091047.6+541505............................. CXOSEXSI J091047.6+541505 0.8 Harrison et al. (2003)
J091104.1+542208............................. CXOSEXSI J091104.2+542206 1.9 Harrison et al. (2003)
J115903.8+291747............................. CXOSEXSI J115903.7+291746 1.3 Harrison et al. (2003)
J125152.2+000528............................. [ZEH2003] RX J1251.8+0005 1 3.2 Zickgraf et al. (2003)
J141120.7+521411............................. CXOSEXSI J141120.7+521411 0.2 Harrison et al. (2003)
[CME2001] 3C 295 12 1.0 Cappi et al. (2001)
[ZEH2003] RX J1411.3+5212 1 1.4 B = 14.1; Zickgraf et al. (2003)
J142527.4+352656............................. CXOLALA1 J142527.5+352656 1.6 Wang et al. (2004)
J142547.1+353954............................. CXOLALA1 J142547.1+353954 0.9 Wang et al. (2004)
J162415.4+263728............................. CXOSEXSI J162415.4+263729 1.2 Harrison et al. (2003)
J214229.3+123322............................. 1RXS J214229.5+123323 3.3 Vizier Online Data Catalog, 9029 (W. Voges et al. 2000)
TABLE 7
Previously Known Stellar X-ray Sources with ChaMP Detections
CXOMP SIMBAD Counterpart
Sep.
(arcsec)
B
(mag)
V
(mag) Comments
J080813.5+210608................. LHS 5134 0.5 12.65 11.20 M2.5 PM�; Hunsch et al. (1999)
J100734.8+130144................. NLTT 23457 3.6 8.98 8.40 F8 PM�; Stocke et al. (1991)
J105336.4+573800................. TYC 3829�162�1 0.6 11.00 10.43 Ishisaki et al. (2001)a
J105410.3+573038................. RDS 20C 0.8 . . . . . . M5V; Ishisaki et al. (2001)
J122156.1+271834................. HD 107611 0.9 8.95 8.50 F6V �iC; Randich et al. (1996)
J122837.1+015720b ............... GSC 00282�00187 3.6 . . . . . . M2; Pflueger et al. (1996)
J125533.7+255331................. PN G339.9+88.4 0.8 9.65 8.86 G5III PN; Apparao et al. (1992)
J134513.3+555244................. NLTT 35142 1.8 6.97 6.50 F7IV�V PM�; Schmitt et al. (1985)
J135608.7+183039................. GSC 01470�00791 1.4 . . . 15.00 K5; Mason et al. (2000)
J171954.1+263003................. V* V647 Her 1.4 12.98 11.42 M4 Fl�; Harris & Johnson (1985)
Notes.—‘‘PM�’’ indicates a high proper motion star, ‘‘�iC’’ a star in a cluster, ‘‘PN’’ a planetary nebula, ‘‘Ce�’’ aCepheid-type variable, and ‘‘Fl�’’ a flare star.
a Both TYC 3829�162�1 and its probable X-ray counterpart, RX J105336.4+573802 (detected by Lehmann et al.2001), are listed in Ishisaki et al. (2001). This is presumably an accounting error.
b Also included in the Lopez-Santiago et al. (2007) sample.
ChaMP EXTENDED STELLAR SURVEY 357

Ivezic, Z., et al. 2004, Astron. Nachr., 325, 583James, D. J., Jardine, M. M., Jeffries, R. D., Randich, S., Collier Cameron, A.,& Ferreira, M. 2000, MNRAS, 318, 1217
Jardine, M. 2004, A&A, 414, L5Karaali, S., Bilir, S., & Tuncel, S. 2005, Publ. Astron. Soc. Australia, 22, 24Kim, D.-W., et al. 2004a, ApJ, 600, 59———. 2004b, ApJS, 150, 19———. 2006, ApJ, 644, 829
Kim, M., Wilkes, B. J., Kim, D.-W., Green, P. J., Barkhouse, W. A., Lee, M. G.,Silverman, J. D., & Tananbaum, H. D. 2007a, ApJ, 659, 29
Kim, M., et al. 2007b, ApJS, 169, 401Kraus, A. L., & Hillenbrand, L. A. 2007, AJ, 134, 2340Lavalley, M., Isobe, T., & Feigelson, E. 1992, in ASP Conf. Ser. 25, AstronomicalData Analysis Software and Systems I, ed. D. M. Worrall, C. Biemesderfer,& J. Barnes (San Francisco: ASP), 245
Leggett, S. K. 1992, ApJS, 82, 351Lehmann, I., et al. 2001, A&A, 371, 833Lopez-Santiago, J., Micela, G., Sciortino, S., Favata, F., Caccianiga, A., DellaCeca, R., Severgnini, P., & Braito, V. 2007, A&A, 463, 165
Mason, K. O., et al. 2000, MNRAS, 311, 456Mathioudakis, M., & Doyle, J. G. 1989, A&A, 224, 179Monet, D. G., et al. 2003, AJ, 125, 984Nieto-Santisteban, M. A., et al. 2004, in ASP Conf. Ser. 314, AstronomicalData Analysis Software and Systems (ADASS) XIII, ed. F. Ochsenbein,M. G. Allen, & D. Egret (San Francisco: ASP), 666
Ochsenbein, F., Bauer, P., & Marcout, J. 2000, A&AS, 143, 23Parejko, J. K., Constantin, A., Vogeley, M. S., & Hoyle, F. 2008, AJ, 135, 10Pettersen, B. R. 1987, Vistas Astron., 30, 41Pflueger, B., Otterbein, K., & Staubert, R. 1996, A&A, 305, 699Popesso, P., et al. 2004, A&A, 423, 449Randich, S., Schmitt, J. H. M. M., & Prosser, C. 1996, A&A, 313, 815Reid, N., Hawley, S. L., & Mateo, M. 1995, MNRAS, 272, 828Richards, G. T., et al. 2004, ApJS, 155, 257———. 2006, AJ, 131, 2766———. 2007, in BAAS, AAS Meeting 211, 142.02Saxton, R. D., Read, A. M., Esquej, P., Freyberg, M. J., Altieri, B., & Bermejo,D. 2008, A&A, 480, 611
Schmitt, J. H. M. M., Golub, L., Harnden, Jr., F. R., Maxson, C. W., Rosner, R.,& Vaiana, G. S. 1985, ApJ, 290, 307
Schmitt, J. H. M. M., & Liefke, C. 2004, A&A, 417, 651Schmitt, J. H. M. M., et al. 1995, ApJ, 450, 392Scranton, R., et al. 2002, ApJ, 579, 48Silverman, J. D., et al. 2005, ApJ, 624, 630———. 2008, ApJ, 679, 118Silvestri, N. M., et al. 2006, AJ, 131, 1674Skrutskie, M. F., et al. 1997, in The Impact of Large Scale Near-IR Sky Sur-veys, ed. F. Garzon et al. (Dordrecht: Kluwer), 25
———. 2006, AJ, 131, 1163Smith, J. A., et al. 2002, AJ, 123, 2121Smolcic, V., et al. 2004, ApJ, 615, L141Stauffer, J. R., Caillault, J.-P., Gagne, M., Prosser, C. F., & Hartmann, L. W.1994, ApJS, 91, 625
Stauffer, J. R., & Hartmann, L. W. 1986, ApJS, 61, 531Stern, D., et al. 2002, AJ, 123, 2223Stocke, J. T., et al. 1983, ApJ, 273, 458———. 1991, ApJS, 76, 813Stoughton, C., et al. 2002, AJ, 123, 485Sung, H., Bessell, M. S., Lee, B.-W., & Lee, S.-G. 2002, AJ, 123, 290Szkody, P., et al. 2003, AJ, 126, 1499———. 2005, AJ, 129, 2386Vilhu, O. 1987, in Cool Stars, Stellar Systems and the Sun, ed. J. L. Linsky &R. E. Stencel (Berlin: Springer), 110
Vilhu, O., & Rucinski, S. M. 1983, A&A, 127, 5Voges, W., et al. 1999, A&A, 349, 389Walkowicz, L. M., Hawley, S. L., & West, A. A. 2004, PASP, 116, 1105Wang, J. X., et al. 2004, AJ, 127, 213Watson, M., & the XMM-Newton Survey Science Centre Consortium. 2006,BAAS, 38, 365
Weinstein, M. A., et al. 2004, ApJS, 155, 243Weisskopf, M. C., Brinkman, B., Canizares, C., Garmire, G., Murray, S., &Van Speybroeck, L. P. 2002, PASP, 114, 1
West, A. A., Hawley, S. L., Bochanski, J. J., Covey, K. R., Reid, I. N., Dhital,S., Hilton, E. J., & Masuda, M. 2008, AJ, 135, 785
Woudt, P. A., et al. 2004, MNRAS, 351, 1015Wozniak, P. R., et al. 2004, AJ, 127, 2436Zickgraf, F.-J., et al. 2003, A&A, 406, 535
COVEY ET AL.358