the challenge of improving air quality in sheffield
TRANSCRIPT
Future workAssessing emissions across networks to aid Policy design
1 Collaboration with SYSTRA – Sheffield Low Emission Zone feasibility study (2013)
Outline
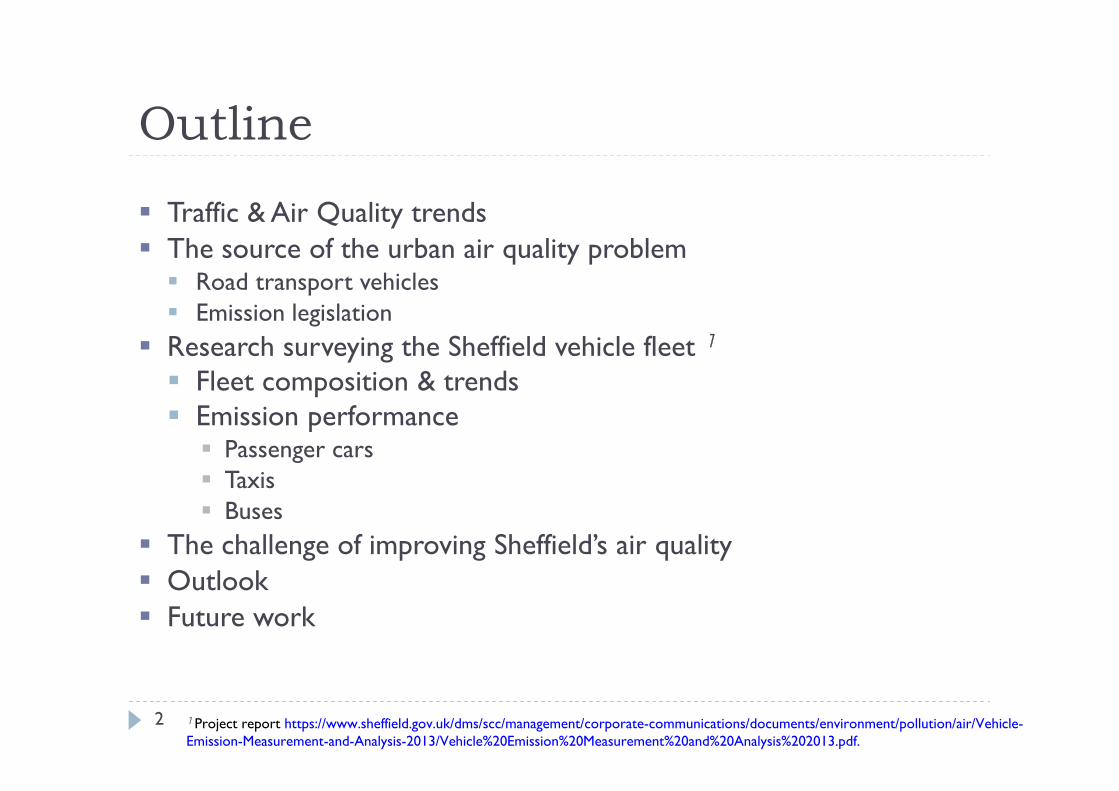
Traffic & Air Quality trends The source of the urban air quality problem Road transport vehicles Emission legislation
Research surveying the Sheffield vehicle fleet 1
Fleet composition & trends Emission performance Passenger cars Taxis Buses
The challenge of improving Sheffield’s air quality Outlook Future work
2 1 Project report https://www.sheffield.gov.uk/dms/scc/management/corporate-communications/documents/environment/pollution/air/Vehicle-Emission-Measurement-and-Analysis-2013/Vehicle%20Emission%20Measurement%20and%20Analysis%202013.pdf.

Traffic Flow TrendsSheffield Central Area Screen-line Surveys
3
2002 2004 2006 2008 2010 2012 2014
02
00
00
40
00
06
00
00
80
00
0
Year
Ve
hic
leT
rip
sp
er
Da
y

Air Quality TrendsNitrogen dioxide (NO2) concentrations in Sheffield
4
2002 2004 2006 2008 2010 2012 2014
02
04
06
08
01
00
12
0
Year
Ro
llin
gA
nn
ua
lMe
an
:N
O2
(g
m3)
UK Air Quality Standard
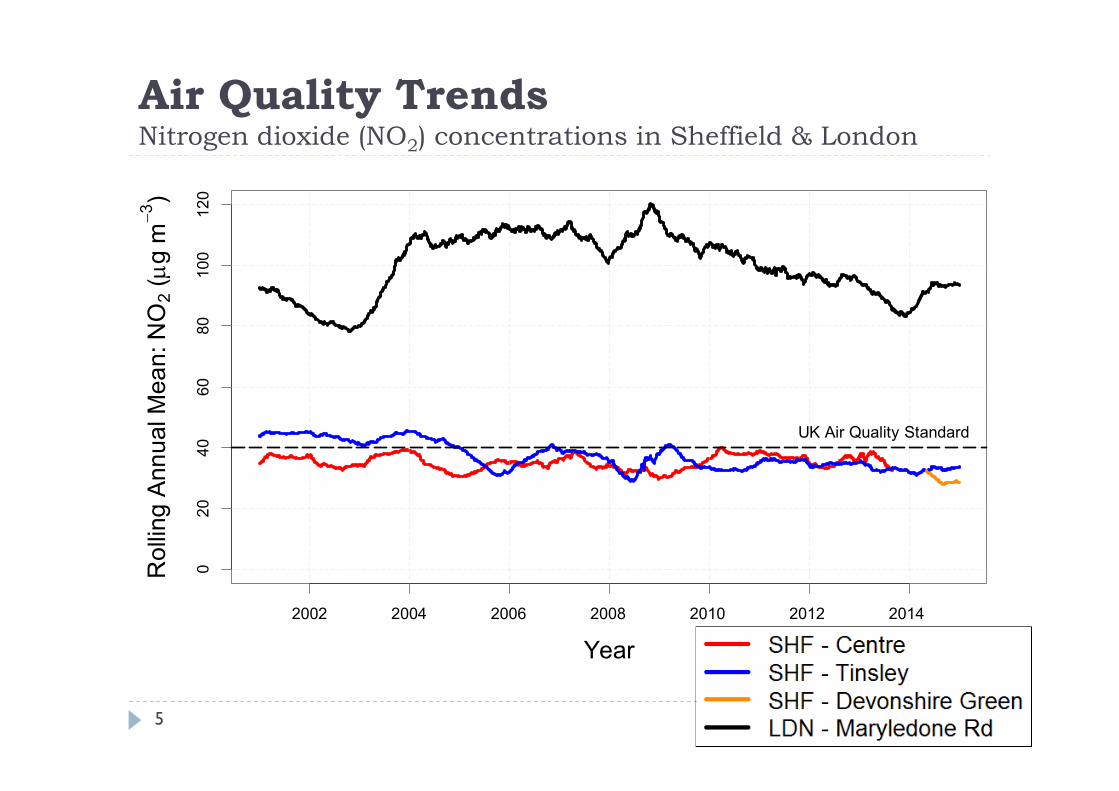
Air Quality TrendsNitrogen dioxide (NO2) concentrations in Sheffield & London
5
2002 2004 2006 2008 2010 2012 2014
02
04
06
080
100
12
0
Year
Ro
llin
gA
nn
ua
lMe
an
:N
O2
(g
m3)
UK Air Quality Standard
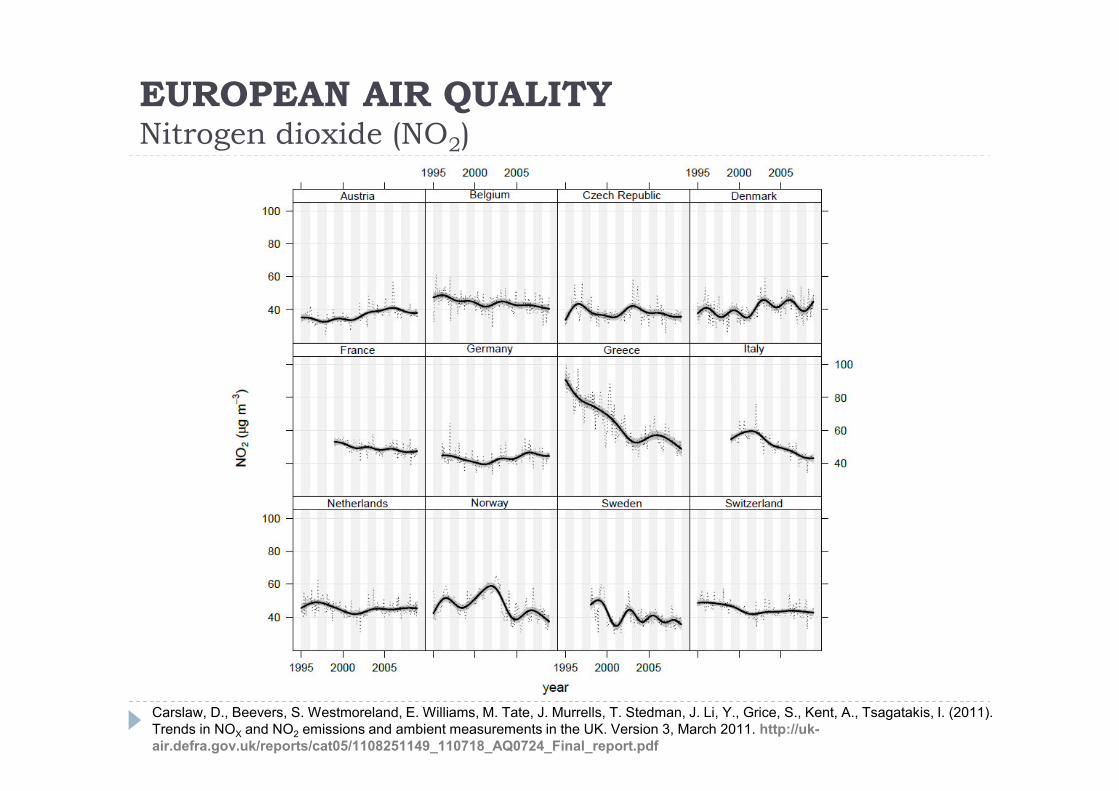
EUROPEAN AIR QUALITYNitrogen dioxide (NO2)
Carslaw, D., Beevers, S. Westmoreland, E. Williams, M. Tate, J. Murrells, T. Stedman, J. Li, Y., Grice, S., Kent, A., Tsagatakis, I. (2011).Trends in NOX and NO2 emissions and ambient measurements in the UK. Version 3, March 2011. http://uk-air.defra.gov.uk/reports/cat05/1108251149_110718_AQ0724_Final_report.pdf
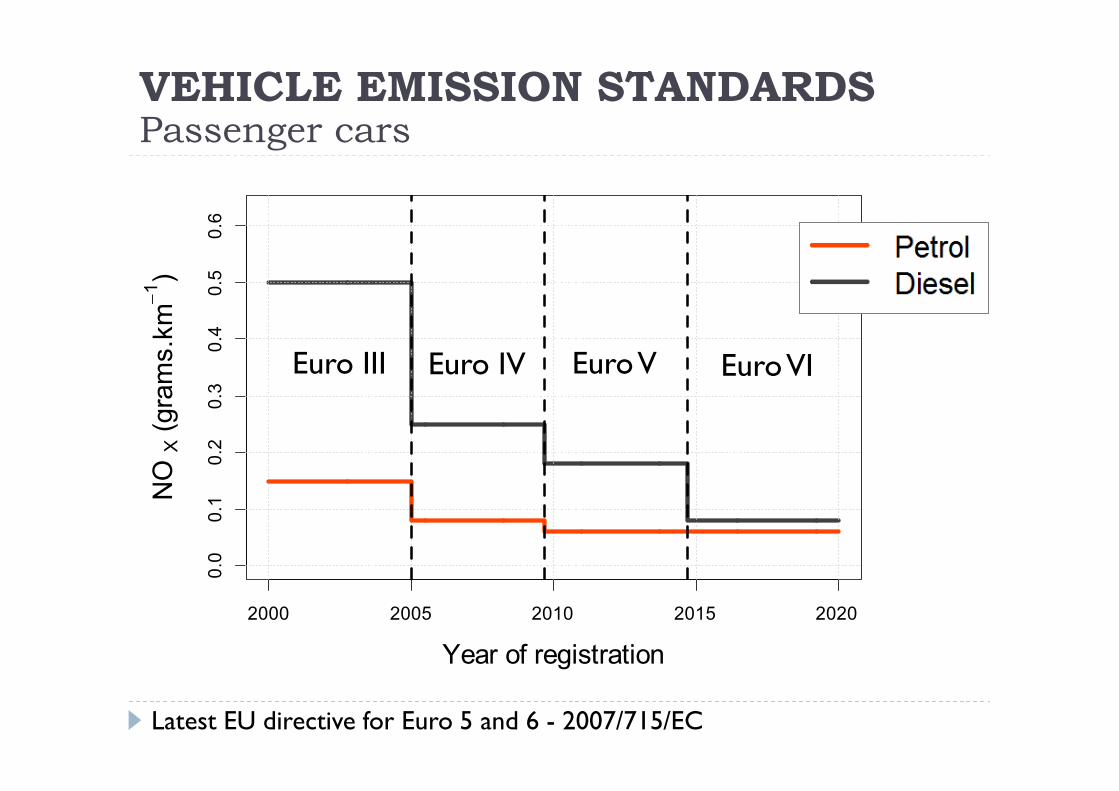
Latest EU directive for Euro 5 and 6 - 2007/715/EC
2000 2005 2010 2015 2020
0.0
0.1
0.2
0.3
0.4
0.5
0.6
Year of registration
NO
X(g
ram
s.k
m
1)
VEHICLE EMISSION STANDARDSPassenger cars
EuroVIEuroVEuro IVEuro III

0 200 400 600 800 1000 1200 1400
020
40
60
80
12
0
NEDC - Speed Profile
Time (seconds)
Spe
ed
(km
h1)
Fig. Speed profile used for type approval purposes (New EU Drive-Cycle)
0 200 400 600 800 1000 1200 1400
01
02
03
04
05
06
0
ARTEMIS Urban - Speed Profile
Time (seconds)
Sp
ee
d(k
mh1)
Fig. Real-world driving: The Common ARTEMIS Drive Cycle (Andre, 2004).
ASSESSMENT OF VEHICLE EMISSIONSVehicle operation
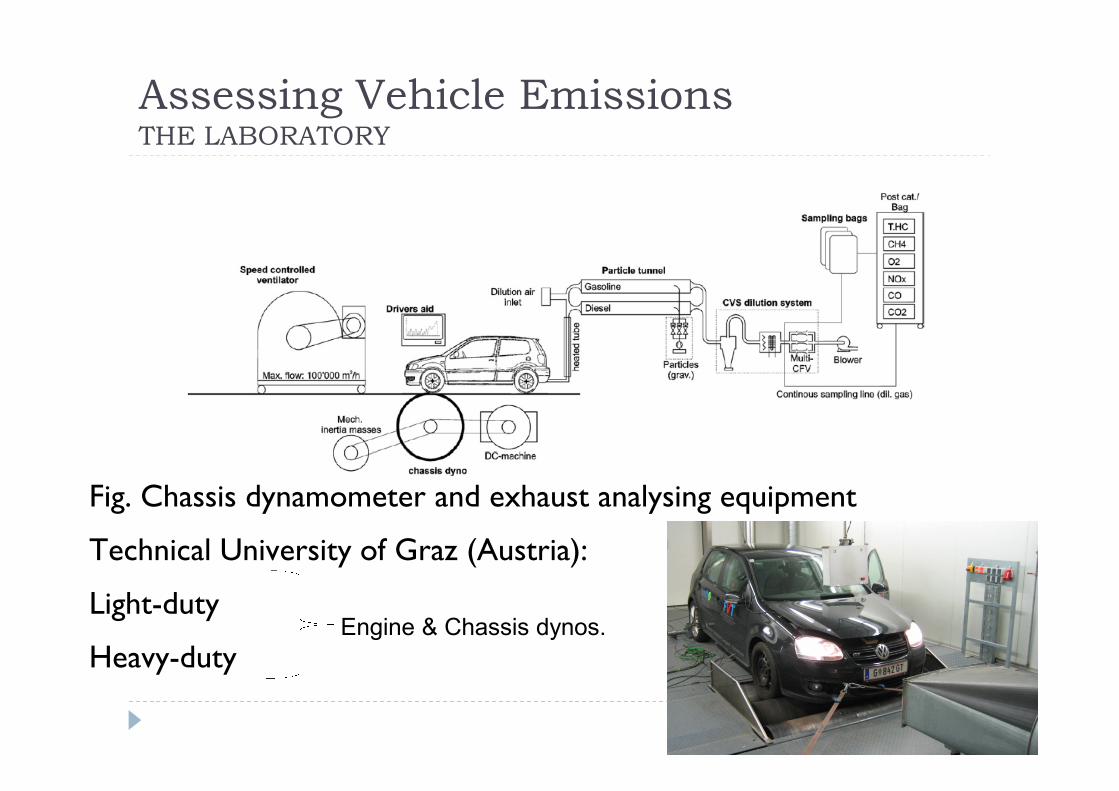
Assessing Vehicle EmissionsTHE LABORATORY
Fig. Chassis dynamometer and exhaust analysing equipment
Technical University of Graz (Austria):
Light-duty
Heavy-dutyEngine & Chassis dynos.

MANIPULATING THE TESTSSignificance
Dings, J. 2013. Mind the Gap! Why official car fuel economy figures don’t match up to reality.Transport and Environment, March 2013.
2002 2004 2006 2008 2010 2012
10
01
05
11
01
15
12
01
25
13
0
Year of first registration
Spri
tmon
itor.
de
/T
ype
ap
pro
valC
O2E
mis
sio
ns
(%)
Spritmonitor.de
• Record mileages andfuel purchased
• 300,000 vehicles
• 4.5 billion vehicle kms

MANIPULATING THE TESTSSignificance
Ligterink, N., Eijk,A. Update analysis of real-world fuel consumption of business passenger carsbased on Travelcard Nederland fuelpass data.TNO report 2014 R11063, July 2014

MANUFACTRER’S CO2 TARGETSAverage car
60
80
100
120
140
160
180
200
1990 1995 2000 2005 2010 2015 2020 2025 2030
Em
iss
ion
s(g
ram
sC
O2.k
m-1
)
Vehic le Model Year
80% reduction (D fT)
90% reduction (D fT)
100% reduction (D fT)
NE D C figures (S MMT New C ar report)
S pritmonitor.de (G ermany) On-road, ~5000/year
Travel card (Netherlands) On-road, ~15000/year
H onestjohn.co.uk (UK ) On-road, ~3000 / year
F uture Targets (IC C T & D fT)
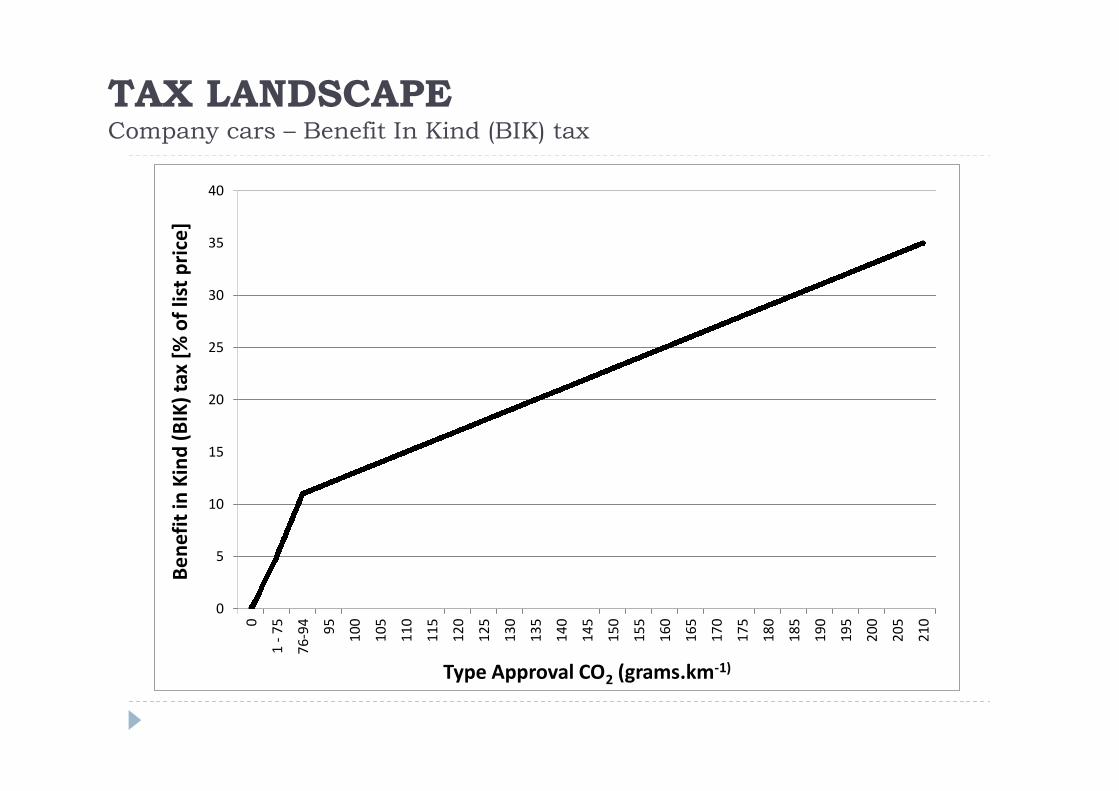
TAX LANDSCAPECompany cars – Benefit In Kind (BIK) tax
0
5
10
15
20
25
30
35
40
0
1-
75
76-
94
95
10
0
10
5
11
0
11
5
12
0
12
5
13
0
13
5
14
0
14
5
15
0
15
5
16
0
16
5
17
0
17
5
18
0
18
5
19
0
19
5
20
0
20
5
21
0
Be
nef
itin
Kin
d(B
IK)
tax
[%o
flis
tp
rice
]
Type Approval CO2 (grams.km-1)

SURVEYING THE VEHICLE FLEETRemote Sensing Vehicle Emissions
14
Sheffield, May 2013

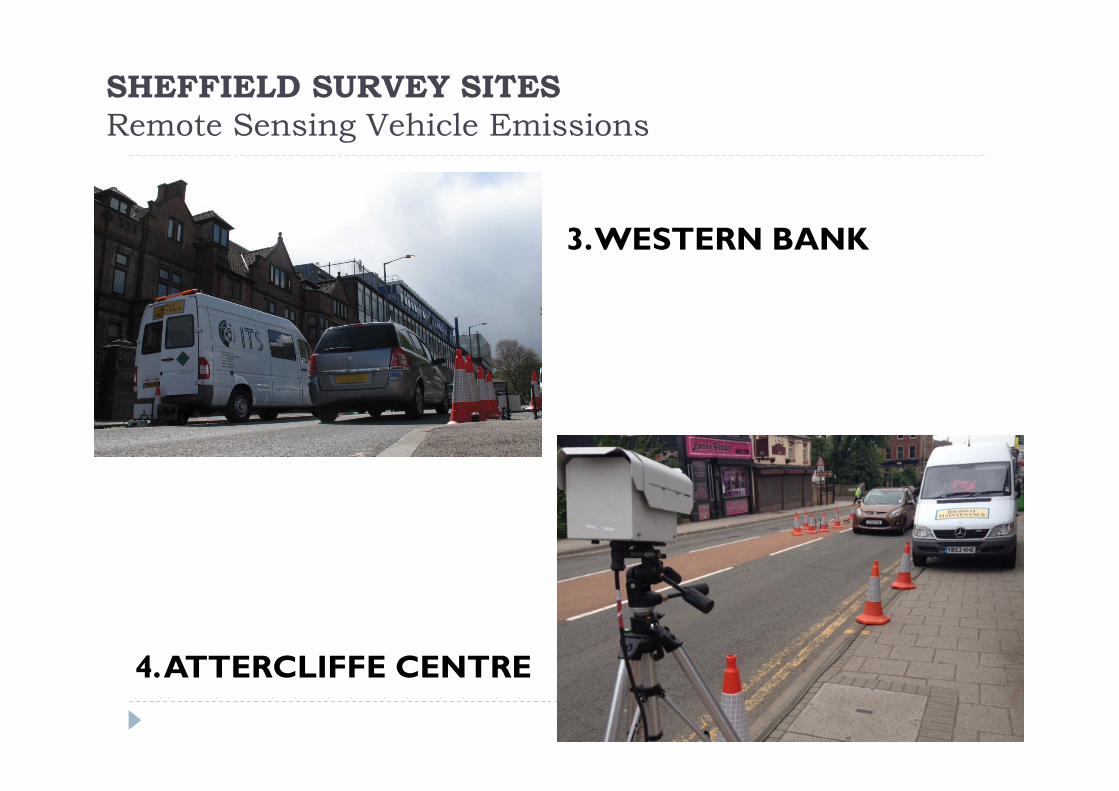
SHEFFIELD SURVEY SITESRemote Sensing Vehicle Emissions

SHEFFIELD SURVEY SITESRemote Sensing Vehicle Emissions
1.ASLINE ROAD
2. EYRE STREET
SHEFFIELD SURVEY SITESRemote Sensing Vehicle Emissions
3.WESTERN BANK
4.ATTERCLIFFE CENTRE

Camera(Number plate)
Vehicle Detector(Speed andAcceleration)
Source/Detector
Mirror Box
Source
Detector
Emissions Analyser(Common
Configurations)
Camera(Number plate)
Vehicle Detector(Speed andAcceleration)
Source/Detector
Mirror Box
Source
Detector
Emissions Analyser(Common
Configurations)
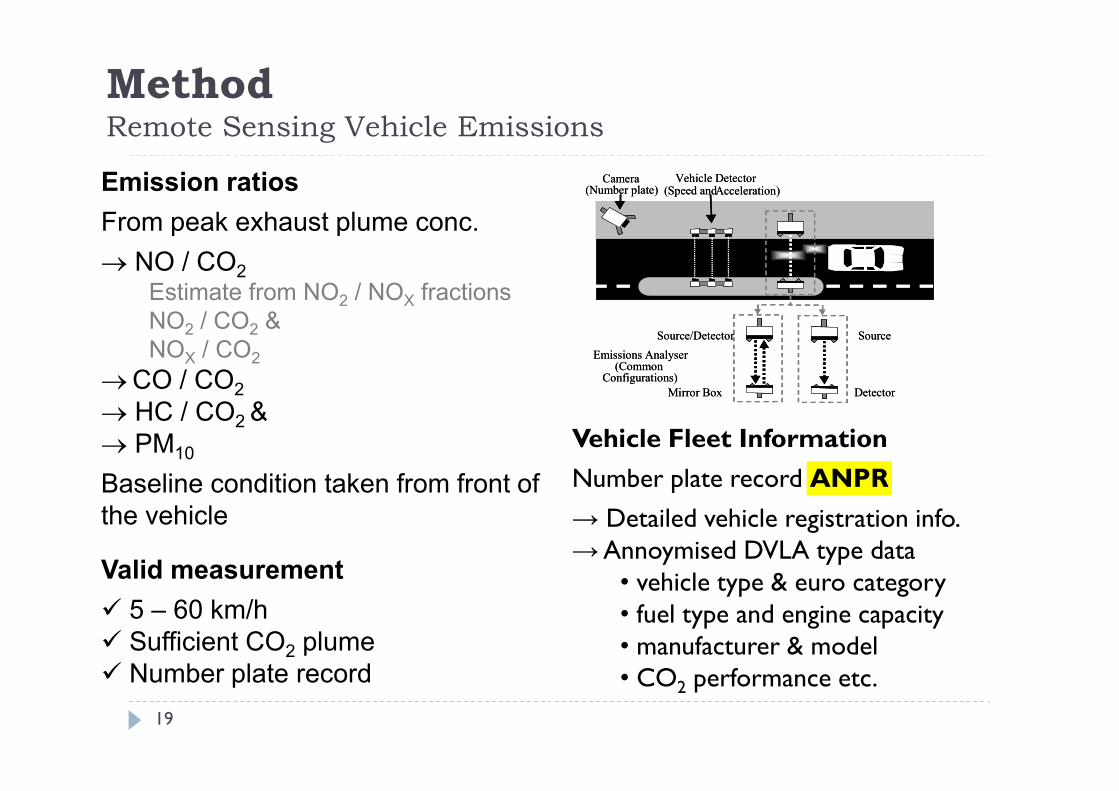
MethodRemote Sensing Vehicle Emissions
ESP RSD-4600 instrument (www.esp-global.com)
UVIR
Camera(Number plate)
Vehicle Detector(Speed andAcceleration)
Source/Detector
Mirror Box
Source
Detector
Emissions Analyser(Common
Configurations)
Camera(Number plate)
Vehicle Detector(Speed andAcceleration)
Source/Detector
Mirror Box
Source
Detector
Emissions Analyser(Common
Configurations)
Emission ratios
From peak exhaust plume conc.
NO / CO2
Estimate from NO2 / NOX fractionsNO2 / CO2 &NOX / CO2
CO / CO2
HC / CO2 & PM10
Baseline condition taken from front ofthe vehicle
Valid measurement
5 – 60 km/h Sufficient CO2 plume Number plate record
MethodRemote Sensing Vehicle Emissions
Vehicle Fleet Information
Number plate record ANPR
→ Detailed vehicle registration info.→Annoymised DVLA type data
• vehicle type & euro category• fuel type and engine capacity• manufacturer & model• CO2 performance etc.
19

MethodRemote Sensing Vehicle Emissions
PROS: “Real-world” or “on road” or “RDE”
Understand the emissionperformance of the vehicle fleet
Trends
Degradation/ ageing technologies
High-emitters
Detailed knowledge of the vehiclefleet composition
Fast turn-round (one month)
Survey emerging technologies
e.g. EuroVI compliant vehicles
Rich research resource
CONS: “Snap-shot” or “single-point”
measurement
Vehicle operating condition unknown
Loading
Cold-start or Hot-running
Elevated exhausts – NULL
Lorries “open” chassis
Practical limitations
Dry weather conditions
Relatively labour intensive
Suitable survey locations limited
20

REMOTE SENSING VEHICLE EMISSIONSPassenger car fleet – Sheffield 2013
0
10
20
30
40
50
Euro 0 Euro 1 Euro 2 Euro 3 Euro 4 Euro 5 Euro 6
Pas
sen
ger
car
shar
e(%
)
Euro standard
Hybrid (diesel)
Hybrid
Diesel
Petrol
Dieselshare
31.9%
Dieselshare
63.6%
Dieselshare
60.8%
Dieselshare
48.8%
Dieselshare
32.4%
Dieselshare
14.1%
Hybridshare
1.73%

aP
etr
ol-E
0
aP
etr
ol-E
1
aP
etr
ol-E
2
aP
etr
ol-E
3
aP
etr
ol-E
4
aP
etr
ol-E
5
aP
etr
ol-E
6
Die
sel-E
0
Die
sel-E
1
Die
sel-E
2
Die
sel-E
3
Die
sel-E
4
Die
sel-E
5
Die
sel-E
6
Hybrid-E
3
Hybrid-E
4
Hybrid-E
5
HybridD
-E5
0
5
10
15
CO(g
ram
s.k
m1
)
CARBON MONOXIDE EMISSIONSPassenger car fleet
aP
etr
ol-E
0
aP
etr
ol-E
1
aP
etr
ol-E
2
aP
etr
ol-E
3
aP
etr
ol-E
4
aP
etr
ol-E
5
aP
etr
ol-E
6
Die
sel-E
0
Die
sel-E
1
Die
sel-E
2
Die
sel-E
3
Die
sel-E
4
Die
sel-E
5
Die
sel-E
6
Hybrid-E
3
Hybrid-E
4
Hybrid-E
5
HybridD
-E5
0
1
2
3
4
NO
X(g
ram
s.k
m1
)
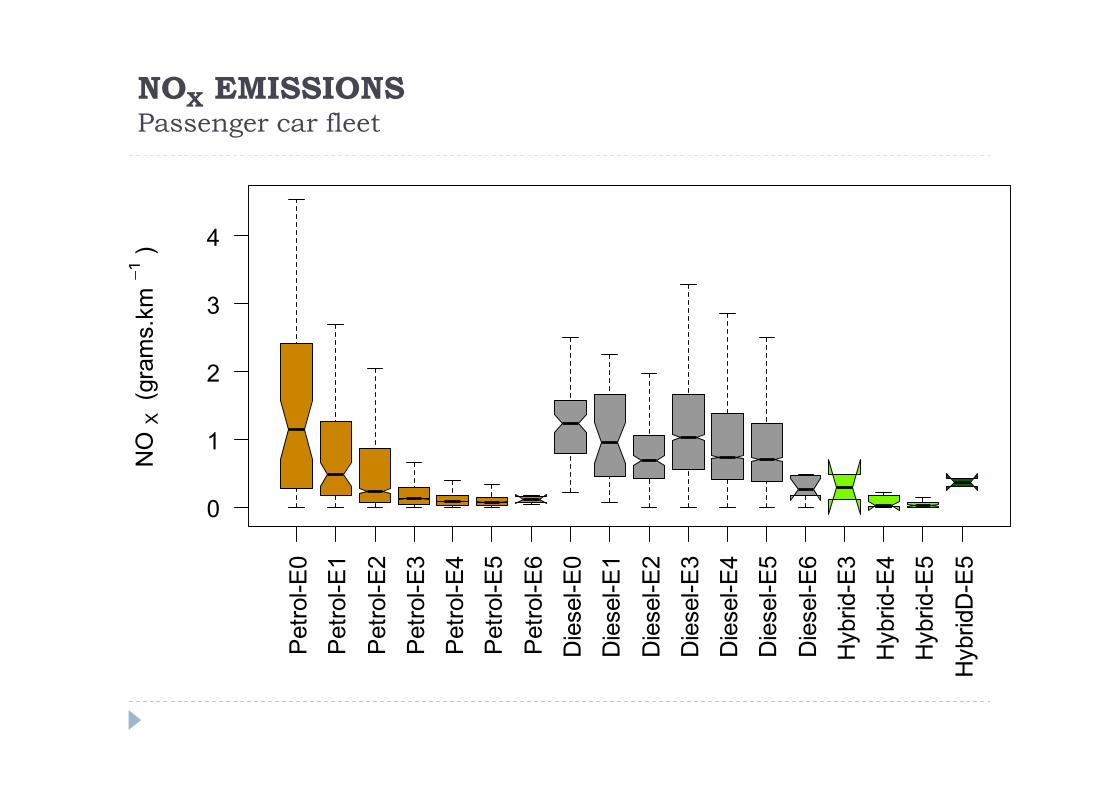
NOX EMISSIONSPassenger car fleet

NOX EMISSIONSPassenger car fleet
Predicted NOX (grams.km-1)Petrol Diesel
1973 1986 1991 1996 2001 2006 2011
0.0
0.5
1.0
1.5
2.0
2.5
3.0
3.5
Year of first registration
NO
X(g
ram
s.k
m1
)
1991 1996 2000 2004 2008 2012
0.0
0.5
1.0
1.5
2.0
2.5
3.0
3.5
Year of first registrationN
OX(g
ram
s.k
m1
)
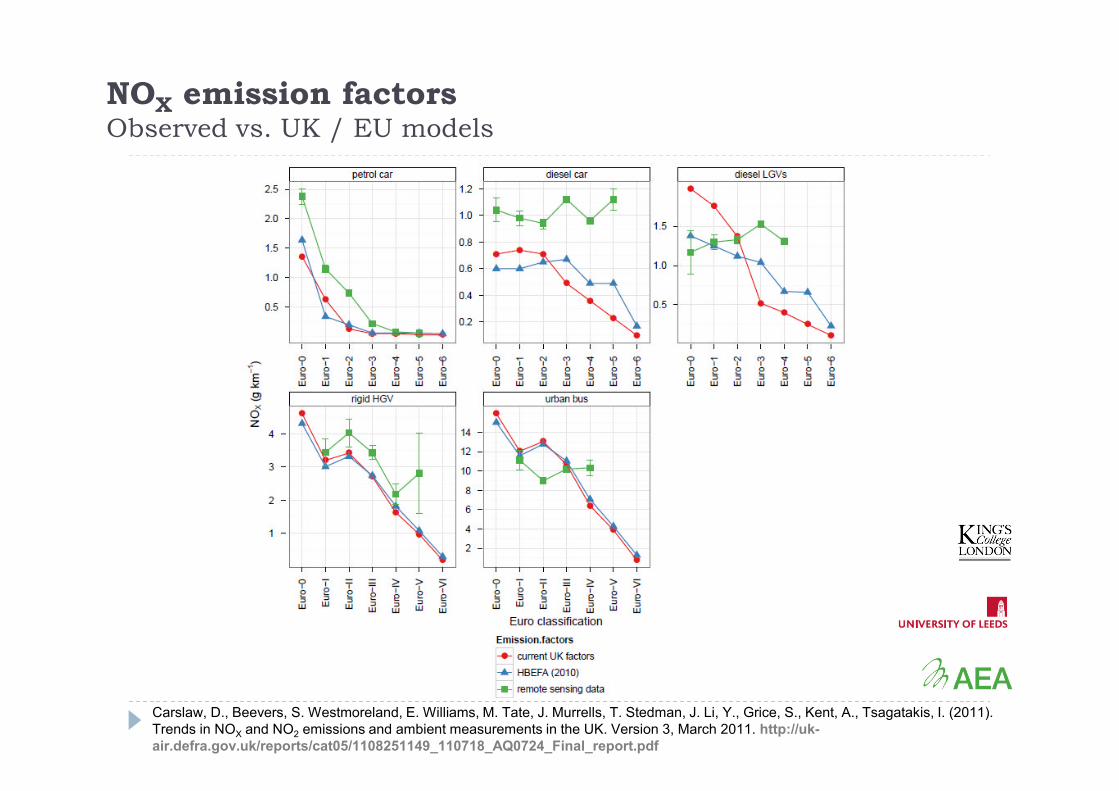
Carslaw, D., Beevers, S. Westmoreland, E. Williams, M. Tate, J. Murrells, T. Stedman, J. Li, Y., Grice, S., Kent, A., Tsagatakis, I. (2011).Trends in NOX and NO2 emissions and ambient measurements in the UK. Version 3, March 2011. http://uk-air.defra.gov.uk/reports/cat05/1108251149_110718_AQ0724_Final_report.pdf
NOX emission factorsObserved vs. UK / EU models
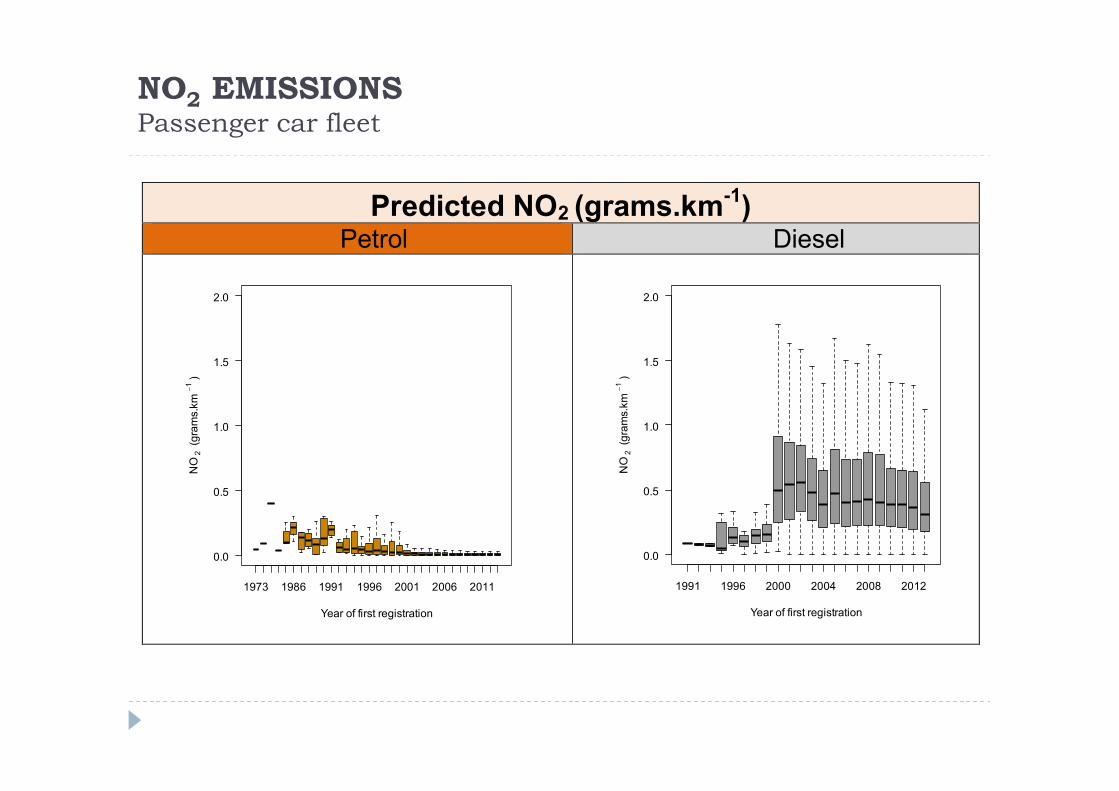
NO2 EMISSIONSPassenger car fleet
Predicted NO2 (grams.km-1)Petrol Diesel
1973 1986 1991 1996 2001 2006 2011
0.0
0.5
1.0
1.5
2.0
Year of first registration
NO
2(g
ram
s.k
m1
)
1991 1996 2000 2004 2008 2012
0.0
0.5
1.0
1.5
2.0
Year of first registrationN
O2(g
ram
s.k
m1
)

aP
etr
ol-E
0
aP
etr
ol-E
1
aP
etr
ol-E
2
aP
etr
ol-E
3
aP
etr
ol-E
4
aP
etr
ol-E
5
aP
etr
ol-E
6
Die
sel-E
0
Die
sel-E
1
Die
sel-E
2
Die
sel-E
3
Die
sel-E
4
Die
sel-E
5
Die
sel-E
6
Hybrid-E
3
Hybrid-E
4
Hybrid-E
5
HybridD
-E5
0
20
40
60
80
100
120
PM
10(index.k
m1
)
PM10 EMISSIONSPassenger car fleet
Die
sel-E
0
Die
sel-E
1
Die
sel-E
2
Die
sel-E
3
Die
sel-E
4
Die
sel-E
5
Die
sel-E
6
Hackney-E
0
Hackney-E
1
Hackney-E
2
Hackney-E
3
Hackney-E
4
Hackney-E
5
Hackney-E
6
PH
V-E
0
PH
V-E
1
PH
V-E
2
PH
V-E
3
PH
V-E
4
PH
V-E
5
PH
V-E
6
PH
VH
ybrid-E
5
0
1
2
3
4
NO
X(g
ram
s.k
m1
)
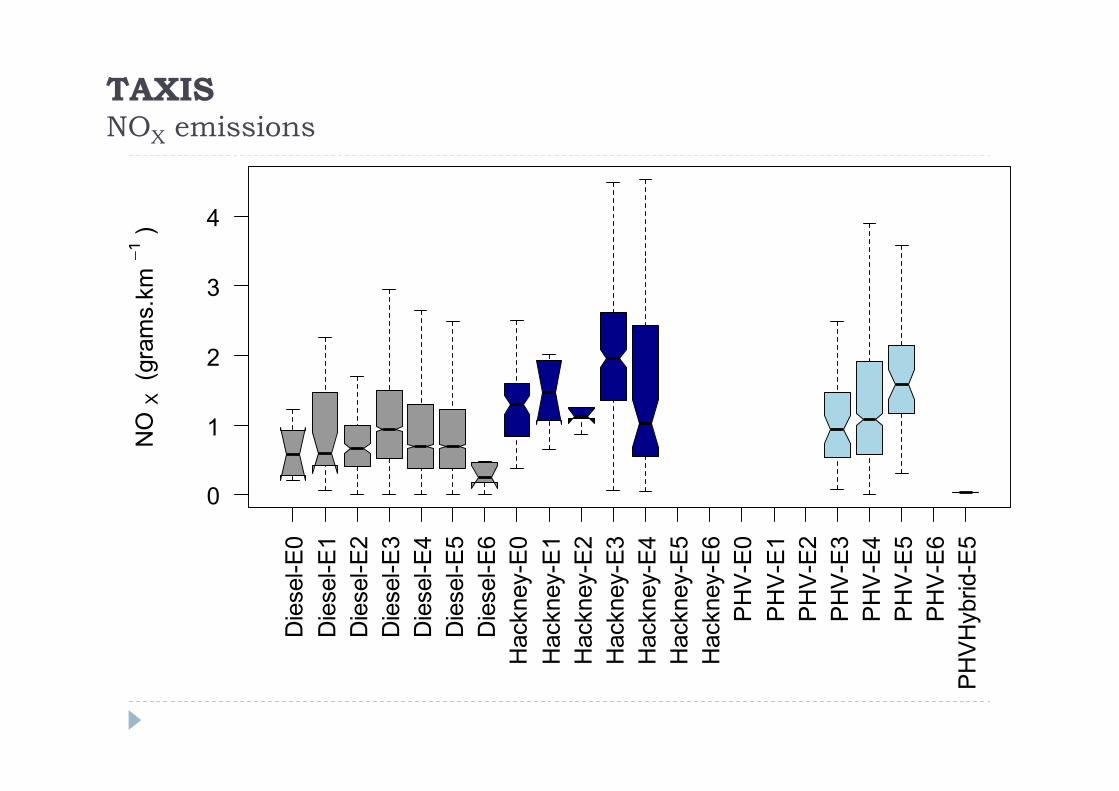
TAXISNOX emissions

Die
sel-E
0
Die
sel-E
1
Die
sel-E
2
Die
sel-E
3
Die
sel-E
4
Die
sel-E
5
Die
sel-E
6
Hackney-E
0
Hackney-E
1
Hackney-E
2
Hackney-E
3
Hackney-E
4
Hackney-E
5
Hackney-E
6
PH
V-E
0
PH
V-E
1
PH
V-E
2
PH
V-E
3
PH
V-E
4
PH
V-E
5
PH
V-E
6
PH
VH
ybrid-E
5
0
50
100
150
200
PM
10(index.k
m1
)
TAXISParticulate Matter (tail-pipe emissions)

Double
D-E
0
Double
D-E
1
Double
D-E
2
Double
D-E
3
Double
D-E
4
Double
D-E
5
Double
D-H
EV
Sin
gle
D-E
2
Sin
gle
D-E
3
Sin
gle
D-E
4
Sin
gle
D-E
5
0
5
10
15
NO
X(g
ram
s.k
m1
)
BUSESNOX emissions

cR
13
6JY
Gc
R1
37
JYG
cR
13
8JY
Gc
R1
39
JYG
cR
63
4C
VR
cR
63
6C
VR
cR
63
7C
VR
cR
63
8C
VR
cR
63
9C
VR
cR
64
0C
VR
cR
90
1B
OU
cR
91
3B
OU
cR
91
4B
OU
cR
91
9B
OU
cS
81
1R
WG
cS
81
2R
WG
cS
81
3R
WG
cS
81
4R
WG
cT
81
5M
AK
cT
82
3M
AK
cT
82
4M
AK
cT
82
5M
AK
cT
82
6M
AK
cT
82
8M
AK
cT
82
9M
AK
cT
83
0M
AK
cT
83
1M
AK
cT
83
2M
AK
cT
83
3M
AK
cT
83
5M
AK
cT
83
6M
AK
cT
83
7M
AK
cT
83
8M
AK
cT
83
9M
AK
cT
84
0M
AK
cT
84
1M
AK
cT
84
2M
AK
cT
84
3M
AK
cT
84
4M
AK
cT
85
0M
AK
cT
85
2M
AK
cT
85
7M
AK
cT
85
9M
AK
cT
86
9O
DT
cT
87
2O
DT
cT
87
9O
DT
cT
88
1O
DT
cT
88
2O
DT
cT
88
3O
DT
cT
88
4O
DT
cX
84
0H
HE
dS
F5
5U
AK
dS
F5
5U
AL
dS
F5
5U
AR
dS
F5
5U
AT
dS
F5
5U
AU
dS
F5
5U
AW
dS
F5
5U
AX
dS
F5
5U
AY
dS
F5
5U
AZ
dY
G5
2D
HC
dY
L0
2F
KV
dY
N0
5X
OA
dY
N0
5X
OB
dY
N0
6W
CG
dY
N0
6W
CJ
dY
N0
6W
CL
dY
N0
6W
CM
dY
N0
6W
CP
dY
N0
6W
CR
dY
N5
3P
AO
eY
N0
7K
PR
eY
N0
7K
PX
eY
N0
7K
PY
eY
N0
7K
RF
eY
N0
7K
RG
eY
N0
7K
RJ
eY
N0
7K
RK
eY
N0
7K
RV
eY
N0
7K
RX
eY
N0
7K
RZ
eY
N0
7K
SE
eY
N0
7K
SF
eY
N0
7K
SJ
eY
N0
7K
SV
eY
N0
8JB
Ze
YN
08
JFJ
eY
N0
8JF
Xe
YN
08
JF
Ye
YN
08
JGF
eY
N0
8JG
Ue
YN
08
JGX
eY
N0
8JG
Ye
YN
57
MY
Ce
YN
57
MY
DfL
K6
2F
UJ
fY
N6
2B
DU
fY
N6
2B
HF
fY
N6
2B
MY
fY
N6
2B
NA
fY
N6
2B
NE
fY
X1
1H
NW
fY
X1
1H
NY
fY
X1
1H
NZ
0
5
10
15
20
NO
X(
gra
ms.
km
1
)
Vehicle specific measurements (individual vehicles)The boxes are colour coded according to the vehicles’ Euro standard:• Red = Euro 2• Orange = Euro 3• Yellow = Euro 4• Blue = Euro 5
SINGLE-DECKER BUSESNOX emissions ( > 5 pass-bys)
cW
71
6C
WR
cX
35
8V
WT
dL
K0
3N
HH
dLK
03
NH
Jd
LK
03
NH
Ld
LK
03N
HM
dLT
02
ZC
Yd
LT
02
ZD
Hd
LT
02Z
DJ
dL
T5
2W
TY
dL
T5
2W
TZ
dL
T5
2W
UA
dL
T5
2W
UB
dL
T5
2W
UC
dL
T5
2W
UD
dW
U0
2K
VE
dW
U0
2K
VH
dW
U0
2K
VJ
dW
U0
2K
VK
dW
U0
2K
VL
dW
U0
2K
VM
dW
U0
2K
VO
dW
U0
2K
VP
dY
N5
4V
KA
dY
N5
4V
KC
dY
N5
4V
KE
dY
N5
4V
KF
eY
N0
8L
CJ
eY
N0
8N
LL
eY
N0
8N
LM
eY
N0
8N
LO
eY
N0
8N
LP
eY
N0
8N
LR
eY
N0
8N
LV
eY
N0
8N
LX
eY
N0
8N
LY
eY
N0
8N
MA
eY
N0
8N
ME
eY
N5
8E
SG
eY
N5
8E
SO
eY
N5
8E
SU
eY
N5
8E
SV
eY
N5
8E
SY
eY
N5
8E
TA
eY
N5
8E
TD
eY
N5
8E
TE
eY
N5
8E
TF
eY
N5
8E
TX
eY
N5
8E
TY
fY
N1
2G
YO
fY
N1
2G
YR
fY
N1
2G
YS
fY
N6
0C
JY
fY
N6
0C
JZ
fY
N6
0C
KC
fY
N6
0C
KD
fY
N6
0C
KE
fYN
60
CK
FfY
N6
0C
KG
fY
N6
0C
KJ
fY
N6
0C
KK
fYN
60
CK
LfY
N6
0C
KO
fY
N6
0C
KP
fY
N6
0C
KV
hY
N6
2B
BE
hY
N6
2B
CY
hY
N6
2B
EY
hY
N6
2B
FP
hY
N6
2B
TV
hY
N6
2B
XO
hY
N6
2B
XS
hY
N6
2B
XX
hY
N6
2B
YA
hY
N6
2B
YS
hY
N6
2B
YU
hY
N6
2B
ZG
hY
N6
2B
ZK
0
5
10
15
20
NO
X(g
ram
s.k
m1
)
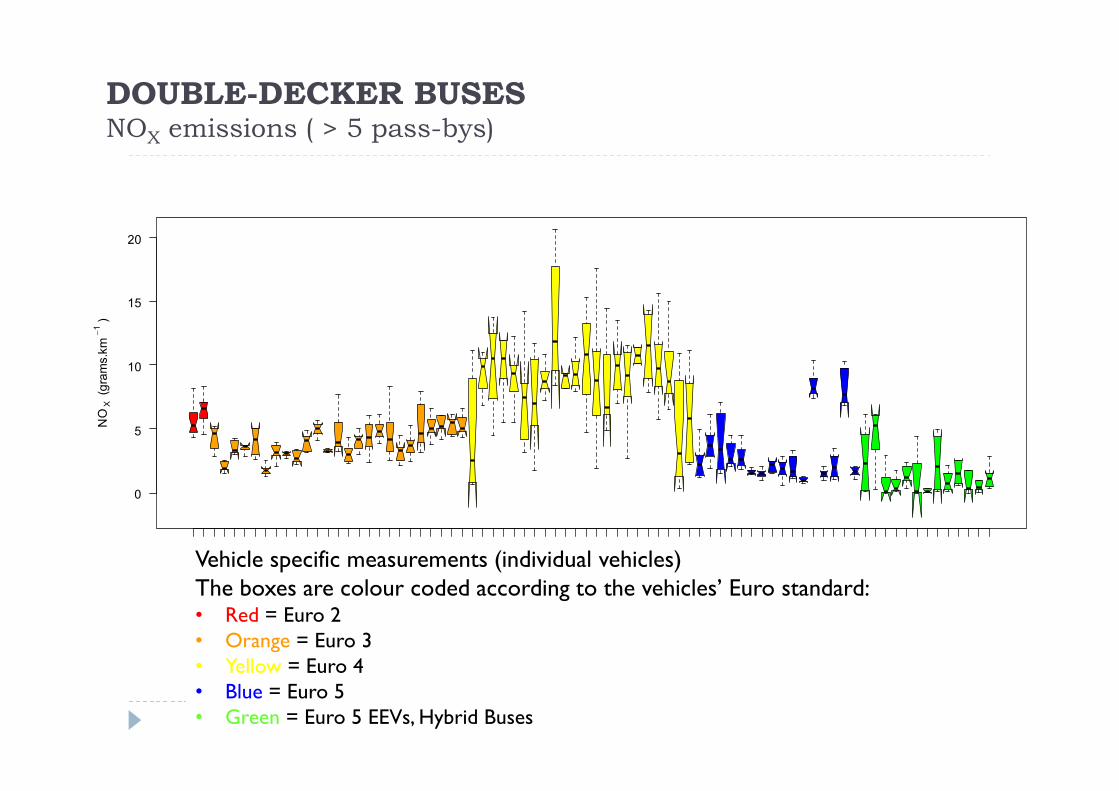
Vehicle specific measurements (individual vehicles)The boxes are colour coded according to the vehicles’ Euro standard:• Red = Euro 2• Orange = Euro 3• Yellow = Euro 4• Blue = Euro 5• Green = Euro 5 EEVs, Hybrid Buses
DOUBLE-DECKER BUSESNOX emissions ( > 5 pass-bys)
Double
D-E
0
Double
D-E
1
Double
D-E
2
Double
D-E
3
Double
D-E
4
Double
D-E
5
Double
D-H
EV
Sin
gle
D-E
2
Sin
gle
D-E
3
Sin
gle
D-E
4
Sin
gle
D-E
5
0
200
400
600
800
PM
10(index.
km1
)
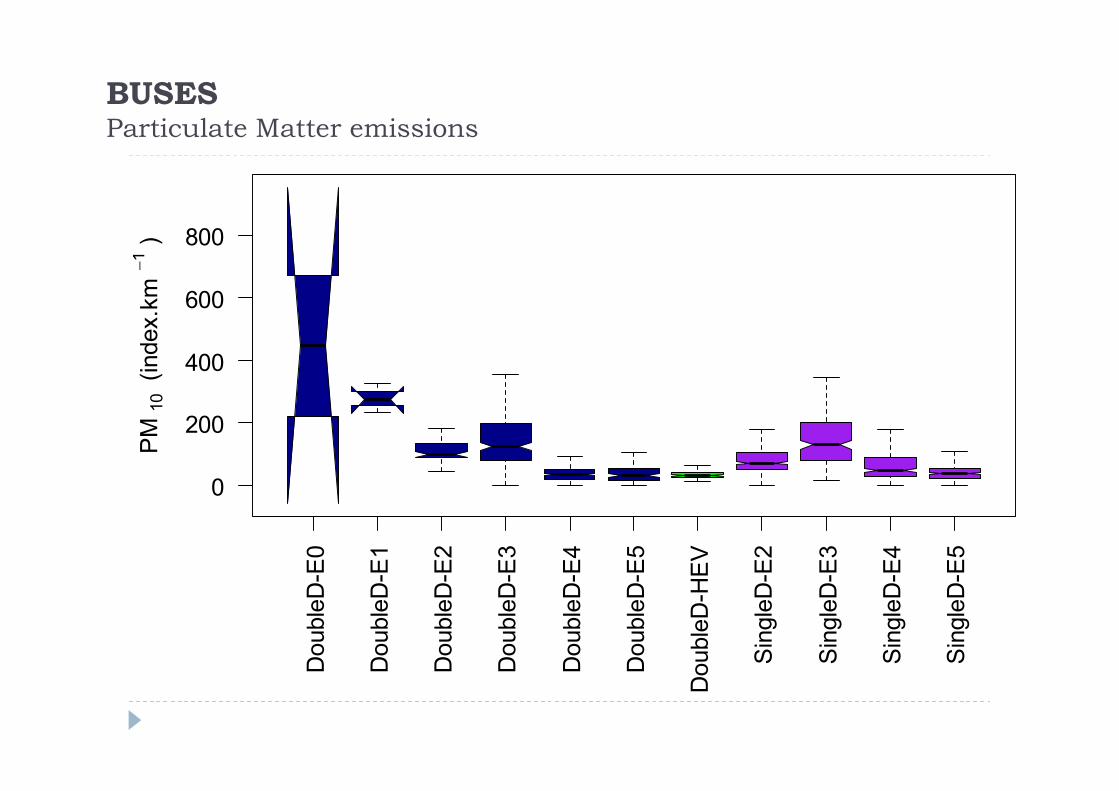
BUSESParticulate Matter emissions

NEW passenger car resultsLeeds Autumn/ Winter 2014
Die
sel_
E0
Die
sel_
E1
Die
sel_
E2
Die
sel_
E3
Die
sel_
E4
Die
sel_
E5
Die
sel_
E6
Petr
ol_
E0
Petr
ol_
E1
Petr
ol_
E2
Petr
ol_
E3
Petr
ol_
E4
Petr
ol_
E5
Petr
ol_
E6
Petr
olH
ybrid_E
3
Petr
olH
ybrid_E
4
Petr
olH
ybrid_E
5
0.0
0.5
1.0
1.5
2.0
2.5
3.0
NO
X(g
ram
s.k
m1
)
[2]
[2]
[24]
[299]
[970]
[1108]
[39]
[14]
[26]
[156]
[868]
[1131]
[694]
[32]
[2]
[0]
[24]
34

NEW passenger car resultsZurich Remote Sensing Site
35
Zurich, July 201482m elevation gain1.2 kmAv. gradient 6.8 %

ResultsZurich, Summer 2014
36
Die
sel_
E0
Die
sel_
E1
Die
sel_
E2
Die
sel_
E3
Die
sel_
E4
Die
sel_
E5a
Die
sel_
E5b
Die
sel_
E6a
Die
sel_
E6b
Die
selH
ybrid_E
5
Petr
ol_
E0
Petr
ol_
E1
Petr
ol_
E2
Petr
ol_
E3
Petr
ol_
E4
Petr
ol_
E5a
Petr
ol_
E5b
Petr
ol_
E6b
Petr
olH
ybrid_E
4
Petr
olH
ybrid_E
5a
Petr
olH
ybrid_E
5b
Petr
olH
ybrid_E
6b
0
1000
2000
3000
4000
NO
X/
CO
2ra
tio
[13]
[33]
[164]
[1220]
[4250]
[3315]
[3165]
[27]
[228]
[19]
[113]
[629]
[1805]
[2584]
[9141]
[3730]
[4360]
[520]
[233]
[85]
[307]
[3]

The Air Quality ChallengeEurope
High background concentrations for key pollutants
Nitrogen dioxide (NO2) and Particulate Mass (PM10)
Complicated by atmospheric chemistry
Nitrogen dioxide (NO2) and secondary particle formation
Photochemical smog
Strongly influenced by meteorology
Worst episodes during winter | stable weather conditions
Out-dated vehicle emission legislation and standards
Drive-cycle
Operating conditions
temperature, pressure, rolling resistance, GRADIENT…
Newer diesel vehicles not necessarily cleaner Until recently, EuroVI
Implications for Low Emission Zones
▶ Air quality is acknowledged to be holding back major road building schemes
37
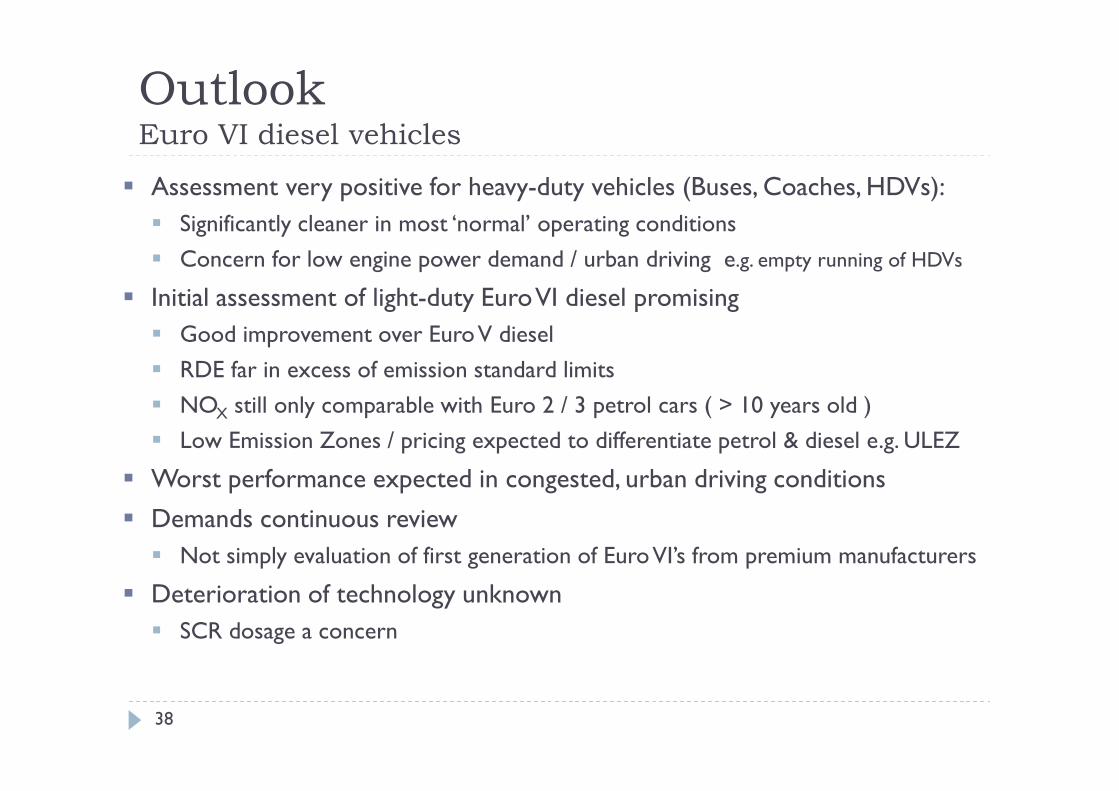
OutlookEuro VI diesel vehicles
Assessment very positive for heavy-duty vehicles (Buses, Coaches, HDVs):
Significantly cleaner in most ‘normal’ operating conditions
Concern for low engine power demand / urban driving e.g. empty running of HDVs
Initial assessment of light-duty EuroVI diesel promising
Good improvement over EuroV diesel
RDE far in excess of emission standard limits
NOX still only comparable with Euro 2 / 3 petrol cars ( > 10 years old )
Low Emission Zones / pricing expected to differentiate petrol & diesel e.g. ULEZ
Worst performance expected in congested, urban driving conditions
Demands continuous review
Not simply evaluation of first generation of EuroVI’s from premium manufacturers
Deterioration of technology unknown
SCR dosage a concern
38

FUTURE WORKMathematical modelling to aid Policy design & ForecastsMicroscopic traffic simulations + instantaneous vehicle emission models
39 Western Bank AIMSUN traffic microsimulation model developed by SYSTRA

FUTURE WORKEvaluating Smart Motorway Operations
40 Highways Agency 2014. Smart motorways – Purpose. Fact sheet 01.https://www.gov.uk/government/uploads/system/uploads/attachment_data/file/363993/Smart_motorways_-_Fact_Sheets.pdf

Future workAssessing emissions across networks to aid Policy design
41 Collaboration with SYSTRA – Sheffield Low Emission Zone feasibility study (2013)