the ceo coalition sustainable technologies, practices, & public policies recycled energy cost...
TRANSCRIPT

The CEO CoalitionSustainable Technologies, Practices, & Public Policies
Recycled Energy Cost Effective Sustainable
Energy
Thomas R. CastenChairman & CEOPrimary Energy
Conventional Energy ThinkingConventional Energy Thinking
Economics says Economics says multiple actorsmultiple actors in a in a free marketfree market drive industry towards economic optimization, drive industry towards economic optimization, given available technology.given available technology.
Energy beliefs assume electric industry is near Energy beliefs assume electric industry is near optimum with today’s technology, even though optimum with today’s technology, even though power industry is not a power industry is not a free market.free market.
Since excess fossil use is harming planet,Since excess fossil use is harming planet,
A sustainable energy future requires A sustainable energy future requires development and deployment of new technology.development and deployment of new technology.

Summary of Presentation Summary of Presentation Question optimization of power industry Question optimization of power industry
Power industry has made sub-optimal choices Power industry has made sub-optimal choices over the past 30 years, hurting industryover the past 30 years, hurting industry
Describe analysis of optimal way to meet US Describe analysis of optimal way to meet US electric load growthelectric load growth Local generation, using proven technologies, Local generation, using proven technologies,
improves every key outcome by avoiding T&D improves every key outcome by avoiding T&D costs and losses, and enabling energy recycling costs and losses, and enabling energy recycling
Explain and compare recycled energy to Explain and compare recycled energy to other clean energyother clean energy
Suggest political thrust for CEO CoalitionSuggest political thrust for CEO Coalition
DefinitionsDefinitions
DISTRIBUTED GENERATION or DGDISTRIBUTED GENERATION or DG: Any electric : Any electric generation near users, including all fuels, generation near users, including all fuels, technologies, and sizes up to 1,000 MW technologies, and sizes up to 1,000 MW
T&DT&D: High, medium and low voltage wires, : High, medium and low voltage wires, transformers, capacitors, inductors and transformers, capacitors, inductors and substations used to transmit power substations used to transmit power
WADE:WADE: World Alliance for Decentralized Energy, a World Alliance for Decentralized Energy, a not-for-profit organization seeking to change the not-for-profit organization seeking to change the way the world makes power to minimize fossil way the world makes power to minimize fossil fuel use, emissions and power costs fuel use, emissions and power costs
World Energy SituationWorld Energy Situation
Growing energy demand is driving up Growing energy demand is driving up fossil fuel prices fossil fuel prices
132 nations increased energy use faster than 132 nations increased energy use faster than USA last decade, including China and IndiaUSA last decade, including China and India
““Hubbert’s Peak” analysis says world oil Hubbert’s Peak” analysis says world oil production will peak in the 2003 to 2005, then production will peak in the 2003 to 2005, then declinedecline
Oil purchases are a massive wealth transfer, Oil purchases are a massive wealth transfer, propping up dictators, religious zealots, and propping up dictators, religious zealots, and those supporting global terrorismthose supporting global terrorism
Fossil Use is Changing ClimateFossil Use is Changing Climate
Increasing atmospheric COIncreasing atmospheric CO22 is warming the is warming the globe, causing:globe, causing: Increased frequency and severity of stormsIncreased frequency and severity of storms Glacier and ice pack melting, thermal Glacier and ice pack melting, thermal
expansion of ocean raising sea levels that expansion of ocean raising sea levels that threaten low countries and many shore cities. threaten low countries and many shore cities.
More rapid species extinction & disease spreadMore rapid species extinction & disease spread
Failure to recycle energy, and over reliance Failure to recycle energy, and over reliance on central generation adds needless costs on central generation adds needless costs and COand CO22 emissions, worldwide. emissions, worldwide.
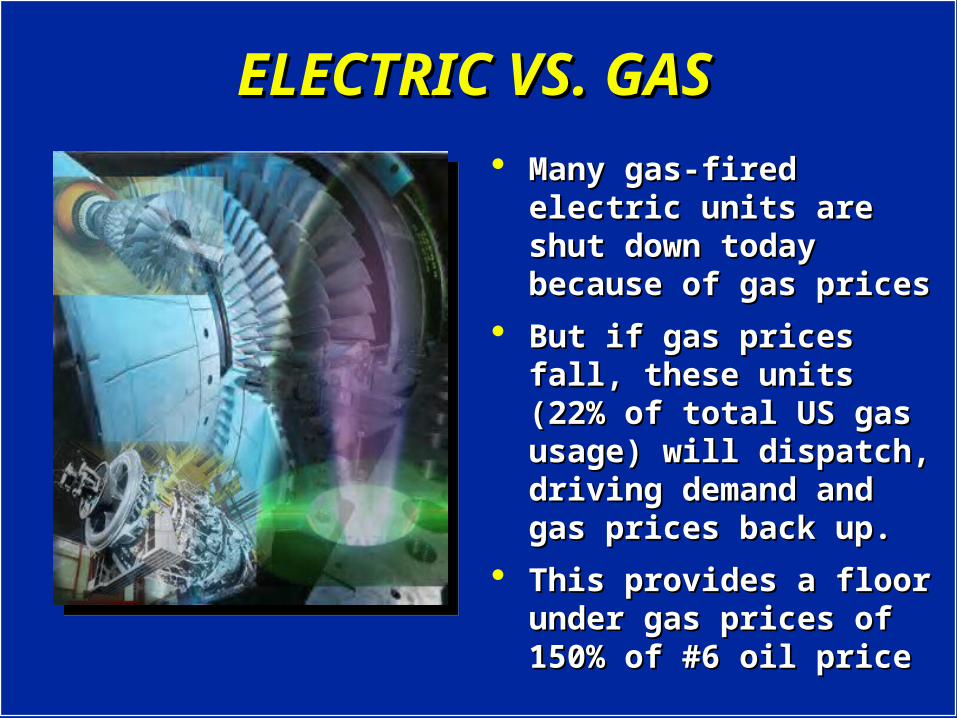
ELECTRIC VS. GASELECTRIC VS. GAS Many gas-fired electric Many gas-fired electric
units are shut down today units are shut down today because of gas pricesbecause of gas prices
But if gas prices fall, these But if gas prices fall, these units (22% of total US gas units (22% of total US gas usage) will dispatch, usage) will dispatch, driving demand and gas driving demand and gas prices back up.prices back up.
This provides a floor under This provides a floor under gas prices of 150% of #6 oil gas prices of 150% of #6 oil priceprice

US Power Industry HistoryUS Power Industry History
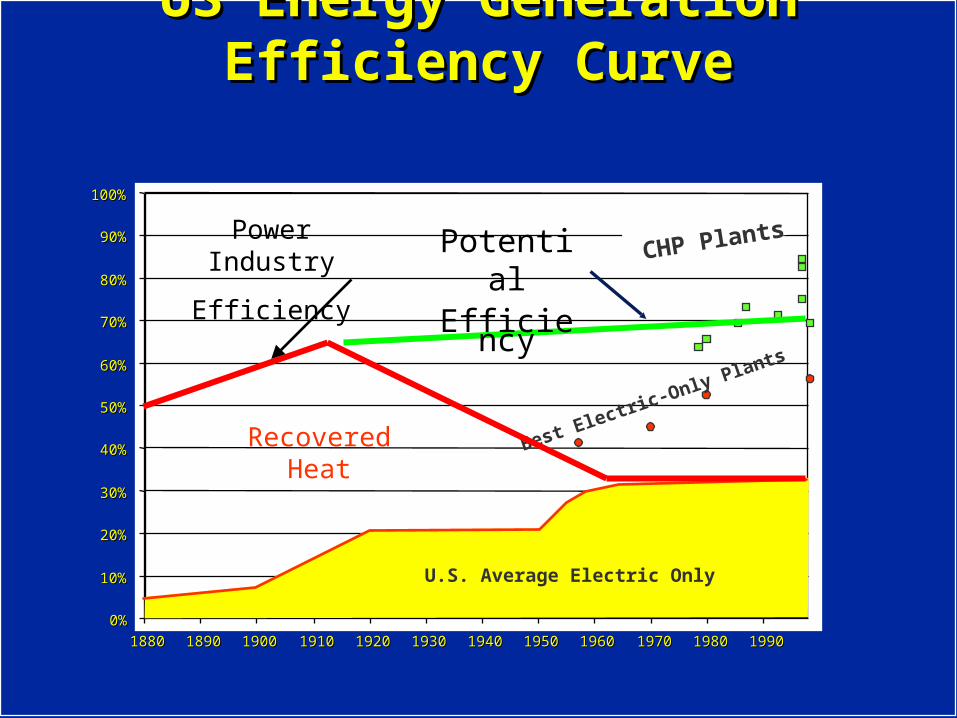
US Energy Generation Efficiency CurveUS Energy Generation Efficiency Curve
0%0%
10%10%
20%20%
30%30%
40%40%
50%50%
60%60%
70%70%
80%80%
90%90%
100%100%
18801880 18901890 19001900 19101910 19201920 19301930 19401940 19501950 19601960 19701970 19801980 19901990
CHP Plants
Best Electric-Only Plants
U.S. Average Electric Only
Power Industry
Efficiency
Recovered Heat
PotentialEfficienc
y

Conventional Central GenerationConventional Central Generation
Fuel
100%
33% delivered electricityPower Plant
T&D and Transformers
Pollution
67% Total Waste
Line Losses 9%
Generation:$890 / kW
Transmission:$1,380 / kW
End user: .91 kW:$2,494 / kW

Combined Heat and Power Combined Heat and Power (CHP)(CHP)
Fuel
100%Steam
Electricity
Chilled Water
90%
10% Waste Heat, no T&D loss
Pollution
(At or near thermal users)
CHP Plants
Generation:$1,200/kW DG vs. CG: ($310)
Transmission $138/kW (10% Cap)$1,242
End users: .98 kW$1,365/kW $932

Central Generation Problems AheadCentral Generation Problems Ahead
US T&D is inadequate, power quality is poor and US T&D is inadequate, power quality is poor and declining, and massive T&D expenditures will declining, and massive T&D expenditures will increase power prices but not fix power qualityincrease power prices but not fix power quality
SOSO22 and mercury cleanup will increase coal and mercury cleanup will increase coal
power costs, forcing some coal plant closures, power costs, forcing some coal plant closures, but:but:
Gas is on the margin, at even higher energy costsGas is on the margin, at even higher energy costs
Industry will pay a major share of rising power Industry will pay a major share of rising power costs, unless it embraces DGcosts, unless it embraces DG

Advances Enable Distributed use of Advances Enable Distributed use of Central Generation TechnologyCentral Generation Technology
Coal combustion has improved, now very cleanCoal combustion has improved, now very clean Fluid bed technologies available only in industrial Fluid bed technologies available only in industrial
sizes, perfect for DGsizes, perfect for DG
Combustion turbines are the most efficient Combustion turbines are the most efficient natural gas technology today, come in all sizesnatural gas technology today, come in all sizes
Aircraft derivative, mass-produced turbines are the Aircraft derivative, mass-produced turbines are the most efficient, reversing economies of scale most efficient, reversing economies of scale
Emissions reduced by up to 99% vs. 1980 technologyEmissions reduced by up to 99% vs. 1980 technology
There is no economic reason to burn gas in There is no economic reason to burn gas in central electric plantscentral electric plants

Has US Power Industry Made Has US Power Industry Made Optimal Decisions? Optimal Decisions?
We analyzed major power generation We analyzed major power generation technologies over 1973-2002 periodtechnologies over 1973-2002 period Assumed that new central generation needs Assumed that new central generation needs
100% new T&D, new DG needs 10% new 100% new T&D, new DG needs 10% new T&D wires.T&D wires.
We assumed cost of capital for CG was We assumed cost of capital for CG was 8%, but that DG would require 12%8%, but that DG would require 12%
We then calculated future retail price per We then calculated future retail price per kWh needed for each technology in each kWh needed for each technology in each year, given then current data.year, given then current data.

Long Run US Marginal Costs/ MWhLong Run US Marginal Costs/ MWh
020
4060
80100
120140
160180
1973 1976 1979 1982 1985 1988 1991 1994 1997 2000
2004
$/M
Wh
Average Retail Oil / Gas Rankine Central SCGT
Central CCGT Central Coal Cogen SCGT
Cogen CCGT Cogen Coal Recycled Energy (pressure drop)
Recycled Energy (thermal recovery)
Central Generation
Distributed Generation
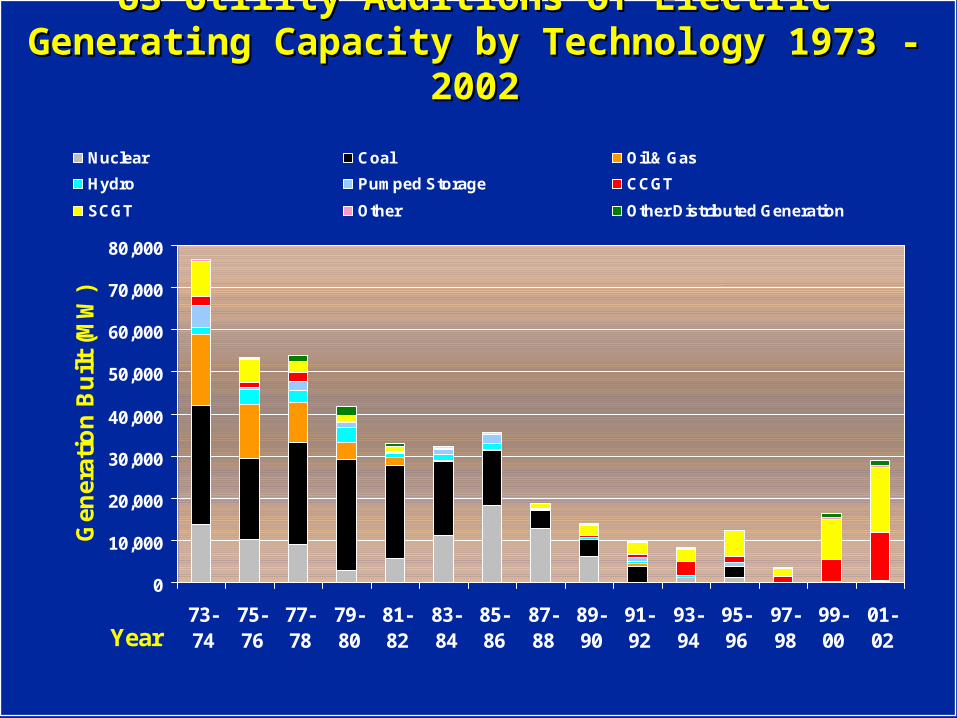
US Utility Additions of Electric Generating US Utility Additions of Electric Generating Capacity by Technology 1973 - 2002Capacity by Technology 1973 - 2002
0
10,000
20,000
30,000
40,000
50,000
60,000
70,000
80,000
73-74
75-76
77-78
79-80
81-82
83-84
85-86
87-88
89-90
91-92
93-94
95-96
97-98
99-00
01-02Year
Gen
erat
ion
Bu
ilt
(MW
)
Nuclear Coal Oil & Gas
Hydro Pumped Storage CCGT
SCGT Other Other Distributed Generation
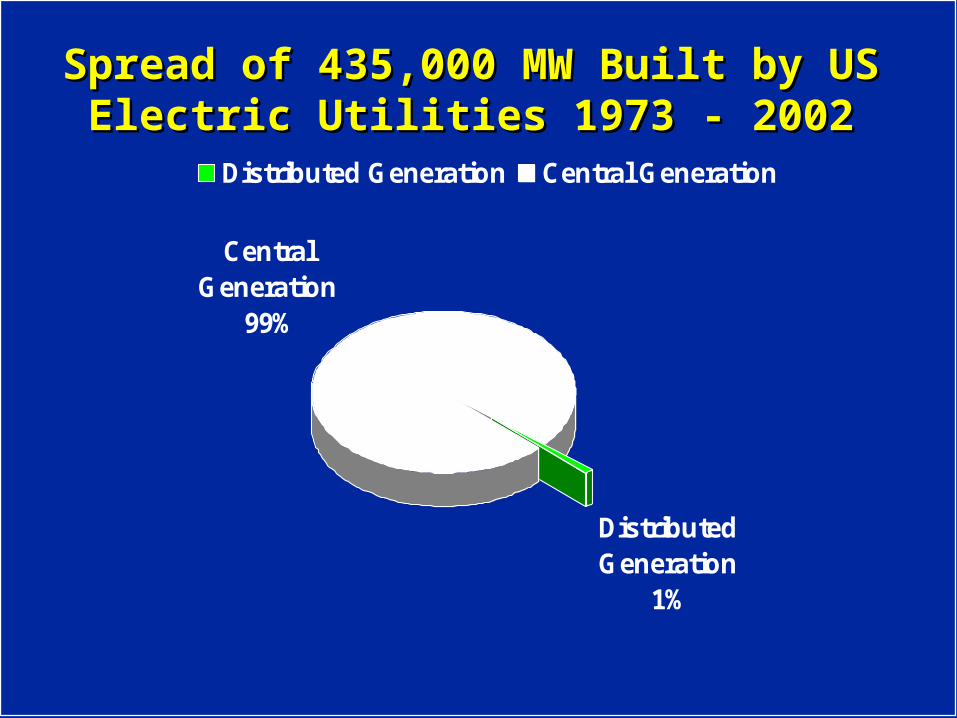
Spread of 435,000 MW Built by US Electric Spread of 435,000 MW Built by US Electric Utilities 1973 - 2002Utilities 1973 - 2002
Distributed Generation
1%
Central Generation
99%
Distributed Generation Central Generation
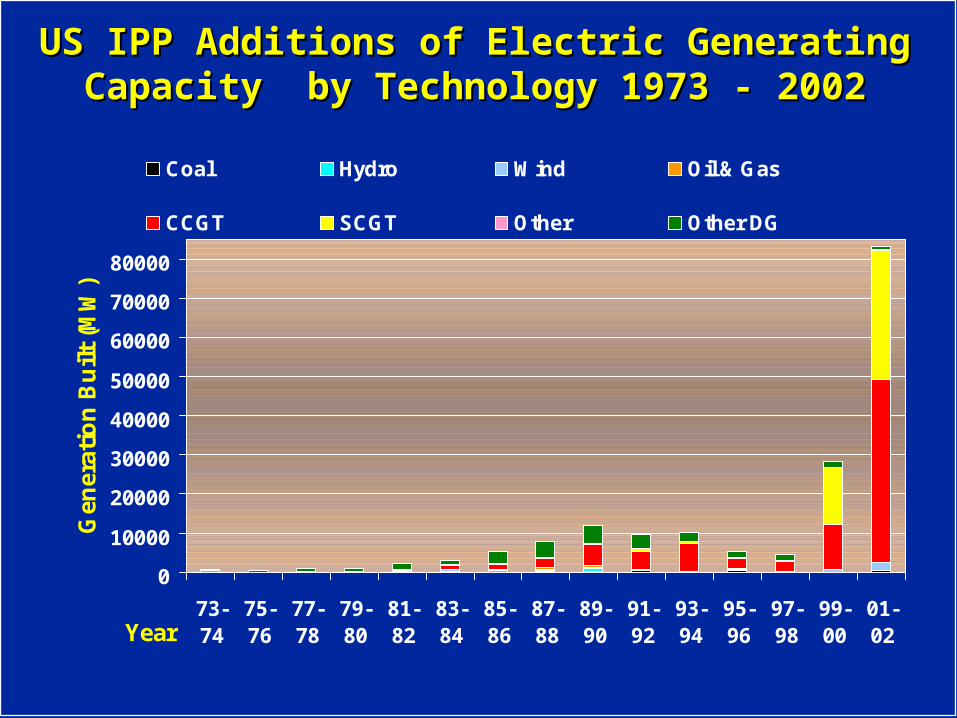
US IPP Additions of Electric Generating Capacity US IPP Additions of Electric Generating Capacity by Technology 1973 - 2002by Technology 1973 - 2002
0
10000
20000
30000
40000
50000
60000
70000
80000
73-74
75-76
77-78
79-80
81-82
83-84
85-86
87-88
89-90
91-92
93-94
95-96
97-98
99-00
01-02Year
Gen
erat
ion
Bu
ilt
(MW
)
Coal Hydro Wind Oil & Gas
CCGT SCGT Other Other DG
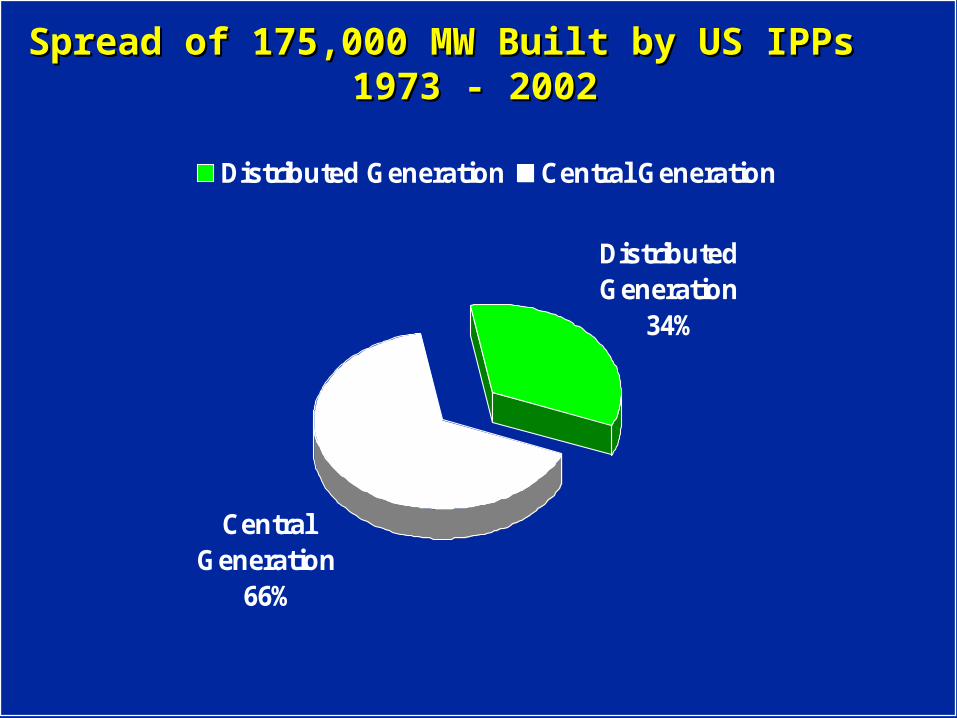
Spread of 175,000 MW Built by US IPPs Spread of 175,000 MW Built by US IPPs 1973 - 20021973 - 2002
Distributed Generation
34%
Central Generation
66%
Distributed Generation Central Generation
DG, Using Conventional DG, Using Conventional Technology, Saves 40% versus Technology, Saves 40% versus
Central GenerationCentral Generation
World Alliance for Decentralized World Alliance for Decentralized Energy (WADE) built a model to find Energy (WADE) built a model to find optimal way to meet US load growthoptimal way to meet US load growth
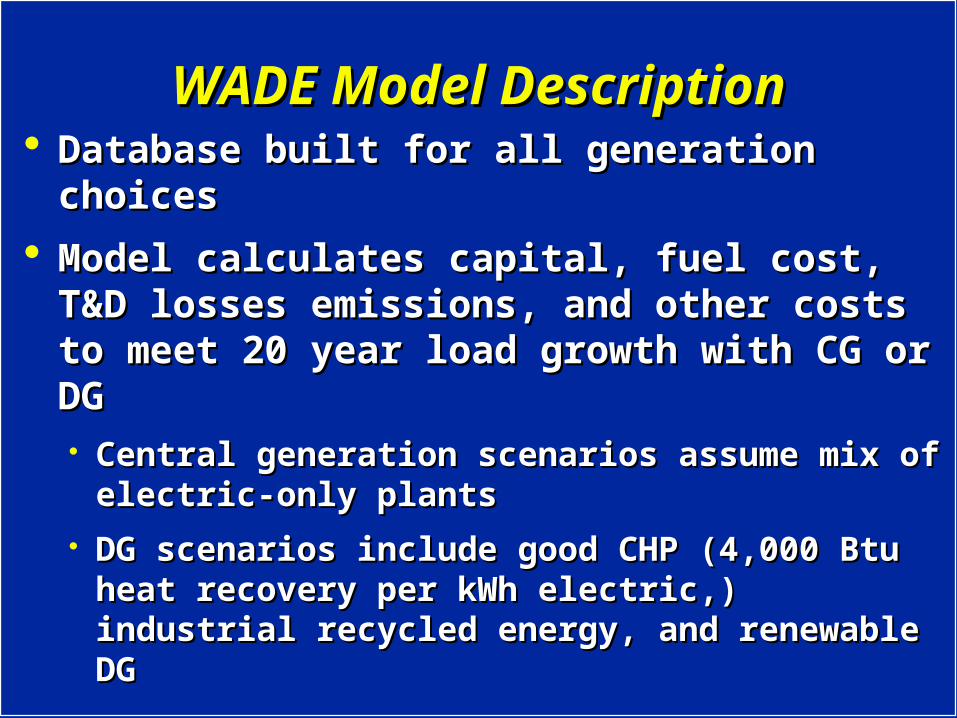
WADE Model DescriptionWADE Model Description Database built for all generation choicesDatabase built for all generation choices
Model calculates capital, fuel cost, T&D Model calculates capital, fuel cost, T&D losses emissions, and other costs to meet losses emissions, and other costs to meet 20 year load growth with CG or DG20 year load growth with CG or DG Central generation scenarios assume mix of Central generation scenarios assume mix of
electric-only plants electric-only plants DG scenarios include good CHP (4,000 Btu DG scenarios include good CHP (4,000 Btu
heat recovery per kWh electric,) industrial heat recovery per kWh electric,) industrial recycled energy, and renewable DGrecycled energy, and renewable DG
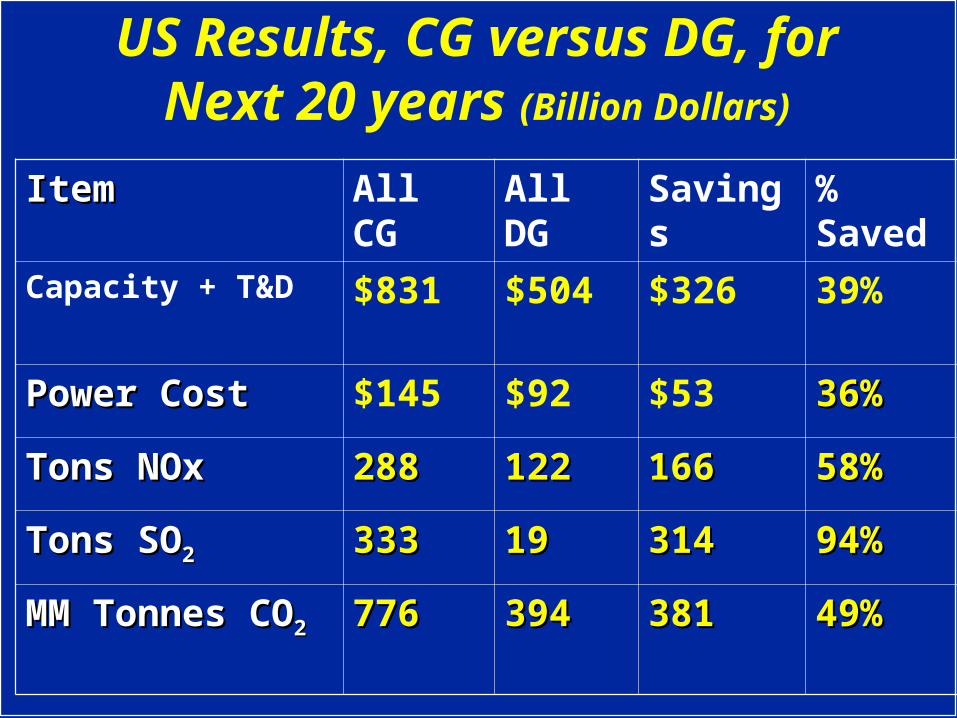
US Results, CG versus DG, for Next 20 years (Billion Dollars)
ItemItem All CG All DG Savings % Saved
Capacity + T&D $831 $504 $326 39%
Power CostPower Cost $145 $92 $53 36%36%
Tons NOxTons NOx 288288 122122 166166 58%58%
Tons SOTons SO22 333333 1919 314314 94%94%
MM Tonnes COMM Tonnes CO22 776776 394394 381381 49%49%
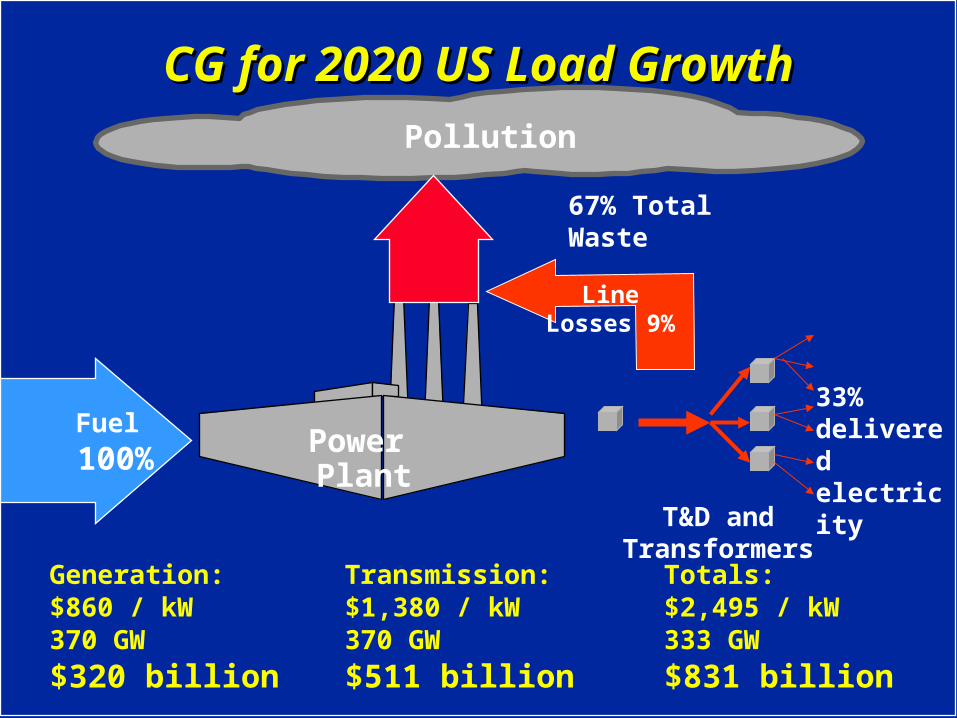
CG for 2020 US Load GrowthCG for 2020 US Load Growth
Fuel
100%
33% delivered electricityPower Plant
T&D and Transformers
Pollution
67% Total Waste
Line Losses 9%
Generation:$860 / kW370 GW
$320 billion
Transmission:$1,380 / kW370 GW
$511 billion
Totals:$2,495 / kW333 GW
$831 billion

DG for US 2020 Load GrowthDG for US 2020 Load Growth
Fuel
100% Steam
Electricity
Chilled Water
90%
10% Waste Heat, no T&D loss
Pollution
(At or near thermal users)
CHP Plants
Generation:$1,200/kW 377 GWCost: $452 billion
DG vs. CG: ($132 billion)
Transmission: $1380/kW37.7 GW (10% Cap.)
$52 billion
$459 billion
Totals:$1,338/kW 377 GW$504 billion
$327 billion

Central Generation Paradigm Central Generation Paradigm Blinds Society to Cheapest, Blinds Society to Cheapest,
Cleanest Option:Cleanest Option:
Recycling Industrial EnergyRecycling Industrial Energy

What Energy Can Be Recycled?What Energy Can Be Recycled? Fuel and electricity is typically used once, with all Fuel and electricity is typically used once, with all
waste discardedwaste discarded
Power plants burn fuel and then discard 2/3’s as Power plants burn fuel and then discard 2/3’s as heatheat
Local combined heat and power generation (CHP) Local combined heat and power generation (CHP) recycles normally wasted heat (recycles normally wasted heat (Topping cycleTopping cycle))
Industry transforms raw materials to finished Industry transforms raw materials to finished goods and then vents heat, pressure, & waste goods and then vents heat, pressure, & waste fuelsfuels
Recycle industrial waste energy to heat & power Recycle industrial waste energy to heat & power without extra fuel or pollution. (without extra fuel or pollution. (Bottoming cycleBottoming cycle) )

Recycled Energy Recycled Energy ((At user sites)
Waste Energy
100%
10% Waste Heat
Steam Generator
65%
Steam
25% Electricity
BP Turbine Generator
No Added Pollution
Capital costs similar to other CHP or DG plants
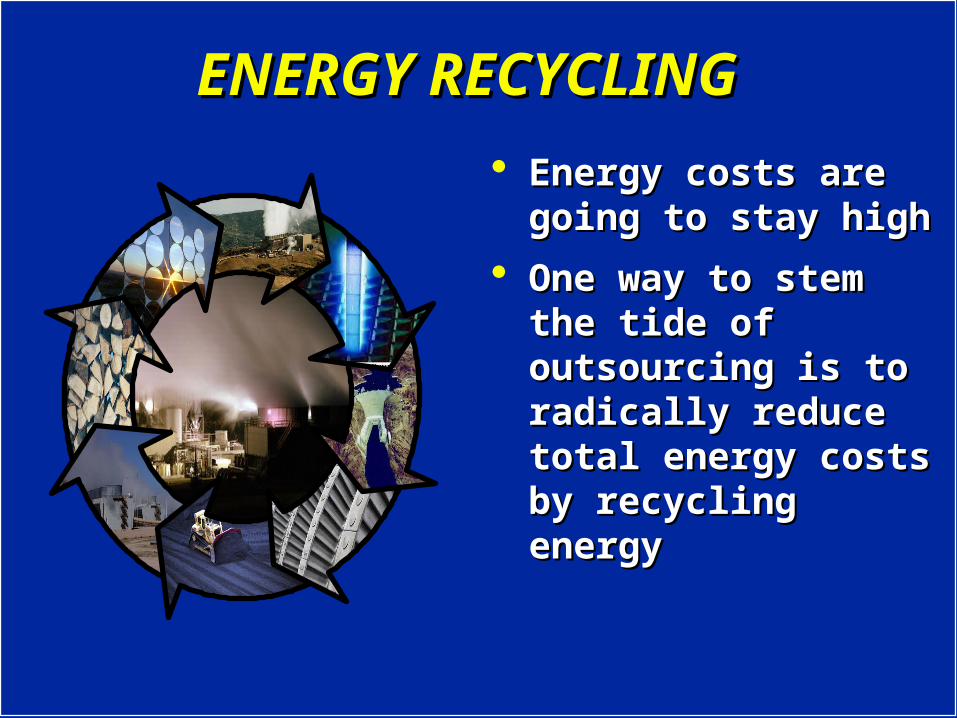
ENERGY RECYCLING ENERGY RECYCLING
Energy costs are going Energy costs are going to stay highto stay high
One way to stem the One way to stem the tide of outsourcing is tide of outsourcing is to radically reduce total to radically reduce total energy costs by energy costs by recycling energyrecycling energy
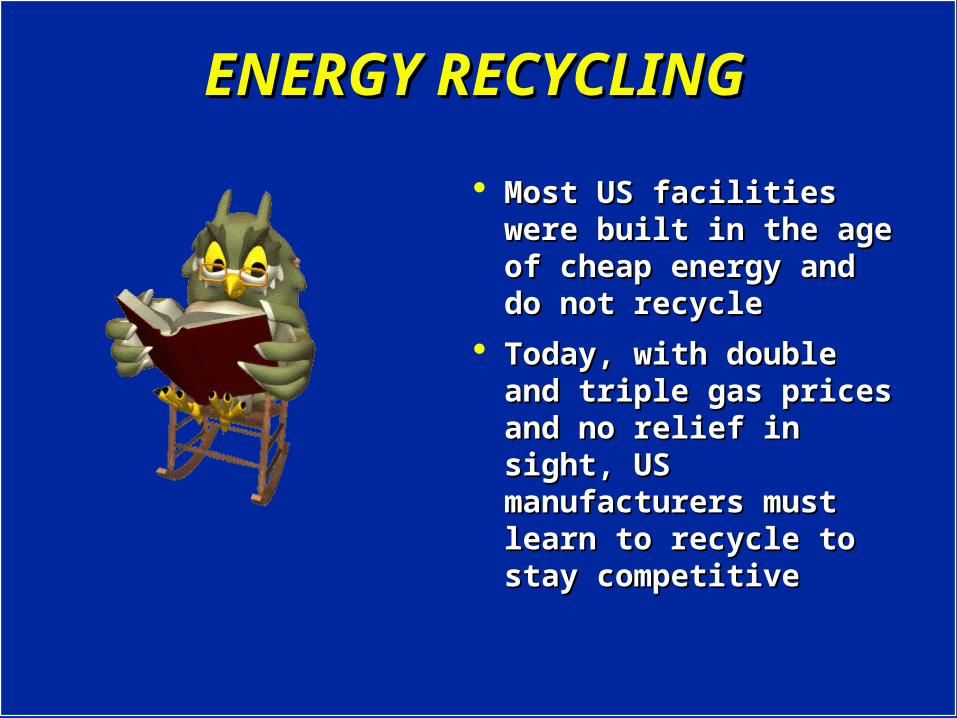
ENERGY RECYCLINGENERGY RECYCLING
Most US facilities were Most US facilities were built in the age of built in the age of cheap energy and do cheap energy and do not recyclenot recycle
Today, with double and Today, with double and triple gas prices and no triple gas prices and no relief in sight, US relief in sight, US manufacturers must manufacturers must learn to recycle to stay learn to recycle to stay competitivecompetitive

ENTROPYENTROPY
Many typical industrial Many typical industrial processes use “once processes use “once through” heatthrough” heat
Fuel used Fuel used indiscriminately for low indiscriminately for low and high temperature and high temperature requirementsrequirements
PROCESS
HEAT INPUT
WASTE HEAT

ENTROPYENTROPY
Imagine the energy Imagine the energy that could be saved that could be saved if this heat was if this heat was recycledrecycled
Recycle higher Recycle higher temperature temperature exhausts to provide exhausts to provide or preheat lower or preheat lower temperature temperature processesprocesses
PROCESS
HEAT INPUT
WASTE HEAT
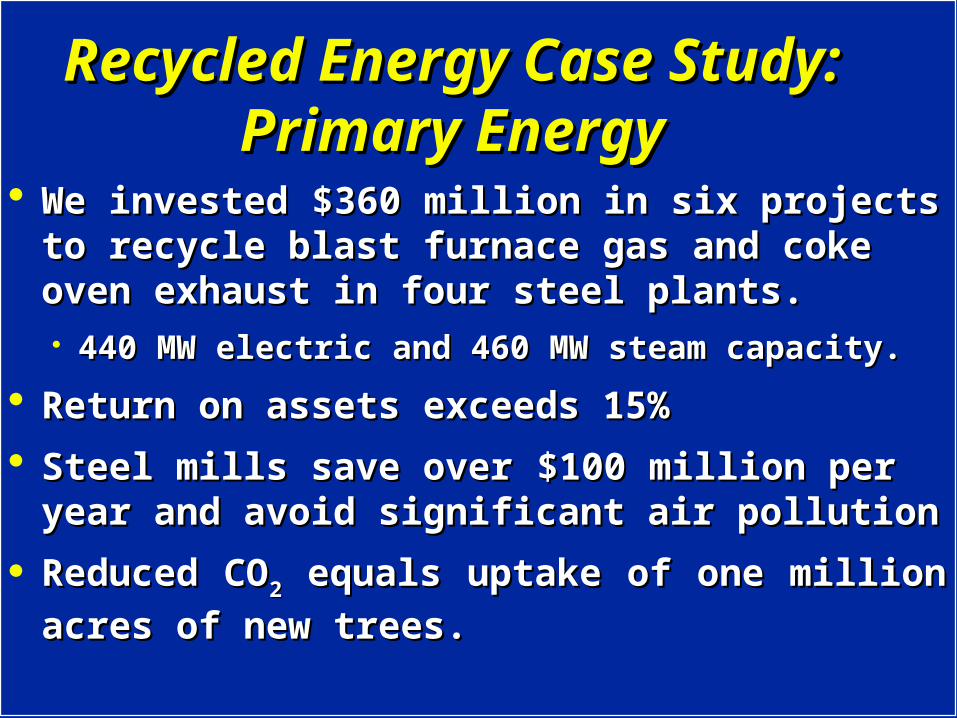
Recycled Energy Case Study: Recycled Energy Case Study: Primary EnergyPrimary Energy
We invested We invested $360$360 million in six projects to million in six projects to recycle blast furnace gas and coke oven recycle blast furnace gas and coke oven exhaust in four steel plants.exhaust in four steel plants. 440 MW electric and 460 MW steam capacity. 440 MW electric and 460 MW steam capacity.
Return on assets exceeds 15% Return on assets exceeds 15%
Steel mills save over Steel mills save over $100$100 million per year million per year and avoid significant air pollution and avoid significant air pollution
Reduced COReduced CO22 equals uptake of one million equals uptake of one million
acres of new trees.acres of new trees.

90 MW Recycled from Coke Production90 MW Recycled from Coke ProductionChicago in BackgroundChicago in Background
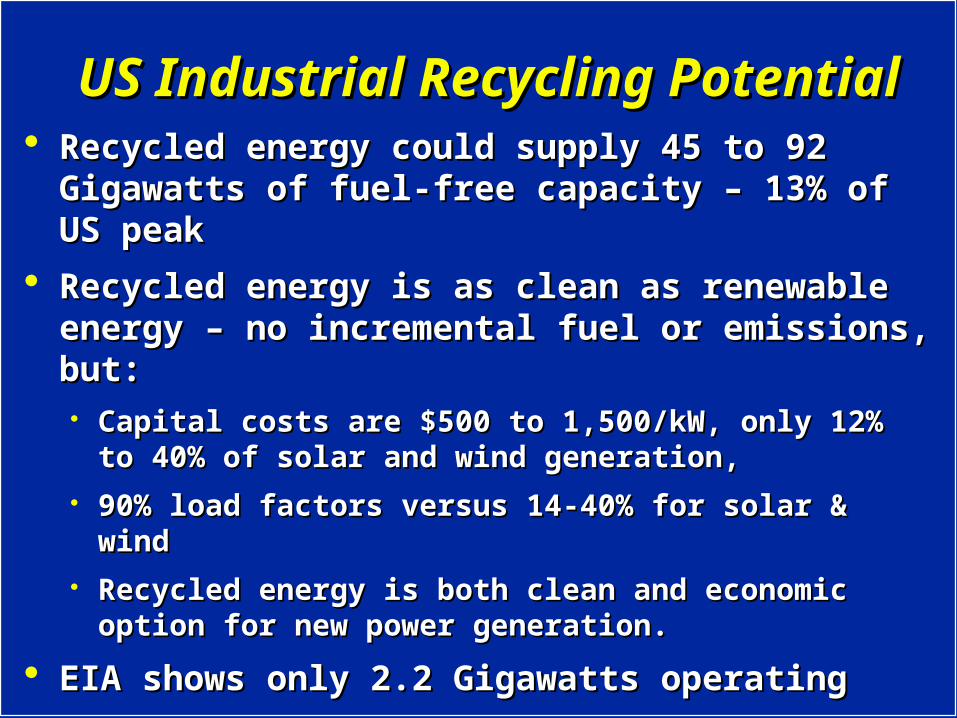
US Industrial Recycling PotentialUS Industrial Recycling Potential Recycled energy could supply 45 to 92 Recycled energy could supply 45 to 92
Gigawatts of fuel-free capacity – 13% of US peakGigawatts of fuel-free capacity – 13% of US peak
Recycled energy is as clean as renewable Recycled energy is as clean as renewable energy – no incremental fuel or emissions, but:energy – no incremental fuel or emissions, but:
Capital costs are $500 to 1,500/kW, only 12% to 40% of Capital costs are $500 to 1,500/kW, only 12% to 40% of solar and wind generation, solar and wind generation,
90% load factors versus 14-40% for solar & wind90% load factors versus 14-40% for solar & wind Recycled energy is both clean and economic option Recycled energy is both clean and economic option
for new power generation.for new power generation.
EIA shows only 2.2 Gigawatts operatingEIA shows only 2.2 Gigawatts operating
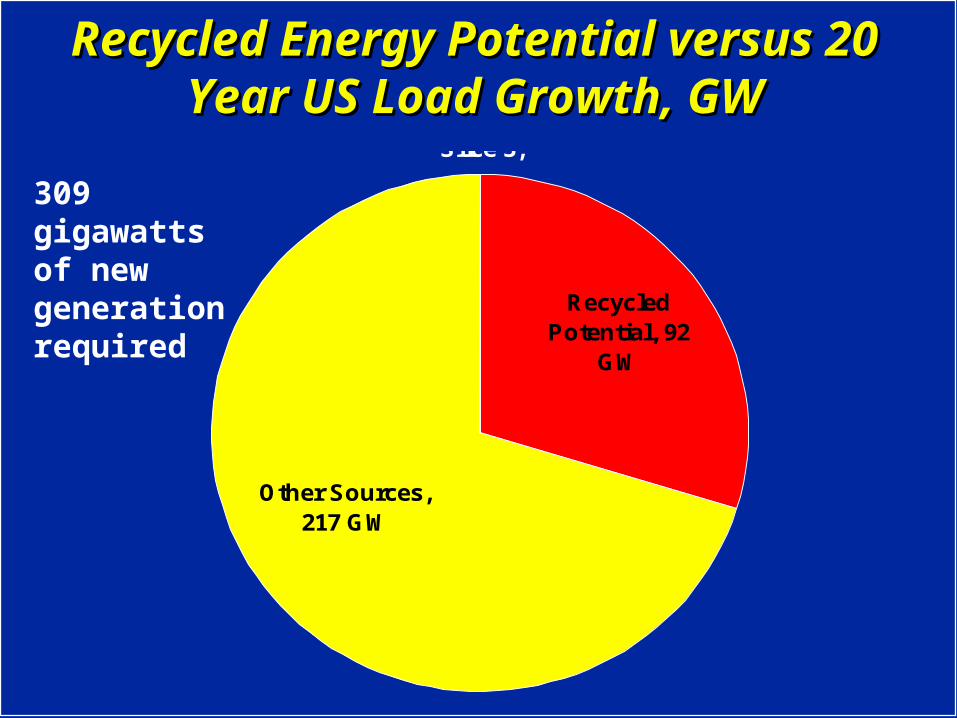
Recycled Energy Potential versus 20 Recycled Energy Potential versus 20 Year US Load Growth, GWYear US Load Growth, GWGigawatts,
Slice 3,
Recycled Potential, 92
GW
Other Sources, 217 GW
309 gigawatts of new generation required
Clean Energy ComparisonsClean Energy Comparisons
Solar, Wind, and Recycled EnergySolar, Wind, and Recycled Energy
All are equally clean. All are equally clean.
Compare the economics.Compare the economics.
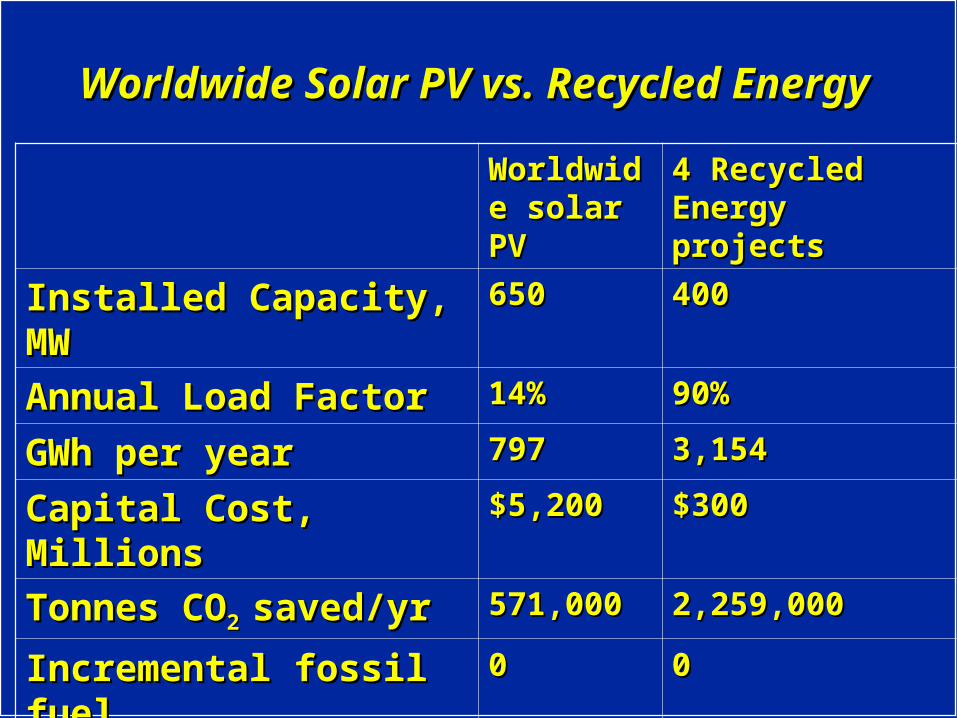
Worldwide Solar PV vs. Recycled EnergyWorldwide Solar PV vs. Recycled Energy
Worldwide Worldwide solar PVsolar PV
4 Recycled 4 Recycled Energy projectsEnergy projects
Installed Capacity, MWInstalled Capacity, MW 650650 400400
Annual Load FactorAnnual Load Factor 14%14% 90%90%
GWh per yearGWh per year 797797 3,1543,154
Capital Cost, MillionsCapital Cost, Millions $5,200$5,200 $300$300
Tonnes COTonnes CO2 2 saved/yrsaved/yr 571,000571,000 2,259,0002,259,000
Incremental fossil fuelIncremental fossil fuel 00 00
Capital/tonne COCapital/tonne CO22 saved saved $456$456 $7$7
Capital Amort. / kWhCapital Amort. / kWh 83.2 cents83.2 cents 1.3 cents1.3 cents

New Wind Power vs. Recycled EnergyNew Wind Power vs. Recycled Energy
Equivalent Equivalent windwind
4 Recycled 4 Recycled Energy projectsEnergy projects
Installed Capacity, MWInstalled Capacity, MW 900900 400400
Annual Load FactorAnnual Load Factor 40%40% 90%90%
GWh per yearGWh per year 3,1543,154 3,1543,154
Capital Cost, MillionsCapital Cost, Millions $2,600$2,600 $300$300
Tonnes COTonnes CO2 2 saved/yrsaved/yr 2,259,0002,259,000 2,259,0002,259,000
Incremental fossil fuelIncremental fossil fuel 00 00
Capital/tonne COCapital/tonne CO22 saved saved $58$58 $7$7
Capital Amort. / kWhCapital Amort. / kWh 11.1 cents11.1 cents 1.3 cents1.3 cents

Capital Cost of Clean EnergyCapital Cost of Clean Energy
0
50
100
150
200
250
300
350
400
450
500
Solar PV Wind Recycled Energy
$ / Tonne CO2

Cents / kWh for Clean EnergyCents / kWh for Clean Energy
0
10
20
30
40
50
60
70
80
90
Solar PV Wind Recycled Energy
Cents / kWh
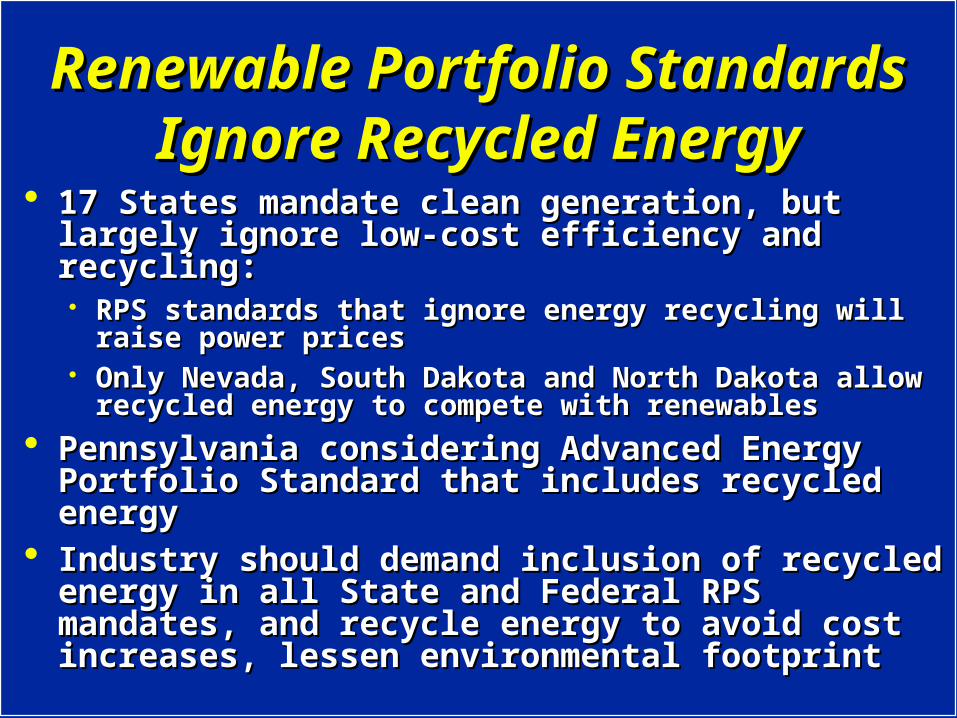
Renewable Portfolio Standards Renewable Portfolio Standards Ignore Recycled EnergyIgnore Recycled Energy
17 States mandate clean generation, but largely 17 States mandate clean generation, but largely ignore low-cost efficiency and recycling:ignore low-cost efficiency and recycling:
RPS standards that ignore energy recycling will raise RPS standards that ignore energy recycling will raise power pricespower prices
Only Nevada, South Dakota and North Dakota allow Only Nevada, South Dakota and North Dakota allow recycled energy to compete with renewablesrecycled energy to compete with renewables
Pennsylvania considering Advanced Energy Pennsylvania considering Advanced Energy Portfolio Standard that includes recycled energyPortfolio Standard that includes recycled energy
Industry should demand inclusion of recycled Industry should demand inclusion of recycled energy in all State and Federal RPS mandates, energy in all State and Federal RPS mandates, and recycle energy to avoid cost increases, and recycle energy to avoid cost increases, lessen environmental footprintlessen environmental footprint
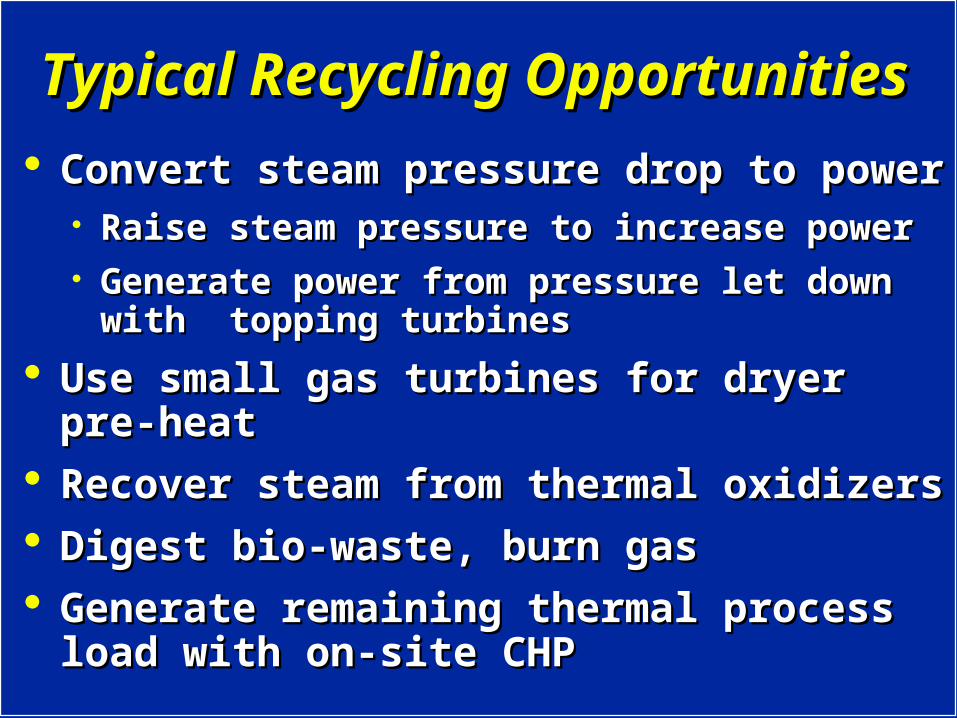
Typical Recycling OpportunitiesTypical Recycling Opportunities
Convert steam pressure drop to powerConvert steam pressure drop to power Raise steam pressure to increase powerRaise steam pressure to increase power Generate power from pressure let down with Generate power from pressure let down with
topping turbines topping turbines
Use small gas turbines for dryer pre-heatUse small gas turbines for dryer pre-heat Recover steam from thermal oxidizersRecover steam from thermal oxidizers Digest bio-waste, burn gasDigest bio-waste, burn gas Generate remaining thermal process load Generate remaining thermal process load
with on-site CHPwith on-site CHP

Typical Steam Plant DesignTypical Steam Plant Design
Boiler
FuelFuelFeed waterFeed water
H.P. steamH.P. steamHeader
High pressure steam process loadHigh pressure steam process load
Medium pressure steam process load
Low pressure steam Low pressure steam process loadprocess load
PressurePressureReducingReducing
Valve (PRV)Valve (PRV)
PRV

Turbine-generators Recycle Electricity Turbine-generators Recycle Electricity from Pressure Dropfrom Pressure Drop
Low Pressure steam out
Electricity out
High Pressure steam in
Note that this generator is sized to the thermal rather than electric load, thus “heat-first” CHP

The Coming DG RevolutionThe Coming DG Revolution First-mover countries are embracing recycled First-mover countries are embracing recycled
energy, including India and Chinaenergy, including India and China Energy recycling requires on-site generationEnergy recycling requires on-site generation Third-party energy partners speed processThird-party energy partners speed process
US energy efficiency is low, based on cheap US energy efficiency is low, based on cheap energy, but we now pay world prices for fuelenergy, but we now pay world prices for fuel
US industry largely ignored energy regulations, US industry largely ignored energy regulations, gave up a seat at the table. To correct, lobby to: gave up a seat at the table. To correct, lobby to:
Add recycled energy to all RPS standardsAdd recycled energy to all RPS standards Remove barriers to efficiency, including Remove barriers to efficiency, including
interconnection rules, backup, boiler manning laws, interconnection rules, backup, boiler manning laws, output based emission regulationsoutput based emission regulations
What Is At Stake?What Is At Stake?
A sustainable future with rising standards A sustainable future with rising standards of livingof living
US competitive position with trading US competitive position with trading partnerspartners
Long term impacts from today’s generation Long term impacts from today’s generation and T&D investment decisionsand T&D investment decisions
Global leadershipGlobal leadership

Final ThoughtsFinal Thoughts
If this analysis is correct, the global If this analysis is correct, the global consequences of clinging to the “central consequences of clinging to the “central generation paradigm” are not nicegeneration paradigm” are not nice
If we challenge the current worldview, we can If we challenge the current worldview, we can achieve a more sustainable future with:achieve a more sustainable future with:
lower cost energy,lower cost energy, less pollution, andless pollution, and higher standards of living.higher standards of living.
The CEO Coalition can speed change towards an The CEO Coalition can speed change towards an affordable and sustainable energy system.affordable and sustainable energy system.

Thank you for listening!