the cause-and-effect linkage between quality management ... · the cause-and-effect linkage between...
TRANSCRIPT
69
The Cause-and-Effect Linkage Between Quality Management and Balanced Scorecard
ZULNAIDI YAACOBOMMEI KOLSUM S. RAUTER
School of Distance EducationUniversiti Sains Malaysia
ABSTRACT
The objective of this study was to scientifically examine the path relationship between Quality Management (QM) and cause-and-effect performance linkage. According to QM literature, many studies have been carried out to investigate the relationship between QM and organisational performance (OP). Nevertheless, the report of these studies seems to ignore the cause-and-effect linkage of OP dimension as discussed in the Balanced Scorecard literature. The findings of this study provided evidence to support the concept of cause and effect linkage of performance dimension.
Keywords: Quality management; balanced scorecard; performance.
ABSTRAK
Kajian ini menyelidik perhubungan lintasan antara pengurusan kualiti (PK) dan rantaian sebab dan akibat pemboleh ubah prestasi. Berdasar akan literatur PK, kajian tentang hubungan antara PK dan prestasi organisasi telah banyak dibuat. Namun demikian, kajian-kajian tersebut didapati telah tidak mengambil kira konsep rantaian sebab dan akibat pemboleh ubah prestasi seperti yang dibincangkan dalam literatur Kad Skor Imbangan. Justeru, penemuan kajian ini menyediakan bukti empirik untuk menyokong konsep rantaian sebab dan akibat dimensi prestasi organisasi.
Kata kunci: Pengurusan kualiti; kad skor imbangan; prestasi.
INTRODUCTION
Quality Management (QM) has been widely articulated in the literature as the effective strategy for achieving various organisational goals (Sila & Ebrahimpour, 2002; Bou & Beltran, 2005; Dilber, Bayyurt, Zaim, & Tarim, 2005; Arawati, 2005). For instance, QM has led an organisation to increase productivity, decrease operating cost, improve customer satisfaction, and enhance employee motivation. According to
Balanced Scorecard (BSC) literature, the linkage between these various organisational performance dimensions forms a network or cause-and-effect linkage (Kaplan & Norton, 1996, 2000, 2004, Niven, 2003). For example, if an organisation improves employee motivation, then it leads to improved customer satisfaction. In other words, the relationship between QM and OP can be investigated by linking the QM to cause-and-effect performance linkage. However, to the best knowledge of this study, these relationships
http
://m
mj.u
um.e
du.m
y
70
have not been widely examined. The paucity that exists makes this present study an attempt to fill this gap. Thus, the objective of this study was to scientifically examine the path relationship between QM and cause-and-effect performance linkage. In order to present this study, the rest of this paper is organised in the following way. The next two sections review the previous studies of the relationship between QM and OP as well as the BSC cause-and-effect linkage literature. Next, the research model of the study is formulated and hypothesis of the study is generated. This is followed by the research methodology and data analysis. The second last section reports the findings of the study. Finally, the discussion and conclusion are presented.
THE RELATIONSHIP BETWEEN QM AND ORGANISATIONAL
PERFORMANCE
This section reviews the empirical study on the relationship between QM and performance. It can be concluded from these reviews that many researchers clearly revealed that significant improvement in various dimensions of performance can be harvested by institutionalising TQM. For example, TQM strategy has contributed to the betterment of performance in manufacturing (Flynn, Schroeder, & Sakakibara, 1995; Arawati, 2005); local government (Khairul Anuar, Rushami, & Zakaria, 2001); various service organisations (Yasin, Alavi, Kunt, & Zimmerer, 2004), and financial companies (Llorens Montes & Verdu Jover, 2004). Table 1 shows various performance dimensions that were reported as having a positive significant relationship with QM.
Table 1: Studies on the Relationship between QM and Performance
Author Performance Dimensions
Flynn et al. (1995)product quality, percent of items pass final inspection without requiring rework, unit cost, fast delivery, flexibility, inventory turnover
Powell (1995) overall financial performance
Khairul Anuar et al. (2001) productivity in revenue, cost management
Yasin et al. (2004)
client satisfaction, market share, return on investment, employee morale, management satisfaction, reputation of the firm, ability to introduce organisational change, operating cost, employee productivity, operating efficiency, administrative cost
Sanchez-Rodriguez & Martinez-Lorente (2004)
quality of materials, on time delivery, inventory and material cost, internal customer satisfaction
Arawati (2005)revenue growth, sales growth, market share, profit, high demand, product turnover, productivity and production efficiency
Our review of QM literature enabled this study to suggest that QM leads to better OP. The following generic framework of the relationship between QM and OP is illustrated in Figure 1. Nevertheless, these reported studies seem to ignore the new ways to measure OP, which was proposed by Kaplan and Norton (2004). These new ways were later be popularised as the concept of Balanced Scorecard (BSC). According to Kaplan and Norton (2004), this concept is becoming increasingly important in today’s
knowledge-based organisations where financial performance alone is not adequate to measure the value created by organisational intangible asset. They also explained that, three non-financial perspectives of OP, namely customer, internal process, and learning and growth were lead indicators of financial performance. However, this is not the case for governmental organisations, such as the local government. The bottom line for governmental organisations is not financial performance, but customer performance (Kaplan
http
://m
mj.u
um.e
du.m
y
71
& Norton, 2000; Niven, 2003). The following section discusses the cause-and-effect of OP linkage for governmental organisations.
Figure 1: The Relationship between QM and OP
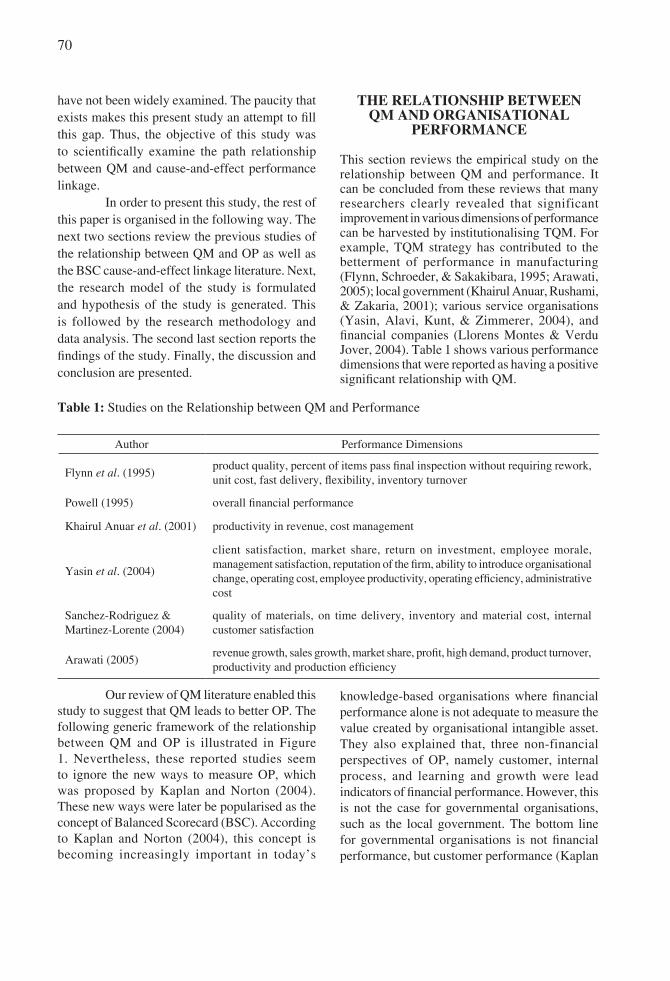
The Balanced Scorecard Cause-and-Effect LinkageAccording to Balanced Scorecard (BSC) literature of local government, the cause and effect performance linkage can be described as follows: Financial Performance → Employee Learning and Growth Performance → Internal Process Performance → Customer Performance (Niven, 2003). The meeting point between the philosophy of QM and BSC cause-and-effect linkage is customer performance. The bottom-line of QM is satisfying the customer (Kanji, 2002) and so with the bottom-line of performance of local governments. As written by Kaplan and Norton
Quality Management
Organisational Performance
(1996), “success for government should be measured by how they meet the needs of their constituencies…financial considerations can play an enabling or constraining role, but will rarely be the primary objective (p.80).”
In service organisations like the local government, customer satisfaction depends much on the ability of organisations to serve good service on time. In order to provide good service to customers, local governments should have good internal proceses. Good internal process refers to the ability of local governments to introduce new products/services timely, the use of latest technology for increasing effectiveness as well as having systematic procedures to improve the quality of service offered. However, good internal process is related to the knowledge and commitment of personnel hired by the organisation. In order to provide enough training, appropriate remuneration, and good work environment, the organisation should have enough funds. Adequate fund is only possible if the organisation achieves good financial performance. All these relationships are depicted in Figure 2.0.
Figure 2: The BSCS ‘cause and effect’ Linkage (adapted from Niven, 2003)
CustomerFinancial HRM Internal Process
RESEARCH MODEL AND HYPOTHESES
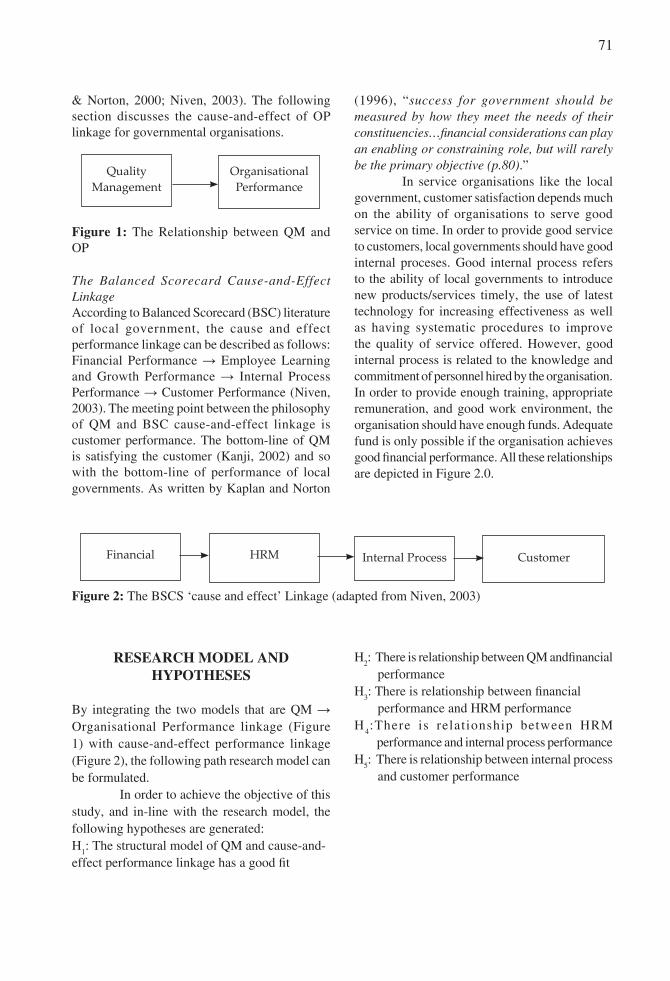
By integrating the two models that are QM → Organisational Performance linkage (Figure 1) with cause-and-effect performance linkage (Figure 2), the following path research model can be formulated.
In order to achieve the objective of this study, and in-line with the research model, the following hypotheses are generated: H1: The structural model of QM and cause-and-effect performance linkage has a good fit
H2: There is relationship between QM andfinancial performanceH3: There is relationship between financial performance and HRM performanceH4:There is relationship between HRM performance and internal process performanceH5: There is relationship between internal process and customer performance
http
://m
mj.u
um.e
du.m
y
72
Organisational Performance
Figure 3: Research Model
Financial HRM Internal Process
QM Customer
METHODOLOGY
Data of this study were collected from City and Municipal Councils in Malaysia. The District Councils were not included in the sampling frame in order to eliminate the possibility of including very small local governments as sample of this study. This is to control the effect of organisational size. Data were collected from 250 departments attached to 25 local governments. The departments and local governments were selected using stratified cluster sampling. At first stage local governments were stratified according to their status either city or municipal councils. The local governments were then selected randomly according to their strata. Then, these departments became samples of this study. Out of 250 questionnaires distributed, 205 were returned and usable for further analysis. High response rate was achieved due to several care steps taken, namely (1) the instrument was ensured to be easy to read and was understandable, (2) the instrument was printed in a booklet format that appeared tidy and professional, (3) consistent, professional and courteous undertakings through periodic follow-up calls to the respondents, (4) a pretest and pilot test were carried out to ascertain the appropriateness of the items asked.
VARIABLE MEASUREMENT
All constructs were anchored on a five-point Likert scale, ranging from (1) for strongly
disagree to (5) for strongly agree. Higher score reflects higher level of QM being practised and higher performance achieved on asked items. The variable of QM was measured using four items, namely (1) commitment of management on QM initiative, (2) customer’s complaint entertained, (3) quality related training provided, and (4) QM as an ongoing process. The degree of financial performance was measured on three indicators, namely (1) good budget management, (2) operation cost saving, and (3) increase in productivity. The level of customer performance was measured using four items, namely (1) having high demand, (2) customer satisfaction, (3) timeliness of service delivered, and (4) having good reputation among customers. The construct of internal process performance was measured using three items, namely (1) having successfully introduced new products timely, (2) using latest technology for work process, and (3) having effective procedure for improving quality of service offered. The score of employee performance was measured using four items, namely (1) maintain motivation of employee, (2) having employee development programme, (3) high job satisfaction, and (4) supportive work climate.
FINDINGS
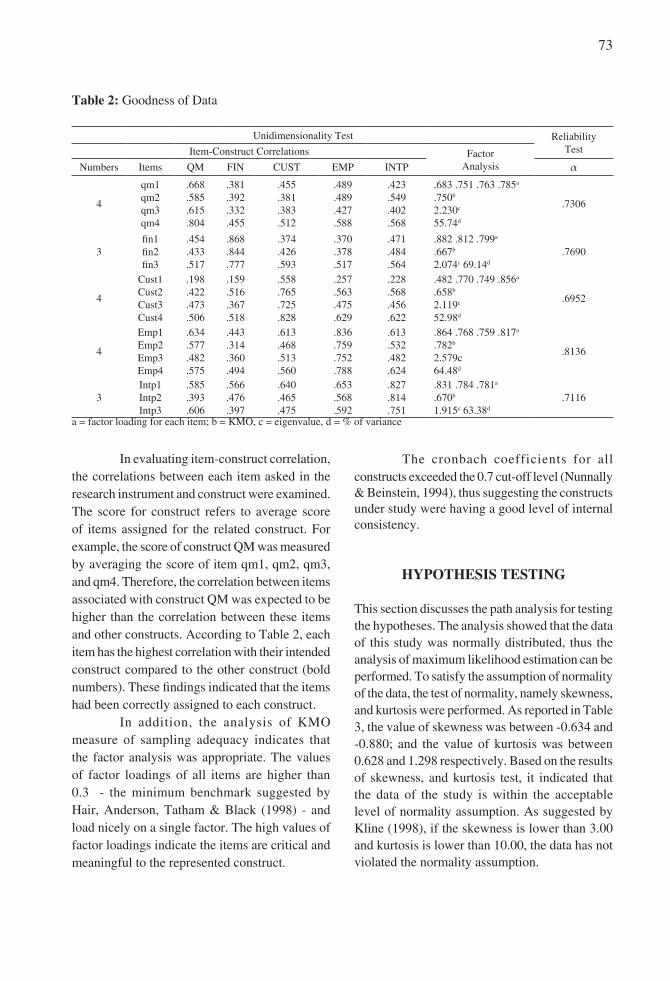
This section reports the findings of the study. Before testing the hypotheses, the goodness of the data was examined. Three tests were performed, namely item-construct correlation, factor analysis, and reliability test as depicted in Table 2.
http
://m
mj.u
um.e
du.m
y
73
Table 2: Goodness of Data
Unidimensionality Test ReliabilityTestItem-Construct Correlations Factor
AnalysisNumbers Items QM FIN CUST EMP INTP α
4
qm1qm2qm3 qm4
.668
.585
.615
.804
.381
.392
.332
.455
.455
.381
.383
.512
.489
.489
.427
.588
.423
.549
.402
.568
.683 .751 .763 .785a
.750b
2.230c
55.74d
.7306
3fin1fin2fin3
.454
.433
.517
.868
.844
.777
.374
.426
.593
.370
.378
.517
.471
.484
.564
.882 .812 .799a
.667b
2.074c 69.14d
.7690
4
Cust1Cust2Cust3Cust4
.198
.422
.473
.506
.159
.516
.367
.518
.558
.765
.725
.828
.257
.563
.475
.629
.228
.568
.456
.622
.482 .770 .749 .856a
.658b
2.119c 52.98d
.6952
4
Emp1Emp2Emp3Emp4
.634
.577
.482
.575
.443
.314
.360
.494
.613
.468
.513
.560
.836
.759
.752
.788
.613
.532
.482
.624
.864 .768 .759 .817a
.782b
2.579c 64.48d
.8136
3Intp1Intp2Intp3
.585
.393
.606
.566
.476
.397
.640
.465
.475
.653
.568
.592
.827
.814
.751
.831 .784 .781a
.670b
1.915c 63.38d
.7116
a = factor loading for each item; b = KMO, c = eigenvalue, d = % of variance
In evaluating item-construct correlation, the correlations between each item asked in the research instrument and construct were examined. The score for construct refers to average score of items assigned for the related construct. For example, the score of construct QM was measured by averaging the score of item qm1, qm2, qm3, and qm4. Therefore, the correlation between items associated with construct QM was expected to be higher than the correlation between these items and other constructs. According to Table 2, each item has the highest correlation with their intended construct compared to the other construct (bold numbers). These findings indicated that the items had been correctly assigned to each construct.
In addition, the analysis of KMO measure of sampling adequacy indicates that the factor analysis was appropriate. The values of factor loadings of all items are higher than 0.3 - the minimum benchmark suggested by Hair, Anderson, Tatham & Black (1998) - and load nicely on a single factor. The high values of factor loadings indicate the items are critical and meaningful to the represented construct.
The cronbach coefficients for all constructs exceeded the 0.7 cut-off level (Nunnally & Beinstein, 1994), thus suggesting the constructs under study were having a good level of internal consistency.
HYPOTHESIS TESTING
This section discusses the path analysis for testing the hypotheses. The analysis showed that the data of this study was normally distributed, thus the analysis of maximum likelihood estimation can be performed. To satisfy the assumption of normality of the data, the test of normality, namely skewness, and kurtosis were performed. As reported in Table 3, the value of skewness was between -0.634 and -0.880; and the value of kurtosis was between 0.628 and 1.298 respectively. Based on the results of skewness, and kurtosis test, it indicated that the data of the study is within the acceptable level of normality assumption. As suggested by Kline (1998), if the skewness is lower than 3.00 and kurtosis is lower than 10.00, the data has not violated the normality assumption.
http
://m
mj.u
um.e
du.m
y
74
Table 3: Skewness and Kurtosis of Constructs
Variables Skewness KurtosisTQM -0.637 0.870Financial -0.694 0.628Customer -0.733 0.713Employee -0.880 1.274Internal Process -0.809 1.298
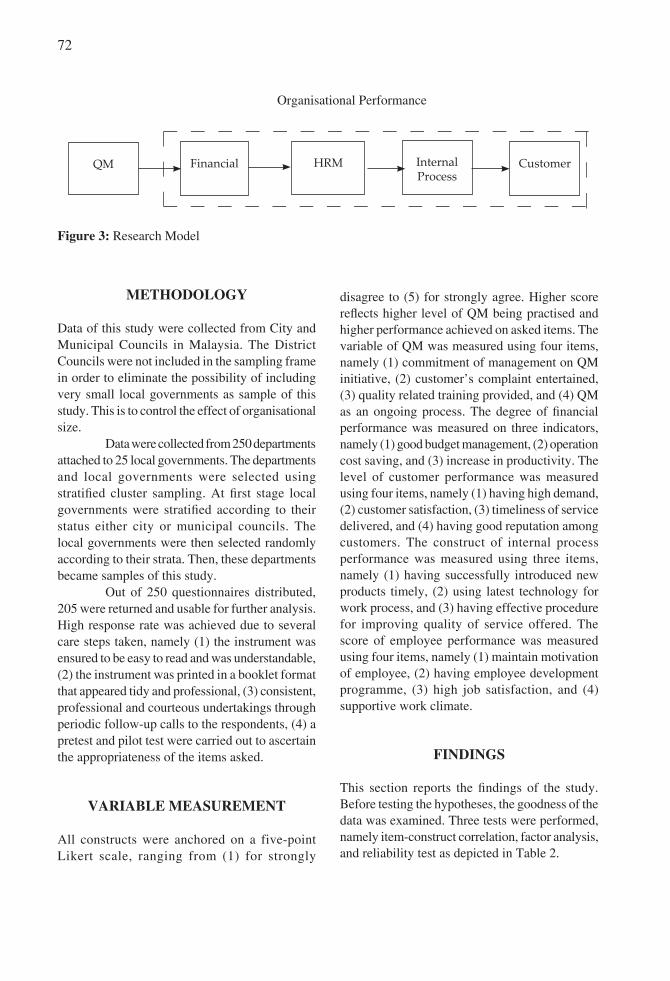
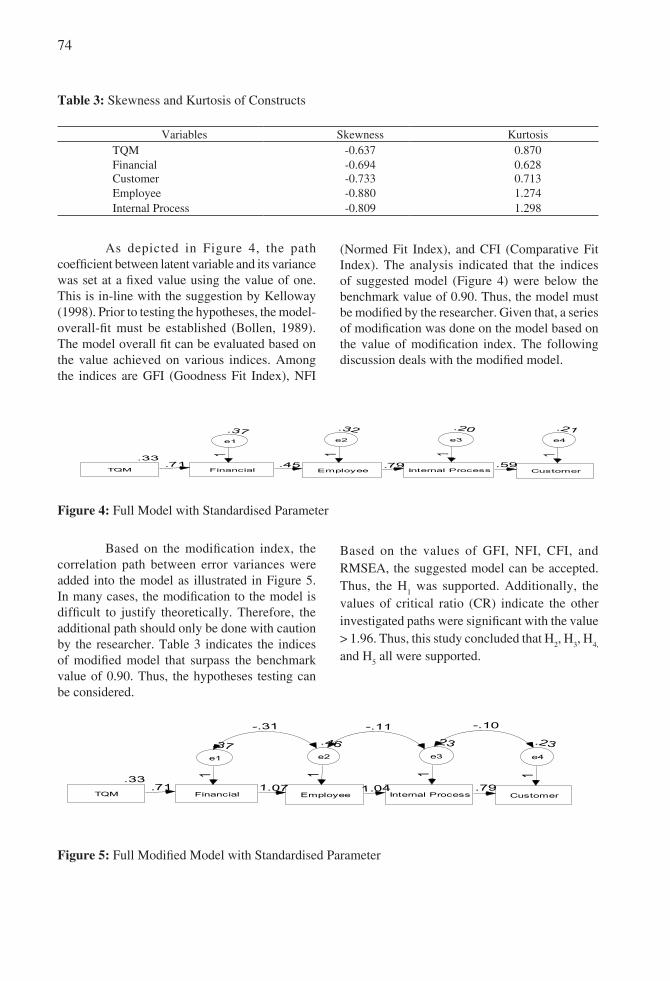
As depicted in Figure 4, the path coefficient between latent variable and its variance was set at a fixed value using the value of one. This is in-line with the suggestion by Kelloway (1998). Prior to testing the hypotheses, the model-overall-fit must be established (Bollen, 1989). The model overall fit can be evaluated based on the value achieved on various indices. Among the indices are GFI (Goodness Fit Index), NFI
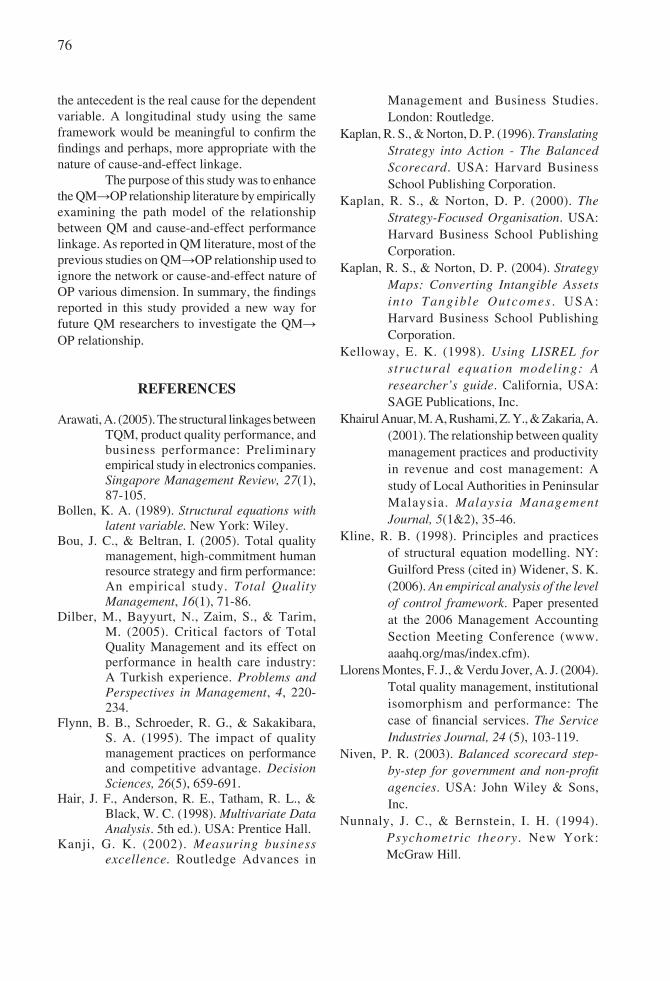
Based on the modification index, the correlation path between error variances were added into the model as illustrated in Figure 5. In many cases, the modification to the model is difficult to justify theoretically. Therefore, the additional path should only be done with caution by the researcher. Table 3 indicates the indices of modified model that surpass the benchmark value of 0.90. Thus, the hypotheses testing can be considered.
Figure 4: Full Model with Standardised Parameter
(Normed Fit Index), and CFI (Comparative Fit Index). The analysis indicated that the indices of suggested model (Figure 4) were below the benchmark value of 0.90. Thus, the model must be modified by the researcher. Given that, a series of modification was done on the model based on the value of modification index. The following discussion deals with the modified model.
Figure 5: Full Modified Model with Standardised Parameter
Based on the values of GFI, NFI, CFI, and RMSEA, the suggested model can be accepted. Thus, the H1 was supported. Additionally, the values of critical ratio (CR) indicate the other investigated paths were significant with the value > 1.96. Thus, this study concluded that H2, H3, H4, and H5 all were supported.
.33TQM Financial Employee Internal Process
.71 .45 .79Customer
.59
.37e1
1
.32e2
1
.20e3
1.21e4
1
.33TQM Financial Employee Internal Process
.71 1.07 1.04Customer
.79
.37e1
1
.46e2
1
.23e3
1
.23e4
1
-.31 -.10-.11ht
tp://
mm
j.uum
.edu
.my

75
Table 4: Hypotheses Testing
Indexes of Full ModelIndices Threshold (Hair et al., 1998) Value Acceptability
GFI- Goodness Fit IndexNFI- Normed Fit IndexCFI- Comparative Fit IndexRMSEA
≥ 0.90≥ 0.90≥ 0.90≤ 0.08
.965
.967
.9720.08
Acceptable AcceptableAcceptableAcceptable
Hypotheses TestingPath S.E s.e CR* Hypothesis Results
QM-FinFin-EmpEmp-IntInt-cus
0.7101.0741.0390.792
0.0740.1150.0700.062
9.621*9.301*14.791*12.803*
H2
H3
H4
H5
supportedsupportedsupportedsupported
Notes: S.E. = standard estimate, s.e. = standard error, CR = Critical Ratio, * significant at CR ≥1.96
DISCUSSION
Findings of this study supported the concept of cause-and-effect linkage between four generic dimensions of organisational performance. However, the linkage is not restricted to one-way direction as prescribed in the BSC’s texts. On the other hand, the modified model of this study as given in Figure 5, depicted that the four generic dimensions of performance tend to have synergistic link between each dimension. The correlation between error variance of these four dimensions provided evidence that these four dimensions are difficult to be definitely separated as a distinctive concept. In contrast, they are closely related, having more complicated linkage instead of a simple one-way linkage. Logically, the satisfied customers will bring back positive financial performance.
However, which performance dimension is the most directly effected by QM is still questionable. Is QM directly related to customer satisfaction? Or customer satisfaction can only be achieved if QM brings positive effect on the other three generic dimensions, namely financial, employee, and internal process. Therefore, a further study would be meaningful in exploring this issue in detail. The findings of this study support the concept of cause-and-effect linkage, which provides implication that the managers of local governments have a choice of either to rely on the
indicators of customer performance or to depend on predisposed indicators like financial, HRM, and internal process performance in evaluating the successful rate of QM being practised. Financial performance perhaps is more of an objective indicator than customer performance. More objective indicators are perhaps more manageable and controllable. The target objective can be achieved if the target could be measured. Therefore, it would bring a positive impact on the way managers manage their QM being in place.
LIMITATION AND CONCLUSION
This study follows the cause-and-effect OP linkage as discussed by Niven (2003). This cause-and-effect OP linkage is slightly different with the cause-and-effect of OP linkages suggested by Kaplan and Norton (2000). Niven (2003) suggested this cause-and-effect OP linkage (Financial Performance → Employee Learning and Growth Performance → Internal Process Performance → Customer Performance), while Kaplan and Norton (2000) suggested this cause-and-effect OP linkage (Employee Learning and Growth Performance → Internal Process Performance → Financial Performance → Customer Performance). However the concept of network and cause-and-effect linkage among the OP dimensions is unchanged.
As a cross-sectional study, there is a limit for us to conclude with full certainty that
http
://m
mj.u
um.e
du.m
y
76
the antecedent is the real cause for the dependent variable. A longitudinal study using the same framework would be meaningful to confirm the findings and perhaps, more appropriate with the nature of cause-and-effect linkage.
The purpose of this study was to enhance the QM→OP relationship literature by empirically examining the path model of the relationship between QM and cause-and-effect performance linkage. As reported in QM literature, most of the previous studies on QM→OP relationship used to ignore the network or cause-and-effect nature of OP various dimension. In summary, the findings reported in this study provided a new way for future QM researchers to investigate the QM→OP relationship.
REFERENCES
Arawati, A. (2005). The structural linkages between TQM, product quality performance, and business performance: Preliminary empirical study in electronics companies. Singapore Management Review, 27(1), 87-105.
Bollen, K. A. (1989). Structural equations with latent variable. New York: Wiley.
Bou, J. C., & Beltran, I. (2005). Total quality management, high-commitment human resource strategy and firm performance: An empirical study. Total Quality Management, 16(1), 71-86.
Dilber, M., Bayyurt, N., Zaim, S., & Tarim, M. (2005). Critical factors of Total Quality Management and its effect on performance in health care industry: A Turkish experience. Problems and Perspectives in Management, 4, 220-234.
Flynn, B. B., Schroeder, R. G., & Sakakibara, S. A. (1995). The impact of quality management practices on performance and competitive advantage. Decision Sciences, 26(5), 659-691.
Hair, J. F., Anderson, R. E., Tatham, R. L., & Black, W. C. (1998). Multivariate Data Analysis. 5th ed.). USA: Prentice Hall.
Kanji, G. K. (2002). Measuring business excellence. Routledge Advances in
Management and Business Studies. London: Routledge.
Kaplan, R. S., & Norton, D. P. (1996). Translating Strategy into Action - The Balanced Scorecard. USA: Harvard Business School Publishing Corporation.
Kaplan, R. S., & Norton, D. P. (2000). The Strategy-Focused Organisation. USA: Harvard Business School Publishing Corporation.
Kaplan, R. S., & Norton, D. P. (2004). Strategy Maps: Converting Intangible Assets in to Tangible Outcomes . USA: Harvard Business School Publishing Corporation.
Kelloway, E. K. (1998). Using LISREL for structural equation modeling: A researcher’s guide. California, USA: SAGE Publications, Inc.
Khairul Anuar, M. A, Rushami, Z. Y., & Zakaria, A. (2001). The relationship between quality management practices and productivity in revenue and cost management: A study of Local Authorities in Peninsular Malaysia. Malaysia Management Journal, 5(1&2), 35-46.
Kline, R. B. (1998). Principles and practices of structural equation modelling. NY: Guilford Press (cited in) Widener, S. K. (2006). An empirical analysis of the level of control framework. Paper presented at the 2006 Management Accounting Section Meeting Conference (www.aaahq.org/mas/index.cfm).
Llorens Montes, F. J., & Verdu Jover, A. J. (2004). Total quality management, institutional isomorphism and performance: The case of financial services. The Service Industries Journal, 24 (5), 103-119.
Niven, P. R. (2003). Balanced scorecard step-by-step for government and non-profit agencies. USA: John Wiley & Sons, Inc.
Nunnaly, J. C., & Bernstein, I. H. (1994). Psychometric theory. New York: McGraw Hill.
http
://m
mj.u
um.e
du.m
y
77
Powell, T. C. (1995). Total quality management as competitive advantage: A review and empirical study. Strategic Management Journal, 16 (1), 15-37.
Sanchez-Rodriguez, C., & Martinez-Lorente, A. R. (2004). Quality management practices in the purchasing function: An empirical study. International Journal of Operations and Production Management, 24 (7), 666-687.
Sila, I., & Ebrahimpour, M. (2002). An investigation of the total quality management survey based research published between 1989 and 2000. International Journal of Quality & Reliability Management, 19(7), 902-970.
Yasin, M. M., Alavi, J., Kunt, M., & Zimmerer, T. W. (2004). TQM practices in service organizations: An exploratory study into the implementation, outcomes and effectiveness. Managing Service Quality, 14 (5), 377-389.
http
://m
mj.u
um.e
du.m
y

http
://m
mj.u
um.e
du.m
y
79
Technology Implementation Barriers In The Malaysian Herbal Industry: A Case Study
NORAINI NORDINSITI NOREZAM OTHMAN
RUZINOOR CHE MATCollege of Business
Universiti Utara Malaysia
ABSTRACT
Technology is an essential component in all types of organisations and most organisations have reasons to implement new technology. The most fundamental justification for new technology implementation is that the technology must be able to contribute to strong competitive advantages and also increase or create long-term profit. In most small and medium enterprises (SMEs), there are barriers or obstacles in implementing these technologies. This article report a study aimed in investigating barriers faced by the Malaysian herbal industry in implementing technologies in their factory. Most of the local herbal manufacturing firms are categorised as SMEs which are usually considered to be lagged behind larger companies in technology usage. As this was an exploratory research, a case study method was used as it gave in-depth explanation of the main barriers of technology implementation. The results suggested that the main constraint in implementing technologies are lack of technical specialists and financial, aid commitment from top management, low wage rate, and future demand uncertainties.
Keywords: Technology implementation; herbal industry; technology barriers.
ABSTRAK
Teknologi merupakan komponen yang penting dalam semua jenis organisasi. Kebanyakan organisasi mempunyai alasan untuk melaksanakan teknologi baru. Justifikasi yang paling asas untuk melaksanakan teknologi baru ialah teknologi tersebut mesti mampu menyumbang kepada kelebihan persaingan yang kukuh dan meningkatkan atau menghasilkan keuntungan jangka panjang. Di kebanyakan syarikat kecil dan sederhana, terdapat beberapa halangan atau kesulitan dalam melaksanakan teknologi-teknologi ini di kilang mereka. Kajian ini bertujuan untuk menyiasat halangan-halangan yang dihadapi oleh industi herba di Malaysia dalam melaksanakan teknologi di kilang mereka. Kebanyakan firma pembuatan herba dikategorikan sebagai syarikat kecil dan sederhana yang sering ketinggalan berbanding syarikat besar dari aspek penggunaan teknologi. Oleh kerana kajian ini berbentuk penerokaan, pendekatan kajian kes digunakan kerana ianya dapat memberi penjelasan yang mendalam tentang halangan-halangan utama dalam melaksanakan teknologi. Hasil kajian ini menyarankan bahawa kekangan utama dalam melaksanakan teknologi adalah kekurangan pakar teknikal dan kewangan, komitmen dari pengurusan atasan, kadar gaji yang rendah dan permintaan hadapan yang tidak pasti.
Kata kunci: Perlaksanaan teknologi; industri herba; halangan-halangan teknologi.
http
://m
mj.u
um.e
du.m
y
80
INTRODUCTION
Overview of the Malaysian Herbal Industry
In recognising the country’s rich bio-resources, the herbal industry has become another economic engine of growth and has the potential to become a significant industry in Malaysian agriculture. The Third National Agricultural Policy (1998-2010) had identified herbal products under Specialty
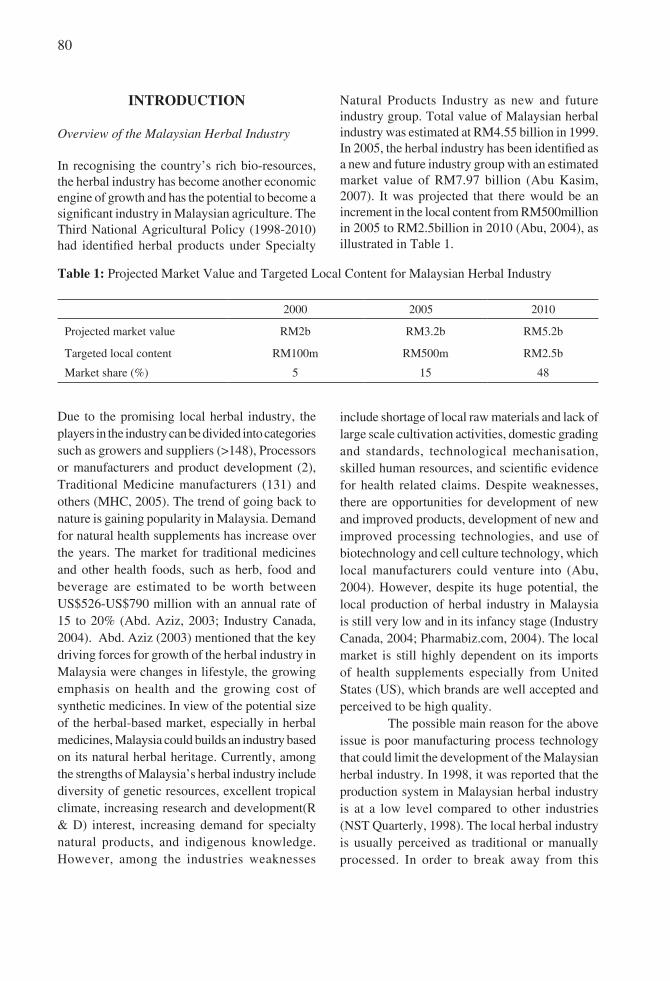
Natural Products Industry as new and future industry group. Total value of Malaysian herbal industry was estimated at RM4.55 billion in 1999. In 2005, the herbal industry has been identified as a new and future industry group with an estimated market value of RM7.97 billion (Abu Kasim, 2007). It was projected that there would be an increment in the local content from RM500million in 2005 to RM2.5billion in 2010 (Abu, 2004), as illustrated in Table 1.
Table 1: Projected Market Value and Targeted Local Content for Malaysian Herbal IndustryIntroduction
200 2000 2200 2005 0 2010
Projected market value RM2b RM3.2b RM5.2b
Targeted local content RM100m RM500m RM2.5b
Market share (%) 5 15 48
Due to the promising local herbal industry, the players in the industry can be divided into categories such as growers and suppliers (>148), Processors or manufacturers and product development (2), Traditional Medicine manufacturers (131) and others (MHC, 2005). The trend of going back to nature is gaining popularity in Malaysia. Demand for natural health supplements has increase over the years. The market for traditional medicines and other health foods, such as herb, food and beverage are estimated to be worth between US$526-US$790 million with an annual rate of 15 to 20% (Abd. Aziz, 2003; Industry Canada, 2004). Abd. Aziz (2003) mentioned that the key driving forces for growth of the herbal industry in Malaysia were changes in lifestyle, the growing emphasis on health and the growing cost of synthetic medicines. In view of the potential size of the herbal-based market, especially in herbal medicines, Malaysia could builds an industry based on its natural herbal heritage. Currently, among the strengths of Malaysia’s herbal industry include diversity of genetic resources, excellent tropical climate, increasing research and development(R & D) interest, increasing demand for specialty natural products, and indigenous knowledge. However, among the industries weaknesses
include shortage of local raw materials and lack of large scale cultivation activities, domestic grading and standards, technological mechanisation, skilled human resources, and scientific evidence for health related claims. Despite weaknesses, there are opportunities for development of new and improved products, development of new and improved processing technologies, and use of biotechnology and cell culture technology, which local manufacturers could venture into (Abu, 2004). However, despite its huge potential, the local production of herbal industry in Malaysia is still very low and in its infancy stage (Industry Canada, 2004; Pharmabiz.com, 2004). The local market is still highly dependent on its imports of health supplements especially from United States (US), which brands are well accepted and perceived to be high quality. The possible main reason for the above issue is poor manufacturing process technology that could limit the development of the Malaysian herbal industry. In 1998, it was reported that the production system in Malaysian herbal industry is at a low level compared to other industries (NST Quarterly, 1998). The local herbal industry is usually perceived as traditional or manually processed. In order to break away from this
http
://m
mj.u
um.e
du.m
y
81
perception, the herbal manufacturers need to be more proactive. With technology, a herbal manufacturing firm could gain improvement in product quality and productivity, and also increase profitability (Sabourin & Beckstead, 1999). The firm must find and utilise technology that can improve the product quality in order to capture the domestic market and also to penetrate overseas market, especially Europe, US, and Japan which have stringent regulations on food and herbal products (NST Quarterly, 1998). As far as the Malaysian herbal industry is concerned, there is little research done in the technology implementation area. Most of these studies were done in other industries, such as automotives and electronics. This paper focuses on obstacles faced by the Malaysian herbal manufacturing firms in implementing technology, especially in the production system. This research was based on in-depth case study of three selected Malaysian traditional medicine manufacturers. The responses were recorded during comprehensive interviews with the top management and the company site visits. The interview information was tabulated and the findings are presented in the result section.
Technology Implementation and BarriersIn order to maintain or achieve competitiveness and profitability, a manufacturing firm or enterprise must respond to a range of challenges, including rapid improvement in technology, declining employment and output, globalisation of markets, and environmental requirements (Kennedy & Hyland, 2003). New technologies can build new production capabilities and competencies that enable the firm to adapt quickly to changing opportunities (Krajewski & Ritzman, 1998).
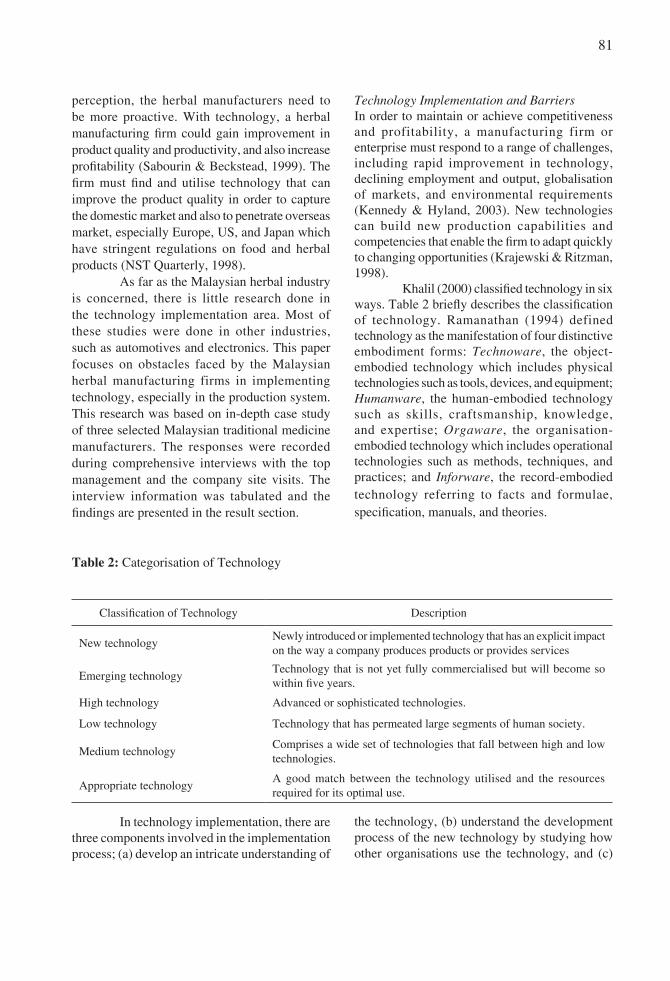
Khalil (2000) classified technology in six ways. Table 2 briefly describes the classification of technology. Ramanathan (1994) defined technology as the manifestation of four distinctive embodiment forms: Technoware, the object-embodied technology which includes physical technologies such as tools, devices, and equipment; Humanware, the human-embodied technology such as skills, craftsmanship, knowledge, and expertise; Orgaware, the organisation-embodied technology which includes operational technologies such as methods, techniques, and practices; and Inforware, the record-embodied technology referring to facts and formulae, specification, manuals, and theories.
Table 2: Categorisation of Technology
Classification of Technology Description
New technologyNewly introduced or implemented technology that has an explicit impact on the way a company produces products or provides services
Emerging technologyTechnology that is not yet fully commercialised but will become so within five years.
High technology Advanced or sophisticated technologies.
Low technology Technology that has permeated large segments of human society.
Medium technologyComprises a wide set of technologies that fall between high and low technologies.
Appropriate technologyA good match between the technology utilised and the resources required for its optimal use.
In technology implementation, there are three components involved in the implementation process; (a) develop an intricate understanding of
the technology, (b) understand the development process of the new technology by studying how other organisations use the technology, and (c)
http
://m
mj.u
um.e
du.m
y
82
adaptation of the selected technologies, products, process, and system to meet the specific needs of the organisation. In order to ensure successful implementation, the success factors include firm’s absorptive capacity, communication skills, managing expectation, managing risk, and general wisdom (Rouse, 2000).
The implementation of technology brings about many benefits. The most important benefits are reduced cycle time, market share growth, increased or created long-term profit, improved productivity, reduced costs, improved product quality, reduced labour and increased product/process flexibility (Swamidass & Kotha, 1998; Rouse, 2000; Globadian, O’Regan, & Liu, 2000, Zhao & Co 1997; Sabourin & Beckstead, 1999).
However, according to Kennedy and Hyland (2003), small firms especially will continue to struggle to compete with large companies, and they are either unwilling or unable to invest in improvement programmes and activities, and also new technology. This is due to lack of financial resources, business experience and knowledge, and human resource. Moreover, these small to medium-sized enterprises (SMEs) feel forced to apply these technologies due to pressure from government, associated companies, and customers. Rouse (2000), Walker, Bode, Burn, and Webster (2003), and Sabourin and Beckstead (1999) reported that the main factors that hindered a manufacturing company to implement new technologies despite of the benefits are high equipment cost, cost of capital, lack of skilled workers, management resistance to new technology, lack of adequate technical support, and low number of adequately trained managers to deal with technology-related decisions.
For manufacturing companies in newly industrialised countries (NIC), Zhao and Co (1997), and Nouri (1997) stated that the reasons of low technology uptake in these countries are due to barriers in the transfer of technology, lower wage rate, size of firm, and paradigm of competition. Nonetheless, Balwin and Lin (1994) found there is success in SMEs to be associated with the implementation of an innovation strategy that is often technology based. The decision to apply technologies ultimately rests on the benefits that the technology provides, the costs associated
with its implementation, and the barriers that the firms will face. According to Jones, Beynon-Davies, and Geaves (2003), it is not the size of the enterprise that should directly affect success in technology application, but rather the availability and allocation of resources. Sambasivarao and Deshmukh (1995) reported that the problems do not lie in the level of technology but rather in its implementation. To successfully implement AMT in a manufacturing company, the company must reassess its direction, strengths and weaknesses.
METHODOLOGY
As this research was an exploratory research, a qualitative method was used. By exploring the topic, the researchers expected to formulate more precise questions which future research can answer. The case study method gave the authors the necessary depth so that the variables could not only be identified, but also developed, and the importance of the identified variables understood (Eisenhardt, 1989).
The primary goal of the research was to investigate the obstacles faced by the small and medium herbal manufacturing firms in implementing the technologies. Even though there has been much research done in technology implementation, especially in advanced manufacturing technology (AMT) of other manufacturing industries, very few investigations had been done in the herbal industry. Therefore, to understand the barriers of technology application in the Malaysian herbal industry, three herbal firms were selected based on their number of full-time employees, the company’s age, and type of market.
The data came from two sources: semi-structured interviews and observations. For semi-structured interviews, we used the same interview protocol at all the plants. This interview protocol is a replication of questionnaires adapted and modified from Sabourin and Beckstead (1999), who did a research on advanced manufacturing technology (AMT) adoption in Canadian manufacturing, covering a wide range of manufacturing industries. The sections which were relevant to the scope
http
://m
mj.u
um.e
du.m
y

83
of our study were chosen. Items included in the protocol were company background; technologies used (currently and plan to use within three years), development and implementation of technologies, results of technology implementation, and obstacles of implementation.
The same questions were asked to different interviewees for triangulation purposes (Tellis, 1997). The need for triangulation arises from the ethical need to confirm the validity of data obtained. The interview subjects were questioned with regard to their actual experiences and for consistency in the data and its interpretation, an interview structure was provided. The interviews were conducted for approximately 30 minutes for each respondent. They involved the key personnel in the company that is directly involved in technology implementation decision making, such as Research and Development Advisor, Research and Development Manager, and Quality Manager.
A plant tour was requested at all companies visited. During the tour, the process flow of the main products and its machineries used in the production floor were shown and explained in detail. Whenever possible, the observation was made on what type of technology had been used in the company and the obstacles faced by the company in implementing the technology that was currently used and also in the near future. The information gathered was written down in a log book along with a summary of the interviews. The purpose of these observations was primarily to verify the information collected from interviews.
Selection Criteria for Case StudiesEven though there are about 131 traditional herbal based medicine businesses in Malaysia, the number of manufacturers or processors is very small. According to MHC (2005), there were only two manufacturers at that time. The criteria for selecting case studies were they must be manufacturers, must be capable of penetrating the global market, and must be established in business for more than five years. These three companies were herbal based products manufacturers. The reason for choosing the manufacturers was to examine the status of technology implementation
in the factories. The size of the companies varied from small to large. Although they were varied in size, in terms of the selection criteria mentioned, these three companies had fulfilled the requirements.
CASE ANALYSIS AND RESULTS
Overview of the Case Study Background
Case Study Company ACompany A is a network marketing company established in 1995 that focuses on Ganoderma mushroom-based health products. The products were not only marketed in Malaysia but it also has penetrated overseas market, such as Thailand, Indonesia, Hong Kong, Brunei, Singapore, Taiwan, Germany, Saudi Arabia, Philippines, Australia, India, Canada, and very recently US. To date, the company is operating with 500 full-time employees to produce 49 product items. The product series involved are health food supplement, food and beverages, personal cares, household products, and skin care cosmetics. The company’s main product is Lingzhi coffee.
For the financial year end February 2005, Company A’s revenue increased by 62% to RM169.8 million against RM104.3 million for the previous year. Also for the first quarter of the financial year 2006, the company has reported a 23% rise in net profit to RM7.28 million compared to RM5.94 million in the same period last year.
With products penetrating almost 50 countries worldwide, production is done in one factory, where all the ganoderma mushroom plantation, manufacturing plant, and packaging are located in one place. The production is semi-automated with 30% human labour due to Malaysia’s low wage rate. However, with the second new coffee plant that costs RM4 million, it will utilise 100% automatic labouring machine. The company is also in progress to set up a new GMP (Good Manufacturing Practice) factory to manufacture newly developed skin care and personal care series products that will cost RM14 million.
http
://m
mj.u
um.e
du.m
y
84
Case Study Company BCompany B was first established in 1986 by a local who had a keen interest in Malaysian herbal research and scientific analysis. In 1999, with the help of 13 graduates from Malaysian universities, the company started its first factory and Multi-Level Marketing (MLM) business. To date, the company is operating with 110 full-time workers to produce 67 products. The products are marketed in Malaysia, Indonesia, Singapore and Thailand. The company also intends to penetrate Middle East and Europe markets in the near future. Currently, the company owns three manufacturing plants in the northern states of Malaysia and 500 acres of herbal farms to provide sufficient herbal supplies. The manufacturing plants are estimated to be worth RM1.4 million with RM2.6 million modern facilities inside. In the production process, Company B uses mostly semi-automated machines in all manufacturing plants. However, due to the remarkable increase in demand for the company’s health drink, the company is planning to adopt 100% automatic labouring machine to one factor. The herbal drink has shown a tremendous increase of total sales of RM4 million a month from RM2 million a month before the drink was introduced.
In 1997, the company was recognised by the Malaysia Ministry of Health, with the Good Manufacturing Production (GMP) status. With this status, it is an assurance that the company could market its products to other countries. In 2006, Company B has introduced e-commerce in its business operations. The main objectives of e-commerce application are to facilitate the business operations between customers and company, and also for future strategy to penetrate the global market. E-commerce enables the company to exchange business information via email, facsimile transmission, and online funds transfer, which could increase the speed of business transactions.
Case Study Company CCompany C is one of the oldest Chinese traditional herbal medicine manufacturers in Malaysia. It was
established in 1936 and owned from generation to generation. The company is also known to be the largest traditional medicinal herb factory in Malaysia and has 63 permanent employees to manage the factory operation. Before the investment of new and advanced machines in 1999, the number of employees was almost 130. With more than 60 years of operation in Malaysia, the product of Company C has established a strong following among Malaysians and consumers from countries in South-East Asia and Hong Kong. The total products of Company C are 25 items consisting of traditional and over-the-counter (OTC) medicines. However, the main products were Chinese traditional medicine, which were made from imported Chinese herbs.
The herbal medicines of Company C are manufactured in accordance with the GMP standard set by the Malaysian Ministry of Health. Quality and safety are the highest priority in the manufacturing process. The raw materials are from selected high quality Chinese herbs and roots. Several tests and inspections were done in the company’s laboratory with new and advanced equipment.
However, in terms of production planning and control, the company did not apply any systematic planning such as MRP or JIT. As well as network communication, the company also did not use any computer networks such as LAN or Intranet, or even have a company website. The most recent technology investment was done in 1999, and due to internal management conflicts, the company did not have further technology planning or investment for the next three years. The strength of Company C was placed on its famous brand name and main product. The product reputation, its efficacy, and high quality of herbs and roots make the company one of the established herbal manufacturing companies in Malaysia.
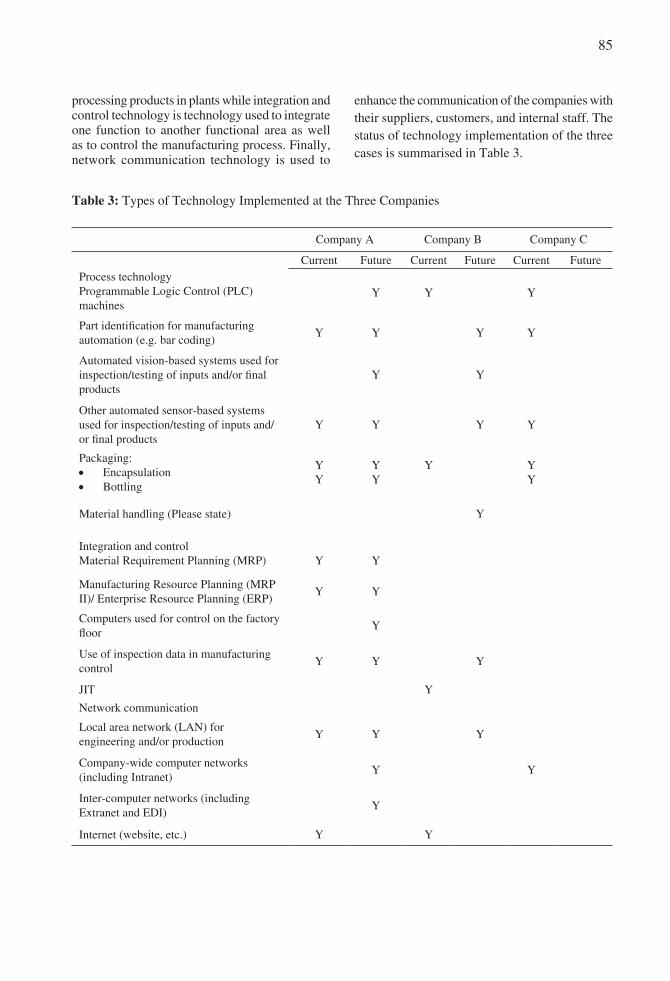
Results of the Case StudyFrom the plant tour and observation made by us, we could divide the technology used by the three case studies into three categories; the process technology, the integration and control technology, and finally, network communication technology. Process technology is technology applied for
http
://m
mj.u
um.e
du.m
y
85
processing products in plants while integration and control technology is technology used to integrate one function to another functional area as well as to control the manufacturing process. Finally, network communication technology is used to
enhance the communication of the companies with their suppliers, customers, and internal staff. The status of technology implementation of the three cases is summarised in Table 3.
Table 3: Types of Technology Implemented at the Three Companies
Company A Company B Company C
Process technologyProgrammable Logic Control (PLC) machines
Current Future Current Future Current Future
Y Y Y
Part identification for manufacturing automation (e.g. bar coding)
Y Y Y Y
Automated vision-based systems used for inspection/testing of inputs and/or final products
Y Y
Other automated sensor-based systems used for inspection/testing of inputs and/or final products
Y Y Y Y
Packaging:• Encapsulation• Bottling
YY
YY
Y YY
Material handling (Please state) Y
Integration and control Material Requirement Planning (MRP) Y Y
Manufacturing Resource Planning (MRP II)/ Enterprise Resource Planning (ERP)
Y Y
Computers used for control on the factory floor
Y
Use of inspection data in manufacturing control
Y Y Y
JIT Y
Network communication
Local area network (LAN) for engineering and/or production
Y Y Y
Company-wide computer networks (including Intranet)
Y Y
Inter-computer networks (including Extranet and EDI)
Y
Internet (website, etc.) Y Y
http
://m
mj.u
um.e
du.m
y
86
Currently, Company A uses process technology for part identification, an automated sensor based system used for inspection or testing of inputs and/or final products, and for packaging, encapsulation and bottling. Company B only implemented process technology for controlling process using the Programmable Logic Control (PLC) machines and for packaging purposes, encapsulatian. Next, the third company adopted process technology to control process, identify part, test and inspect inputs or final products, and handle material. Of all the three companies, Company A extensively used the process technology in its factory compared to the other two companies. In terms of integration and control technology, only two companies stated that they used technology for planning production, integrating with other functional areas in the companies, and to control inventory by using Just in Time method. Finally, for the network communication technology, all of the three companies utilised technologies to enhance their communication with their customers, suppliers, and internal employees. The visible difference from the three case studies was size of the companies determined their capability in adopting technology in the manufacturing plants.
DISCUSSION
The level of technology application in all three herbal manufacturing companies is mostly semi-automated. None of the case studies had utilised advanced manufacturing technology (AMT). However, most of the companies are going for AMT in the future. According to Khalil’s technology classification, the technology level in these firms can be grouped as appropriate technology since there is a good match between the technology utilised and the resources required for its optimal use (Khalil, 2000). These companies use more medium-level technology due to lack of necessary infrastructure and skilled personnel but are still able to meet local and overseas market demands. Quoted by Company C’s Quality Assurance Manager:
With the current technology, we still can afford to supply the customer demands. At the moment the capacity is not fully utilszed as we only operating one shift.
By utilising the appropriate level of technology, this will result in better use of labour resources and better production efficiency especially for manufacturing firms from developing countries (Khalil, 2000). Consistent with Nouri (1997), the technology level in Malaysian manufacturing firms are at their maturity stage. This is also applicable to local herbal manufacturing. One of the main reasons of less sophisticated technology applied by companies is the low labour cost (Nouri, 1997; Zhao & Co, 1997). Due to this low cost but highly motivated workforce, often it makes the economic justification of automation in newly industrialised countries difficult. The finding of low technology uptake by the interviewed companies is also consistent with Swamidass and Kotha (1998) who found a positive relationship between size of firms and the level of applied technology, especially AMT. The investigation showed that small plants usually lagged behind the larger plants in terms of technology usage. Despite the high benefits of technology implementation, a firm may still feel reluctant or unable to invest in improvement programmes and activities, and also new technology, especially for SMEs (Kennedy & Hyland, 2003). As for Company A, B, and C, even though these companies are very ambitious in their future plans and strategies, they have to admit the barriers that hinder them from applying the technology. The main obstacles mentioned by the interviewees were financial constraints due to costly and expensive equipment and outside technical support, and also insufficient skilled labour to improve the companies’ processes and systems.
Financial support is seemed to be the critical barrier in implementing new technology in these herbal manufacturing companies. Since all the corresponding companies are categorised
http
://m
mj.u
um.e
du.m
y
87
as SMEs, finance is a major issue. As mentioned by Kennedy and Hyland (2003), smaller firms usually lack the financial and human resources, which result in lower levels of adoption of more costly technologies.
Expensive technical support also hinder these companies from acquiring high and advanced technology. Since these companies lack employees with experience and necessary skills to implement some new technologies, technical support is very important. However, due to costly consultations and maintenance services, some of these companies had to postpone or reject the ideas of utilising new technology in the companies’ processes and systems. As a result, these companies are very dependent on staff knowledge and experiences, which will limit the success of technology implementation. As quoted by Company B’s R&D Manager:
At the moment, we get the advice and ideas from our exper ienced Produc t ion Manager and technicians. The outside consultations are too expensive and we can’t afford it.
Othe r t han t e chn i ca l suppo r t , management support is also crucial in technology implementation. SME managers know their products, markets and customers, and are often the ones who make the decision in technology implementation. As revealed by Company C’s Quality Assurance Manager, at the moment, the company has no immediate technology implementation plan due to management problems. All the planning and new ideas are being kept aside until the problem is solved. This statement shows that problems in management level will affect technology implementation decisions.
CONCLUSION
Generally, all the herbal manufacturing companies interviewed believed the positive impact of technologies in their respective
businesses especially in improving their productivity and product quality, and continue to improve the firms’ processes and systems. However, with all the constraints and obstacles in implementing fully integrated advanced technology, the aim of achieving high technology implementation level is still a long way to go. Before making any technology investment, Company A, B, and C need to consider several constraints. The main restrictions are (a) commitment from top management, (b) financial and human resources, (c) low wage rate that make hiring more workers seems more favourable than investing on high technology machines or equipment, and (d) risk in future demand.
REFERENCES
Abd. Aziz, R. (2003). Turning Malaysia into a global herbal producer: A personal perspective, Siri Syarahan Perdana Professor, Universi t i Teknologi Malaysia.
Abu, H. (2004, 25 April). Content in herbal market must rise, Multi Billion RM Herbal Business. Berita Harian.
Abu Kasim, Z. A. (2007) Herbal biotechnology development –The way forward & market access opportunities. Paper presented at EUM-BIO Business Partnering Seminar, MATRADE Exhibition and Conference Centre, Malaysia 25 October 2007.
Balwin, J., & Lin, Z. (2002). Impediments to advanced technology adoption for Canadian Manufacturers. Research Policy, 31, 1-18.
Eisenhardt, K. M. (1989). Building theories from case studies. Academy of Management Review, 14, 532-550.
Globadian, M. K., O’Regan, A., & Liu, J. (2000). Technology deployment in UK manufacturing SMEs, Manufacturing Information Systems, Proceedings of the Fourth SME International Conference, University of Coventry, Coventry (UK), April 2000.
http
://m
mj.u
um.e
du.m
y
88
Industry Canada (2004). Nutritional supplements, nutraceutical and herbal medicines, STAT_USA Market Research Reports, U.S & Foreign Commercial Service and U.S. Department of State. Retrieved September 9, 2004, from http://strategis.ic.gc.ca/epic/internet/inimr-ri.nsf/en/gr111702e.html
Jones, P., Beynon-Davies, P., & Geaves, M. (2003). Enterprises competencies for effective information systems and information management. Business Information Review, 20(3), 168-174.
Kennedy, J., & Hyland, P. (2003). A comparison of manufacturing technology adoption in SMEs and large companies. Paper presented at 16th Annual Conference of Small Enterprise Association of Australia and New Zealand, University of Ballarat, Australia, 28 September 1 October 2003.
Khalil, T. (2000). Management of technology: The key to competitive and wealth creation. New York:McGraw Hill.
Krajewski, L. J., & Ritzman, L. P. (1998). Operation management: Strategy and analysis, (5th ed.). Place: Addison-Wesley Publishing Company, 125-157.
MHC (2005). Malaysian Herbal Corporation Annual Report, Kuala Lumpur. Retrieved August 10, 2008 from http://www.malaysianherbal.com
Nouri, H. (1997).Implementing advanced manufactur ing technology: The perspective of a newly industrtialized country (Malaysia). Journal of High Technology Management Research, 8(1), 1-20.
NST Quarterly. (1998). Ionizing radiation an alternative method for sanitization of herbs and spices. NST online. Retrieved September 9, 2004, from http://www.mint. gov.my/paper/NST/1998/NST4-98.htm
Pharmabiz.com. (2004). Malaysian Market – Waiting in the winds, Chronicle Special. Retrieved February 9, 2005, from http://www.pharmabiz.com/article
Ramanathan, K. (1994). Polyprophic components o f m a n u f a c t u r i n g t e c h n o l o g y , Technological Forecast and Social Change, 46, 221-288.
Rouse, P. D. (2000). Technology adoption: The process, success factors and outcomes in a manufacturing environment, Term paper, St. Ambrose University. Retrieved September 29, 2004, from http://www.prouse.com/dba/910/term paper.htm
Sabourin, D., & Beckstead, D. (1999). Technology adoption in Canadian Manufacturing:Survey of Advanced Technology in Canadian Manufacturing 1998, Science, Innovation and Electronic Information Division, Statistics Canada.
Sambasivarao, K. V., & Deshmukh, S.G. (1995). Selection and implementation of advanced manufacturing technologies: Classification and literature review of issues, International Journal o f Opera t ions and Produc t ion Management,15(10), 43-62.
Swamidass, P.M., & Kotha, S. (1998). Explaining manufac tur ing technology use , firm size and performance using a multidimensional view of technology, Journal of Operations Management, 17, 23-37.
Tellis, W. (1997). Application of a case study methodology, The Qualitative Report, 3(3). Retrieved February 23, 2005. from http://www.nova.edu/sss/QR/QR3-3/tellis2.html
Walker, B., Bode, S., Burn, J., & Webster, B. (2003). Small business and the use of technology: Why the low uptakes? 16th Annual Conference of Small Enterprise Association of Australia and New Zealand, University of Ballarat, Australia, 28 September – 1 October 2003.
Zhao, H., & Co, H.C. (1997). Adoption and implementation of advanced manufacturing technology in Singapore. International Journal Production Economics, 48, 7-19.
http
://m
mj.u
um.e
du.m
y