the carotenoproteins of the starfish linckia laevigata (echinodermata: asteroidea): a resonance...
TRANSCRIPT
Comp. Biochem. PhysioL Vol. 95B, No. 4, pp. 847-853, 1990 0305-0491/90 $3.00 + 0.00 Printed in Great Britain © 1990 Pergamon Press pie
THE CAROTENOPROTEINS OF THE STARFISH LINCKIA LAEVIGATA (ECHINODERMATA: ASTEROIDEA): A
RESONANCE RAMAN AND CIRCULAR DICHROISM STUDY
R. J. H. CLARK,* G. A. RODLEY,* A. F. DRAKE,t R. A. CHURCH'~ and P. F. ZAGALSKY~ *Christopher Ingold Laboratories, University College London, 20 Gordon Street, London WC1H 0A J, UK; tDepartment of Chemistry, Birkbeck College, 20 Gordon Street, London WC1N 0H J, UK; and :~Royal Holloway and Bedford New College, (University of London), Egham Hill, Egham, Surrey
TW20 0EX, UK (Tel: 0784 434455; Fax: 0784 437520)
(Received 8 September 1989)
Abstract--1. The blue carotenoprotein, linckiacyanin (2rex 395 and 612 nm), and a yellow carotenoprotein (2ma x 403 nm) isolated from the skin of the starfish Linckia laevigata have been studied by resonance Raman and circular dichroism spectroscopy.
2. Resonance Raman spectroscopy has provided evidence that the 400 and 600 nm absorption bands of linckiacyanin arise from two distinct types of carotenoid binding sites.
3. Circular dichroism and resonance Raman spectral analysis support a chromophore exciton interaction mechanism as the origin of the 400 nm absorption band of linckiacyanin and yellow protein.
4. Alterations in the absorption and circular dichroism spectra of linckiacyanin on heating suggest that the chromophore interaction responsible for the 400 nm absorption band is related to the quaternary helical structure of the protein.
INTRODUCTION
Two carotenoproteins have been isolated from the skin of the Royal blue starfish, Linckia laevigata: a blue carotenoprotein, linekiacyanin, 2~x 395 and 612 nm, and a yellow carotenoprotein, 2max 403 nm (Zagalsky et al., 1989).
The predominant carotenoprotein, linckiacyanin, is large, polydisperse and, in electron micrographs, shows an unusual right-handed helical quaternary protein structure (Fig. 1). Evidence has been pre- sented for a similar helical arrangement of the pig- ment protein complexes of chloroplast thylakoid membranes (Garab et al., 1988). Astaxanthin and lesser amounts of the aromatic carotenoid hydroxy- clathriaxanthin are the main carotenoid components of the carotenoprotein, with several hundred carotenoid molecules bound to each linckiacyanin molecule. The absorption spectrum of the carotenoprotein is unusual, not only in having a 2ma x considerably shorter than that of the free carotenoids, but also in the variability of the visible absorption spectrum as judged by the ratio of absorptions £612/395 for separate preparations of the carotenoprotein and for differently sized fractions within a single prepara- tion.
The yellow carotenoprotein, similar in absorption spectum to the yellow astaxanthin-protein of lobster carapace (Buchwald and Jencks, 1968a), has the same complement of carotenoids as linckiacyanin with a hundred or so carotenoids bound per molecule.
Resonance Raman (RR) spectroscopy has been effectively employed to probe the carotenoid-binding sites of several carotenoproteins (Salares et al., 1977a, 1979; Clark et al., 1980; Carey and Salares, 1980;
Zagalsky et al., 1983a,b; Britton et al., 1982 and Merlin, 1987). Thus the 460 and 640 nm absorption bands of the green carotenoprotein, ovoverdin, of lobster eggs have been ascribed to electronic transi- tions at two distinct carotenoid-binding sites on the basis of the dissimilar RR spectra obtained with excitation wavelengths of 488.0 and 647.1 nm. A distinction has also been made using RR and circular dichroism spectroscopy between exciton interaction of the carotenoid chromophores and the presence of cis carotenoids as regards the origin of the absorption band in the 370--400 nm region of some yellow and blue invertebrate carotenoproteins (Buchwald and Jencks, 1968a,b; Salares et al., 1977a,b; Zagalsky et al., 1983a,b).
The present study utilises both resonance Raman and circular dichroism (CD) spectroscopy to investi- gate the nature of the 400 and 600 nm absorption bands of the Linckia carotenoproteins.
MATERIALS AND METHODS
The starfish Linckia laevigata were collected on the Great Barrier Reef, Australia and freeze-dried for transportation. Linckiacyanin and yellow carotenoprotein were extracted from the skin and purified as described in an earlier publication (Zagalsky et al., 1989). Two separate prepara- tions of linckiacyanin with values for ~612/395 of 2.6 and 1.6, respectively, were studied using RR spectroscopy. Several preparations, of variable E6~2/m ratio, were investigated using CD spectroscopy.
Resonance Raman spectra
Raman spectra were recorded at room temperature on a Spex 14018(R6) spectrophotometer with 1800 line mm -I gratings (Jobin Yvon holographic). Coherent Radiation
847

848 R . J .H . CLARK et al.
Fig. 1. Electron micrograph of linckiacyanin (taken from Zagalsky et al., 1989).
Models CR 3000K and CR 500K Kr ÷ lasers and a model 590 dye laser provided the exciting lines. Detection was by photon counting using a cooled RCA C31034 photomulti- plier. The spectrometer was calibrated using the emission spectrum of neon. Sharp peaks are accurate to +__ 1 cm ~. Laser powers were generally kept to below 50 mW in order to prevent thermal decomposition of the samples. The spectral slit width was 1.5 cm t in all cases except one (in which it was 2cm -~). Protein samples were studied in 20mM Tris-HCl, pH 6.9. A small amount of hydroxy- clathriaxanthin purified by HPLC was provided by Prof. S. Liaaen-Jensen, Organic Chemistry Laboratories, University of Trondheim, Trondheim, Norway, for RR study. Its spectrum was recorded in acetone and acetone/methylene chloride solutions.
Electronic spectroscopy
Electronic absorption spectra were recorded with a Varian 2390 fitted with a thermostatted cell holder and a thermocouple probe inserted directly into the solution. CD spectra were similarly measured with JASCO J40 CS Spec- tropolarimeter in either the UV/Vis or near IR mode. Solutions of carotenoproteins were diluted with the appro- priate buffer to ensure that the strongest electronic ab- sorbance was in the range 1.5 2.0, Both CD and absorbance data were reduced to represent solutions of absorbance 1.0 at room temperature in a 1.0 cm cell at 612 nm. Figure 4 has been produced in terms of wavenumbers for spectroscopic analysis. Figures 5 and 6 are in the usual measurement units, nanometers. CD spectra are reported in absorbance units (A L - Aa), in line with impending IUPAC recommenda- tions with the relationship: ellipticity, 0 = AA. 33000.
RESULTS
Resonance R a m a n spectra
A range of exciting lines was used (406.7, 457.9, 488.0, 496.5, 514.5, 568.2, 600 and 626nm) in order to cover the main absorpt ion bands of the
carotenoproteins and the regions between them (Fig. 2).
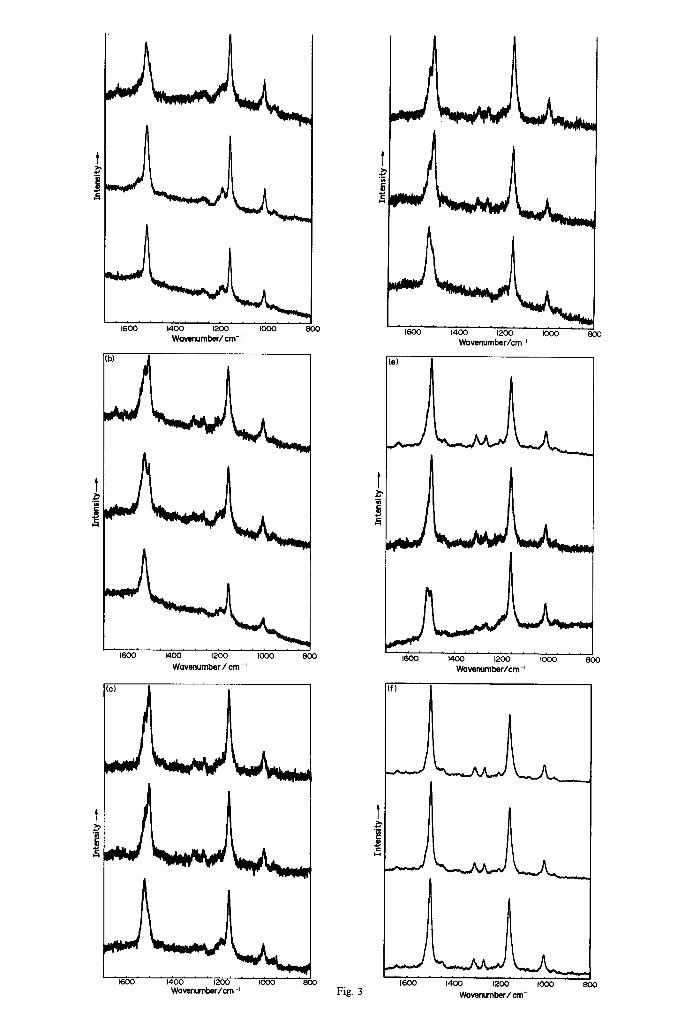
The main features of the RR spectra are the characteristic v~, v 2 and v 3 bands (Rimai et al., 1973) at ca 1500, 1155 and 1005cm -~, respectively (Fig. 3 a-f) . The wavenumbers of v 2 ( C - - C and C------C stretch with C - - H bend) and v3 ( C - - M e stretch) remain
89
, / - _ . .
0.6
03
0 ; t ,880;E .... 1 f ;
408.7 487.8 488.5 568 600 628 Excitation Wavelength (nm)
. . . . ;8 E;O 638 7;0 W a v e l e n g t h / nm
Fig. 2. Absorption spectra of linckiacyanin and yellow carotenoprotein and positions of resonance Raman exciting lines (arrows). Linckiacyanin E612/395 = 2.6, ; linckia-
c y a n i n E612/395, -- --; yellow carotenoprotein,. . . . . .
Fig. 3. Resonance Raman spectra for linckiacyanin E612/395 = 2.6 (top), linckiacyanin •612/395 = 1.6 (middle) and yellow protein (bottom) using different laser excitation wavelengths: (a) 406.7 nm, (b) 457.9 nm, (c) 488.0 nm, (d) 496.5 nm, (e) 514.5 nm
and (f) 600 nm.
1600 1400 1200 I000 800 Wovenumber/cm -I
1600 1400 1200 tO00 800
Wavenumber / cm -~
~600 1400 1200 I000 800 Wavenumber/cm -~ Fig. 3
t
1600 1400 {200 I000 Wavenumber/cm -~
1600 ~ i200 IO00 800 Wavenumber/cm-~
1600 1400 1200 IO00 800
Wovenumber/cm -~
850 R.J.H. CLARK et al.
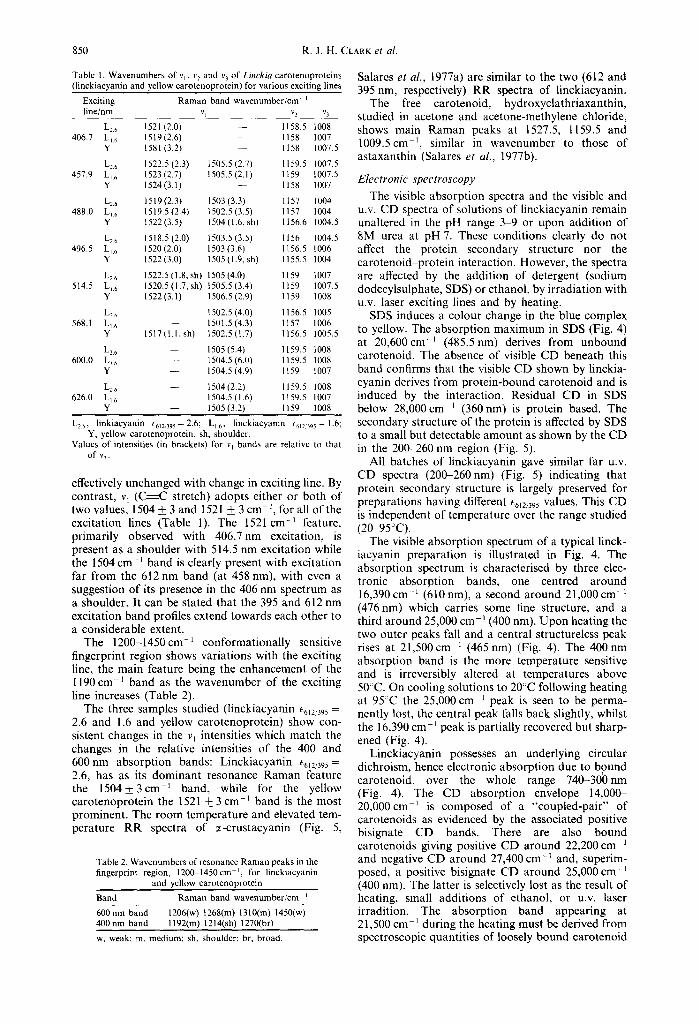
Table 1. Wavenumbers of v~, v 2 and v 3 of L i n c k i a carotenoproteins (linckiacyanin and yellow carotenoprotein) for various exciting lines
Exciting Raman band wavenumber/cm line/nm v~ v 2 v 3
L26 1521 (2.0) - - 1158.5 1008 406.7 LI6 1519(2.6) - - 1158 1007
Y 1581 (3.2) - - 1158 1007.5
L26 1522.5(2.3) 1505.5(2.7) 1159.5 1007.5 457.9 LI6 1523(2.7) 1505.5(2.1) 1159 1007.5
Y 1524(3.1) - - 1158 1007
L2. 6 1519(2.3) 1503(3.3) 1157 1004 488.0 L~ 6 1519.5 (2.4) 1502.5 (3.5) 1157 1004
Y 1522(3.5) 1504 (1.6, sh) 1156.6 1004.5
L26 1518.5(2.0) 1503.5(3.5) 1156 1004.5 496.5 L~6 1520(2.0) 1503(3.6) 1156.5 1006
Y 1522(3.0) 1505 (1.9, sh) 1155.5 1004
L26 1522.5 (1.8, sh) 1505 (4.0) 1159 1007 514.5 L~6 1520.5(I.7, sh) t505.5(3.4) 1159 1007.5
Y 1522(3.1) 1506.5(2.9) 1159 1008
L26 1502.5 (4.0) 1156.5 1005 568.1 LI6 - - 1501.5 (4.3) 1157 1006
Y 1517 (I.1, sh) 1502.5(1.7) 1156.5 1005.5
Lz6 - - 1505(5.4) 1159.5 1008 600.0 L~o - - 1504.5(6.0) 1159.5 1008
Y - - 1504.5(4.9) 1159 1007
L26 - - 1504(2.2) 1159.5 1008 626.0 L~6 1504.5(1.6) 1159.5 1007
Y - - 1505(3.2) 1159 1008
Lz6, linkiacyanin E612/39s=2.6; Lt6, linckiacyanin ~6,z395= 1.6; Y, yellow carotenoprotein, sh, shoulder.
Values of intensities (in brackets) for v, bands are relative to that of v 3 .
effectively unchanged with change in exciting line. By contrast, v~ (C-----C stretch) adopts either or both of two values, 1504 ± 3 and 1521 + 3 cm -~, for all of the excitation lines (Table 1). The 1521 cm- ' feature, primarily observed with 406.7nm excitation, is present as a shoulder with 514.5 nm excitation while the 1504 cm-1 band is clearly present with excitation far from the 612 nm band (at 458 nm), with even a suggestion of its presence in the 406 nm spectrum as a shoulder. It can be stated that the 395 and 612 nm excitation band profiles extend towards each other to a considerable extent.
The 1200-1450cm -I conformationally sensitive fingerprint region shows variations with the exciting line, the main feature being the enhancement of the 1190 cm -z band as the wavenumber of the exciting line increases (Table 2).
The three samples studied (linckiacyanin E612/395 =
2.6 and 1.6 and yellow carotenoprotein) show con- sistent changes in the Vl intensities which match the changes in the relative intensities of the 400 and 600nm absorption bands: Linckiacyanin E612/395 =
2.6, has as its dominant resonance Raman feature the 1504+ 3cm -~ band, while for the yellow carotenoprotein the 1521 ± 3 cm -~ band is the most prominent. The room temperature and elevated tem- perature RR spectra of ~-crustacyanin (Fig. 5,
Table 2. Wavenumbers of resonance Raman peaks in the fingerprint region, 1200-1450cm ', for linckiacyanin
and yellow carotenoprotein
Band Raman band wavenumber/cm '
600nm band 1206(w) 1268(m) 1310(m) 1450(w) 400nm band 1192(m) 1214(sh) 1270(br)
w, weak; m, medium; sh, shoulder; br, broad.
Salares et al., 1977a) are similar to the two (612 and 395 nm, respectively) RR spectra of linckiacyanin.
The free carotenoid, hydroxyclathriaxanthin, studied in acetone and acetone-methylene chloride, shows main Raman peaks at 1527.5, 1159.5 and 1009.5cm -~, similar in wavenumber to those of astaxanthin (Salares et al., 1977b).
Electronic spectroscopy
The visible absorption spectra and the visible and u.v. CD spectra of solutions of linckiacyanin remain unaltered in the pH range 3-9 or upon addition of 8M urea at pH 7. These conditions clearly do not affect the protein secondary structure nor the carotenoid-protein interaction. However, the spectra are affected by the addition of detergent (sodium dodecylsulphate, SDS) or ethanol, by irradiation with u.v. laser exciting lines and by heating.
SDS induces a colour change in the blue complex to yellow. The absorption maximum in SDS (Fig. 4) at 20,600cm -~ (485.5nm) derives from unbound carotenoid. The absence of visible CD beneath this band confirms that the visible CD shown by linckia- cyanin derives from protein-bound carotenoid and is induced by the interaction. Residual CD in SDS below 28,000cm ' (360nm) is protein based. The secondary structure of the protein is affected by SDS to a small but detectable amount as shown by the CD in the 200-260 nm region (Fig. 5).
All batches of linckiacyanin gave similar far u.v. CD spectra (200-260 nm) (Fig. 5) indicating that protein secondary structure is largely preserved for preparations having different ~6~2/395 values. This CD is independent of temperature over the range studied (20 95°C).
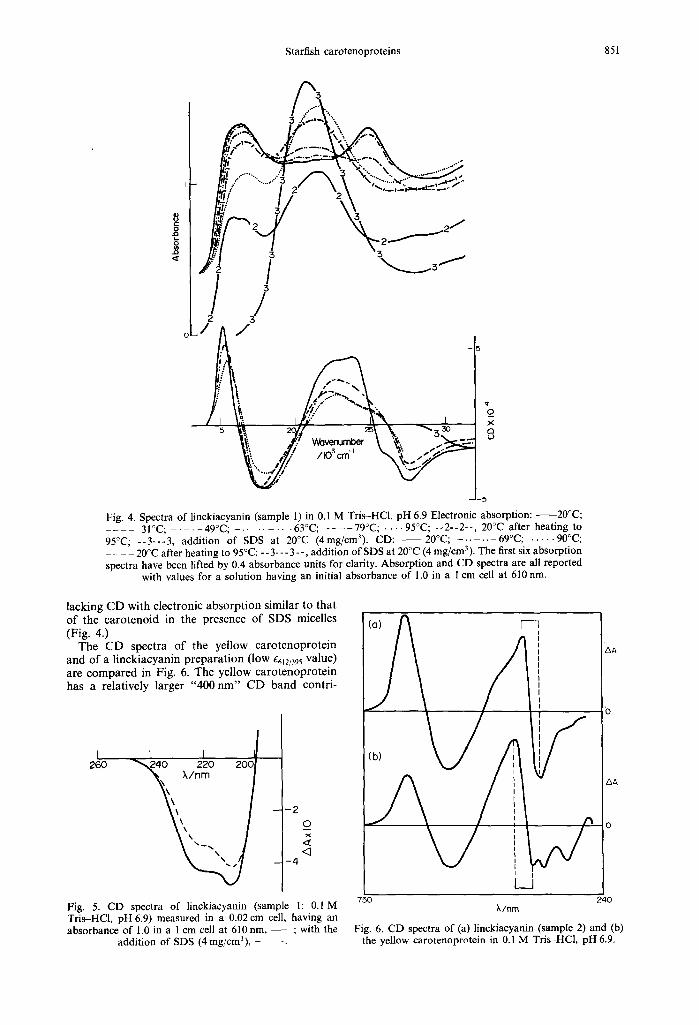
The visible absorption spectrum of a typical linck- iacyanin preparation is illustrated in Fig. 4. The absorption spectrum is characterised by three elec- tronic absorption bands, one centred around 16,390 c m ~ (610 nm), a second around 21,000 cm -~ (476 nm) which carries some fine structure, and a third around 25,000 cm ~ (400 nm). Upon heating the two outer peaks fall and a central structureless peak rises at 21,500 cm ~ (465 nm) (Fig. 4). The 400 nm absorption band is the more temperature sensitive and is irreversibly altered at temperatures above 50:'C. On cooling solutions to 20°C following heating at 95:'C the 25,000 cm 1 peak is seen to be perma- nently lost, the central peak falls back slightly, whilst the 16,390 cm I peak is partially recovered but sharp- ened (Fig. 4).
Linckiacyanin possesses an underlying circular dichroism, hence electronic absorption due to bound carotenoid, over the whole range 740-300nm (Fig. 4). The CD absorption envelope 14,000- 20,000 cm ~ is composed of a "coupled-pair" of carotenoids as evidenced by the associated positive bisignate CD bands. There are also bound carotenoids giving positive CD around 22,200 cm and negative CD around 27,400 cm- ' and, superim- posed, a positive bisignate CD around 25,000 cm- ' (400 nm). The latter is selectively lost as the result of heating, small additions of ethanol, or u.v. laser irradition. The absorption band appearing at 21,500 cm ~ during the heating must be derived from spectroscopic quantities of loosely bound carotenoid
Starfish carotenoproteins 851
2 3
) ? : ' " /103 c m - ~ , , , , . . - . 7 ,
j I"'.-//..;
-5
Fig. 4. Spectra of linckiacyanin (sample I) in 0.1 M Tris-HCl, pH 6.9 Electronic absorption: - 20°0; . . . . 31 °C; . . . . . 49°C; . . . . . . . . . 63°C; . . . . 79°C; . . . . 95°C; -- 2-- 2--, 20°C after heating to 95°C; - -3-- -3 , addition of SDS at 20°C (4mg/cm3). CD: 20°C; . . . . . . 69°C; . . . . . 90°C; . . . . 20°C after heating to 95 °C; - - 3- -- 3 - -, addition of SDS at 20°C (4 mg/cm 3). The first six absorption spectra have been lifted by 0.4 absorbance units for clarity. Absorption and CD spectra are all reported
with values for a solution having an initial absorbance of 1.0 in a I cm cell at 610 nm.
lacking C D wi th e lec t ronic a b s o r p t i o n s imilar to tha t o f the c a r o t e n o i d in the presence o f SDS micelles (Fig. 4.)
The C D spec t ra o f the yellow c a r o t e n o p r o t e i n and o f a l inckiacyanin p r e p a r a t i o n ( low ¢(612/395 value) are c o m p a r e d in Fig. 6. The yel low c a r o t e n o p r o t e i n has a relat ively larger "400 n m " C D b a n d contr i -
, J ,g --,24o ,,,,~° ~oo I
\ ' - - , I
- 2 O
<] - 4
Fig. 5. CD spectra of linckiacyanin (sample h 0.1 M Tris-HC1, pH 6.9) measured in a 0.02 cm cell, having an absorbance of 1.0 in a 1 cm cell at 610 nm, ; with the
addition of SDS (4 mg/cm3), - - -
:ia) A
M ,/ ' . ) \ /
zv/ / I
k/ Z I
i I
• L__i
~A
0
Z~A
750 240 X/nrn
Fig. 6. CD spectra of (a) linckiacyanin (sample 2) and (b) the yellow carotenoprotein in 0.1 M Tris-HC1, pH 6.9.

852 R, J. H. CLARK et al.
bution, slightly red shifted with respect to that of linckiacyanin, and shows the underlying CD peak at 363.5 nm which remains after solutions of linckia- cyanin have been heated. The exciton components giving rise to the 25,000cm -~ bisignate CD are indicated in Fig. 6.
DISCUSSION
The resonance Raman results clearly show that the linear relationship between v I and 1/~max (Rimai et al., 1973; Salares et al., 1979; Clark et al., 1980) does not hold for the 395 nm absorption band of linckiacyanin and the 403 nm band of the yellow carotenoprotein. A significantly higher value for vt than that observed (1521 + 3 cm -1) would have been expected on this basis. Taken together with the splitting in the CD spectra about these bands this strongly indicates that the large blue shift is associated with a pronounced exciton interaction of the carotenoid chromophores (Salares et al. 1977a,b). The lack of splitting and structure of bands due to v 2 and v 3 and absence of strongly enhanced bands below 1000cm -~ due to C - - H out-of-plane bends verifies that the 400 nm band, for each protein, does not arise from the presence of cis (or sterically twisted) isomers of the carotenoids (see discussion for A r t e m i a canthaxan- thin-lipovitellin, Zagalsky et al., 1983a). The selective loss of the 400 nm absorption band on lowering the dielectric constant of solutions of the carotenoprotein by the addition of ethanol (Zagalsky et al., 1989) is supportive evidence for the presence of carotenoid chromophore interaction.
In the case of the broader red-shifted 612nm absorption band of linckiacyanin the situation is less straightforward. The observed v I value of 1504+ 3 cm -1 is somewhat greater than might have been expected (ca 1497cm -1) on the basis of the vl vs 1/).ma x plot for other astaxanthin-proteins (Clark et al., 1980). The splitting in the CD spectrum about the absorption band indicates that the higher value of v~ most likely results from a weak exciton interaction between carotenoid chromophores.
The difference between the vc_--c values for the 395 and 612nm absorption bands of linckiacyanin and the constancy of these with changed exciting lines implies the presence of two specifically different carotenoid binding sites; the 400nm absorption band would thus originate from exciton interaction between carotenoids in type I sites and the 600 nm absorption band mainly from carotenoid-protein polarization effects from carotenoids in type II sites. The second site would apparently need to be some- what removed from the one involving stacking so as not to interfere with that feature. The results for the two linckiacyanin samples, in particular, indicate that the two sites have independent existence. Nonethe- less, there does seem to be some interaction or inter- relationship between the sites as judged by the way in which the vc___c features of the two ('612' and '395') types persist over such a wide range of excitation line wavenumbers (see Fig. 3 and Table 1).
The possibility that the 400 nm site is occupied only by hydroxyclathriaxanthin would seem unlikely; the estimated ratios of the two carotenoids (astaxanthin and hydroxyclathriaxanthin) concentrations do not
closely match the relative intensities of the electronic absorption bands and the ability of astaxanthin to form protein-bound aggregates is well known (Buch- wald and Jencks, 1968a,b; Salares et al., 1977a,b). It is not inconsistent that a higher proportion of the aromatic carotenoid would enhance exciton interac- tion of carotenoids in type I sites through the greater stability of aromatic ring/aromatic ring or aromatic ring/fl-ionone ring interactions. Both carotenoids have the same number of C-----C bands and would not be expected to give different Vc__= c values for the two sites if attached to the sites in the same manner.
It is of interest to note that the two types of RR spectra (for the 400 and 600 nm absorption bands) obtained here closely resemble those independently observed for either blue or yellow astaxanthin- proteins. In the case of linckiacyanin the two spectral types are observed for the same protein. Besides differences between the values of vl, the RR spectra obtained with 395 and 612 nm excitation also have differences in the 1200-1450cm -j region (Table 2). The 395 nm spectrum is closely similar to that ob- served for the yellow lobster astaxanthin-protein with 400 nm excitation (Fig. 5 of Salares et al., 1979a: vl near 1520cm-' and peaks at 1190 and 1275cm 1). The 612 nm spectrum resembles that of the blue lobster carapace pigment, crustacyanin, with 650 nm excitation (Fig. 4 of Salares et al., 1977a: v, near 1500cm -1, twin peaks at 1300 and 1260cm ~ and a peak at 1210cm-~).
Electron micrographs clearly show an overall heli- cal structure for linckiacyanin (Fig. 1 and Zagalsky et al., 1989). The general simplicity of the RR spectral results (.Fig. 3) suggests a regular arrangement of the carotenoids within the protein. These features are consistent with stacking of carotenoids in a helical manner that could be the basis of the 395 nm exciton band. This interpretation is suppcwted by the selective loss of this absorption band and of the bisignate CD around 2500 cm-I on heating, without evident mod- ification in protein secondary structure as seen in the unaltered u.v. CD spectrum. Linckiacyanin remains polymeric on heating and does not dissociate into subunits. It is suggested that it is the alteration of the quaternary structure of the protein (loss of helical structure) by heat denaturation that disrupts the stacking of carotenoids in type I sites; the carotenoids then become loosely attached to the protein (~'max 465 nm, zero CD). Preparations of linckiacyanin with high values for •612/395 may likewise contain more loosely wound helical structures which have lost some of the exciton interaction typical of the yellow carotenoprotein. The remaining heat-stable CD over the 740-300 nm range originates from more firmly held carotenoid in type II sites located within the subunit structure (Zagalsky et al., 1989) of the carotenoprotein.
In the case of the yellow carotenoprotein, electron microscopy studies have failed to reveal the quater- nary structure; another, non-helical protein configu- ration may stabilise stacking of the chromophore units.
Acknowledgements-42ollection of most of the biological material was kindly arranged by Dr Mary Garson, Sir
Starfish carotenoproteins 853
George Fischer Centre for Tropical Marine Studies, James Cook University, Townsville, Australia. The authors are grateful to Professor S. Liaaen-Jensen, Organic Chemistry Laboratories, University of Trondheim, Trondheim, Nor- way for providing both the animals and purified hydroxy- clathriaxanthin for the present study.
REFERENCES
Britton G., Armitt G. M., Lau S. Y. M., Patel A. K. and Shone C. C. (1982) Carotenoproteins. In Carotenoid Chemistry and Biochemistry (Edited by Britton G. and Goodwin T. W), pp. 237-251. Pergamon Press, Oxford.
Buchwald M. and Jencks W. P. (1968a) Properties of the crustacyanins and the yellow lobster shell pigment. Biochemistry 7, 844-859.
Buchwald M. and Jencks W. P. (1968b) Optical properties of astaxanthin solutions and aggregates. Biochemistry 7, 834-843.
Carey P. R. and Salares V. R. (1980) Raman and resonance Raman studies of biological systems. In Advances in Infrared and Raman Spectroscopy (Edited by Clark R. J. H. and Hester R. E.), Vol 7, pp. 1-58. Heyden, London.
Clark R. J. H., D'Urso N. R. and Zagalsky P. F. (1980) Excitation profiles, absorption and resonance Raman spectra of the carotenoprotein ovorubin, and a resonance Raman study of some other astaxanthin proteins. J. Am. chem. Soc. 102, 6693-6698.
Garab G., Wells S., Finzi L. and Bustamante C. (1988) Helically organised macroaggregates of pigment-protein complexes in chloroplasts; evidence from circular intensity differential scattering. Biochemistry 27, 5839-5843.
Merlin J. C. (1987) Resonance Raman analysis of astaxan- thin-protein complexes. J. Raman Spectrosc. 18, 519-523.
Rimai L., Heyde M. E. and Gill D. (1973) Vibrational spectra of some carotenoids and related linear polyenes. A Raman spectroscopic study. 3. Am. chem. Soc. 95, 4493-4501.
Salares V. R., Young N. M., Carey P. R. and Bernstein H. J. (1977a) Excited state (exciton) interactions in polyene aggregates. Resonance Raman and absorption spectroscopic evidence. J. Raman Spectrosc. 6, 282-288.
Salares V. R., Young N. M., Bernstein H. J. and Carey P. R. (1977b) Resonance Raman spectra of lobster shell carotenoproteins and a model astaxanthin aggregate. A possible photobiological function for the yellow protein. Biochemistry 16, 4751-4756.
Salares V. R. Young, N. M., Bernstein H. J. and Carey P. R. (1979) Mechanisms of spectral shifts in lobster carotenoproteins; the resonance Raman spectra of ovoverdin and the crustacyanins. Biochem. biophys. Acta 576, 176-191.
Zagalsky P. F., Gilchrist B. M., Clark R. J. H. and Fairclough D. P. (1983a) The canthaxanthin-lipovitellin of the brine shrimp, Artemia (Crustacea, Anostraca): a resonance Raman and circular dichroism study. Comp. Biochem. Physiol. 74B, 647-652.
Zagalsky P. F., Gilchrist B. M., Clark R. J. H. and Fairclough D. P. (1983b) The canthaxanthin-lipovitellin of Branchipus stagnalis (L.) (Crustacea, Anostraca): a resonance Raman and circular dichroism study. Comp. Biochem. Physiol. 75B, 163-167.
Zagalsky P. F., Haxo F., Hertzberg S. and Liaaen-Jensen S. (1989) Studies on a blue carotenoprotein, linckiacyanin, isolated from the starfish Linckia laevigata, (Echinoder- mata, Asteroidea). Comp. Biochem. Physiol. 93B, 339-353.