the canvas program (canagliflozin cardiovascular ... · cardiovascular adjudication committee . g....
TRANSCRIPT

The CANVAS Program (CANagliflozin cardioVascular Assessment Study)

The CANVAS Program Introduction
David R. Matthews, FRCP, DPhil

Photography Prohibited
• Please do not take photos during this presentation per ADA guidelines
• Slides will be available upon conclusion of this presentation at www.georgeinstitute.org

Support
• The CANVAS Program was supported by Janssen Research & Development, LLC

Presentation Outline
• Background Greg Fulcher
• Design and Methods Kenneth W. Mahaffey
• Effects on CV Outcomes Bruce Neal
• Effects on Renal Outcomes Dick de Zeeuw
• Effects on Safety Outcomes Vlado Perkovic
• Implications for Clinical Practice David R. Matthews
• Independent Commentary Clifford J. Bailey

The CANVAS Program Background
Greg Fulcher, MD
Presenter Disclosures: Greg Fulcher, MD
• Research support – Novo Nordisk
• Advisory boards – Janssen, Novo Nordisk, Boehringer Ingelheim, MSD
• Consultant – Janssen, Novo Nordisk, Boehringer Ingelheim, MSD

Petersen C. Annales Academie Science Francaise. 1835;15:178.
In 1835, French Chemists Isolated Phlorizin From the Bark of the Apple Tree
“Few can foresee whither their road will lead them, till they come to its end” J.R.R. Tolkien

Normal Renal Glucose Metabolism
SGLT2 ~90%
Glucose
SGLT1 ~10%
No glucose
Adapted from Bays H. Curr Med Res Opin. 2009;25(3):671-681.
S1 segment of proximal
tubule
Distal S2/S3
segment of proximal tubule
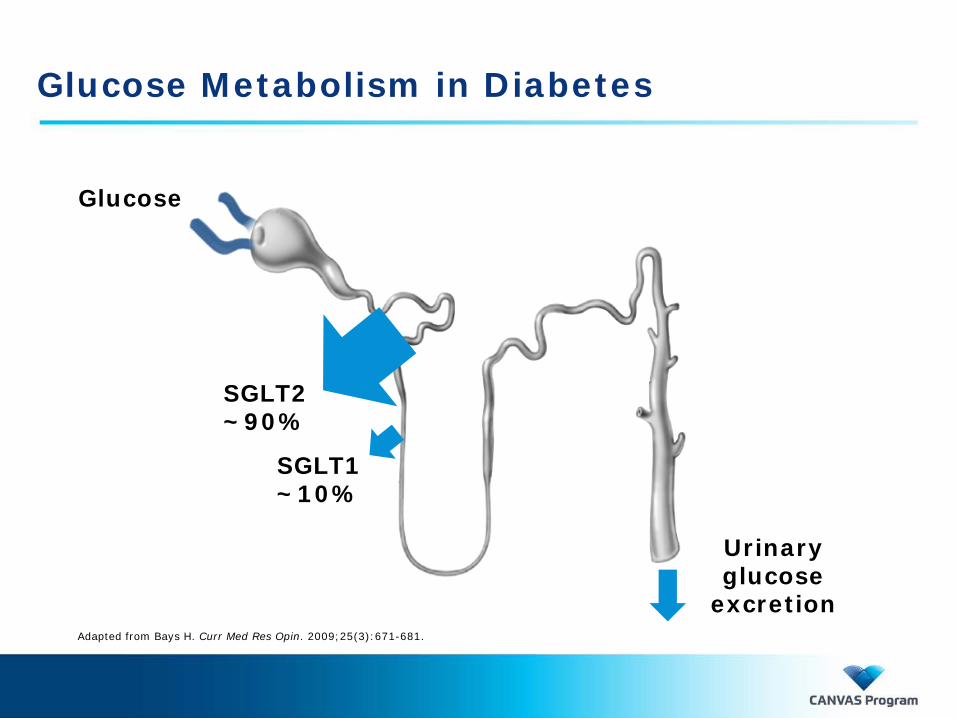
Glucose Metabolism in Diabetes
SGLT2 ~90%
Glucose
SGLT1 ~10%
Urinary glucose
excretion Adapted from Bays H. Curr Med Res Opin. 2009;25(3):671-681.

Inhibition of Renal Glucose Reabsorption
Adapted from Bays H. Curr Med Res Opin. 2009;25(3):671-681.
SGLT2 inhibitors
Less glucose reabsorbed
Increased urinary glucose
excretion
RTG*~180 mg/dL
0
25
50
75
100
125
0 50 100 150 200 250 300
Urin
ary
Glu
cose
Exc
retio
n
(g/d
ay)
Plasma glucose (mg/dL)
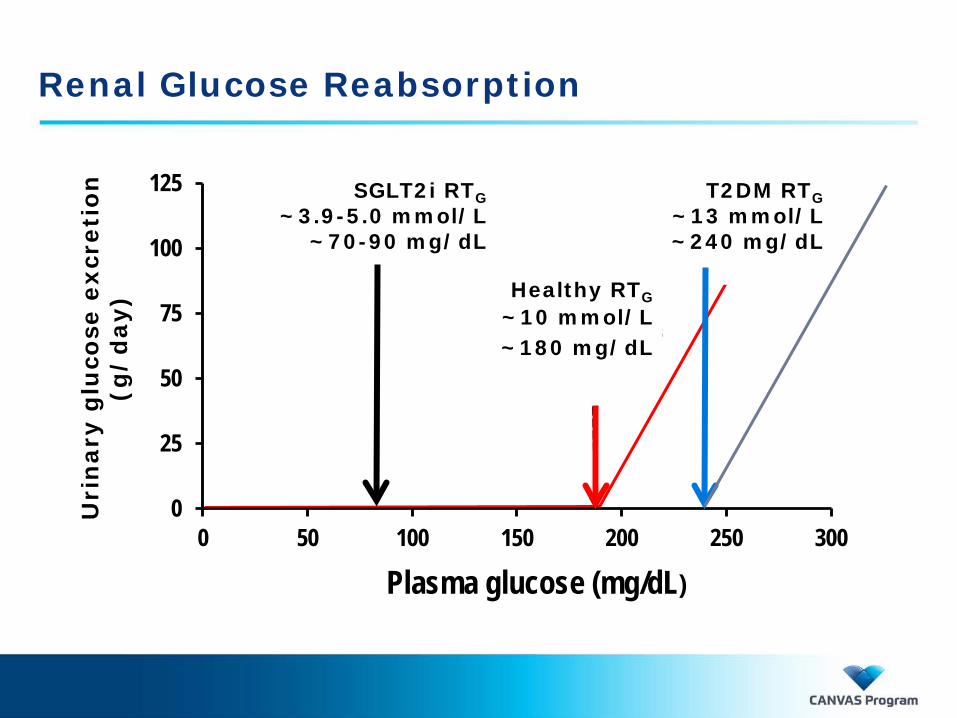
Renal Glucose Reabsorption
Healthy Subjects RTG
*~10.0 mmol/L (~180 mg/dL)
Uri
nar
y g
luco
se e
xcre
tion
(g
/day
)
T2DM RTG ~13 mmol/L ~240 mg/dL
Healthy RTG
~10 mmol/L ~180 mg/dL
SGLT2i RTG ~3.9-5.0 mmol/L
~70-90 mg/dL

SGLT2 Inhibition
SGLT2 inhibitors
Urinary glucose
excretion
CV Risk Factor Reduction
• Lowers blood glucose levels
• Lowers BP via osmotic diuresis
• Increases urinary caloric loss with reductions in body weight
• Reduces albuminuria possibly due to alterations in tubuloglomerular feedback
Less glucose reabsorbed

SGLT2
Glucose Reabsorption From the Glomerular Filtrate Through a Proximal Tubule Epithelial Cell Into the Blood
Bakris GI, et al. Kidney Int. 2009;75(12):1272-1277.

Potential Role of SGLT2 Inhibition in Renoprotection
⬇ Proximal tubular sodium and glucose absorption and albumin
SGLT2 inhibition
⬇ Proximal tubular fractional reabsorption of sodium
Activation of TGF
⬇ Hyperfiltration injury
⬇ Glucose-mediated
inflammation and fibrosis
⬇ Proximal tubular
hypertrophy and hyperplasia
⬇ Progression of CKD
⬇ Proximal tubular cell glucotoxicity and albuminuria
Adapted from Komala MG, et al. Curr Opin Nephrol Hypertens 2013;22:113–119.

Regulatory Requirements
European Medicines Agency (EMA) and US Food and Drug Administration (FDA): Need for CV Outcomes Studies • ‘Demonstrate that a new anti-
diabetic therapy is not associated with unacceptable increase in cardiovascular risk’
EMA. 2012. http://www.ema.europa.eu/ema/index.jsp?curl=pages/includes/document/document_detail.jsp?webContentId=WC500129256&mid=WC0b01ac058009a3dc. FDA. 2008. http://www.fda.gov/downloads/Drugs/GuidanceComplianceRegulatoryInformation/Guidances/ucm071627.pdf

FDA Criteria for Assessing CV Risk
2.2
HR 1.8 HR 1.3
0.4 0.6 0.8 1.0 1.2 1.4 1.6 1.8 2.0 HR
Superiority
Noninferiority Post-Approval
Noninferiority Pre-Approval
Hirshberg & Raz. Diabetes Obes Metab 2011; 34 (Suppl. 2): S101–6
Adequately powered for noninferiority

Canagliflozin
• Orally-active, selective SGLT2 inhibitor
• Half-life of 11 to 13 hours (once-daily dosing)
• Balanced renal and biliary excretion
• Glucuronidation is a major metabolic pathway – No active metabolites
• Approved doses 100 mg and 300 mg
The CANVAS Program Design and Methods
Kenneth W. Mahaffey, MD

Presenter Disclosures: Kenneth W. Mahaffey, MD
• Research support – Afferent, Amgen, AstraZeneca, Daiichi, Ferring, Google (Verily),
Janssen, Medtronic, Merck, Novartis, Sanofi, St. Jude
• Consultant (including CME) – Ablynx, AstraZeneca, BAROnova, Bio2 Medical, Boehringer
Ingelheim, Bristol Myers Squibb, Cardiometabolic Health Congress, Cubist, Eli Lilly, Elsevier, Epson, GlaxoSmithKline, Janssen, Merck, Mt. Sinai, Myokardia, Novartis, Oculeve, Portola, Radiometer, Springer Publishing, The Medicines Company, Theravance, Vindico, WebMD
• Equity – BioPrint Fitness

Initial 4500
UL 95% CI <1.8
2010 2011 2012 2013 2014 2015 2016 2017 2009
Initial Design
Evaluate CV safety/ protection
CANVAS Additional 14,000 for total of 18,500
UL 95% CI <1.3

CANVAS n = 4330
2010 2011 2012 2013 2014 2015 2016 2017 2009
UL 95% CI <1.8
2010 2011 2012 2013 2014 2015 2016 2017 2009
UL 95% CI <1.3 CANVAS trial starts
CANVAS-R n = 5812
Final Design
Evaluate CV safety CV safety
proved and marketing
authorization achieved
CANVAS Program N = 10,142

Randomization
CANVAS-R
2-week placebo run-in
Placebo
Canagliflozin 100 mg with optional up-titration to 300 mg
R
CANVAS
R 2-week
placebo run-in
Placebo
Canagliflozin 100 mg
Canagliflozin 300 mg

Analytic Approach
R 2-week placebo run-in
Canagliflozin 300 mg
+
Canagliflozin 100 mg
Placebo

Organizational Structure
Steering Committee D. Matthews (Co-chair), B. Neal (Co-chair), G. Fulcher, K. Mahaffey, V. Perkovic, M. Desai (Sponsor),
D. de Zeeuw
Independent Data Monitoring Committee P. Home (Chair), J. Anderson, I. Campbell, J. Lachin (withdrew in September 2015), D. Scharfstein,
S. Solomon, R. Uzzo
Cardiovascular Adjudication Committee G. Fulcher (Chair), J. Amerena, C. Chow, G. Figtree, J. French, G. Hillis, M. Hlatky, B. Jenkins, N. Leeper,
R. Lindley, B. McGrath, A. Street, J. Watson
Renal Adjudication Committee G. Fulcher (Chair), S. Shahinfar, T. Chang, A. Sinha, P. August
Safety Adjudication Committees Fracture Adjudication: Bioclinica
Diabetic Ketoacidosis Adjudication: Baim Institute for Clinical Research Pancreatitis Adjudication: A. Cheifetz (Chair), S. Sheth, J. Feuerstein
Data Management Similar electronic case report forms and same endpoint definitions

Participant Inclusion Criteria
Patients with type 2 diabetes
• HbA1c ≥7.0% to ≤10.5%
• eGFR ≥30 mL/min/1.73 m2
• Age ≥30 years and history of prior CV event
OR
Age ≥50 years with ≥2 CV risk factors*
*Diabetes duration ≥10 years, SBP >140 mmHg on ≥1 medication, current smoker, micro- or macroalbuminuria, or HDL cholesterol <1 mmol/L.

Statistical Methods - Efficacy
• Integrated data set and intent-to-treat (ITT) principle
• Primary endpoint analysis based on Cox regression model with stratification by trial and CV disease history
• Pooled data from canagliflozin doses compared with placebo
• CV event (90% power) and time (>78 weeks) driven study
• Homogeneity of treatment effects across the two trials was evaluated
• Sequential testing prespecified

Objectives
PRIMARY CV death, nonfatal MI, or nonfatal stroke
SECONDARY All-cause mortality
CV death
EXPLORATORY Nonfatal MI
Nonfatal stroke Hospitalization for HF
Hospitalization for HF or CV death Total hospitalizations
Albuminuria progression Albuminuria regression
Renal composite: 40% reduction in eGFR, end-stage renal disease, or renal death
PRIMARY CV death, nonfatal MI, or nonfatal stroke
SECONDARY All-cause mortality
CV death

Hypothesis Testing Plan
CANVAS Program
(CANVAS and CANVAS-R)
CANVAS-R alone
*Superiority testing was included in the Statistical Analysis Plan.
Major cardiovascular events (non-inferiority) • Superiority*
All-cause mortality
Cardiovascular death
Albuminuria progression
Cardiovascular death or hospitalization for heart failure
Cardiovascular death

The CANVAS Program Effects on Cardiovascular Outcomes
Bruce Neal, MB, ChB, PhD
Presenter Disclosures: Bruce Neal, MB ChB, PhD
• Research support – Australian National Health and Medical Research Council Principal
Research Fellowship – Janssen, Roche, Servier, Merck Schering Plough
• Advisory boards and/or continuing medical education – Abbott, Janssen, Novartis, Pfizer, Roche, Servier – Consultancy, honoraria, or travel support paid to his institution

Global Participation
Asia Pacific • Australia • China • India • Korea • Malaysia • New Zealand • Taiwan
North America • Canada • USA
Latin America • Argentina • Brazil • Colombia • Mexico
30 Countries 667 sites
Europe • Belgium • Czech Republic• Estonia • France • Germany • Great Britain • Hungary • Israel • Italy
• Luxembourg• Netherlands • Spain • Sweden • Norway • Poland • Russia • Ukraine
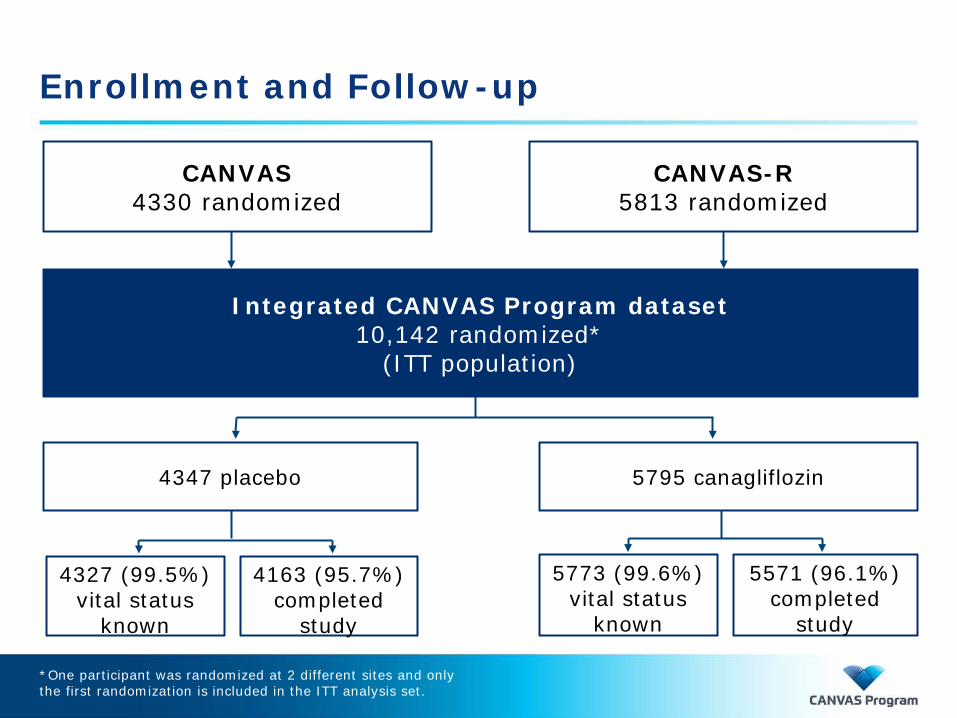
Enrollment and Follow-up
4347 placebo
Integrated CANVAS Program dataset 10,142 randomized*
(ITT population)
5795 canagliflozin
5773 (99.6%) vital status
known
5571 (96.1%) completed
study
4327 (99.5%) vital status
known
4163 (95.7%) completed
study
CANVAS 4330 randomized
CANVAS-R 5813 randomized
*One participant was randomized at 2 different sites and only the first randomization is included in the ITT analysis set.
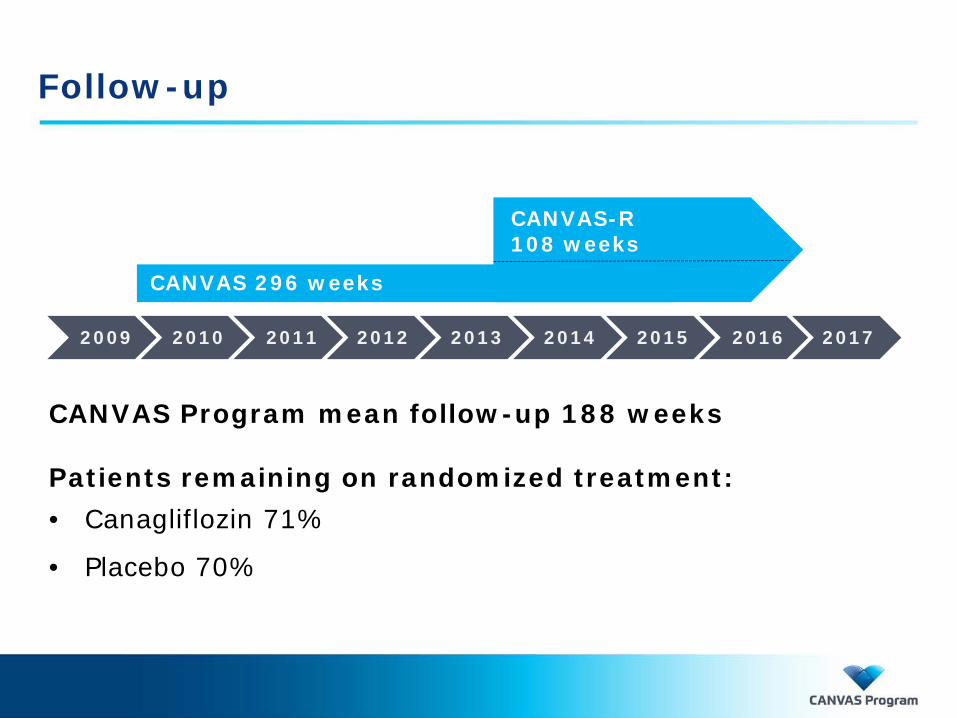
Follow-up
CANVAS 296 weeks
CANVAS-R 108 weeks
2010 2011 2012 2013 2014 2015 2016 2017 2009
CANVAS Program mean follow-up 188 weeks Patients remaining on randomized treatment: • Canagliflozin 71%
• Placebo 70%

Demographics and Disease History
Canagliflozin (n = 5795)
Placebo (n = 4347)
Mean age, y 63 63
Female, % 35 37
Mean duration of diabetes, y 14 14
Hypertension, % 90 91
Heart failure (NYHA I-III), % 14 15
Cardiovascular disease, % 65 67

Demographics (cont)
Canagliflozin (n = 5795)
Placebo (n = 4347)
% % Race White 78 79 Asian 13 12 Black or African American 3 4 Other 6 6
Geographic region North America 25 23 Central/South America 9 11 Europe 35 36 Rest of world 31 30
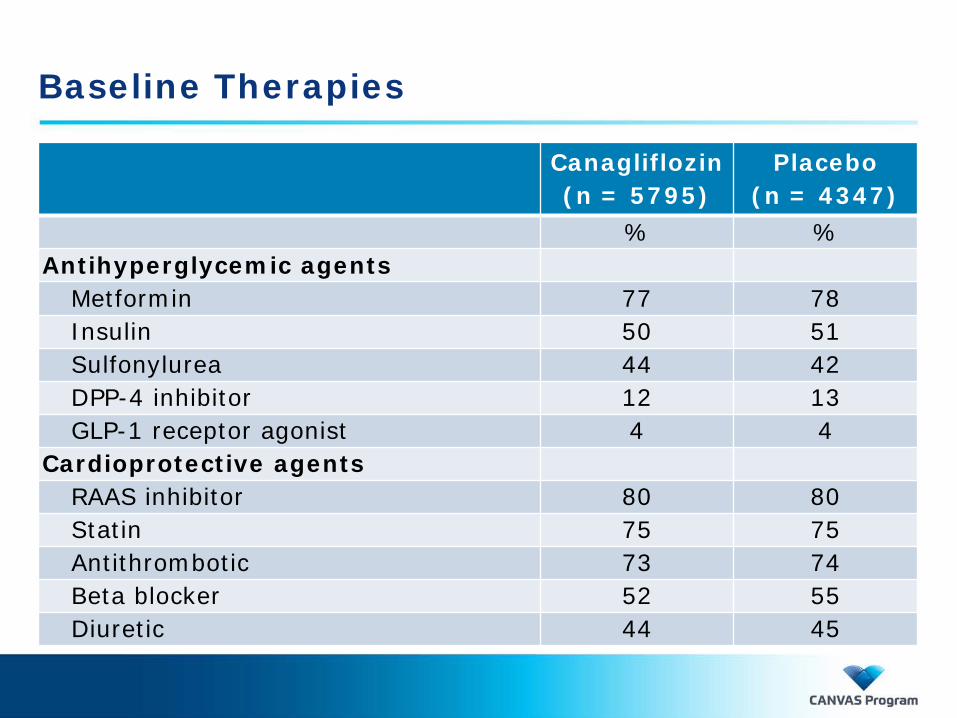
Baseline Therapies
Canagliflozin (n = 5795)
Placebo (n = 4347)
% % Antihyperglycemic agents Metformin 77 78 Insulin 50 51 Sulfonylurea 44 42 DPP-4 inhibitor 12 13 GLP-1 receptor agonist 4 4
Cardioprotective agents RAAS inhibitor 80 80 Statin 75 75 Antithrombotic 73 74 Beta blocker 52 55 Diuretic 44 45

Baseline Risk Factors
Canagliflozin (n = 5795)
Placebo (n = 4347)
HbA1c, % 8.2 8.2
Body mass index, kg/m2 31.9 32.0
Systolic BP, mmHg 136 137
Diastolic BP, mmHg 78 78
Total cholesterol, mmol/L 4.4 4.4
HDL-C, mmol/L 1.2 1.2
LDL-C, mmol/L 2.3 2.3
Triglycerides, mmol/L 2.0 2.0

Results
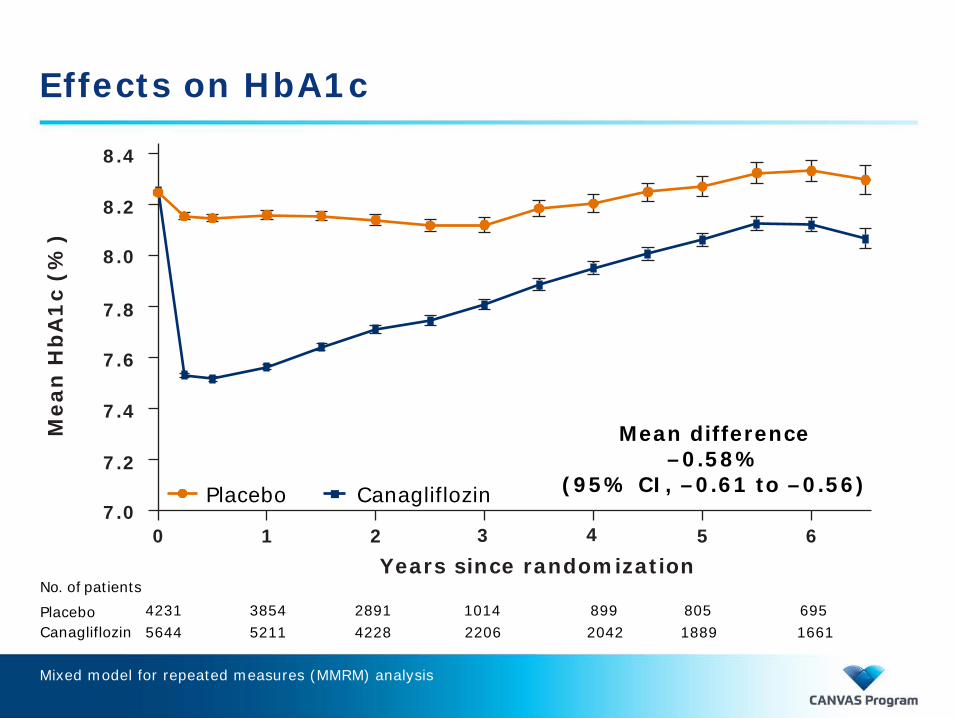
Effects on HbA1c
No. of patients
Placebo Canagliflozin
Mean difference –0.58%
(95% CI, –0.61 to –0.56)
Mea
n H
bA
1c
(%)
8.4
4231 3854 2891 1014 899 805 695 5644 5211 4228 2206 2042 1889 1661
Years since randomization
8.2
8.0
7.8
7.6
7.4
7.2
7.0 1 5 6 0 2 3 4
Placebo Canagliflozin
Mixed model for repeated measures (MMRM) analysis
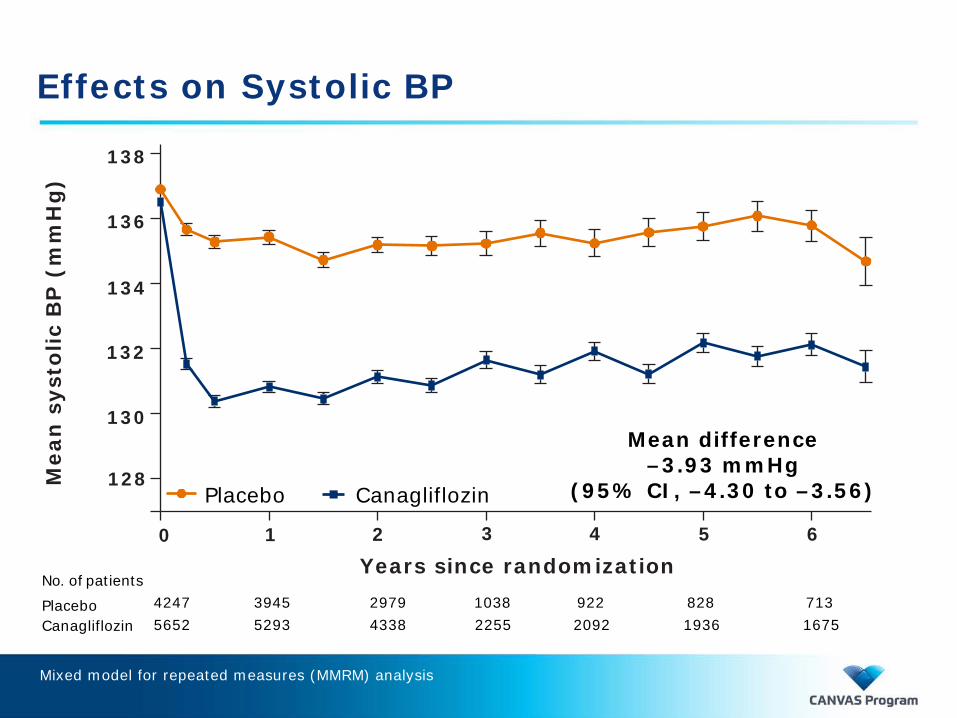
Effects on Systolic BP
No. of patients
Placebo Canagliflozin
4247 3945 2979 1038 922 828 713 5652 5293 4338 2255 2092 1936 1675
Mean difference –3.93 mmHg
(95% CI, –4.30 to –3.56)
138
136
134
132
130
Placebo Canagliflozin
Mea
n s
ysto
lic B
P (
mm
Hg
)
0 1 2 5 6 3 4
Years since randomization
128
Mixed model for repeated measures (MMRM) analysis

Effects on Body Weight
No. of patients
Placebo Canagliflozin
Years since randomization
Mean difference –1.60 kg
(95% CI, –1.70 to –1.51)
Mea
n b
ody
wei
gh
t (k
g)
85
86
90
91
0 1 2 5 6 3 4
92
89
88
87
4245 3931 2977 1036 920 826 714 5651 5277 4331 2247 2086 1928 1669
Placebo Canagliflozin
Mixed model for repeated measures (MMRM) analysis
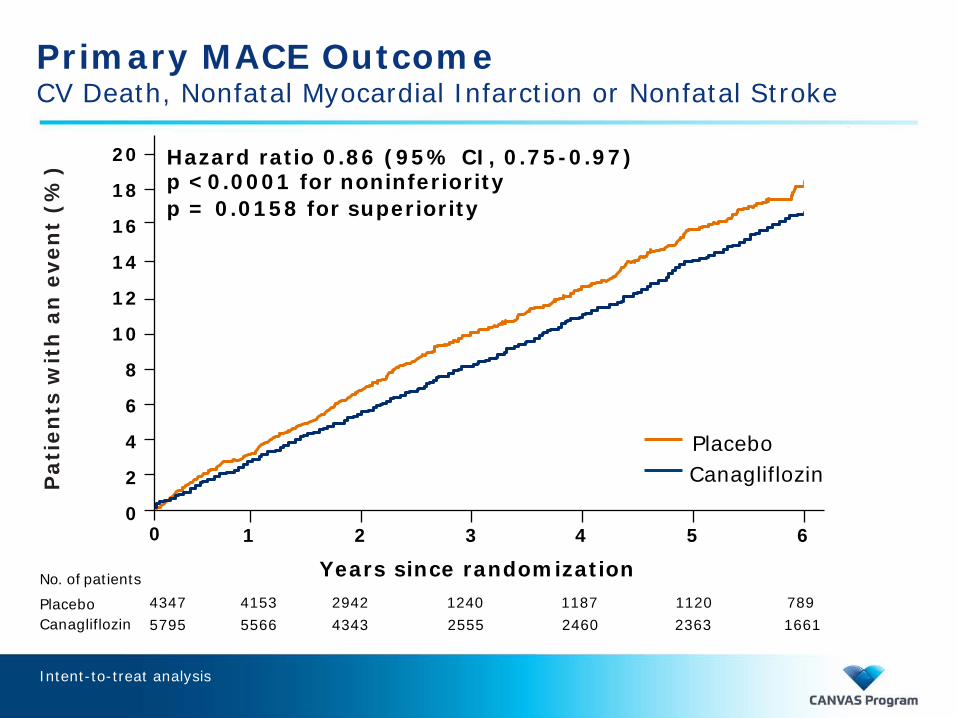
Primary MACE Outcome CV Death, Nonfatal Myocardial Infarction or Nonfatal Stroke
No. of patients
Placebo Canagliflozin
Years since randomization 2 3 4 5 6 1
Hazard ratio 0.86 (95% CI, 0.75-0.97) p <0.0001 for noninferiority p = 0.0158 for superiority
20
18
16
14
12
10
8
6
4
2
0 0
Pat
ien
ts w
ith
an
eve
nt
(%)
Placebo Canagliflozin
4347 4153 2942 1240 1187 1120 789 5795 5566 4343 2555 2460 2363 1661
Intent-to-treat analysis

Primary Cardiovascular Outcome by Study
CANVAS
CANVAS-R
CANVAS Program
0.88 (0.75-1.03)
0.82 (0.66-1.01)
0.86 (0.75-0.97)
Favors Placebo
Favors Canagliflozin
2.0
Hazard ratio (95% CI)
0.5 1.0
Intent-to-treat analysis

Hypothesis Testing Outcome
p <0.001 p = 0.0158
p = 0.24
Exploratory Nominal effect estimates
*Superiority testing was included in the Statistical Analysis Plan.
Major cardiovascular events (non-inferiority) • Superiority*
All-cause mortality
Cardiovascular death
Albuminuria progression
Cardiovascular death or hospitalization for heart failure
Cardiovascular death

CV Death Component of Primary Outcome
No. of patients
Placebo Canagliflozin
4347 4279 3119 1356 1328 1292 924 5795 5723 4576 2761 2710 2651 1904
Years since randomization
Pat
ien
ts w
ith
an
eve
nt
(%)
0 1 2 5 6
Hazard ratio 0.87 (95% CI, 0.72-1.06)
3 4
6
20
18
16
14
12
10
8
4
2
0
Placebo Canagliflozin
Intent-to-treat analysis

MI Component of Primary Outcome
Hazard ratio 0.85 (95% CI, 0.69-1.05)
0 1 5 6 3 4 2
4347 4187 2986 1255 1207 1146 812 5795 5625 4405 2602 2516 2425 1728
6
20
18
16
14
12
10
8
4
2
0
Pat
ien
ts w
ith
an
eve
nt
(%)
Years since randomization No. of patients
Placebo Canagliflozin
Placebo Canagliflozin
Intent-to-treat analysis
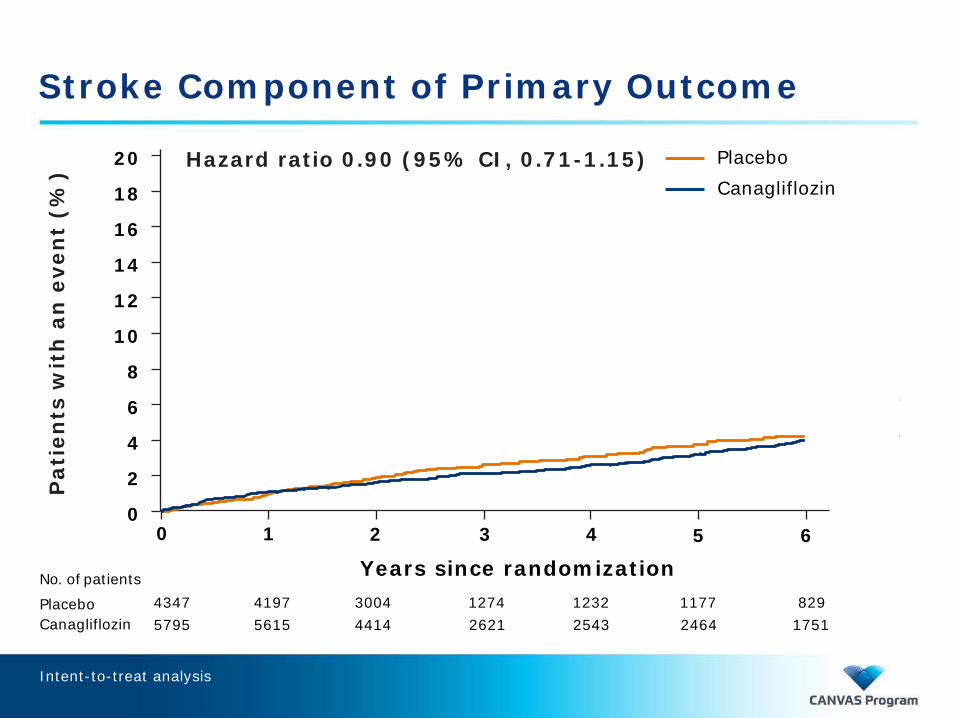
Stroke Component of Primary Outcome
0 1 5 6 3 4
Hazard ratio 0.90 (95% CI, 0.71-1.15)
2
4347 4197 3004 1274 1232 1177 829 5795 5615 4414 2621 2543 2464 1751
6
20
18
16
14
12
10
8
4
2
0
Pat
ien
ts w
ith
an
eve
nt
(%)
Years since randomization No. of patients
Placebo Canagliflozin
Placebo Canagliflozin
Intent-to-treat analysis

All-Cause Mortality
0 1 2 5 6
Hazard ratio 0.87 (95% CI, 0.74-1.01)
3 4
4347 4279 3119 1356 1328 1292 924 5795 5723 4576 2761 2710 2651 1904
Pat
ien
ts w
ith
an
eve
nt
(%)
Years since randomization
6
20
18
16
14
12
10
8
4
2
0
No. of patients
Placebo Canagliflozin
Placebo Canagliflozin
Intent-to-treat analysis

Hospitalization for Heart Failure
Hazard ratio 0.67 (95% CI, 0.52-0.87)
4347 4198 3011 1274 1236 1180 829 5795 5653 4437 2643 2572 2498 1782
0 1 2 5 6 3 4
6
20
18
16
14
12
10
8
4
2
0
Pat
ien
ts w
ith
an
eve
nt
(%)
Years since randomization No. of patients
Placebo Canagliflozin
Placebo Canagliflozin
Intent-to-treat analysis

CV Death or Hospitalization for Heart Failure
0 1 2 5 6
Hazard ratio 0.78 (95% CI, 0.67-0.91)
3 4
18
20
16
14
12
10
8
6
4
2
0
4347 4202 3015 1281 1242 1184 831 5795 5655 4442 2647 2577 2503 1782
Pat
ien
ts w
ith
an
eve
nt
(%)
Years since randomization No. of patients
Placebo Canagliflozin
Placebo Canagliflozin
Intent-to-treat analysis
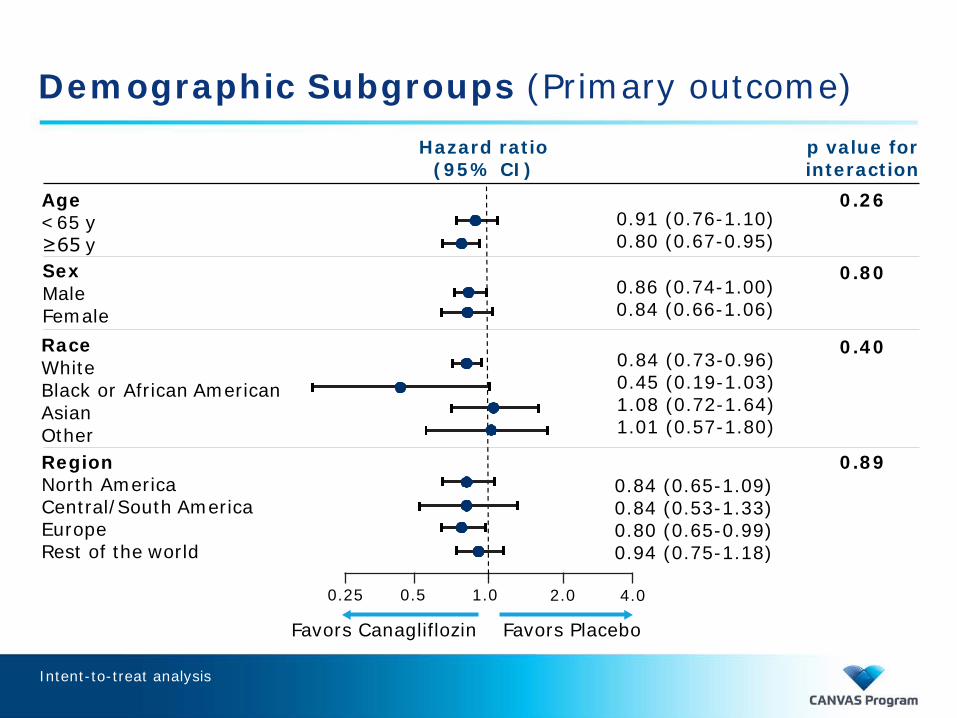
Demographic Subgroups (Primary outcome)
0.26 Age <65 y ≥65 y
0.91 (0.76-1.10) 0.80 (0.67-0.95)
0.80 Sex Male Female
0.86 (0.74-1.00) 0.84 (0.66-1.06)
0.40 Race White Black or African American Asian Other
0.84 (0.73-0.96) 0.45 (0.19-1.03) 1.08 (0.72-1.64) 1.01 (0.57-1.80)
0.89 Region North America Central/South America Europe Rest of the world
0.84 (0.65-1.09) 0.84 (0.53-1.33) 0.80 (0.65-0.99) 0.94 (0.75-1.18)
Hazard ratio (95% CI)
p value for interaction
0.25 0.5 1.0 2.0 4.0
Favors Canagliflozin Favors Placebo
Intent-to-treat analysis

Risk Factor Subgroups (Primary Outcome)
0.29 BMI <30 kg/m2
≥30 kg/m2 0.97 (0.79-1.20) 0.79 (0.67-0.93)
0.64 BP control SBP ≥140 mmHg or DBP ≥90 mmHg SBP <140 mmHg and DBP <90 mmHg
0.84 (0.70-1.01) 0.88 (0.74-1.04)
0.33 Duration of diabetes ≥10 y <10 y
0.81 (0.70-0.95) 0.96 (0.76-1.22)
0.29 HbA1c <8% ≥8%
0.94 (0.77-1.15) 0.80 (0.68-0.94)
0.20 eGFR 30 to <60 mL/min/1.73 m2
60 to <90 mL/min/1.73 m2
≥90 mL/min/1.73 m2
0.70 (0.55-0.90) 0.95 (0.80-1.13) 0.84 (0.62-1.12)
0.25 0.5 1.0 2.0 4.0
Favors Canagliflozin Favors Placebo
Hazard ratio (95% CI)
p value for interaction
Intent-to-treat analysis

Disease History Subgroups (Primary Outcome)
0.82 (0.72-0.95) 0.98 (0.74-1.30)
0.47 Peripheral vascular disease Yes No
0.75 (0.58-0.97) 0.89 (0.77-1.03)
0.51 Heart failure Yes No
0.80 (0.61-1.05) 0.87 (0.76-1.01)
0.36 Amputation Yes No
0.56 (0.28-1.13) 0.86 (0.76-0.98)
CV disease Yes No
0.25 0.5 1.0 2.0 4.0
Favors Canagliflozin Favors Placebo
Hazard ratio (95% CI)
p value for interaction
0.18
Intent-to-treat analysis

Background Therapy Subgroups (Primary Outcome)
0.25 0.5 1.0 2.0 4.0
0.96 Insulin use Yes No
0.85 (0.72-1.00) 0.87 (0.71-1.06)
0.45 Statin use Yes No
0.84 (0.72-0.97) 0.91 (0.71-1.16)
0.86 Antithrombotic use Yes No
0.87 (0.75-1.00) 0.82 (0.61-1.09)
0.38 RAAS inhibitor use Yes No
0.88 (0.76-1.01) 0.77 (0.58-1.03)
0.01 Beta-blocker use Yes No
0.75 (0.64-0.88) 1.04 (0.85-1.28)
<0.001 Diuretic use Yes No
0.66 (0.56-0.79) 1.11 (0.93-1.34)
Hazard ratio (95% CI)
p value for interaction
Favors Canagliflozin Favors Placebo
Intent-to-treat analysis

Summary
CV death
Nonfatal myocardial infarction
Nonfatal stroke
Hospitalization for heart failure
CV death or hospitalization for heart failure
All-cause mortality
Primary cardiovascular outcome 0.87 (0.72-1.06)
0.85 (0.69-1.05)
0.90 (0.71-1.15)
0.67 (0.52-0.87)
0.78 (0.67-0.91)
0.87 (0.74-1.01)
0.86 (0.75-0.97)
Favors Placebo
Favors Canagliflozin
Hazard ratio (95% CI)
1.0 0.5 2.0
Intent-to-treat analysis
The CANVAS Program Effects on Renal Outcomes
Dick de Zeeuw, MD, PhD

Presenter Disclosures: Dick de Zeeuw, MD, PhD
• Advisory boards and/or speaker for: – AbbVie, Astellas, Eli Lilly, Fresenius, Janssen, Boehringer
Ingelheim, Bayer, Mitsubishi-Tanabe – All consultancy honoraria are paid to his institution

Renal Outcomes
Biomarker outcome • Change in albuminuria
Renal intermediate outcomes • Progression of albuminuria • Regression of albuminuria Composite renal outcome [confirmed and adjudicated] • 40% decrease in glomerular filtration rate (GFR) • End-stage renal disease • Renal death

Measurement of Renal Outcomes
Albuminuria • Urine albumin:creatinine ratio (UACR) Progression/Regression of albuminuria • Change in albuminuria class (normo-, micro-, macroalbuminuria) plus
>30% UACR change from baseline 40% decrease in GFR • Sustained more than 40% decrease in estimated GFR (eGFR) End-stage renal disease • Reaching dialysis or transplantation or sustained
eGFR <15 mL/min/1.73 m2 Renal death • Death due to kidney disease

Renal Baseline Characteristics Similar for Canagliflozin and Placebo
Canagliflozin (n = 5795)
Placebo (n = 4347)
Mean eGFR, mL/min/1.73 m² 77 76
Median albumin:creatinine ratio, mg/g 12.4 12.1
ACE inhibitor/ARB use, % 80 80

Low Renal Risk Population High Percentage of “Normal” eGFR and Albuminuria
Canagliflozin (n = 5795)
Placebo (n = 4347)
Mean eGFR, mL/min/1.73 m² 77 76
≥90 mL/min/1.73 m², % 25 24
60 to <90 mL/min/1.73 m², % 56 54
45 to <60 mL/min/1.73 m², % 14 16
<45 mL/min/1.73 m², % 5 6
Median albumin:creatinine ratio, mg/g 12.4 12.1
Normoalbuminuria (<30 mg/g), % 70 70
Microalbuminuria (30 to 300 mg/g), % 23 22
Macroalbuminuria (>300 mg/g), % 7 8

Results
Biomarker outcome • Change in albuminuria
Renal intermediate outcomes • Progression of albuminuria • Regression of albuminuria Composite renal outcome [confirmed and adjudicated] • 40% decrease in glomerular filtration rate (GFR) • End-stage renal disease • Renal death

Change in Albumin:Creatinine Ratio (UACR) Percent Change in UACR per Albuminuria Class (inset)
Geo
met
ric
mea
n U
AC
R
wit
h 9
5%
CI
(mg
/g
)
0 1 2
Years since randomization 4 5 6
10
50
45
40
35
30
25
20
15
3
No. of patients Placebo Canagliflozin
4084 3775 2556 753 652 594 618 5500 5103 3565 1689 1541 1408 1534
Mean % difference –18%
(95% CI, –16 to –20)
Normo Micro Macro
–10%
–20%
–30%
–40%
–50%
0%
–9%
–34% –36%
Placebo Canagliflozin
Mixed model for repeated measures (MMRM) analysis Excluding those below detection level

Results
Biomarker outcome • Change in albuminuria
Renal intermediate outcomes • Progression of albuminuria • Regression of albuminuria Composite renal outcome [confirmed and adjudicated] • 40% decrease in glomerular filtration rate (GFR) • End-stage renal disease • Renal death

Progression of Albuminuria
3819 3096 1690 724 626 548 303 5196 4475 2968 1730 1528 1354 775
Hazard ratio 0.73 (95% CI, 0.67-0.79)
2 3 4 5 6 0 1
100
90
80 70
60 50
40 30 20 10
0
Intent-to-treat analysis
No. of patients
Placebo Canagliflozin
Years since randomization
Pat
ien
ts w
ith
an
eve
nt
(%) Placebo
Canagliflozin

Regression of Albuminuria
1257 913 426 163 144 123 59 1679 1009 518 276 227 198 112
Hazard ratio 1.70 (95% CI, 1.51-1.91)
0 1 2 5 6 3 4
100
90
80
70
60
50
40
30
20
10
0
Intent-to-treat analysis
No. of patients
Placebo Canagliflozin
Years since randomization
Pat
ien
ts w
ith
an
eve
nt
(%) Placebo
Canagliflozin

Results
Biomarker outcome • Change in albuminuria
Renal intermediate outcomes • Progression of albuminuria • Regression of albuminuria Composite renal outcome [confirmed and adjudicated] • 40% decrease in glomerular filtration rate (GFR) • End-stage renal disease • Renal death
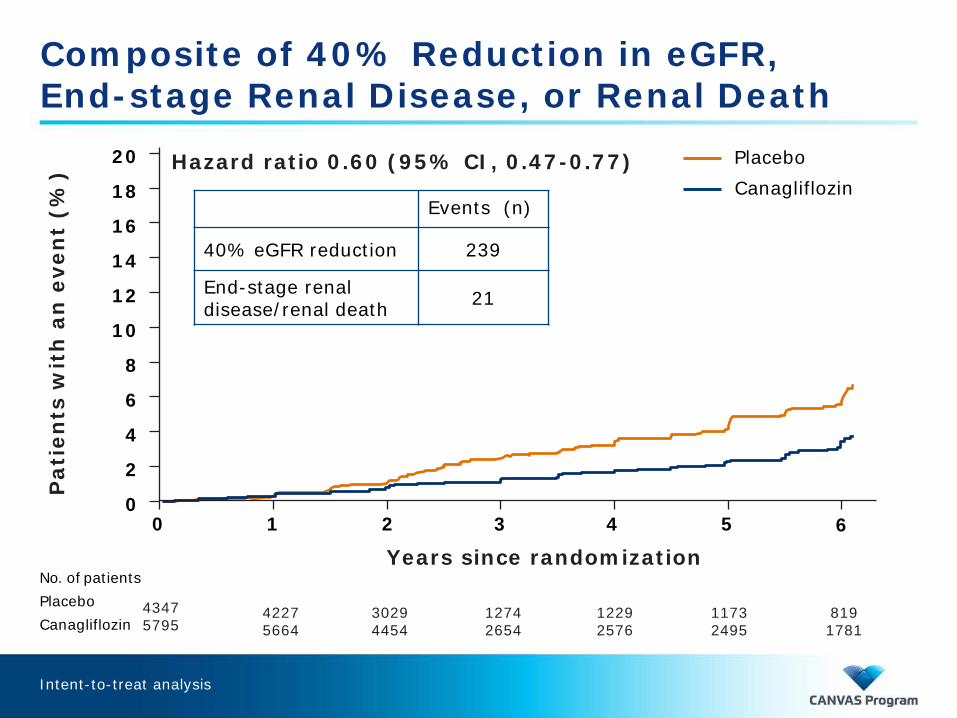
Composite of 40% Reduction in eGFR, End-stage Renal Disease, or Renal Death
4227 5664
3029 4454
1274 2654
1229 2576
1173 2495
819 1781
4347 5795
Hazard ratio 0.60 (95% CI, 0.47-0.77)
Events (n)
40% eGFR reduction 239
End-stage renal disease/renal death 21
Intent-to-treat analysis
No. of patients Placebo Canagliflozin
0 1 2 5 6 3 4
6
20
18
16
14
12
10
8
4
2
0
Years since randomization
Pat
ien
ts w
ith
an
eve
nt
(%)
Placebo Canagliflozin

Renal Outcomes Summary
• Canagliflozin compared to placebo – Induced sustained lowering of albuminuria – Prevented progression in albuminuria – Induced regression in albuminuria – Reduced renal function loss events
• Conclusion – These data suggest a potential renoprotective effect of
canagliflozin treatment in patients with type 2 diabetes at high CV risk on top of ACE/ARBs

The CANVAS Program Effects on Safety Outcomes
Vlado Perkovic, MBBS, PhD

Presenter Disclosures: Vlado Perkovic, MBBS, PhD
• Research support – Senior Research Fellowship and Program Grant from the
Australian National Health and Medical Research Council
• Steering Committees – Abbvie, Boehringer Ingelheim, GSK, Janssen, Pfizer
• Advisory boards and/or speaker at scientific meetings – Abbvie, Astellas, Astra Zeneca, Bayer, Baxter, BMS, Boehringer
Ingelheim, Durect, Eli Lilly, Gilead, GSK, Janssen, Merck, Novartis, Novo Nordisk, Pfizer, Pharmalink, Relypsa, Roche, Sanofi, Servier, Vitae
• All honoraria are paid to employer

Adverse Event Collection in CANVAS Program
Pre-registration
• All adverse events
Post-registration streamlined approach
• All serious adverse events
• Adverse events leading to discontinuation
• Adverse events of interest

Adverse Events of Interest
• Prespecified – Male genital mycotic infections – Malignancies – Photosensitivity – Venous thromboembolism – Fracture
• Added during trials – Diabetic ketoacidosis (health authority surveillance for
class) – Acute pancreatitis (health authority surveillance for class) – Amputation (data monitoring committee advice)

All serious adverse events (n = 3280)
104 120 0.93 (0.87-1.00)
Adverse events leading to discontinuation (n = 1025)
35 33 1.13 (0.99-1.28)
All-cause hospitalization (n = 3486)
119 131 0.94 (0.88-1.00)
Serious Adverse Events, Adverse Events Leading to Discontinuation & Hospitalizations
Favors Canagliflozin
Favors Placebo
0.5 1.0 2.0
Hazard ratio (95% CI) Placebo Canagliflozin
Event rate per 1000 patient-years

Female genital mycotic infection (n = 196) 69 18 4.37 (2.78-6.88)
Urinary tract infection (n = 440) 40 37 1.09 (0.89-1.34)
Hypoglycemia (n = 551) 50 46 1.13 (0.94-1.35)
Osmotic diuresis (n = 312) 34 13 2.80 (2.06-3.81)
Volume depletion (n = 266) 26 19 1.44 (1.09-1.90)
Severe hypersensitivity/ cutaneous reaction (n = 87)
8 6 1.41 (0.87-2.28)
Hepatic injury (n = 90) 7 9 0.81 (0.53-1.25)
Adverse Events (CANVAS)
Hazard ratio (95% CI) Placebo Canagliflozin
Event rate per 1000 patient-years
Favors Canagliflozin Favors Placebo 0.5 1.0 8.0 4.0 2.0 0.25

Favors Canagliflozin
Favors Placebo
0.5 1.0 8.0 4.0 2.0 0.25
Male genital mycotic infection (n = 503) 35 11 3.76 (2.91-4.86)
Venous thromboembolic events (n = 50) 1.7 1.7 0.96 (0.54-1.71)
Photosensitivity (n = 22) 1.0 0.3 2.71 (0.92-8.03)
Adjudicated diabetic ketoacidosis (n = 18) 0.6* 0.3 2.33 (0.76-7.17)
Adjudicated acute pancreatitis (n = 13) 0.5 0.4 1.34 (0.40-4.41)
Adverse Events of Interest Across Program
*5 patients reporting diabetic ketoacidosis (all on canagliflozin) identified as having autoimmune diabetes (positive GADA and mIAA or a reported history of T1DM).
Hazard ratio (95% CI) Placebo Canagliflozin
Event rate per 1000 patient-years

Lower-extremity Amputations
No. at risk Placebo Canagliflozin
4344 4217 3037 1289 1247 1194 844 5790 5634 4420 2618 2536 2460 1765
Years since randomization
Pat
ien
ts w
ith
an
eve
nt
(%)
0 1 2 5 6 3 4
Hazard ratio 1.97 (95% CI, 1.41-2.75)
6
20
18
16
14
12
10
8
4
2
0
Placebo Canagliflozin
Increased risk communicated to health authorities, investigators, and providers in 2016 based on IDMC letter.

All amputations (n = 187) 6.3 3.4 1.97 (1.41-2.75)
Minor amputation (71%) 4.5 2.4 1.94 (1.31-2.88)
Toe 3.4 2.2
Transmetatarsal 1.0 0.3
Major amputation (29%) 1.8 0.9 2.03 (1.08-3.82)
Ankle 0.04 0.07
Below-knee 1.2 0.6
Above-knee 0.6 0.2
Highest Level of Amputation
Favors Canagliflozin
Favors Placebo
0.5 1.0 8.0 4.0 2.0 0.25
Hazard ratio (95% CI) Placebo Canagliflozin
Event rate per 1000 patient-years
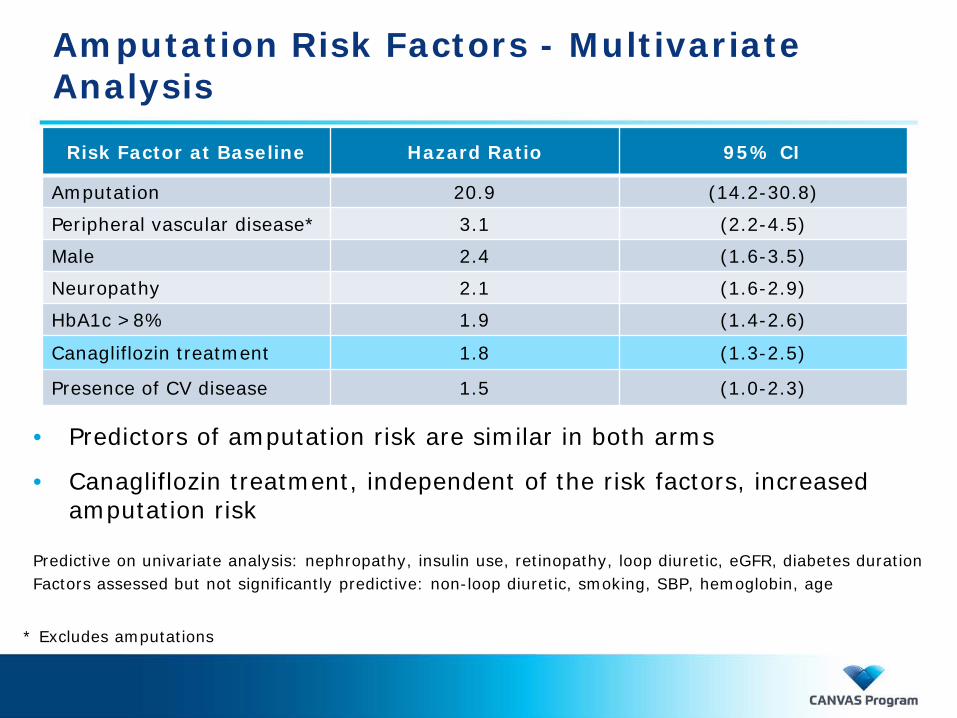
• Predictors of amputation risk are similar in both arms
• Canagliflozin treatment, independent of the risk factors, increased amputation risk
Predictive on univariate analysis: nephropathy, insulin use, retinopathy, loop diuretic, eGFR, diabetes duration Factors assessed but not significantly predictive: non-loop diuretic, smoking, SBP, hemoglobin, age
Amputation Risk Factors - Multivariate Analysis
Risk Factor at Baseline Hazard Ratio 95% CI
Amputation 20.9 (14.2-30.8)
Peripheral vascular disease* 3.1 (2.2-4.5)
Male 2.4 (1.6-3.5)
Neuropathy 2.1 (1.6-2.9)
HbA1c >8% 1.9 (1.4-2.6)
Canagliflozin treatment 1.8 (1.3-2.5)
Presence of CV disease 1.5 (1.0-2.3)
* Excludes amputations

Low-trauma Fracture
No. of patients
Placebo Canagliflozin
4344 4182 2987 1263 1217 1162 817 5790 5606 4376 2566 2467 2373 1692
Years since randomization
Pat
ien
ts w
ith
an
eve
nt
(%)
0 1 2 5 6 3 4
6
20
18
16
14
12
10
8
4
2
0
Hazard ratio 1.23 (95% CI, 0.99–1.52) Placebo Canagliflozin

Adjudicated low-trauma fractures CANVAS Program (Heterogeneity p = 0.003) 12 9.2 1.23 (0.99–1.52)
CANVAS (n = 271) 13 8.3 1.56 (1.18–2.06)
CANVAS-R (n = 108) 7.9 10 0.76 (0.52–1.12)
All adjudicated fractures CANVAS Program (Heterogeneity p = 0.005) 15 12 1.26 (1.04–1.52)
CANVAS (n = 350) 17 11 1.55 (1.21–1.97)
CANVAS-R (n = 146) 11 13 0.86 (0.62–1.19)
Fractures
Favors Canagliflozin Favors Placebo
0.5 1.0 8.0 4.0 2.0 0.25
Hazard ratio (95% CI) Placebo Canagliflozin
Event rate per 1000 patient-years

Neoplasms (n = 741) 21 20 1.00 (0.86-1.16)
Renal cancer (n = 17) 0.6 0.2 2.39 (0.68-8.34)
Bladder cancer (n = 38) 1.0 1.1 0.90 (0.47-1.72)
Breast cancer (n = 37) 3.1 2.6 1.17 (0.59-2.32)
Malignancy
Hazard ratio (95% CI) Placebo Canagliflozin
Event rate per 1000 patient-years
Favors Canagliflozin
Favors Placebo
0.5 1.0 8.0 4.0 2.0 0.25

Serious renal-related (n = 83) 2.5 3.3 0.76 (0.49-1.19)
Serious acute kidney injury (n = 58) 1.6 2.5 0.68 (0.45-1.02)
Serious hyperkalemia (n = 15) 0.4 0.6 0.75 (0.27-2.11)
Renal Safety
Hazard ratio (95% CI) Placebo Canagliflozin
Event rate per 1000 patient-years
Favors Canagliflozin
Favors Placebo
0.5 1.0 8.0 4.0 2.0 0.25

Safety Summary
Canagliflozin use was associated with:
• Newly identified increase in risk of amputation
• Possible increase in fracture risk
• Adverse event profile otherwise consistent with known effects of canagliflozin
The CANVAS Program Implications for Clinical Practice
David R. Matthews, FRCP, DPhil

Presenter Disclosures: David R. Matthews, FRCP, DPhil
• Research support – Janssen
• Advisory boards – Novo Nordisk, GlaxoSmithKline, Novartis, Eli Lilly,
Sanofi-Aventis, Janssen, Servier
• Consultant – Novo Nordisk, GlaxoSmithKline, Novartis, Eli Lilly,
Sanofi-Aventis, Janssen, Servier
• Lectures – Novo Nordisk, Servier, Sanofi-Aventis, Eli Lilly, Novartis,
Janssen, Aché Laboratories

What Was the Population Studied?
• T2DM ~14 years
• High CV risk
• Hypertensive
• Overweight
• Multiple comorbidities
• 2/3 with prior CV disease
• 1/3 primary prevention

What Did the Trial Assess?
• Hard outcomes – CV disease – Renal protection
• Biomarkers – HbA1c
– Blood pressure
– Weight
– Albuminuria
• Safety and side effects
Measures of microvascular and macrovascular risk
A measure of multiple health and social risks
A measure of renal and CV risk
Trial powered for events and time Pre-specified

Biomarkers
• The CANVAS Program was not designed to maintain a glycemic difference. Even so the difference in average glycemia was -0.58%
• Blood pressure was 3.9 mmHg lower than in the placebo group

Biomarkers (cont)
• Body weight was 1.6 kg lower than in the placebo group
• Urinary albumin:creatinine ratio was 18% lower than in the placebo group

Key Efficacy Outcomes in the CANVAS Program
Favors Placebo Favors Canagliflozin
1.0 0.5 2.0
CV death, nonfatal myocardial infarction, or nonfatal stroke
Hazard ratio (95% CI)
p <0.0001 noninferiority p = 0.0158 superiority
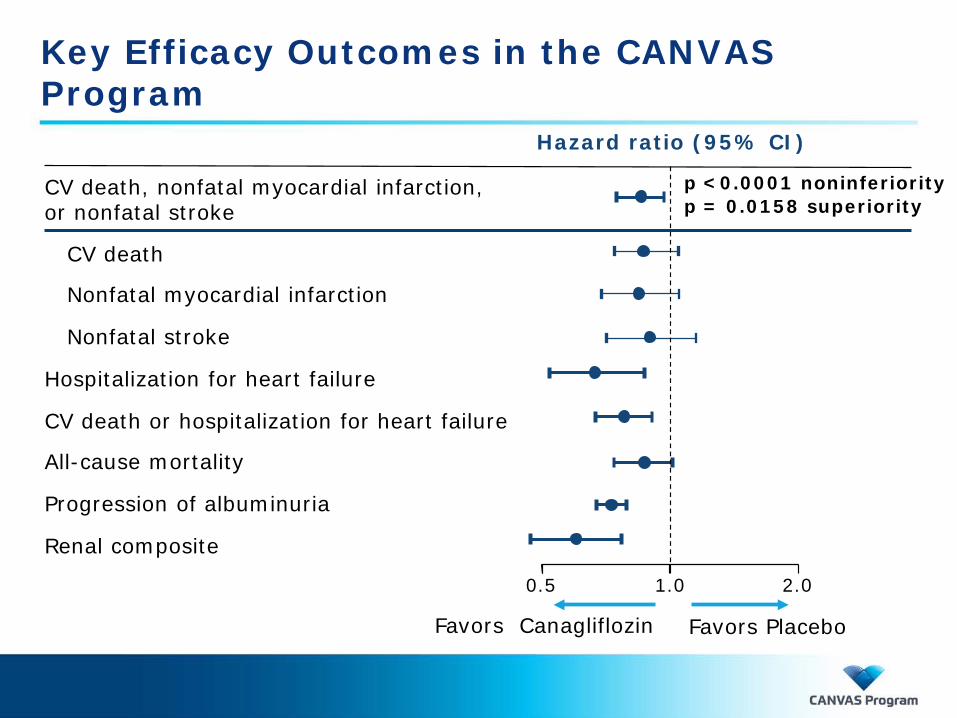
Key Efficacy Outcomes in the CANVAS Program
CV death
Nonfatal myocardial infarction
Nonfatal stroke
Hospitalization for heart failure
CV death or hospitalization for heart failure
All-cause mortality
Progression of albuminuria
Renal composite
CV death, nonfatal myocardial infarction, or nonfatal stroke
Favors Placebo Favors Canagliflozin
Hazard ratio (95% CI)
1.0 0.5 2.0
p <0.0001 noninferiority p = 0.0158 superiority

Primary and Secondary Prevention?
CV disease history (n = 6656) No CV disease history (n = 3486)
All-cause mortality CV disease history No CV disease history
CV death CV disease history No CV disease history
Hazard ratio (95% CI)
Favors Canagliflozin
0.5 1.0 2.0 Favors Placebo
All patients (n = 10,142)
All patients
All patients
CV death, nonfatal myocardial infarction, or nonfatal stroke

Comparisons Between Trials
• There is interest in interpreting these data in the context of EMPA-REG OUTCOME
• Comparisons between trials are complicated by differences in: – Populations – Trial designs – Analytic approaches – Drug effects
• Comparisons are therefore hazardous, subject to bias, and may be confounded by multiple uncontrolled factors

Hazard ratio (95% CI)
1.0 0.5 2.0
Favors Placebo Favors SGLT2i
Nonfatal myocardial infarction
Progression to macroalbuminuria*
Renal composite*
Hospitalization for heart failure
CV death, nonfatal myocardial infarction, or nonfatal stroke
CV death
Nonfatal stroke
Key Outcomes in the CANVAS Program and EMPA-REG OUTCOME
*CANVAS Program endpoints comparable with EMPA-REG OUTCOME.
0.25
Zinman Bet al. N Engl J Med. 2015 ;373(22):2117-2128. Wanner K et al. N Engl J Med. 2016;375(4):323-334.
CANVAS Program
EMPA-REG OUTCOME
CV death or hospitalization for heart failure
All-cause mortality

Who Might Benefit? Patients With High CV Risk
Years since randomization 2 3 4 5 6 1
20 18 16 14 12 10
8 6 4 2 0 P
atie
nts
wit
h a
n e
ven
t (%
)
0
CV death, nonfatal myocardial infarction, or nonfatal stroke
Placebo
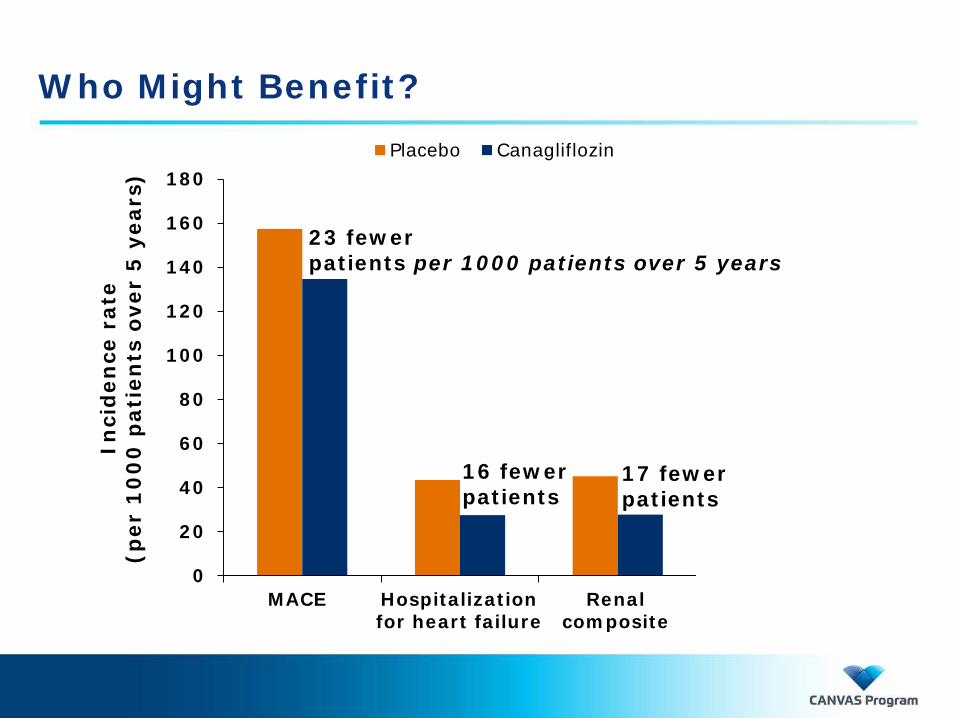
Who Might Benefit?
0
20
40
60
80
100
120
140
160
180
Inci
denc
e ra
te
(per
100
0 pa
tient
s ov
er 5
yea
rs)
Placebo Canagliflozin
23 fewer patients per 1000 patients over 5 years
16 fewer patients
17 fewer patients
MACE Hospitalization for heart failure
Renal composite
Inci
den
ce r
ate
(p
er 1
00
0 p
atie
nts
ove
r 5
yea
rs)

Newly Identified Risk - Amputation
• The mechanism of increased amputation risk is unknown
• The US FDA issued a drug safety communication regarding increased risk of amputation with canagliflozin
• The European regulatory pharmacovigilance risk assessment committee (PRAC) noted that: – ‘An increased amputation risk has only become apparent with
canagliflozin so far – One large cardiovascular outcome study (DECLARE) is still on-
going for dapagliflozin – Amputation events were not been [sic] systematically captured
within the completed large cardiovascular outcome study conducted with empagliflozin (EMPA-REG)
– Hence, it is currently not possible to establish whether the increased amputation risk is a class effect or not’
EMA PRAC assessment report. 9 February 2017. http://www.ema.europa.eu/docs/en_GB/document_library/Referrals_document/SGLT2_inhibitors_Canagliflozin_20/European_Commission_final_decision/WC500227102.pdf

Clinical Considerations - Amputation
• Caution in patients at high risk
• Canagliflozin EU Summary of Product Characteristics (product label) – ‘As an underlying mechanism has not been established, risk
factors, apart from general risk factors, for amputation are unknown
– However, as precautionary measures, consideration should be given to carefully monitoring patients with a higher risk for amputation events and counselling patients about the importance of routine preventative foot care and maintaining adequate hydration
– Consideration may also be given to stopping treatment in patients that develop events preceding amputation such as lower-extremity skin ulcer, infection, osteomyelitis or gangrene’
Invokana SmPc. 20 April 2017. http://www.ema.europa.eu/docs/en_GB/document_library/EPAR_-_Product_Information/human/002649/WC500156456.pdf

Benefits and Risk
0
20
40
60
80
100
120
140
160
180
Inci
denc
e ra
te
(per
100
0 pa
tient
s ov
er 5
yea
rs)
Placebo Canagliflozin
Inci
den
ce r
ate
(p
er 1
00
0 p
atie
nts
ove
r 5
yea
rs)
16 fewer patients
15 more patients
17 fewer patients
MACE Hospitalization for heart failure
Renal composite
Amputation
23 fewer patients
5 above ankle 10 toes and metatarsals

Conclusion
• The CANVAS Program met its primary objective of demonstrating the cardiovascular safety and efficacy of canagliflozin
• Canagliflozin use was associated with an increased risk of amputation which should be taken into consideration when prescribing this agent
• These data suggest a favorable benefit/risk profile with canagliflozin treatment in many patients with type 2 diabetes and high cardiovascular risk

DOI: 10.1056/NEJMoa1611925

Acknowledgments
International Centers – Patients and PIs
We thank
• All the patients who volunteered to enroll in CANVAS and CANVAS-R
• The Principal Investigators in the 667 centers in 30 countries
We acknowledge the dedicated work involved to achieve the ultimate follow-up of 99.6% percent of the patients since first patient randomized in CANVAS in December 2009.
Acknowledgments (cont)
Independent Data Monitoring Committee
Philip Home (Chair)
Jeffrey Anderson
Ian Campbell
John Lachin (for early years)
Daniel Scharfstein
Scott D. Solomon
Robert G. Uzzo

Acknowledgments (cont)
Cardiovascular Adjudication Committee G. Fulcher (Chair) J. Amerena C. Chow G. Figtree J. French G. Hillis M. Hlatky B. Jenkins N. Leeper R. Lindley B. McGrath A. Street J. Watson
Renal Adjudication Committee G. Fulcher (Chair) S. Shahinfar T. Chang A. Sinha P. August Safety Adjudication Committees Fracture Adjudication: Bioclinica Diabetic Ketoacidosis Adjudication: Baim Institute for Clinical Research Pancreatitis Adjudication: A. Cheifetz (Chair) S. Sheth J. Feuerstein

Acknowledgments (cont)
CANVAS and CANVAS-R sponsors’ team (Janssen)
Mehul Desai (Steering Committee member)
Ngozi Erondu
Wayne Shaw
Gordon Law Support team
Kimberly Dittmar (MedErgy)
Lyndal Hones (George Clinical)
…and many others in this long and successful enterprise

Argentina: Pablo Arias, Maria Rosa Ulla, Andres Alvarisqueta, Laura Maffei, Jose Osvaldo Fretes, Silvia Gorban De Lapertosa, Virginia Visco, Georgina Sposetti, Javier Farias, Eduardo Francisco Farias, Maria Cecilia Cantero, Rodolfo Feldman, Maria Carolina Ridruejo, Pedro Calella, Cesar Zaidman; Australia: Stephen Stranks, Peak Man Mah, Alison Nankervis, Duncan Topliss, Georgia Soldatos, Richard Simpson, Murray Gerstman, David Colquhoun, Ferdinandus De Looze, Robert Moses, Michael Suranyi, Samantha Hocking, David Packham, Duncan Cooke, Karam Kostner; Belgium: Eric Weber, Chris Vercammen, Luc Van Gaal, Jozef Tits, Bart Keymeulen, Chantal Mathieu; Canada: Naresh Aggarwal, Dan Dattani, Francois Blouin, Richard Dumas, Sam Henein, Patrick Ma, Ali Najarali, Michael Omahony, Tracy Pella, Wilson Rodger, Daniel Shu, Vincent Woo, Brian Zidel, Lew Pliamm, Brian Ramjattan, Ronald Akhras, Jasmin Belle-Isle, Stuart Ross, Geza Molnar; Colombia: Juan Manual Arteaga, Ivonne Jarava; Czech Republic: Alena Andresova, Miloslava Komrskova, Cyril Mucha, Tomas Brychta, Dagmar Bartaskova, Romana Urbanova, Tomas Spousta, Jana Havelkova, Tomas Sedlacek, Milan Kvapil; Estonia: Ülle Jakovlev, Verner Fogel, Liina Viitas, Mai Soots, Maire Lubi, Marju Past, Jelena Krasnopejeva; Germany: Hasan Alawi, Klaus Busch, Felix Klemens Pröpper, Andrea Thron, Stephan Jacob, Andreas Pfützner, Ludger Rose, Thomas Segiet, Christine Kosch, Andrea Moelle; Great Britain: Melanie Davies, Hamish Courtney, Martin Gibson, Luigi Gnudi, Frances Game, John Wilding, Thozhukat Sathyapalan Miles Fisher Shenaz Ramtoola
Argentina: Marisa Vico, Sonia Hermida, Lucrecia Nardone, Laura Maffei, Javier Farias, Elizabeth Gelersztein, Maximiliano Sicer, Andres Alvarisqueta, Georgina Sposetti, Virginia Visco, Rodolfo Feldman, Silvia Orio; Australia: Christopher Nolan, Michael Suranyi, Samantha Hocking, Stephen Stranks, Duncan Cooke, Ferdinandus de Looze, Ashim Sinha, Timothy Davis, Anthony Russell, Acharya Shamasunder, Murray Gerstman, Richard MacIsaac; Belgium: Chris Vercammen, Luc Van Gaal, Chantal Mathieu, Xavier Warling, Jan Behets, Andre Scheen, Guy T’Sjoen, Ann Verhaegen, Isabelle Dumont, Youri Taes, Francis Duyck, Fabienne Lienart; Brazil: Adolfo Sparenberg, Adriana Costa e Forti, Andressa Leitao, Cariolina Jungers di Siqueira Chrisman, César Hayashida, Daniel Panarotto, Fabio Rossi dos Sanos, Fadlo Fraige Filho, Flávia Coimbra Maia, Gilmar Reis, Hugo Lisboa, Joao Felicio, Joselita Siqueira, Lilia Nigro Maia, Luiz Alberto Andreotti Turatti, Maria José Cerqueira, Maria Tereza Zanella, Patricia Muszkat, Miguel Nasser Hissa, Teresa Bonansea; Canada: Igor Wilderman, Vincent Woo, Richard Dumas, Francois Blouin, Pierre Filteau, George Tsoukas, Peter Milne, Dan Dattani, Chantal Godin, Michael Omahony, Daniel Shu, Jasmin Belle-Isle, Douglas Friars, Anil Gupta, Ted Nemtean, Andrew Steele; China: Zhan-Quan Li, Changsheng Ma, Linong Ji, Shuguang Pang, Yan Jing, Ruiping Zhao, Ruifang Bu; Czech Republic: Tomas Spousta, Tatana Souckova, Dagmar Bartaskova, Pavlina Kyselova, Lea Raclavska, Milan Kvapil, Jana Havelkova, Emilia Malicherova; France: Philippe Zaoui, Didier Gouet Jean-Pierre Courreges Salha Fendri Samy
CANVAS Investigators CANVAS-R Investigators