the bw and apo business solution succeeding in bw and apo demand planning integration
Post on 22-Dec-2015
222 views
TRANSCRIPT
The BW and APO Business Solution
Succeeding in BW and APO Demand Planning Integration
Introductions
Gary SuteraGary has been involved in multiple full-cycle SAP Business Information Warehouse and
APO Demand Planning implementations and has witnessed the evolution of the products first-hand. He has 5 years of ERP and data warehousing implementation experience and 10+ years of industry experience in plant management, sales, and material maintenance. He has also been involved in numerous business process improvement and data warehousing endeavors. He is certified in BW 2.0 and 3.0.
Gary is the Business Intelligence thought leader for CoreVal, developing strategies and solutions to aid clients in data storage and reporting initiatives. He is a member of APICS and has become a skilled Value Chain analyst drawing on his years as a plant manager in the Packaging Industry and his many software implementations.
He has written several industry white papers on the evolution of BW, and the utilization of BW as a data warehousing solution. He has also engaged in business development initiatives, including demonstrations and presentations at several industry conferences.
Introductions
Jack SpringerJack has been involved in ERP consulting for the last seven years, assisting clients in
determining the appropriate solutions that deliver return on investment. Previous consulting projects have involved Business Case and ROI Rationalizations, business strategic planning, acquisition and divestiture strategies, project planning and management throughout the full SAP implementation cycle, including strategic planning, analysis, design, development, and implementation.
Prior to consulting, Jack has over 15 years of experience as V.P. of Finance and CFO in the Discrete Manufacturing and Retail industry sectors. He has worked in multiple computing environments. He possesses extensive functional expertise in financial, manufacturing and distribution systems in a variety of industries, including medical products manufacturing, discrete, repetitive and process manufacturing, consumer products, distribution, and others.
Jack has led multiple business process reengineering activities and ROI Rationalizations for initiatives during his career within industry and consulting. In Q1 of 2002, he was the featured speaker in the “Achieve Tangible Returns on Investment’ Summit, held in ten cities across the United States. This Summit was sponsored by Microsoft, HP and SAP.

Agenda
• IntroductionsIntroductions• State of Supply Chain AmericaState of Supply Chain America• Version and integration enhancements for
BW and APO• Case study
– Real Life Client Improvements – Alignment of Strategic Objectives to ROIC
Model • Questions and Answers

The Opportunity
Succeeding in BW and APO Demand Planning Integration
Optimized Plant and Supplier Scheduling Optimized Plant and Supplier Scheduling
BusinessPlanningBusinessPlanning
Transportation Planning &Scheduling
Transportation Planning &Scheduling
ExecuteExecute
Sales & Ops Planning
DP Master
Scheduling
Demand/Supply
Network
Optimization
Production Planning
Business Opportunities
DistributeDistribute
ServiceService
Collect CashCollect Cash
• Integration from business plan to collection of cash
• Integration of business processes into SAP tool
Integrated, Aligned Collaborative Technology Tools
• Lower costs
• Customer satisfaction
• Correct inventories
• Process improvement
• Best Practices
• Enhanced forecast accuracy

State of Many Organizations
Succeeding in BW and APO Demand Planning Integration
Optimized Plant and Supplier Scheduling Optimized Plant and Supplier Scheduling
BusinessPlanningBusinessPlanning
Transportation Planning &Scheduling
Transportation Planning &Scheduling
ExecuteExecute
Sales & Ops Planning
DP Master
Scheduling
Demand/Supply
Network
Optimization
Production Planning
DistributeDistribute
ServiceService
Collect CashCollect Cash
Excel Spreadsheets
SAP Core R/3
Pla
nt T
ools
Legacy Systems
Access Databases
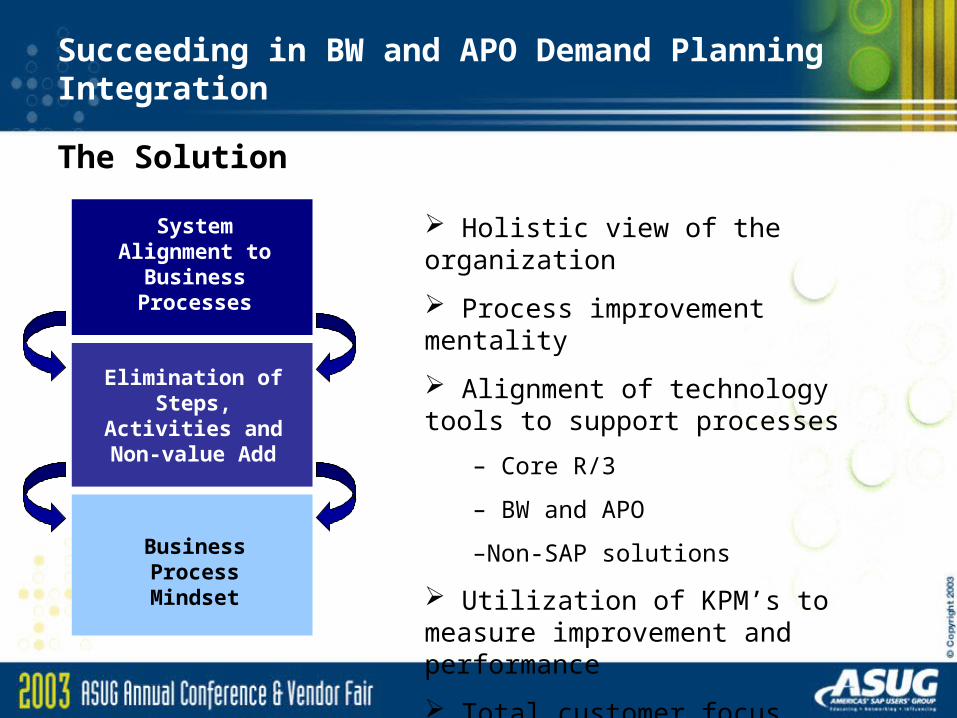
The Solution
Succeeding in BW and APO Demand Planning Integration
Holistic view of the organization
Process improvement mentality
Alignment of technology tools to support processes
– Core R/3
– BW and APO
–Non-SAP solutions
Utilization of KPM’s to measure improvement and performance
Total customer focus
Business Process Mindset
Elimination of Steps,
Activities and Non-value Add
System Alignment to
Business Processes

Agenda
• Introductions• State of Supply Chain America• Version and integration Version and integration
enhancements for BW and APOenhancements for BW and APO• Case study
– Real Life Client Improvements – Alignment of Strategic Objectives to ROIC
Model • Questions and Answers
Succeeding in BW and APO Demand Planning Integration
Show of Hands:• Looking to implement both BW and APO• Have implemented BW; looking at APO• Have implemented APO; looking at full BW• Have implemented both APO and BW; looking to
improve
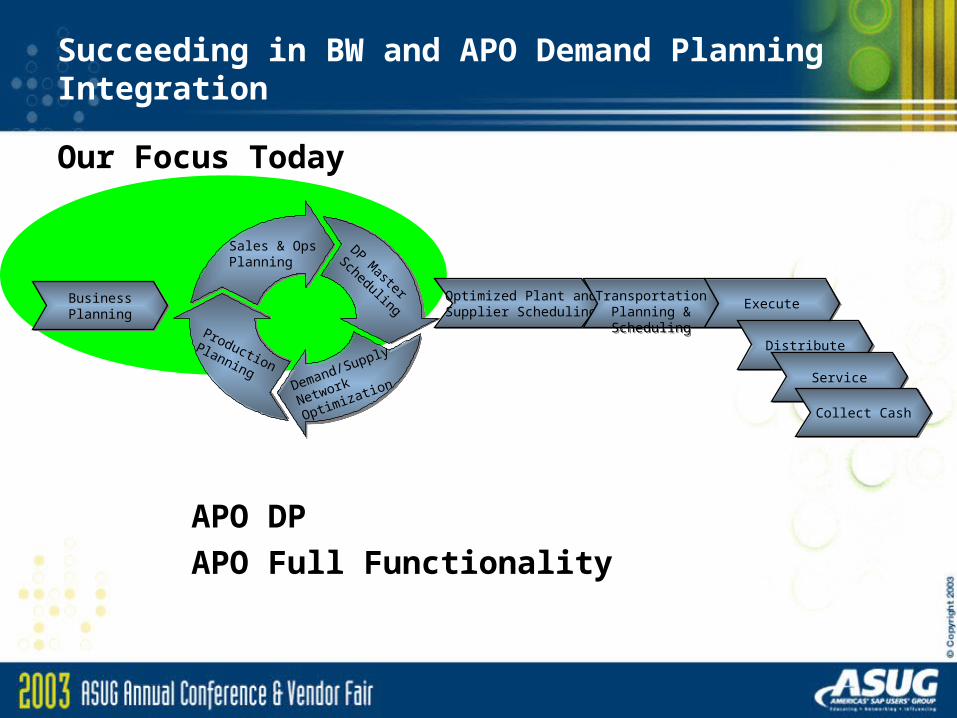
Our Focus Today
Succeeding in BW and APO Demand Planning Integration
Optimized Plant and Supplier Scheduling Optimized Plant and Supplier Scheduling
BusinessPlanningBusinessPlanning
Transportation Planning &Scheduling
Transportation Planning &Scheduling
ExecuteExecute
Sales & Ops Planning
DP Master
Scheduling
Demand/Supply
Network
Optimization
Production Planning
DistributeDistribute
ServiceService
Collect CashCollect Cash
APO DP
APO Full Functionality

Succeeding in BW and APO Demand Planning Integration
Application Overview
SAP BW:• Business Information Warehouse• Part of SAP’s Business Intelligence suite, along
with SAP Enterprise Portal
SAP APO DP:• Advanced Planner and Optimizer; Demand
Planning• Part of SAP’s Supply Chain Management suite,
including all other APO modules (SNP, PP/DS, TLB, TP/VS, gATP), Inventory Hub, and Event Manager modules

Succeeding in BW and APO Demand Planning Integration
BW 2.0B
BW 2.1C
APO 3.0 (BW 2.0B)
BW 3.0A
BW 3.0B
X
X
X
X
X
X
X
X
X
X
X
X
APO 3.1 (BW 2.1C)
SCM 4.0 (BW 3.0B)
Integrated Compatibility
BW 3.1 Content X X X
Beginning with BW 2.0B, a stand-alone BW solution integrates with APO 3.0 and later versions
Succeeding in BW and APO Demand Planning Integration
BW 2.0B
BW 2.1C
APO 3.0
BW 3.0A
BW 3.0B
X X
X
X
X
X
X
APO 3.1 SCM 4.0
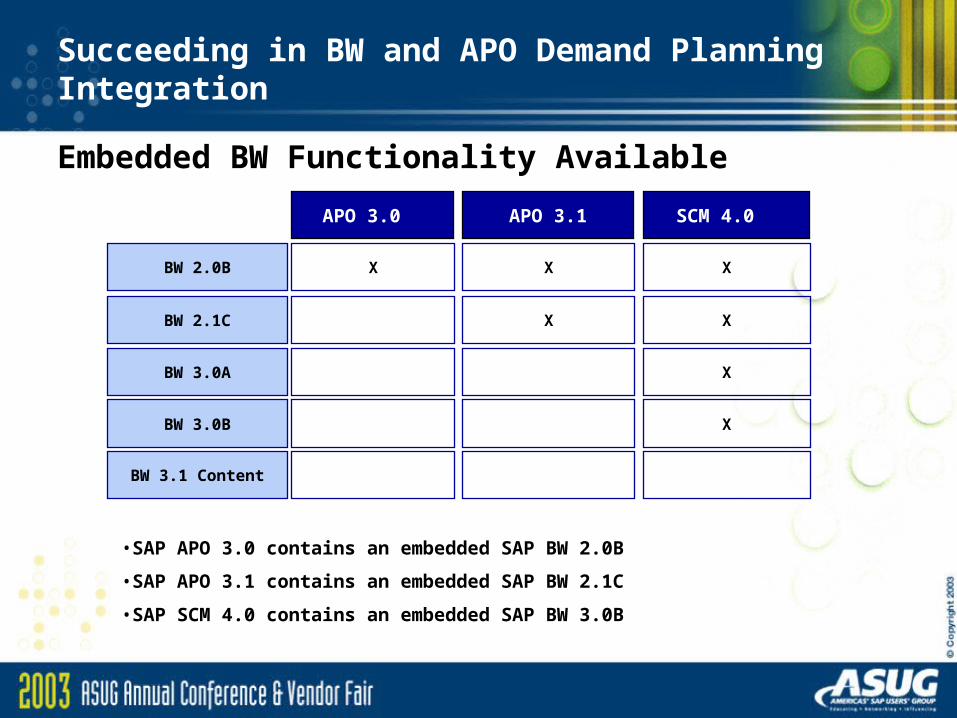
Embedded BW Functionality Available
BW 3.1 Content
•SAP APO 3.0 contains an embedded SAP BW 2.0B
•SAP APO 3.1 contains an embedded SAP BW 2.1C
•SAP SCM 4.0 contains an embedded SAP BW 3.0B

Succeeding in BW and APO Demand Planning Integration
Application EnhancementsSAP BW:• More robust integration with other SAP solutions• Better data management capabilities
– DB Connect– Open Hub
• Improved data optimization tools• Improved data presentation tools
SAP APO DP:• More robust automated forecasting tools• Collaborative forecasting• Improved use of BW functionality for demand planning

Succeeding in BW and APO Demand Planning Integration
Example of Aggregated Forecasting

Succeeding in BW and APO Demand Planning Integration
Integration Enhancements and Benefits:• Integrated data warehousing• Combination of structured and unstructured reporting• Quicker time to information• Quicker turn-around of demand plan to production plan• Faster S&OP process cycles• Streamlined business processes• Improved organizational communication• Data consistency• Web-enabled reporting
Succeeding in BW and APO Demand Planning Integration

Succeeding in BW and APO Demand Planning Integration
Succeeding in BW and APO Demand Planning Integration
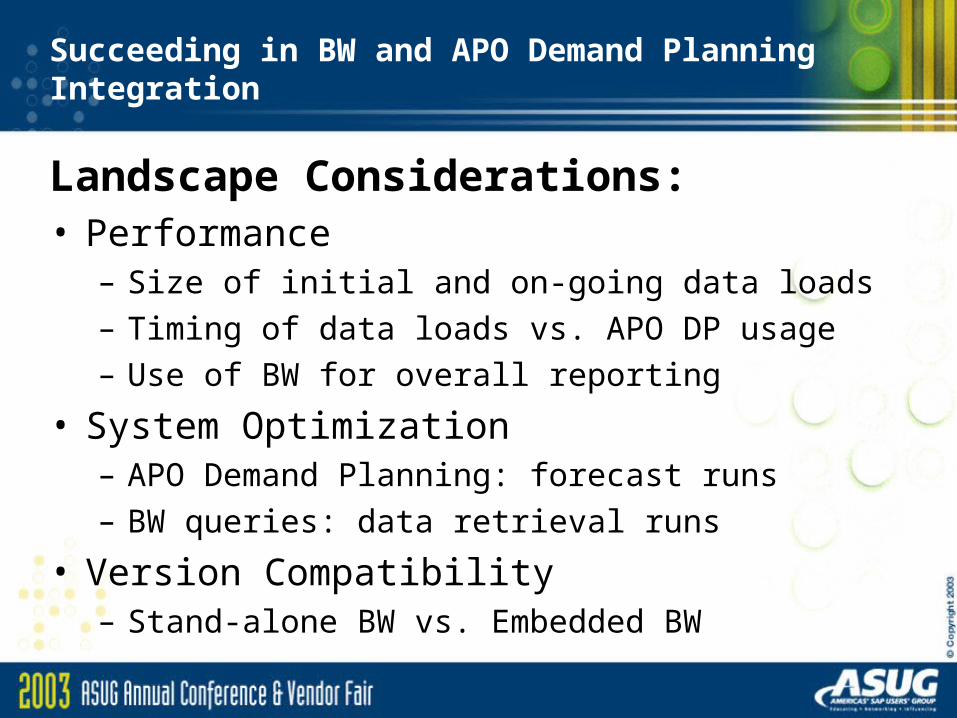
Landscape Considerations:• Performance
– Size of initial and on-going data loads– Timing of data loads vs. APO DP usage– Use of BW for overall reporting
• System Optimization– APO Demand Planning: forecast runs– BW queries: data retrieval runs
• Version Compatibility– Stand-alone BW vs. Embedded BW

Agenda
• Introductions• State of Supply Chain America• Version and integration enhancements for
BW and APO• Case studyCase study
– Real Life Client Improvements – Alignment of Strategic Objectives to ROIC
Model • Questions and Answers

Succeeding in BW and APO Demand Planning Integration
Client Situation• It takes 2 weeks of each month to get through the Sales &
Operations Planning process• 7 plants, each doing their own forecasting, using
independent methodologies• Legacy mainframe, Access DB, and Excel are being utilized for
forecasting process• Many one-time reports are being created, with no regulation• No integrated data between sales history and forecasts• Each product line’s sales rep is updating their own
forecasts, with no consideration to common sub-products
• Excel forecasts are e-mailed into central location from individual sales reps
• No automated forecast tools are being utilized

Succeeding in BW and APO Demand Planning Integration
As-is Application Landscape:
PlantsLegacy Mainframe
Sales
repsE-mail
Demand PlannersE-mail
Plants
Demand Planners E-mail
Sales
reps
Excel
Access DB

Succeeding in BW and APO Demand Planning Integration
Client Objectives• Cut S&OP process cycle time from 2 weeks to 1 ½ weeks• Consolidate forecasting of 7 plants into centralized
department – top down forecasting• Integrate current sales data with sales history• Automatically account for promotions in forecasting• Measure forecast accuracy against history• Implement a forecast model that takes trend analysis and
seasonality into account• Automatically publish demand plans to OLTP MRP and
production planning• Develop web reporting on company intranet of demand plan
versions, for sales rep updating

Succeeding in BW and APO Demand Planning Integration
Solutions: driving a true picture of sales forecasting
• S&OP process cycle time cut from 10 days to 6 days• Each plant uses APO DP interactive planning within an
individual planning book, saved to liveCache• BW MultiCube is used to integrate current sales data, historical
sales data, and different versions of forecasts– Reports created to measure forecast accuracy and forecast trends,
with running timelines that point out seasonal trends• APO DP promotion functionality used• Central demand plan is automatically sent from liveCache to
R/3 MRP module• Executive-level reporting developed that highlights forecast
accuracy• Exception reports are sent to each plant that highlight cross-
plant forecasts of common products

Succeeding in BW and APO Demand Planning Integration
New Application Landscape:BW APO
Interactive Demand Planning
Plant specific planning books
Reporting
R/3 Source System
Sales data
Plan data
MultiCube
Sales data
Reporting
Sales rep updates
Reporting
Unconstrained Forecast
Plants Sales
reps
Flat FileSales History On-going Sales
Demand Planners
Succeeding in BW and APO Demand Planning Integration
OptimizeCash Flow
Foundation for Global,Integrated DW Environment
Optimize the S&OP Process
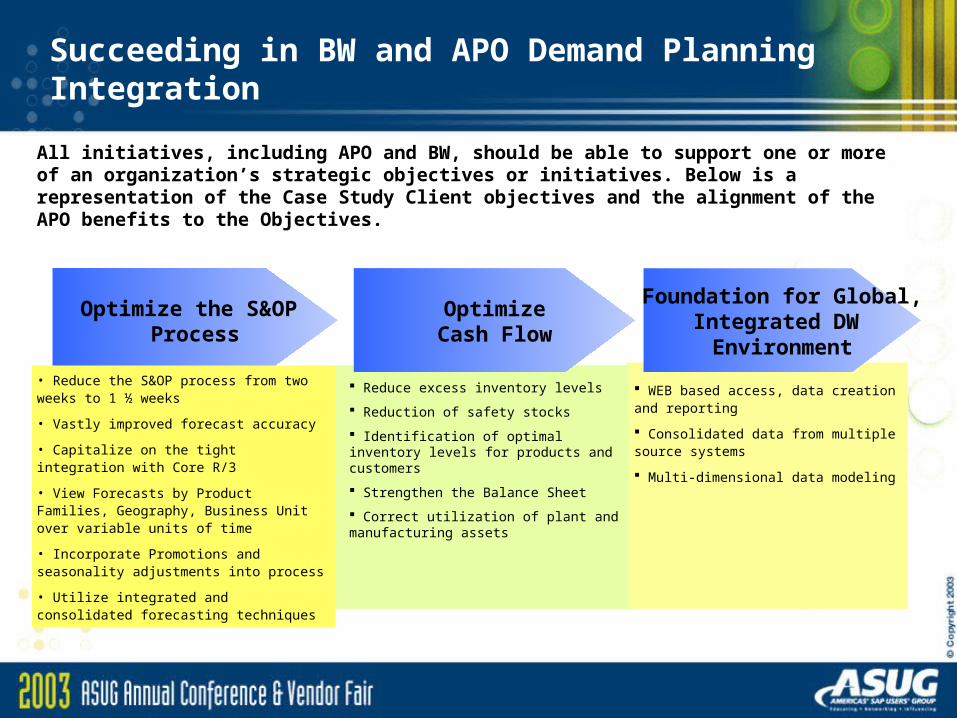
All initiatives, including APO and BW, should be able to support one or more of an organization’s strategic objectives or initiatives. Below is a representation of the Case Study Client objectives and the alignment of the APO benefits to the Objectives.
• Reduce the S&OP process from two weeks to 1 ½ weeks
• Vastly improved forecast accuracy
• Capitalize on the tight integration with Core R/3
• View Forecasts by Product Families, Geography, Business Unit over variable units of time
• Incorporate Promotions and seasonality adjustments into process
• Utilize integrated and consolidated forecasting techniques
Reduce excess inventory levels
Reduction of safety stocks
Identification of optimal inventory levels for products and customers
Strengthen the Balance Sheet
Correct utilization of plant and manufacturing assets
WEB based access, data creation and reporting
Consolidated data from multiple source systems
Multi-dimensional data modeling
Succeeding in BW and APO Demand Planning Integration
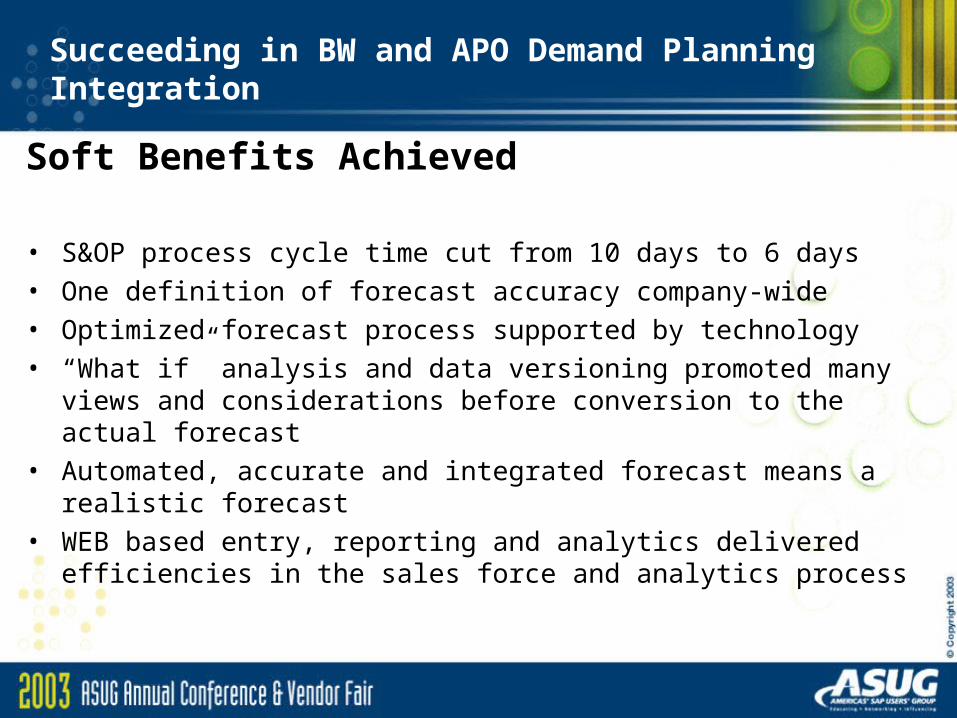
Soft Benefits Achieved
• S&OP process cycle time cut from 10 days to 6 days• One definition of forecast accuracy company-wide• Optimized forecast process supported by technology• “What if” analysis and data versioning promoted many views
and considerations before conversion to the actual forecast• Automated, accurate and integrated forecast means a realistic
forecast• WEB based entry, reporting and analytics delivered efficiencies
in the sales force and analytics process

Succeeding in BW and APO Demand Planning Integration
Invested Capital
Net Working Capital
Net PP&E
ROIC
Profit
Revenue
CostsSG&A
COGS
Inventories
Strategic Objectives: Optimize the S&OP Process
Optimize Cash Flow
Foundation for Global, Integrated DW Environment
Demand

Succeeding in BW and APO Demand Planning Integration
Demand
Enabling Technologies ResultsMetrics Rationale
Constraints
BusinessProcess Enabler
SG&A
Increased revenue through increased customer fill rates and reorders
Forecast Accuracy measurement
Elimination of headcount
Interest Expense
Legacy maintenance fees
APO DP BW
APO DP BW
Forecasting Order
Fulfillment
Forecasting
Extraordinary demand variation
Forecast accuracy increased needed available inventory resulting in higher fill rates of 4% and average reorder cycle improvement of 16 days
Promotion functionality enabled more correct inventory builds for revenue spikes
Increased revenue of $9.6 million @ 32% margin generated realizable ROI of $3,072,000
Consolidated forecasting techniques will allow a centralized concept of forecasting, eliminating the need for personnel at all seven plants
Reduction of interest on inventory borrowing
Elimination of legacy forecasting & reporting
Elimination of (3) headcount (loaded) generates annual reduction of $215,000
Formula of 50% availability on inventory @ 7% = $238,000
Elimination of fees & support of $82,000
Execution of redefined, centralized forecasting process

Succeeding in BW and APO Demand Planning Integration
COGS
Enabling Technologies ResultsMetrics RationaleConstraints
BusinessProcess Enabler
Inventories
Material cost & variance
Labor cost & variance
Expedited transportation costs (incoming)
Inbound freight/material acquisition costs
Inventory days of supply (Product, Group, Customer)
Inventory obsolescence
Material overstock Forecast accuracy
APO DP BW
APO DP BW
Forecasting Order
Fulfillment (Make)
Forecasting
False trends Promotion, trend analysis and seasonality functionality enabled planning and smoothing of production schedules reducing “surprise demand”. Expedited materials and packaging were reduced and O/T and outsource labor were reduced.
Decrease in raw material premiums and price variances of $380,000
Reduction of excess demand generated overtime and outsource premiums of $178,000
Expedited inbound freight costs were reduced by $20,000
Improved forecasting and demand planning resulted in decreased safety stocks carried by some plants
Significant reduction of obsolescence
Rationalization of inventory by product and customer
Net inventory reduction of 9% representing $6.8 million
Offline systems and processes
Change management required to trust and use new system

Succeeding in BW and APO Demand Planning Integration
DemandDemand
SG&ASG&A
InventoryInventory
S&OP Cash FlowDW
Foundation
$3,072,000 $0 $0 $3,072,000
$215,000 $238,000 $82,000 $535,000
$0 $6,800,000 $0 $6,800,000
$10,985,000$3,865,000 $7,038,000 $82,000
ROI Summary
COGSCOGS $578,000 $0 $0 $578,000
Strategic Objectives

Thank you for attending!Please remember to complete and return your evaluation form following this session.
Session Code: [204]