the burden of oral disease in oregon · the burden of oral disease in oregon: • deborah cateorah...
TRANSCRIPT

The Burden of Oral Disease in Oregon
Oregon Department of Human ServicesPublic Health Division
November 2006


To the people of Oregon:
I am pleased to present Oregon’s Burden of Oral Disease document. This publication is a comprehensive presentation of the status of oral disease and factors affecting the oral health of Oregonians throughout their lifespan. The data and information presented attempts to explain the links between oral disease, general health, quality of life and well being.
Oral disease is major health concern affecting all Oregonians. Oral diseases are often called a neglected epidemic, because they affect virtually the entire population and they are often not been identified as a priority.
The conditions that lead to oral disease can start even before birth and last throughout one’s life. As a chronic condition, oral disease lasts an entire lifetime. Emerging evidence points to a strong link between oral diseases and many medical conditions and poor health outcomes. While we commonly think of dental disease as separate, what affects the mouth affects the entire body. It is not possible to have a healthy body with an unhealthy mouth. Oral health is integral to general health.
The good news is that oral disease is preventable. As highlighted by the Conclusions section of this document, many strategies can be implemented to address the pervasive, chronic condition of oral disease. Action requires an understanding of the condition, and I hope that this Burden of Oral Disease document will provide a comprehensive overview of the problems with oral health in Oregon and suggest what we can do about them. The solutions to the burden of oral disease lies in the collaborations and partnerships of government agencies and officials, private industry, foundations, consumer groups, health professionals, educators, and researchers to address the problem.
I thank everyone who contributed to this Burden Document and invite all stakeholders, advocates and partners in oral health to join me in improving the oral health or all Oregonians.
Gordon Empey D.M.D., M.P.H.Dental Health Consultant to the Office of Family Health-Oral Health Program

This document represents the contributions of a wide variety of stakeholders and partners throughout the state of Oregon and the United States. In particular, the following persons should be acknowledged for their contributions:
The Oregon Oral Health Advisory Board (OHAB)Nancy Abrams Patrick Braatz Leslie CurrinDonalda Dodson Beryl Fletcher Val HaynesKyle House Bob Johnson Tom PollardSue Sanzi-Schaedel Kristen Simmons
In particular, the Data Work Sub-Group of OHAB, who made significant contributions in the early phases of identifying data sources to describe
the burden of oral disease in Oregon:• Deborah Cateorah (former OHAB member)• Val Haynes• Sue Sanzi-Schaedel
Beth Hines, RDH, MPH , The Centers for Disease Control and Prevention Project Officer for Oregon, for her guidance and encouragement.
Chronic Disease and Condition Programs within the State Public Health Division of the Oregon Department of Human Services:
• Diabetes Program• Tobacco Prevention and Education• Acute and Communicable Disease Prevention• Heart Disease and Stroke Prevention Program• State Cancer Registry• Center for Health Statistics
The Office of Family Health - Oral Health Program Staff:• Gordon Empey, DMD MPH • Shanie Mason, MPH• Carol Dobrovolny, BFA• Dave Anderson, MA• Andrew Osborn, MBA
To these and everyone who contributed to this document, thank you!
This effort was made possible in part by funding from The Centers for Disease Control and Prevention, Division of Oral Health, Cooperative Agreement 03022.
“Dental . . . disease is not eradicated, but only controlled. . .” —World Health Organization (WHO)
Acknowledgements

Table of Contents
Oregon’s Silent Epidemic .............................................1 Introduction ...............................................................3National and State Oral Health Objectives ....................5Pregnant Women and Infants .....................................10Children and Pre-Teens ............................................. 12Adolescents .............................................................. 15Adults ...................................................................... 18Older Adults .............................................................21Disparity: Racial and Ethnic....................................... 23Disparity: Income ..................................................... 25Prevention: Fluoride .................................................. 27Prevention: Dental Sealants ...................................... 28Issue Focus: Oral Cancer .........................................30Workforce Capacity and Diversity ...............................31In Conclusion ........................................................... 32Appendix 1: References ............................................ 37Appendix 2: Data Sources ........................................40
“The mouth reflects general health and well being.”
Surgeon General Carmona

Fewer than half the women in our state seek needed dental care during pregnancy and only one-third receive education on how to care for their infant’s teeth.
1
The majority of Oregonians – poor or rich, female or male, old or young, what-ever their race or ethnicity – suffer from oral disease:
• The mouth is a vital organ and good oral health contributes to good overall health. Oral health refers to the health of teeth, gums, hard and soft palate, linings of the mouth and throat, tongue and lips, salivary glands, chewing muscles, and upper and lower jaws.
• Oral disease compromises our ability to thrive and, left untreated, brings pain, lowers productivity, and increases our risk for other diseases.
• Oral health is also compromised by other diseases. Often the condition of the mouth is the first indicator of problems elsewhere.
• Good oral health is comprehensive: daily home care, regular professional dental care, fluoridation, a healthy low sugar diet, avoidance of tobacco, and protection from injury.
• Fewer than half the women in our state seek needed dental care during pregnancy and only one-third receive education on how to care for their infant’s teeth.
• Among children, oral disease is five times more common than asthma.
• Between one-quarter and one-third of all Oregonians do not visit the dentist at least annually (semi-annual visits are recommended).
• Twenty-two of Oregon’s 36 counties (61%) endure some type of shortage of dental professionals.
• Only 1-in-5 Oregonians live in a community with an optimally-fluoridated water supply.
This report is the first-ever report on the burden of oral disease in Oregon. It is consistent with the Surgeon General’s Report on Oral Health (May, 2000). It highlights the often overlooked oral health needs of Oregon residents, links oral health to overall health, and seeks to foster a broader understanding of the im-portance of good oral health care to every person.
Oregon’s Silent Epidemic

2
vital for sustaining our health
essential for good nutrition
how we communicate
the way we present ourselves
The mouth is the gateway to our bodies

3
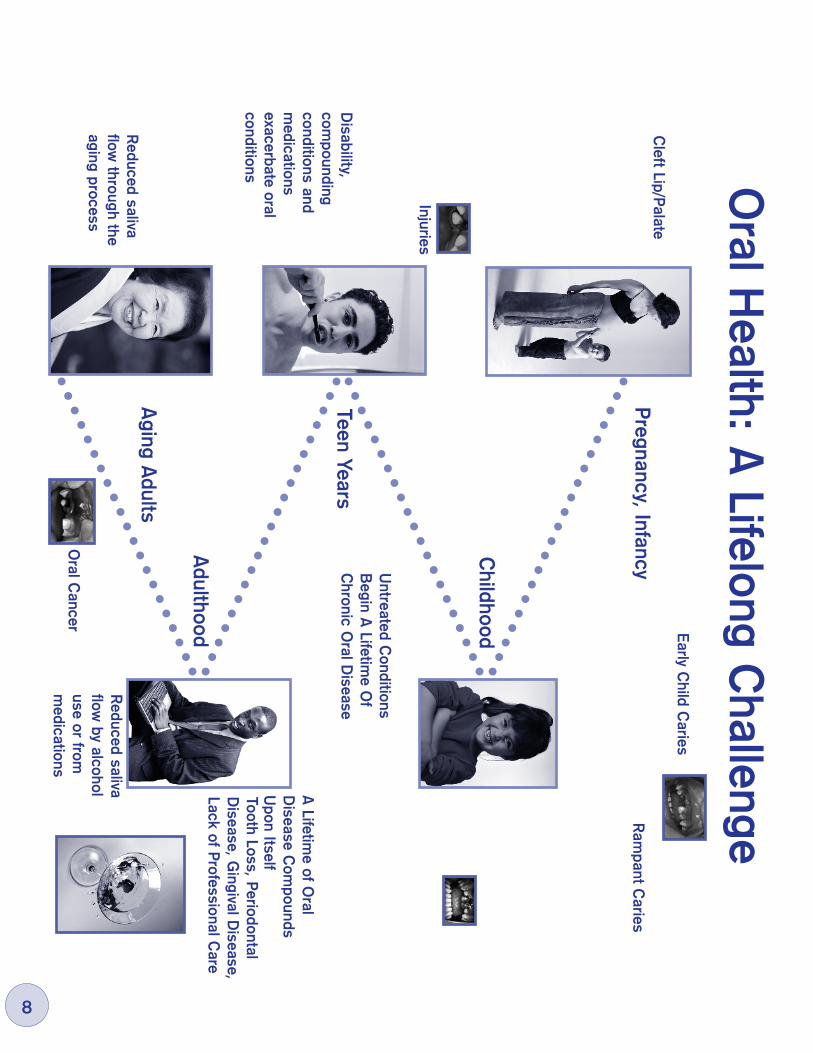
IntroductionWhat lies behind a healthy smile? Far more than is commonly thought. This vital organ – the mouth – is the gateway to our bodies. Oral health is vital for sustaining our health, to getting good nutrition, how we communicate and how we appear to others. Oral disease often brings disabling pain and compromises our ability to thrive in life. Untreated oral disease impacts not only our general health but also our productivity at work or school. Over time, oral disease be-comes more complex, compounds upon itself and worsens.
Mounting evidence shows that untreated infections in the mouth worsen heart and respiratory conditions, and auto-immune diseases such as AIDS. They can put pregnant women at risk for premature delivery, and can complicate the con-trol of blood sugar for people living with diabetes.
Conversely, general disease can decrease the health of the mouth. Oral tissues turn over cells rapidly and the mouth endures a constant onslaught of bacteria. Due to these conditions, changes in the mouth are often the first indicators of problems elsewhere in the body, problems such as infectious disease, immune disorders, nutritional deficiencies or cancer.
Oral health refers to the health of the entire mouth: teeth, gums, hard and soft palate, the linings of the mouth and throat, the tongue and lips, salivary glands, chewing muscles and upper and lower jaws. A healthy mouth is essential to a healthy body.
Good oral health requires a comprehensive approach to prevention that includes optimally fluoridated water or fluoride supplementation, regular access to pro-fessional dental care, proper daily home care and a nutritious diet that is low in sugar. To improve the oral health of all Oregonians, an equally comprehensive effort on the part of individuals, communities and dental and medical profession-als will be necessary. The goals of this publication are to:
• Summarize the most current information available on oral disease in Oregon;
• Highlight the importance of good, total oral health; and• Highlight oral health disparities.
A Word About Data:
Throughout this document, the best available data are drawn from a wide variety of sources. Data comparisons in this Burden Document are made for illustrative purposes.
Appendix II of this document contains a discussion about data sources, as well as source citations for each graph and table element. A Glossary of Data-Related Acronyms is also provided.
4
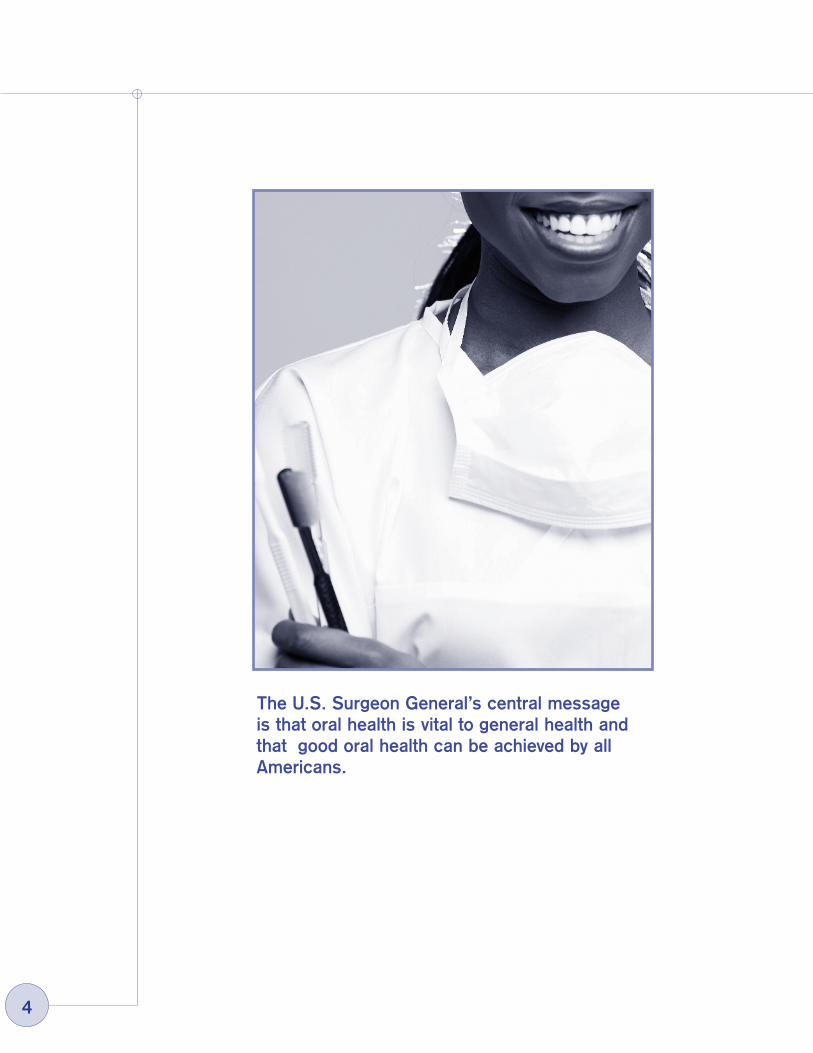
The U.S. Surgeon General’s central message is that oral health is vital to general health and that good oral health can be achieved by all Americans.
5
National and State Oral Health Objectives
Oral disease is beginning to get noticed. In May 2000, the U.S. Surgeon General issued Oral Health in America: A Report of the Surgeon General. The report calls for a national oral health plan to better life for all Americans through im-proved oral health and the elimination of oral health disparities such as race and ethnicity, socio-economic status, disability and age. The central message of the report is that oral health is vital to general health and that can be achieved by all Americans. A key component of improving oral health is to have measurable targets for improvement. Healthy People 2010 (HP2010) is a set of national health objec-tives that includes goals for oral health. The objectives were developed through a broad consultation process and built on the best scientific knowledge available. They also expanded upon the 1979 Surgeon General’s report, Healthy People, and Healthy People 2000: National Health Promotion and Disease Prevention Ob-jectives. Through these, a national system of health objectives was established.
HP2010 furthers the establishment of health objectives and serves as the basis for the development of state and community plans. The HP2010 goals for oral health (listed in Table 1a) serve as the benchmark for measuring the burden of oral disease in the United States. (For a web link to a complete list of all HP2010 goals, including all oral health goals, refer to the HP2010 citation in Appendix II: Data Sources.)
Availability of Data in Oregon
Currently, the Oregon Oral Health Surveillance System (OOHSS) incorporates more than half of HP2010 measures for oral health, along with many other mea-sures. Consistent with the Surgeon General’s Report, the Oregon Health Ser-vices’ Oral Health Program is committed to illustrating and addressing the oral health needs of Oregon residents.
The ability to expand surveillance to the full set of measures will require addi-tional oral health infrastructure, including funding and access to data. It is the primary goal of the Oregon Oral Health Program to create a strong oral health infrastructure and build upon existing capacity and the Oral Health Pro-gram is exploring opportunities specifically related to surveillance.

6
Table 1a: HP2010 Oral Health Indicators
Incidence in Percent
Incidence of: HP2010 USa OregonDental caries* (tooth decay) experience: % % % Children, ages 6-8 42 50 56i
Adolsecents, age 15 51 59 69p
Untreated caries (tooth decay) Children, ages 6-8 9 20 24i
Adults with no tooth loss, ages 35-44 42 39 33j
Endentulous (toothless) older adults, ages 65-74 20 25b 16j
Orapharyngeal cancer death rate reduced 2.7 3d* 2k**
Oral and pharyngeal cancers detected at the earliest stages 50 35e 51k
Dental sealants Children, age 8 (1st molars) 50 28 32i
Population served by fluoridated water systems 75 68b 20l
Low-income children and adolescents receiving preventive dental care during past 12 months, ages 0-18 57 31f 13m
System for recording and referring infants and children with cleft lip and cleft palate 100 23g Yn
Oral health surveillance system 100 DNA Yo
* Caries describes tooth decay that can lead to and include cavities
** The measure of temporal changes in mortality is complicated by changing disease definitions
DNA = Data Not Analyzed
7
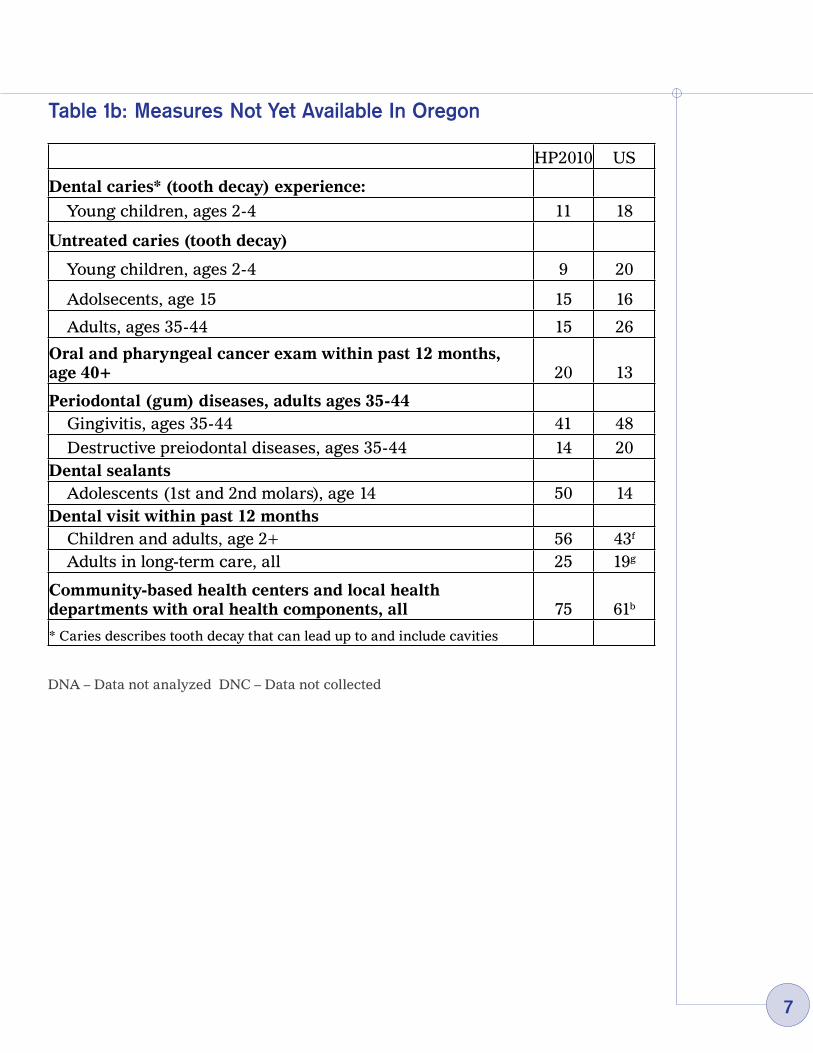
Table 1b: Measures Not Yet Available In Oregon
DNA – Data not analyzed DNC – Data not collected
HP2010 US
Dental caries* (tooth decay) experience:
Young children, ages 2-4 11 18
Untreated caries (tooth decay)
Young children, ages 2-4 9 20
Adolsecents, age 15 15 16
Adults, ages 35-44 15 26
Oral and pharyngeal cancer exam within past 12 months, age 40+ 20 13
Periodontal (gum) diseases, adults ages 35-44 Gingivitis, ages 35-44 41 48
Destructive preiodontal diseases, ages 35-44 14 20Dental sealants Adolescents (1st and 2nd molars), age 14 50 14Dental visit within past 12 months Children and adults, age 2+ 56 43f
Adults in long-term care, all 25 19g
Community-based health centers and local health departments with oral health components, all 75 61b
* Caries describes tooth decay that can lead up to and include cavities
8
Oral H
ealth: A Lifelong C
hallenge
Pregnancy, Infancy
Childhood
Teen Years
Adulthood
Aging A
dults
Reduced saliva
flow by alcohol
use or from
medications
Disability,
compounding
conditions and m
edications exacerbate oral conditions
Cleft Lip/P
alate
Untreated C
onditions B
egin A Lifetim
e Of
Chronic O
ral Disease
Tooth Loss, Periodontal
Disease, G
ingival Disease,
Lack of Professional C
are
A Lifetim
e of Oral
Disease C
ompounds
Upon Itself
Oral C
ancer
Ram
pant Caries
Injuries
Early C
hild Caries
Reduced saliva
flow through the
aging process
�
The
Pric
e of
Poo
r O
ral H
ealth
Unt
reat
ed too
th d
ecay
ser
ious
ly
affe
cts
norm
al g
row
th, ab
ility
to
lear
n,
and
failu
re to
thriv
e in
chi
ldre
n.
16,0
00
sch
ool h
ours
lo
st in
Ore
gon
due
to
dent
al p
ain
or v
isits
.
» A
ltere
d A
ppea
ranc
e»
Alte
red
Spe
ech
» Poo
rer
Eat
ing/
Nut
ritio
n»
Low
er S
elf-
Est
eem
» R
educ
ed S
ocia
l Int
erac
tion
» S
ocia
l Iso
latio
n»
Low
er C
aree
r A
chie
vem
ent
» E
mpl
oym
ent B
arrie
r»
Poo
rer
Sle
ep P
atte
rns
164
mill
ion
wor
k ho
urs
lost
in
U.S
. du
e to
ora
l hea
lth
prob
lem
s or
den
tal v
isits
.
Poo
r or
al h
ealth
car
e an
d de
ntal
pro
blem
s du
ring
preg
nanc
y ca
n le
ad to
oral
hea
lth p
robl
ems
and/
or
low
bir
th w
eigh
ts a
mon
g ne
wbo
rns.
Dec
ay-c
ausi
ng o
ral b
acte
ria a
re
pass
ed to
child
ren
by c
areg
iv-
ers
(prin
cipa
lly the
mot
her)
.
Ora
l dis
ease
has
bee
n as
soci
ated
with
sys
tem
ic
infe
ctio
ns, as
soci
ated
with
man
y ch
roni
c co
ndi-
tions
suc
h as
res
pira
tory
pro
blem
s an
d he
art
dise
ase.
Poor
ora
l hea
lth s
igni
fican
tly
wor
sens
con
ditio
ns s
uch
as
diab
etes
, can
cer
and
HIV
.
Dis
ablin
g pa
in fo
r m
illio
ns o
f A
mer
ican
s
Trea
ting
oral
dis
ease
can
cos
t up
to
73 tim
es m
ore
than
pr
even
tion
and
dela
yed
trea
tmen
t le
ads
to m
uch
high
er
cost
s, s
omet
imes
incl
udin
g ho
spita
lizat
ion
and
surg
ery.
10
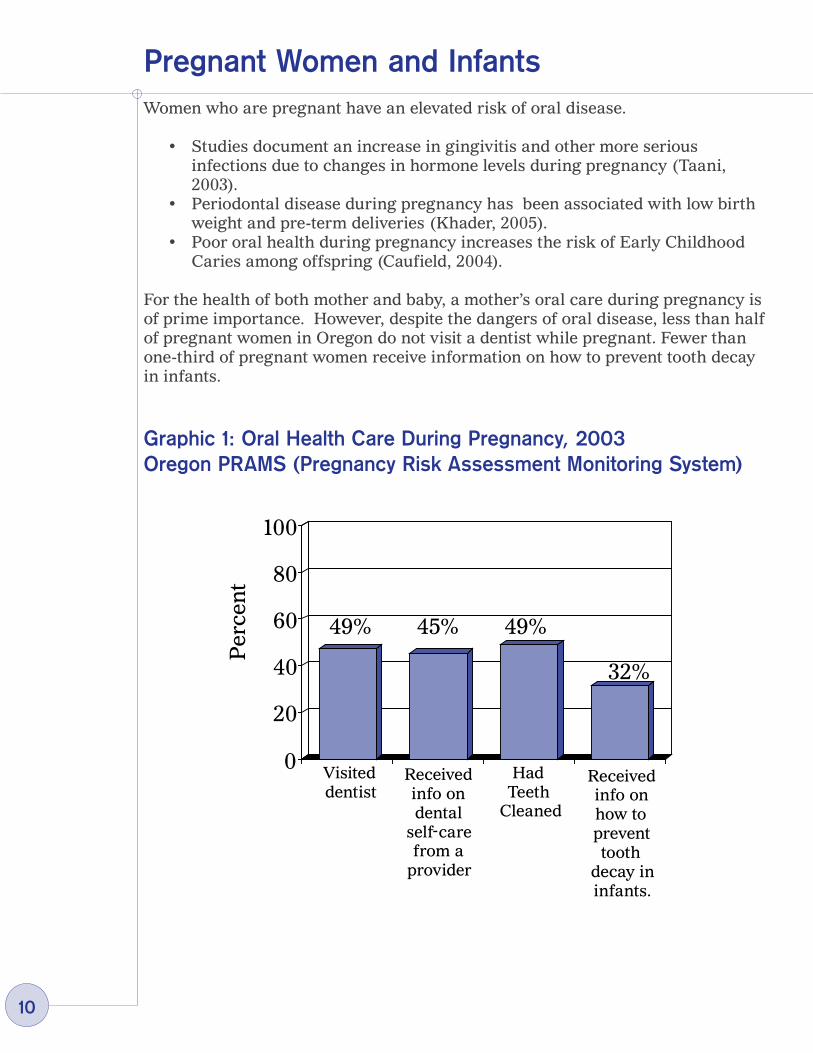
Women who are pregnant have an elevated risk of oral disease.
• Studies document an increase in gingivitis and other more serious infections due to changes in hormone levels during pregnancy (Taani, 2003).
• Periodontal disease during pregnancy has been associated with low birth weight and pre-term deliveries (Khader, 2005).
• Poor oral health during pregnancy increases the risk of Early Childhood Caries among offspring (Caufield, 2004).
For the health of both mother and baby, a mother’s oral care during pregnancy is of prime importance. However, despite the dangers of oral disease, less than half of pregnant women in Oregon do not visit a dentist while pregnant. Fewer than one-third of pregnant women receive information on how to prevent tooth decay in infants.
Graphic 1: Oral Health Care During Pregnancy, 2003 Oregon PRAMS (Pregnancy Risk Assessment Monitoring System)
Pregnant Women and Infants
49% 45% 49%
Per
cen
t
Visited dentist
Received info on dental
self care from a
provider
Had Teeth
Cleaned
Received info on how to prevent tooth
decay in infants.
32%
0
20
40
60
80
100
-
11
Early Childhood Cavities (ECC)
At around six months of age the first teeth come in. The new tooth covering, or enamel, is immediately susceptible to decay. Although baby teeth are eventually replaced with permanent teeth, the health of baby teeth have a profound effect on the natural development of the mouth.
• Baby teeth serve as placeholders for permanent teeth.• Baby teeth aid in proper jaw formation and speech development. • Oral pain can prevent a child from getting proper nutrition.
ECC is caused by a bacteria in the mouth. The bacteria are transmitted from the primary caretaker to the child. About 5%-10% of children who are at risk for ECC already have detectable bacteria in their mouths by age one. The bacteria attack exposed enamel and cause ECC if left unchecked. Prevention of ECC begins at home with care of the infant’s mouth and teeth. Ear-ly visits to the dentist are important in arresting the progress of ECC. The Amer-ican Association of Pediatric Dentists recommends an oral health assessment as soon as the first tooth erupts (AAPD). Delays in dental care for infants can lead to oral disease at an earlier age. The earlier oral disease begins, the greater the chance it has of causing and contributing to poorer lifelong oral health. Currently, no statewide data exists on the prevalence of ECC among Oregon children in general. As part of a recent Robert Wood Johnson foundation grant, three Oregon demonstration sites reported the presence of ECC in between 6% and 25% of the low-income children seen (RWJ).
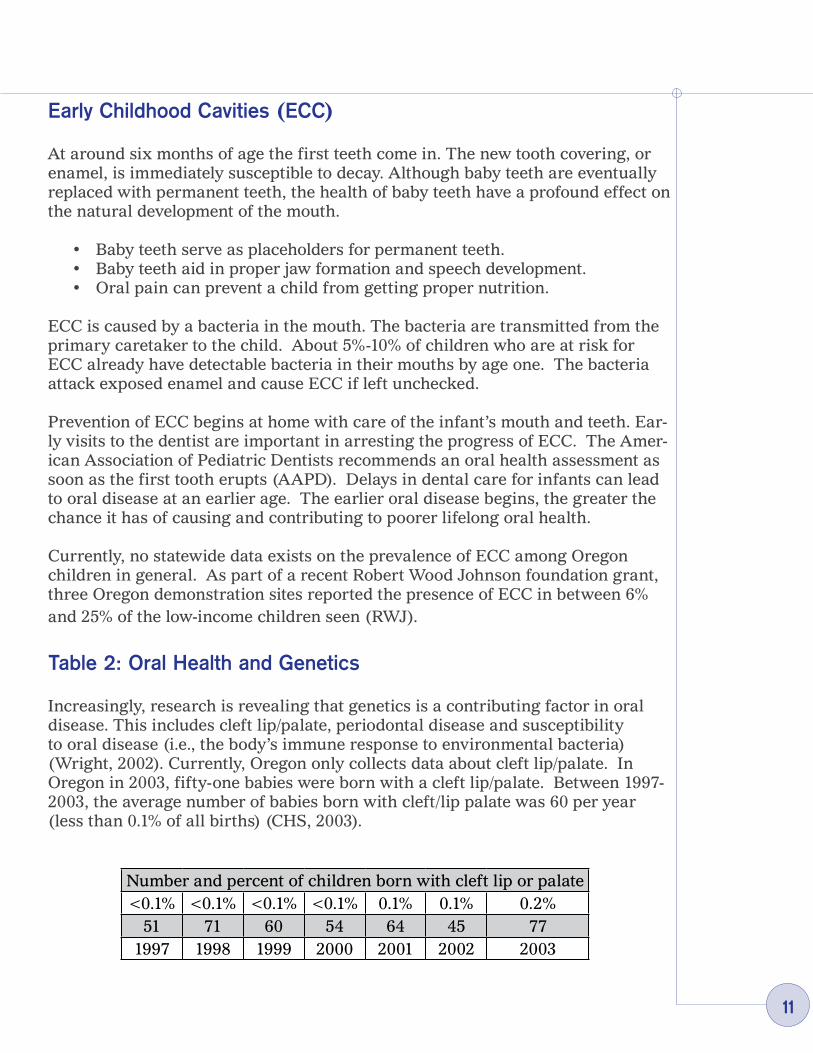
Table 2: Oral Health and Genetics
Increasingly, research is revealing that genetics is a contributing factor in oral disease. This includes cleft lip/palate, periodontal disease and susceptibility to oral disease (i.e., the body’s immune response to environmental bacteria) (Wright, 2002). Currently, Oregon only collects data about cleft lip/palate. In Oregon in 2003, fifty-one babies were born with a cleft lip/palate. Between 1997-2003, the average number of babies born with cleft/lip palate was 60 per year (less than 0.1% of all births) (CHS, 2003).
Number and percent of children born with cleft lip or palate<0.1% <0.1% <0.1% <0.1% 0.1% 0.1% 0.2%
51 71 60 54 64 45 771997 1998 1999 2000 2001 2002 2003
12
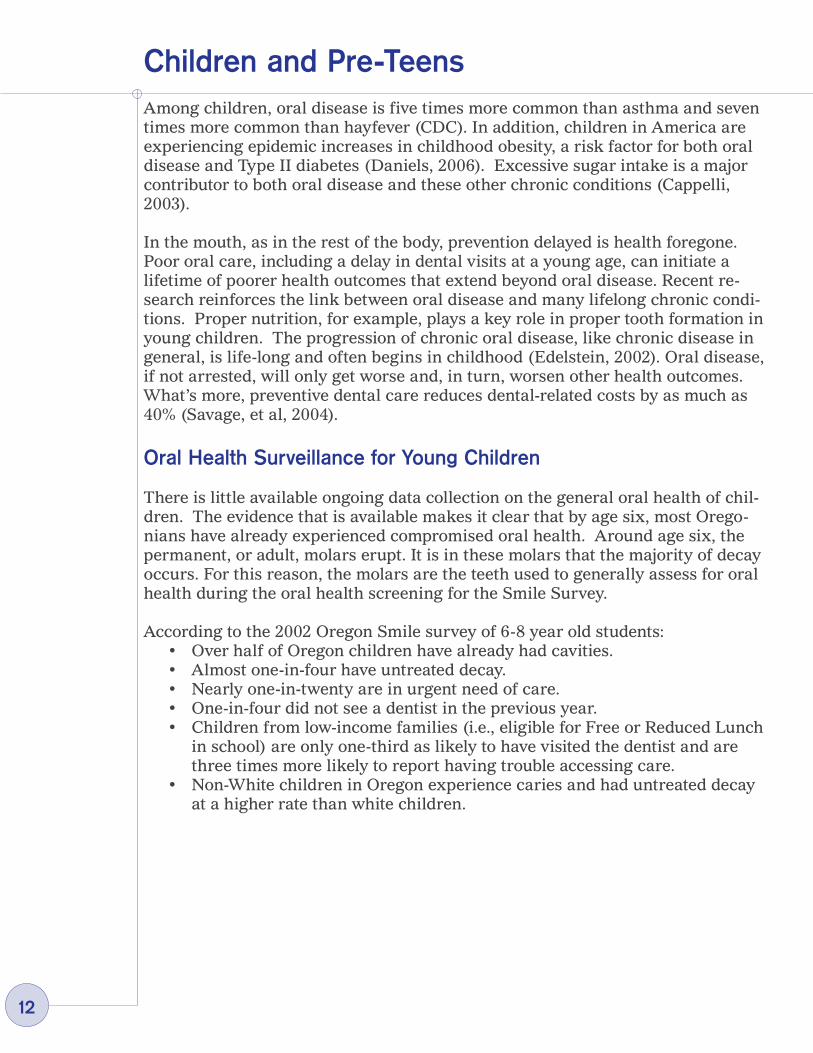
Children and Pre-TeensAmong children, oral disease is five times more common than asthma and seven times more common than hayfever (CDC). In addition, children in America are experiencing epidemic increases in childhood obesity, a risk factor for both oral disease and Type II diabetes (Daniels, 2006). Excessive sugar intake is a major contributor to both oral disease and these other chronic conditions (Cappelli, 2003).
In the mouth, as in the rest of the body, prevention delayed is health foregone. Poor oral care, including a delay in dental visits at a young age, can initiate a lifetime of poorer health outcomes that extend beyond oral disease. Recent re-search reinforces the link between oral disease and many lifelong chronic condi-tions. Proper nutrition, for example, plays a key role in proper tooth formation in young children. The progression of chronic oral disease, like chronic disease in general, is life-long and often begins in childhood (Edelstein, 2002). Oral disease, if not arrested, will only get worse and, in turn, worsen other health outcomes. What’s more, preventive dental care reduces dental-related costs by as much as 40% (Savage, et al, 2004).
Oral Health Surveillance for Young Children
There is little available ongoing data collection on the general oral health of chil-dren. The evidence that is available makes it clear that by age six, most Orego-nians have already experienced compromised oral health. Around age six, the permanent, or adult, molars erupt. It is in these molars that the majority of decay occurs. For this reason, the molars are the teeth used to generally assess for oral health during the oral health screening for the Smile Survey.
According to the 2002 Oregon Smile survey of 6-8 year old students:• Over half of Oregon children have already had cavities. • Almost one-in-four have untreated decay.• Nearly one-in-twenty are in urgent need of care. • One-in-four did not see a dentist in the previous year. • Children from low-income families (i.e., eligible for Free or Reduced Lunch
in school) are only one-third as likely to have visited the dentist and are three times more likely to report having trouble accessing care.
• Non-White children in Oregon experience caries and had untreated decay at a higher rate than white children.

13
Graphic 2: The Oral Health of Children Ages 6-8: SMILE Survey, 2002
0
20
40
60
80
100
HP2010 U.S. Oregon
42%
4%
Caries Experience*
Untreated Decay
Urgent Need For Care
50%
56%
21%29%
24%Per
cen
t
14
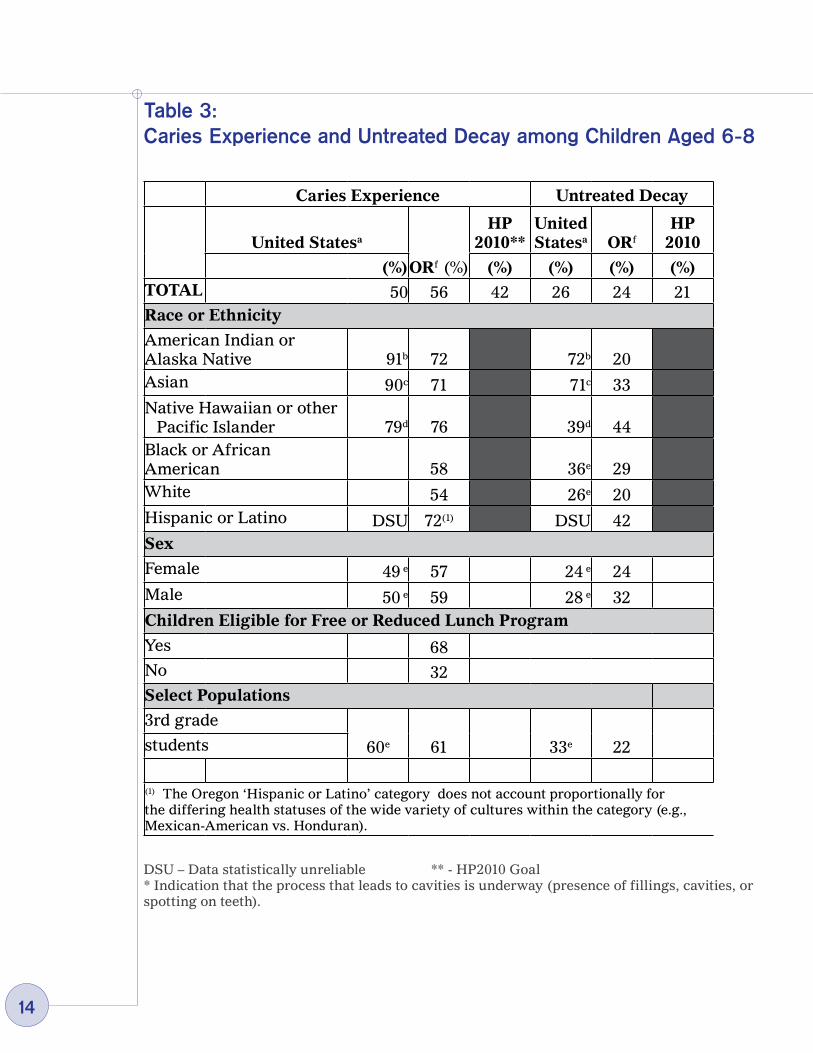
Table 3: Caries Experience and Untreated Decay among Children Aged 6-8
DSU – Data statistically unreliable ** - HP2010 Goal* Indication that the process that leads to cavities is underway (presence of fillings, cavities, or spotting on teeth).
Caries Experience Untreated Decay
United Statesa
ORf (%)
HP 2010**
United Statesa ORf
HP 2010
(%) (%) (%) (%) (%)TOTAL 50 56 42 26 24 21Race or Ethnicity
American Indian or Alaska Native 91b 72 72b 20Asian 90c 71 71c 33Native Hawaiian or other
Pacific Islander 79d 76 39d 44Black or African American 58 36e 29White 54 26e 20Hispanic or Latino DSU 72(1) DSU 42Sex
Female 49 e 57 24 e 24Male 50 e 59 28 e 32Children Eligible for Free or Reduced Lunch Program
Yes 68No 32Select Populations
3rd grade
60e 61 33e 22students
(1) The Oregon ‘Hispanic or Latino’ category does not account proportionally for the differing health statuses of the wide variety of cultures within the category (e.g., Mexican-American vs. Honduran).

15
AdolescentsThroughout adolescence and into early adulthood, several changes to Oregonians occur that worsen oral health:
Measures of oral health decline. There are few measures of oral health for adolescents and adults in Oregon. • In 2004, 69% of 8th graders and 73% of 11th graders report having had at
least one cavity (OHT).• Although there is no comparative measure for Oregon adults, the national
estimate of adults who have had a cavity is approximately 90% (Barker, 2006).
Measures of professional dental care decline (see graphs on next page). • Among students who participated in the OHT survey (in 2001 as 8th
graders and 2004 as 11th graders), the percentage of those who had not visited a dentist in the previous year was 28% in 2001 and 25% in 2005.
• According to the Oregon BRFSS – a telephone survey of adults – the estimate of adult Oregonians with no dental visit increases to 33%.
• Periodontal disease is well established among many twenty year-olds (Thomas, 2000), and so a decline in dental visits between the teen years and adulthood is of concern.
Adolescent behaviors that contribute to poor oral health increase.• The percentage of those at risk for becoming overweight, who are
overweight or are obese increases. Excess consumption of sugary foods contributes both to obesity and poor oral health.
• Tobacco use – smoked and chewed – increases. Half of all periodontal disease may be attributable to tobacco use (Tomar, 2000). Tobacco use also results in attachment loss (loose teeth) (Neely, 2001) and oral and pharyngeal cancers.
• Alcohol use, the second most common risk factor for oral cancer (Niessen, 2002), also increases. These changes that worsen oral health often begin, increase or peak during adolescence.
16
Other Threats and Emerging Issues
There are a few other oral health concerns during adolescence for which there are currently no Oregon measures.
Sports-related injuries: • Study estimates of mouth injuries sustained during sports range from 10%
to 36% of participants (Tesini, 2000). • Football and lacrosse are the only school-sanctioned sports that currently
require the use of mouthguards (OSAA).
Methamphetamine Use: The recent surge in the use of this drug carries a high price in oral disease. • Users are characterized by rampant caries; cracked teeth; periodontitis
and tooth loss, likely caused by the drug itself; high intake of soft drinks while using; and lack of care during extended periods of abuse. Compliance with follow-up visits is poor to nonexistent.
• Decay begins at the gum line and encircles the tooth, making it non-restorable (especially given the noncompliance of patients) (Shaner, 2002).
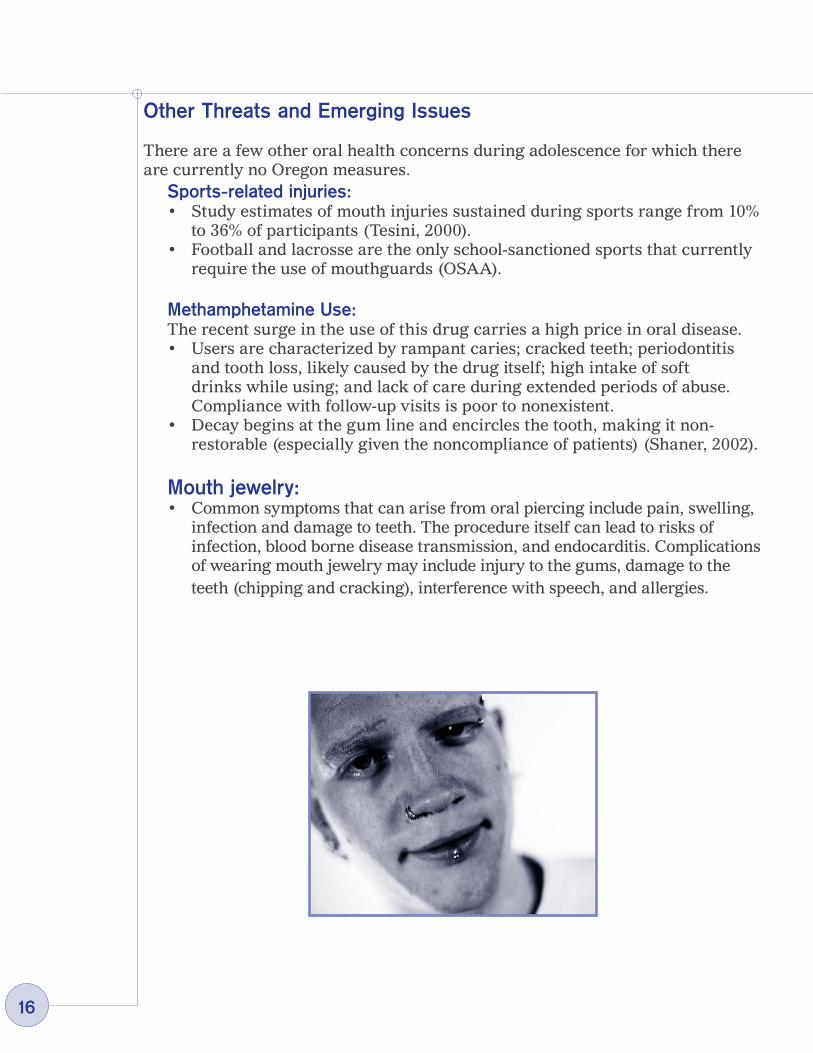
Mouth jewelry: • Common symptoms that can arise from oral piercing include pain, swelling,
infection and damage to teeth. The procedure itself can lead to risks of infection, blood borne disease transmission, and endocarditis. Complications of wearing mouth jewelry may include injury to the gums, damage to the teeth (chipping and cracking), interference with speech, and allergies.

17
Graphics 3a, 3b: Oral Health Worsens On The Way To Adulthood
0
20
40
60
80
100
8th Grade (OHT, 2001) 11th Grade (OHT, 2004)
Five or more alcoholic drinks in a
row**
Used chewing
(spit) tobacco**
Smoked cigarettes**
At risk for overweight, overweight
or obese
No dental visit*
28% 25% 22% 24%
12%17%
2% 7% 9%
29%
3a
* in past year ** in past thirty days
0
20
40
60
80
100
No dental visit*
At risk for overweight, overweight
or obese
Smoked cigarettes**
Used chewing
(spit) tobacco**
Five or more alcoholic drinks in a
row**
33%
14%
4%
23%
59%
BRFSS, 2004
3b

18
AdultsThroughout adulthood, oral health continues to deteriorate for many:
Gum disease increases. • There are no Oregon-specific measures for gum disease available, but,
nationally, 1-in-7 suffer from periodontitis and nearly half of all adults develop gingivitis (CDC).
The percentage of those with dental caries grows. • As noted, about 90% of all adults in the U.S. have had caries experience. • As one ages, the gum line recedes and exposes the root surfaces of teeth to
decay. • A substantial proportion of U.S. adults have oral disease that remains
untreated; 1-in-4 U.S. adults have untreated dental caries (CDC). • Foregone treatment increases the chances of developing serious oral
disease conditions such as an abscess.
Chronic disease increases as people age.• Many chronic diseases – cardiovascular disease, arthritis, diabetes, cancer
and HIV (and some acute conditions such as pneumonia) – have been linked to poor oral health.
• These conditions can result in poorer oral health and can in turn be made worse by existing poor oral health (Holmstrup, 2003).
Unhealthy behaviors continue to contribute to poor oral health. • The over-consumption of high calorie simple carbohydrates has been
linked to obesity, Type II diabetes and oral disease. • Fifty-nine percent of Oregon adults are at risk for being overweight or are
overweight or obese (BRFSS). Tobacco has been established as a major cause of oral and pharyngeal cancers, and evidence also points strongly to it being a cause of periodontitis. • Treatment of oral disease is substantially compromised among tobacco
users (CDC). • Although tobacco users experience a greater threat to their oral health, they
are less likely to care for their teeth and gums properly (Andrews, 1998). • Several groups, such as American
Indians/Alaska Natives and males smoke at higher rates, thus increasing those groups’ chances of experiencing adverse oral health outcomes.

1�
Table 4: Cigarette Smoking among Adults aged 18 Years and Older (BRFSS, 2004)
Considering the onslaught of oral disease among an aging population and the effect that poor oral health can have on other health conditions, it remains critically important that all Oregonians access preventive dental care throughout the lifespan.
Regular preventive care can reduce the development of disease and facilitate early diagnosis and treatment. • As the Table 5 illustrates (p.20), only about two-thirds of Oregon adults
visit the dentist at least once a year (the recommendation is for a dental visit twice yearly).
• What’s more, accessing preventive services is not uniform across all demographics.
• Those under age 45 and those older than 65 are less likely to access preventive care.
• Black, Hispanic and multiracial Oregonians access dental care at rates lower than the state average.
• Those with less education and/or less income are also less likely to access preventive care.
Healthy People 2010 Target: 12% United Statesa
Oregon Status b
(%) (%)
Total 24 14Race or Ethnicity
American Indian or Alaska Native 35 20
Asian 13 5Native Hawaiian/Pacific Islander 17 15
Black or African American 25 11White 25 15Hispanic or Latino 19 6 Female 22 13 Male 26 16
20
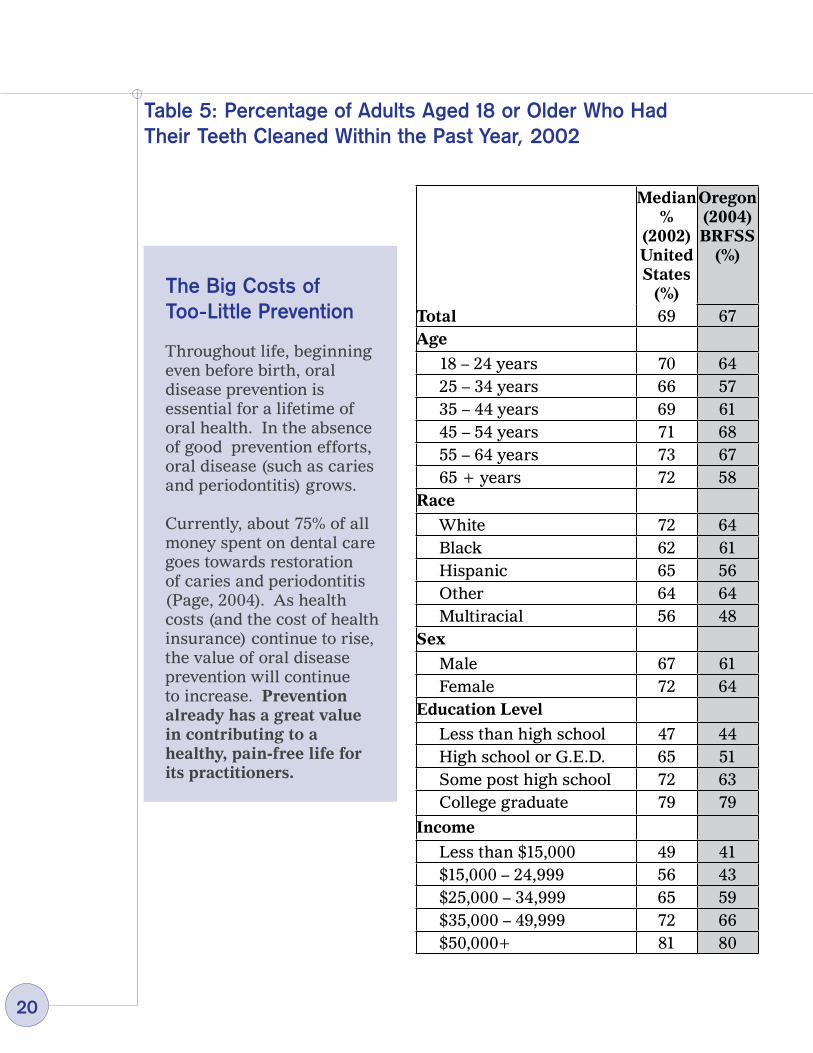
The Big Costs of Too-Little Prevention
Throughout life, beginning even before birth, oral disease prevention is essential for a lifetime of oral health. In the absence of good prevention efforts, oral disease (such as caries and periodontitis) grows.
Currently, about 75% of all money spent on dental care goes towards restoration of caries and periodontitis (Page, 2004). As health costs (and the cost of health insurance) continue to rise, the value of oral disease prevention will continue to increase. Prevention already has a great value in contributing to a healthy, pain-free life for its practitioners.
Median %
(2002) United States
(%)
Oregon (2004) BRFSS
(%)
Total 69 67Age
18 – 24 years 70 64 25 – 34 years 66 57 35 – 44 years 69 61 45 – 54 years 71 68 55 – 64 years 73 67 65 + years 72 58Race
White 72 64 Black 62 61 Hispanic 65 56 Other 64 64 Multiracial 56 48Sex
Male 67 61 Female 72 64Education Level
Less than high school 47 44 High school or G.E.D. 65 51 Some post high school 72 63 College graduate 79 79
Income
Less than $15,000 49 41 $15,000 – 24,999 56 43 $25,000 – 34,999 65 59 $35,000 – 49,999 72 66 $50,000+ 81 80
Table 5: Percentage of Adults Aged 18 or Older Who Had Their Teeth Cleaned Within the Past Year, 2002
21
Older AdultsOlder adults today enjoy better oral health than at any other time in history. However, challenges to good oral health continue to increase as we age. As age increases, so do disability (both physical and non-physical) and chronic disease and conditions. With disability and disease comes, in many cases, poorer oral health, which in turn can worsen overall health. Recent research indicates that cardiovascular disease, diabetes and pneumonia can be worsened by poor oral health, and can in turn make oral health worse. What’s more, the number of elderly is increasing, which will increase the societal impact of any disease conditions and lack of care that age group experiences. Specific oral conditions are more prevalent in an aging population and they are compounded by a lack of information on oral care in certain settings.
Following are some of the specific oral disease conditions associated with aging:Root caries. These are caries that attack the root of the tooth as the gumline recedes with age. Half of the U.S. population over age 75 has root caries CDC). Although high rates of caries are usually considered a problem at the start of life, root caries put older adults at the greatest risk for the number of teeth in danger of developing caries (Niessan, 2005).
The greater prevalence of chronic diseases/conditions can worsen oral health.Chronic disease can expose an otherwise healthy mouth to periodontitis, which in turn contributes to systemic infection.
Prescription medications and the aging process itself can cause a reduction in saliva flow. A reduced saliva flow can result in an increase in dental caries and periodontitis, a decreased ability to chew and can contribute to soft tissue trauma (Gerdin, 2005).
Tooth loss. One-in-five Oregonians between the ages of 65 and 74 have lost all their natural teeth (see table to the right). Tooth loss is associated with the in-ability to get adequate nutrition, pain (both from tooth loss and the use of den-tures), self-esteem issues – such as appearance and clarity of speech – and criti-cal social issues such as communication (Nitschke, 2004).
Institutional care. Aging often means that an individual requires access to med-ical care and social support around the clock. Currently, access to dental care in nursing homes and care facilities is very limited, if it exists at all (Niessen, 2005). A lack of professional care, combined with worsening oral health, medica-tion that causes a reduced saliva flow and an increased risk for caries can easily transform a healthy mouth into an unhealthy one in a very short period of time.

22
Self-care. Aging can often bring with it chronic conditions which affect motor control and/or cognitive function (such as dementia). These conditions are often severe enough to interfere with a person’s ability to care for their own teeth (Et-tinger, 2000), can increase difficulty in chewing, swallowing and other oral mo-tor functions (Chavez, 2000), and can make the aging adult less likely to accept treatment by others (Schembri).
Table 6: Proportion of Adults Aged 35–44 Years Who have Lost No Teeth and Proportion of Adults Aged 65–74 Years Who have Lost All Natural Teeth, by Selected Demographic Characteristics
DNA – Data not analyzed DNC – Data not collected DSU – Data statistically unreliable
Aged 35–44 Years
Aged 65–74 Years
No Tooth Extractions
Lost All Natural Teeth
United Statesa ORe
United Statesb ORe
(%) (%) (%) (%)Healthy People 2010 Target 42 42 20 20TOTAL 39 65 25 17Race or EthnicityAmerican Indian or Alaska Native 23c 65 25c 60Asian DNC 59 DSU 50Native Hawaiian and other Pacific
Islander DNC DSU DSU DSUHispanic or Latino DSU 65 20 0Black or African American 30 24 34 36White 43 67 23 17SexFemale 36 66 24 15Male 42 64 24 19Education LevelLess than high school 15d 48 43 40High school graduate 21d 50 23 25At least some college 41d 76 13 9Disability StatusPersons with disabilities DNA 31 34 29Persons without disabilities DNA 68 20 13
23
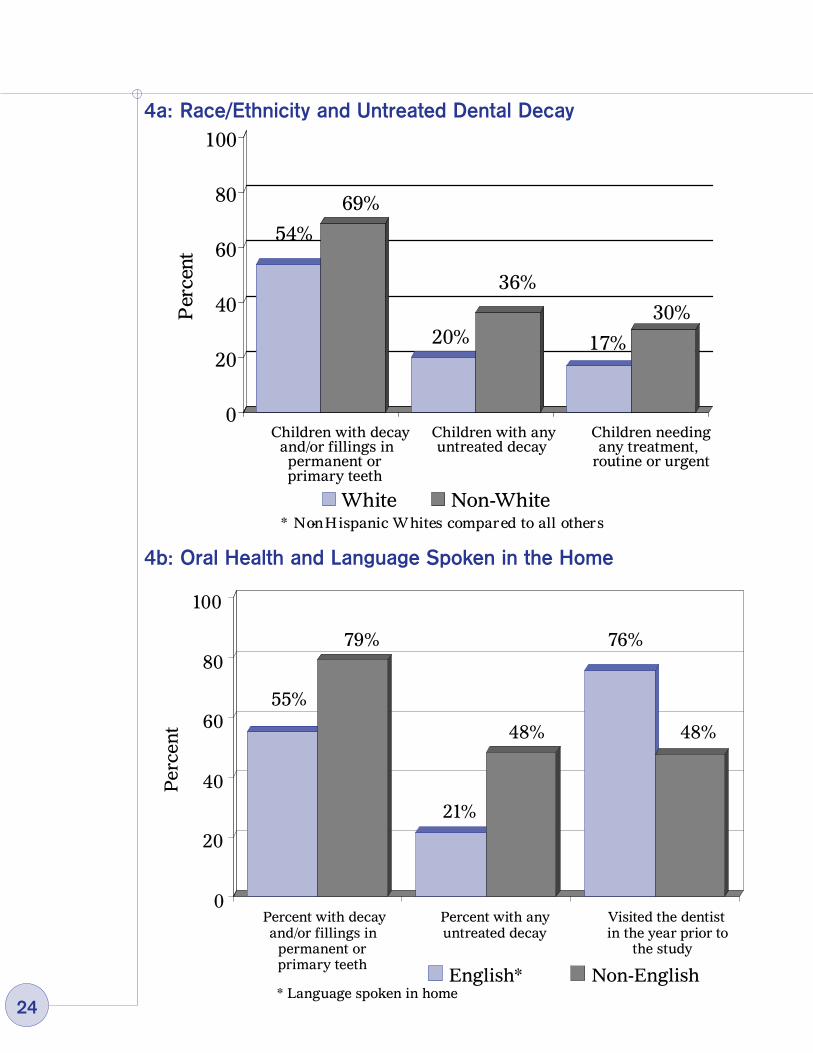
Disparity: Racial and EthnicAs has been noted in many places in this document, oral disease (and inversely, oral health) is not evenly distributed across Oregon. Many groups, including groups of varying racial and ethnic makeup, suffer oral disease to a greater ex-tent than others:
• Among children ages 6-8, higher proportions of caries experience were seen in all racial and ethnic groups as compared to white students.
• In the Smile Survey, white students also had the lowest percentage with untreated decay (along with American Indian/Alaska Native students; see page 11).
• A greater proportion of white children aged 6-8 received the protective benefit of sealants placed on their teeth (see p 25 for more information on sealants).
• In a recent series of focus groups of Early and Migrant Head Start parents, participants identified racial and/or cultural issues as a barrier to accessing care for their children (Osborn, 2005).
• A higher percentage of American Indian/Alaska Native adults in Oregon smoke, which is a prime causal factor of oral disease (see page 14).
• African Americans are more likely than whites to develop oral cancer and much more likely to die from it (CDC).
• White adults in Oregon reported the highest percentage of having had their teeth cleaned (along with the ‘Other’ category; see page 15).
• White adults aged 35-44 were most likely to have retained all their natural teeth, and were the second most likely to have retained at least some natural teeth through ages 65-74 (page 17).
24
4a: Race/Ethnicity and Untreated Dental Decay
0
20
40
60
80
100
White Non-White
54%
69%
20%
36%
17%
30%
Children with decay and/or fillings in permanent or primary teeth
Children with any untreated decay
Children needing any treatment,
routine or urgent
* Non- Hispanic W hites compared to all others
Per
cent
4b: Oral Health and Language Spoken in the Home
0
20
40
60
80
100
English* Non-English
Percent with decay and/or fillings in
permanent or primary teeth
Percent with any untreated decay
Visited the dentist in the year prior to
the study
55%
79%
21%
48%
76%
48%
* Language spoken in home
Per
cen
t
25
Disparity: IncomeThose with fewer means suffer more oral disease. Across all age groups and all racial/ethnic backgrounds, people from low-income families experience more dental decay, more untreated decay, more gum disease and a higher percentage of endentulism (total tooth loss) (CDC). In addition, fewer low-income people visit the dentist and obtain the professional preventive treatment necessary for good oral health.
In 2004:
• In Oregon, 67% of all adults reported visiting the dentist in the previous year (BRFSS).
• Only 19% of Oregon Health Plan clients visited the dentist (OMAP).
Recent research has challenged the assumption that income status is associated with poor personal oral care (Sanders, 2006) and further highlights the importance of making professional care accessible to people of all income levels.
Disparity Begins Early in Life
As with racial/ethnic barriers, the health disparities along the lines of income become apparent very early in life (see Graphs 5a and 5b). The earlier these disparities start, the longer oral disease has to compound, worsen and in turn, worsen other health outcomes.

26
5a: Children from Low-Income Families in OregonExperience Difficulties Accessing Oral Health Care
5b: Children from Low-Income Families in OregonHave Substantially Greater Decay and Treatment Needs
0
20
40
60
80
100
Eligible* Not Eligible
67%
83%
58%
87%
33%
10%
Children with dental insurance
Children that have been to the dentist in the past year
Children who had trouble accessing a
dentist in the previous two years
* E ligible for free or reduced lunch
Per
cent
0
20
40
60
80
100
E ligible* Not E ligible
68%
48%
21%
10%
36%
13%30%
11%
Percent with decayand/or fillings in permanent orprimary teeth
Percent with decay in seven or more teeth
Percent with any untreated decay
Percent needing any treatment, routine or urgent
* Eligible for free or reduced lunch
Per
cen
t

27
Prevention: Fluoride
Community Water FluoridationCommunity water fluoridation (CWF) is one of the safest, least expensive, most effective and simplest ways to fight tooth decay. Over fifty years of research has confirmed its beneficial effects to oral health. Every dollar spent on CWF saves $38 in treatment costs (Carmona, 2004). CWF is an ideal public health measure because it requires no behavioral change and community water supplies can be accessed equally regardless of demographic differences (such as race, ethnicity, sex or income) (CDC). However, four-out-of-five Oregonians do not have access to water systems that adjust fluoride to optimal levels (DWP).
School Fluoride ProgramThe Oregon Oral Health Program offers a supplemental School Fluoride Tablet & Rinse program. To qualify for participation, an elementary school must have at least 40% of its student population eligible for the Federal Free and Reduced Lunch program (FRL). FRL is commonly used as a proxy for low-income students. Research has demonstrated that low-income people suffer a disproportionate degree of dental decay – see page 19). In the 2004-2005 school year, 250 schools in Oregon and 42,516 students participated in the school fluoride program (OOHSS).
Fluoride VarnishFluoride varnish is a high concentration of fluoride that can be ‘painted’ on the surfaces of baby teeth, where it will adhere for several months. Fluoride varnish has been demonstrated to be clinically effective in reducing caries incidence (Weintraub, 2006). Early childhood cavities prevention (ECCP) programs use fluoride varnish. ECCP programs are becoming more common in Oregon in settings that provide services to children aged 6-24 months. Currently, no statewide data exists on fluoride varnish activity.
0
20
40
60
80
100
75%67%
20%
Per
cen
t
HP2010 Goal
US Oregon
6: Community Water Fluoridation

28
Prevention: Dental Sealants
A dental sealant is a plastic coating that fills the natural pits and grooves on the tops of permanent molar teeth, essentially sealing out decay. Considering that approximately 90% of all cavities occur in children’s teeth occur in the permanent molars (CDC-B), dental sealants are an inexpensive and very effective means of preventing cavities in children.
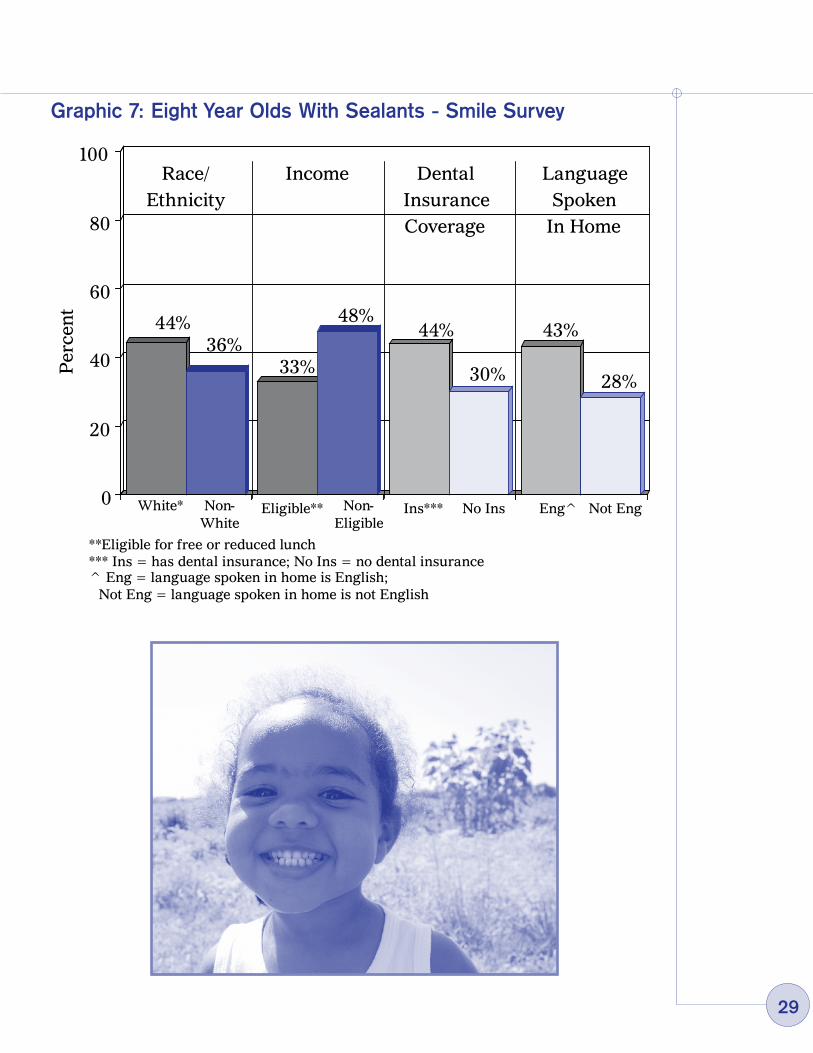
The Association of State and Territorial Dental Directors (ASTDD) considers dental sealants a ‘best practice’. As Table 7 illustrates, fewer than half of all children in Oregon receive dental sealants. Furthermore, the distribution of sealant placement follows the same disparity lines of income and race/ethnicity as other oral health care (see Graph 7).
DNC – Data not collected DSU – Data statistically unreliable
Table 7: Percentage of Children in United States and Oregon with Dental Sealants on Molar Teeth, by Age and Selected Characteristics
Healthy People 2010 Target = 50%
Children, Aged 8 yearsDental Sealants on
MolarsUnited States,
1999-2000 (%)
ORd (%)
TOTAL 28 42Race or ethnicityAmerican Indian or Alaska Native 63 a 32Asian DNC 42Native Hawaiian or other Pacific
Islander 20 b 24
Black or African American 11 c31
White 26 c 44
Hispanic or Latino DSU 36SexFemale 31 44Male 25 41
2�
Graphic 7: Eight Year Olds With Sealants - Smile Survey
0
20
40
60
80
100
36%44% 48%
33%
44%
30%
43%
28%
White* Non-White
Eligible** Non-Eligible
**Eligible for free or reduced lunch
Ins*** No Ins
*** Ins = has dental insurance; No Ins = no dental insurance
Not EngEng^
^ Eng = language spoken in home is English; Not Eng = language spoken in home is not English
Per
cen
t
Race/ Ethnicity
Income Dental Insurance Coverage
Language Spoken
In Home
30
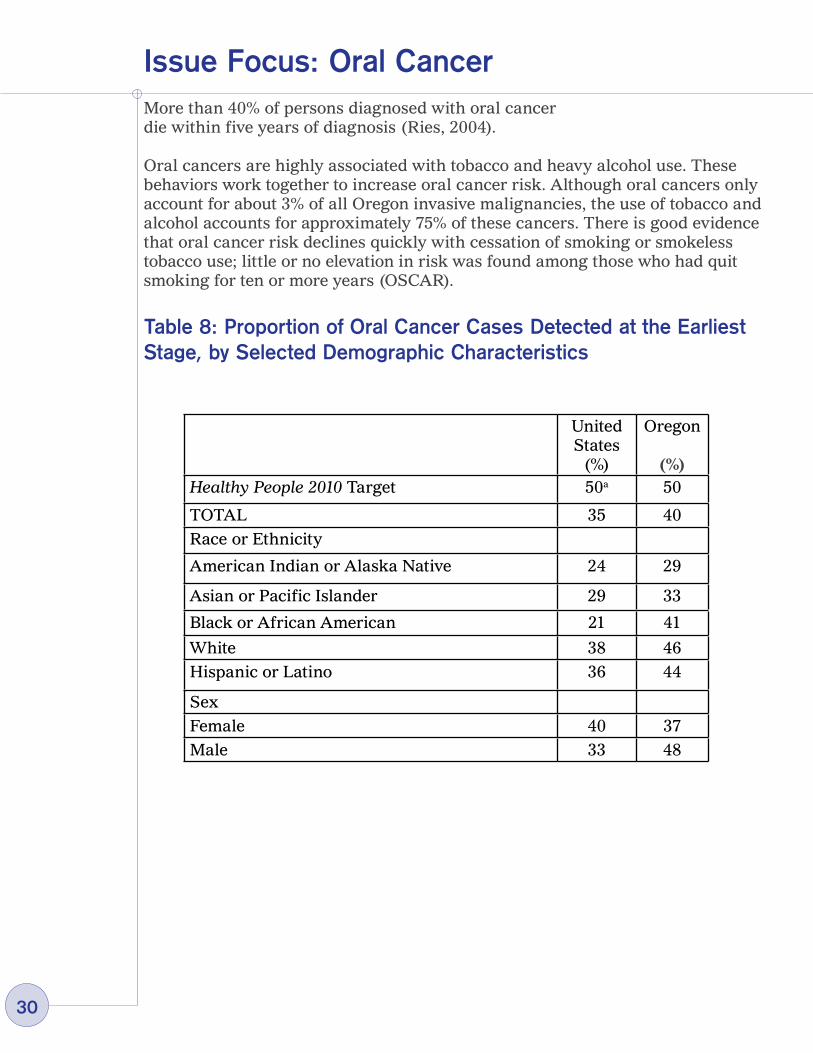
More than 40% of persons diagnosed with oral cancer die within five years of diagnosis (Ries, 2004).
Oral cancers are highly associated with tobacco and heavy alcohol use. These behaviors work together to increase oral cancer risk. Although oral cancers only account for about 3% of all Oregon invasive malignancies, the use of tobacco and alcohol accounts for approximately 75% of these cancers. There is good evidence that oral cancer risk declines quickly with cessation of smoking or smokeless tobacco use; little or no elevation in risk was found among those who had quit smoking for ten or more years (OSCAR).
Table 8: Proportion of Oral Cancer Cases Detected at the Earliest Stage, by Selected Demographic Characteristics
Issue Focus: Oral Cancer
United States
(%)
Oregon
(%)Healthy People 2010 Target 50a 50
TOTAL 35 40Race or Ethnicity
American Indian or Alaska Native 24 29
Asian or Pacific Islander 29 33
Black or African American 21 41
White 38 46Hispanic or Latino 36 44
SexFemale 40 37Male 33 48
31
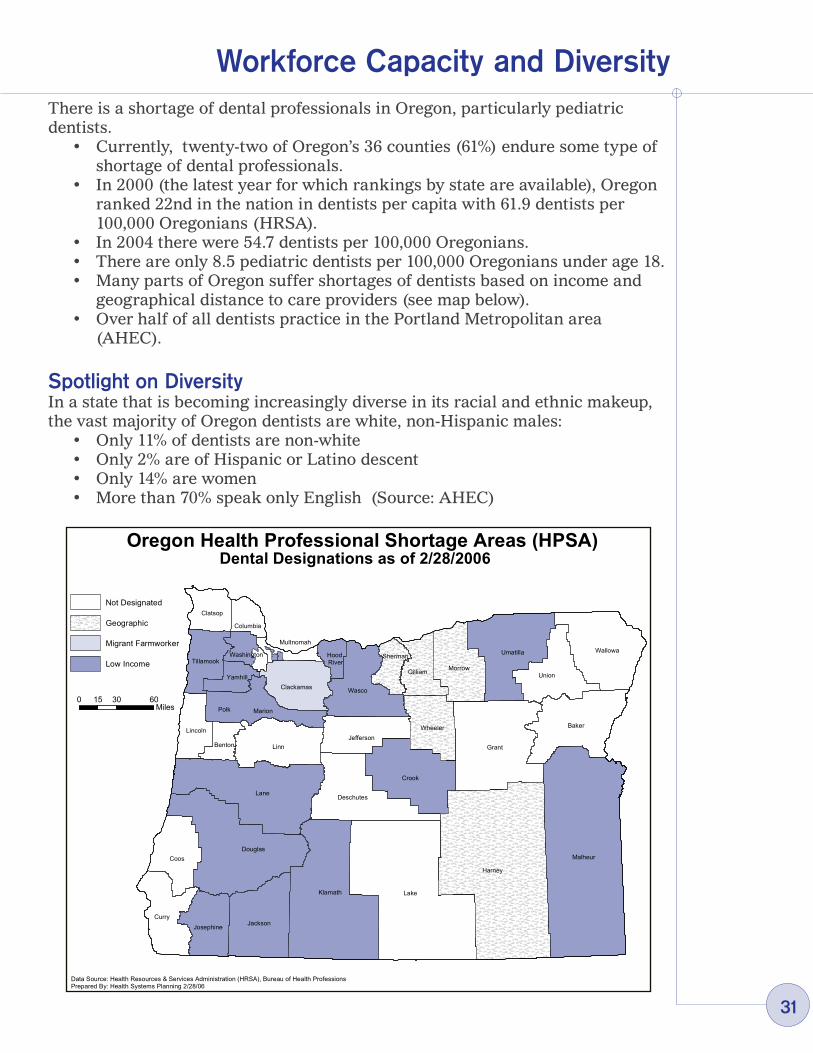
Workforce Capacity and DiversityThere is a shortage of dental professionals in Oregon, particularly pediatric dentists.
• Currently, twenty-two of Oregon’s 36 counties (61%) endure some type of shortage of dental professionals.
• In 2000 (the latest year for which rankings by state are available), Oregon ranked 22nd in the nation in dentists per capita with 61.9 dentists per 100,000 Oregonians (HRSA).
• In 2004 there were 54.7 dentists per 100,000 Oregonians. • There are only 8.5 pediatric dentists per 100,000 Oregonians under age 18. • Many parts of Oregon suffer shortages of dentists based on income and
geographical distance to care providers (see map below). • Over half of all dentists practice in the Portland Metropolitan area
(AHEC).
Spotlight on DiversityIn a state that is becoming increasingly diverse in its racial and ethnic makeup, the vast majority of Oregon dentists are white, non-Hispanic males:
• Only 11% of dentists are non-white• Only 2% are of Hispanic or Latino descent• Only 14% are women• More than 70% speak only English (Source: AHEC)
Lake
Harney
Malheur
Lane
Grant
Klamath
Douglas
Linn
Baker
Crook
Umatilla Wallowa
Curry
Wasco
Union
Coos
Jackson
Deschutes
Morrow
WheelerJefferson
Gilliam
MarionPolk
Clackamas
Lincoln
Josephine
Clatsop
Tillamook
Yamhill
Benton
Sherman
Columbia
Washington HoodRiver
Multnomah
Oregon Health Professional Shortage Areas (HPSA)Dental Designations as of 2/28/2006
Data Source: Health Resources & Services Administration (HRSA), Bureau of Health ProfessionsPrepared By: Health Systems Planning 2/28/06
Not Designated
Geographic
Migrant Farmworker
Low Income
0 30 6015Miles
32
In Conclusion…Oral disease is a chronic condition that affects almost everyone at some point in their lives. And for many, oral disease is a lifelong condition that compromises the quality of their entire lives. The burden of oral disease in Oregon is not borne by all people equally. Those of certain racial and/or ethnic backgrounds and those living at lower income levels are more likely to experience oral disease.
Even without considering disparities, most Oregonians suffer from oral disease, compromising quality of life and costing our state millions in treatment and related costs. These costs are largely related to a lack of preventive care. In addition, diseases of the mouth often have a strong impact on the rest of the body. Chronic disease worsens oral health and poor oral health worsens chronic disease. In all respects, the mouth is part of the body; a person with an unhealthy mouth is not healthy.
Oral disease is largely preventable and always controllable.
• Preventing oral disease requires a comprehensive approach that includes:o Daily and consistent home care;o Regular access to professional dental care;o Fluoridation;o A healthy diet low in sugar;o Avoidance of tobacco; ando Appropriate protection from injury.
• Preventing oral disease must be continuous throughout life:o Good oral health care begins before birth and continues throughout life.o Individual care starts when the first tooth comes in and then must be
maintained at every stage in life.
• Oral disease prevention and intervention strategies must be coordinated:o The impact the health of the mouth has on other chronic conditions
must be addressed, and vice versa; ando Medical and Dental providers should provide dual assessment, and
in some cases treatment, of chronic conditions.
There is still much work to do.
To address the chronic condition of oral disease, there is much work to be done. A continuous, comprehensive approach that includes increased access to care and broader prevention and intervention efforts must be undertaken. In concrete terms, improvement in the overall health of Oregonians should include:
• An increase in the percent of all Oregonians who visit a dentist annually. In particular, an increase in the percent of Oregonians who are non-white or low-income who visit a dentist annually.

33
• Increases in prevention and intervention earlier in – and throughout – life.o An increase in the percent of women who visit the dentist during
pregnancy and who receive education on how to care for infant teeth.
o An increase in the percent of young children seeing a dentist regularly, with visits beginning during infancy, as soon as the first tooth erupts.
o An increase in the percent of children who are non-white or low-income who see the dentist.
o An increase in proven, best-practice prevention efforts such as access to fluoride and dental sealants for children.
• A broader understanding among health professionals. Dental and medical professionals alike must actively address the link between the mouth and the rest of the body and the reciprocal nature of disease.
In the effort to reduce oral disease in Oregon, the public health perspective has a great deal to offer. Public health-oral health efforts focus on expanding the infrastructure used to increase prevention activities and address oral health disparities where they exist. Public health, oral health programs include ECC prevention, dental sealants, school fluoride, community water fluoridation, and injury prevention (e.g., increased use of mouthguards in sports). Public health emphasizes a collaborative, comprehensive approach to oral health that seeks to reduce oral disease among entire populations of Oregonians.
Although there is still much to do, great strides have been taken.
• State Plan for Oral Health – Overarching Issues Impacting all Oregonians: This Plan was developed through a process involving many stakeholders. It represents the most current and best practice approaches to addressing the priority oral health issues in Oregon. Just as preventing oral disease must be a comprehensive approach, so to must be the Plan.
The Plan focuses on strategies in the areas of Education/Promotion, Prevention, Access, Workforce, and Infrastructure. It provides the next steps to address the burden of oral disease as described in this document.
• The Statewide Oral Health Coalition: Newly formed, this coalition brings together a diverse group of stakeholders invested in improving the oral health of all Oregonians. This coalition creates linkages, communication channels, and opportunities for resource sharing in a way that previously was lacking. It utilizes a foundation of best practice and evidence-based approaches to enhance policy and existing systems.
34
• Existing Prevention Programs:
School Fluoride Program The Public Health Division’s Oral Health Program operates a school-based
fluoride program. Over two hundred fifty elementary schools participate, serving over 42,000 children. School nurses or parent volunteers distribute fluoride tablets or rinse to the children whose parents have given written permission. This program provides fluoride supplementation to children who might otherwise not receive it.
School-based/linked Dental Sealant Programs There are over 30 school-based or linked dental sealant programs
throughout Oregon. These programs target 2nd and 3rd graders in Title I schools and provide dental screenings, dental sealant placement, and referral for treatment when needed. These programs are inexpensive to operate, but rely on volunteers.
Despite their effectiveness, there are many challenges to implementing school-based or linked dental sealant programs. A lack of dental equipment and available dentists for screening are the main barriers to expanding these programs.
Early Childhood Cavities Prevention Early Childhood Cavities Prevention (ECCP) programs employ a four-
stage model: risk assessment, education, intervention (fluoride varnish application), and referral. Targeted at young children between the ages of 6 –36 months, ECCP programs are highly effective. Many programs exist within a public health structure, mainly the County Health Department, and utilize public health nurses and home visiting programs.
• Infrastructure /Capacity Building: In 2000, the National Governor’s Association recommended that the state
of Oregon enhance its oral health infrastructure. The following year, the Association of State and Territorial Directors (ASTDD) completed a site review and made several recommendations to build oral health infrastructure and capacity within DHS.
In 2002, the Office of Family Health (OFH) received funding from the Centers for Disease Control and Prevention – Division of Oral Health to set about building the infrastructure as described in the ASTDD report. Since then, the OFH Oral Health Program has grown considerably and established an oral health infrastructure. Measures of infrastructure include:o Public Health Dental Directoro Oral Health Surveillance Systemo State Plan for Oral Health

35
o Statewide Oral Health Coalitiono Community-based prevention programs (as described above)o A comprehensive description of the burden of oral disease (this
document)o The Oral Health Advisory Boardo Program evaluation and strategic planning
• ASTDD Best Practices: The Association of State and Territorial Dental Directors (ASTDD) have
identified seven main Best Practice Approaches for State and Community Oral Health Programs. These Best Practice Approaches are based upon supportive evidence from research, expert opinion, field lessons, and theoretical rationale.
The OFH Oral Health Program employs and promotes the ASTDD Best Practice Approaches through its State Plan for Oral Health and with partners and programs at the local and community level. The Best Practice Approaches are:o State Oral Health Plans and Collaborative Planningo Coalitions and Collaborative Partnershipso School-based Fluoride Programso Community Water Fluoridationo State-based Oral Health Surveillance Systemo School-based/linked Dental Sealant Programso Access to Oral Health Care Services – Workforce Development
The future offers opportunities for further work
• Close gaps in Surveillance. The Oregon Oral Health Surveillance System currently covers thirty-
four data points from eight different sources. However, much important information – such as information on the oral health of pre-school children, on the prevalence of gum disease through the life cycle, on access to care for marginalized populations such as the institutionalized – is not currently available. Expansion of the system will greatly enhance our knowledge of oral disease and enable greater analysis of intervention/prevention efforts.
• Establish oral health program and project evaluation processes. Ongoing evaluation, using Best Practice approaches recommended by
ASTDD, will ensure that highly effective programs and projects will be maintained, expanded and transplanted throughout Oregon.
• Take advantage of opportunities for collaboration.
36
The Statewide Oral Health Coalition The Statewide Oral Health Coalition brings together diverse stakeholders
with a common interest. Improving oral health for all Oregonians is going to require the involvement of many people. To truly address disparity and need, the perspectives of non-traditional partners is crucial. Businesses, faith-based communities, civic organizations, and others are invited to participate.
Communities The most successful community-based programs are those that are
sustainable and reflect the commitment of the community itself. Establishing and enhancing oral health infrastructure and capacity at the community level is essential. Identifying opportunities to share resources and build upon existing expertise will provide a foundation for sustainable prevention programs.
Other State Programs Oregon’s Public Health Division presents an ideal opportunity to bring
the mouth and the body back together in terms of health promotion and disease prevention. Increased collaboration among public health programs will provide Oregonians with a comprehensive continuum of effective information that will help them lead longer, healthier lives.
• Seek funding for public health-oral health programs. Naturally, a component of a strong oral health infrastructure is a stable
funding stream. Currently, the OFH Oral Health Program relies on federal funding through grants. The same can also be said for local oral health programs. There are many opportunities to enhance funding streams, but identifying and utilizing them will require collaboration and a commitment to lessening the impacts of oral disease through prevention.

AAPD – American Association of Pediatric Dentists. Available at: http://aapd.org/media/Policies_Guidelines/G_InfantOralHealthCare.pdfAHEC – Area Health Education Centers’ Descriptive Report Series: Dentist
Profile, 2002 (note: language spoken was asked on the 2000 Dentist Profile but not in 2002). Oregon Health Sciences University, Area Health Education Centers Program, Portland, OR.
Andrews, J.A; Severson, H.H.; Lichtenstein, E & Gordon, J.S. (1008). Relationship between tobacco use and self-reported oral hygiene habits. JADA, (129), 313-320.
ASTDD – Association of State and Territorial Dental Directors. Available at: http://www.astdd.org/index.php?template=bestpracschoolsealant.php&tier1=School%20Sealant%20Programs
Barker, L. (2006). Personal communication. Braine, Theresa. More oral health care needed for ageing populations. Bull
World Health Organ. [online]. Sept. 2005, vol.83, no.9 [cited 06 April 2006], p.646-647.
Cappelli, D.P. (2003). “Diabesity and oral health implications. Presented at American Association for Dental Research Meeting, March 15, 2003, San Antonio, TX.
Chavez, E.M. & Ship, J.A. (2000). Sensory and motor deficits in the elderly: Impact on oral health. Jour Pub Health Dent, 60, (4), 297-303.
Caufield, P.W; Griffen, A.L. (2004). Dental caries: an infectious and tramsmissible disease. Pediatr Clin North Am, 47, (5): 1001-1019.
CDC Reference Tool: The Burden of Oral Disease. Available: State of Oregon Oral Health Program
CDC-B.CDC National Oral Health Surveillance System. Available: http://www.cdc.gov/nohss/guideDS.htm.
Daniels, S.R. (2006). The consequences of childhood overweight and obesity. The Future Of Children, 16, (1), 47-67.
Edelstein, Burton. (2002). Disparities in oral health and access to care: Findings of national surveys. Ambulatory Pediatrics, March-April (2), 2, Supplement.
Ettinger, R.L.; O’Toole, C.; Warren, J.; Levey, S. & Hand, J.S. (2000). Nursing directors’ perceptions of the dental components of the Minimum Data Set (MDS) in nursing homes. SCD, 20 (1), 23-27.
Gerdin, E.W.; Einarson, S.; Jonsson, M.; Aronsson, & Johansson, I. Impact of dry mouth conditions on oral health-related quality of life in older people. Gerodontology, 22, 291-226.
HP2010: Healthy People 2010 Oral Health Goals Available:http://healthypeople.gov/Document/HTML/Volume2/21Oral.htm
Appendix I: References
37

HSP – Health Systems Planning Office, State of Oregon. Available:http://oregon.gov/DHS/ph/hsp/hpshortage/dental2003.pdf
Holmpstrup, Havemose Poulsen, A.; Andersen, L.; Fiehn, N. (2003). Oral infections and systemic diseases. Dental Clinics of North America, 47, 575-598.
HRSA Available:http://bhpr.hrsa.gov/healthworkforce/reports/statesummaries/oregon.htm
Khader, Y.S., and Taani, Q. (2005). Periodontal diseases and the risk for pre-term birth and low birth weight: A meta-analysis. Journal of Periodontology, 76, (2), 161-165.
Neely, A.L.; Holford, T.R.; Loe, H.; Anerud, A. & Boysen, H. (2001). The natural history of periodontal disease in man; risk factors for progression of attachment loss in individuals receiving no oral health care. Journal of Periodontology, 72 (8), 1006-1015.
Niessen, L.C. & Fedele, D.J. (2005). Older adults – Implications for private dental practitioners. California Dental Association Journal, 33, (9), 695-703. Nitschke, I.; & Muller, F. (2004). The impact of oral health on the quality of life in the elderly. Oral Health Preventive Dentistry, (2), Supp, 271-275.
OOHSS – Oregon Oral Health Surveillance System. Oregon Oral Health Program, State of Oregon.
Oral Health in America: A Report of the Surgeon General. (May, 2000). Available:http://www.surgeongeneral.gov/library/oralhealth/
OSAA. Oregon School Activities Association. (osaa.org). Osborn, A. 2005. The Oral Health Knowledge, Attitudes and Practices of
Early and Migrant Head Start Parents in Oregon. Poster presentation at Western MCH Epidemiology Conference, May 12-13, 2005 Portland, OR.
OSCAR. Oregon State Cancer Registry. Available: http://www.oregon.gov/DHS/ph/oscar/arpt2002/ar2002.pdf
Page, R.C.; Martin, J.A. & Loeb, C.F. (2004). Use of risk assessment in attaining and maintaining oral health. Compendium, 25 (9), 657-669.
Reis, L.A.G; Eisner M.P; Kosary, C.L.; Hankey, B.F.; Millaer, B.A, & Clgg, L. (2004). SEER Cancer Statistiscs Review, 1975-2001. National Cancer Institute. Available: http://seer.cancer.gov/1975_2001.
RWJ – Robert Wood Johnson Final Narrative Report, Oregon Early Childhood Cavities Prevention Pilot Project State Action for Oral Health Access, Oregon oral health program, State of Oregon.
Sanders, A.E.; Spencer, A.J. & Slade, G.D. (2006). Evaluating the role of dental behavior in oral health inequalities. Community Dentistry and Oral Epidemiology, 34, 71-79.
38

Schrembi, A. and Fiske, J. (2001). The implications of visual impariment in an elderly population in recognizing oral disease and maintaining oral health. Spec Care Dentist, 21 (6), 222-226.
Savage, Matthew; Lee, Jessica; Kotch, Jonathan and Vann Jr., William. (2004). Early preventive dental visits: effects on subsequent utilization and costs. Pediatrics, 114, 418-423.
Shaner, J.W. Caries associated with methamphetamine abuse. J Mich Dent Assoc, 84 (9), 42-47.
Tanni, D.Q.; Habashneh, R.; Hammad, M.M.; Bateau, A. (2003). The periodontal status of pregnant women and its relationship with socio-demographic and clinical variables. Journal of Oral Rehabilitation, 30, 440-445.
Tesini, D.A. & Soporowski, N.J. (2000). Epidemiology of orofacial sports-related injuries. Advances in Sports Dentistry, 44, (1), 1-19.
Thomas, W.M.; Hashim, R. & Pack, A.R.C. (2000). The prevalence and intraoral distribution of periodontal attachment loss in a birth cohort of 26-year-olds. Journal of Periodontology, 71 (12), 1840-1845.
Tomar, S.L. & Asma, S. (2000). Smoking-attributable periodontitis in the United States: findings from the NHANES III National Health and Nutrition Examination Survey. Journal of Periodontology, 71 (5), 743-751.
Weintraub, J.A.; Ramos-Gonzalez, F.; Jue, B.; Shain, S.; Hoover, C.I.; Featherstone, J.D.B. & Gansky, S.A. (2006). Fluoride varnish efficacy in preventing early childhood caries. J Dent Res, 85 (2), 172-176.
WHO – World Oral Health Report (2003). Available:http://www.who.int/oral_health/publications/report03/en/index.html
Wright, J.T.; & Hart, T.C. (2002). The genome projects: Implications for dental practice and education. Journal of Dental Education, May, 659-671.
3�

40
A Brief Discussion on Using Data
Whenever data come from a lot of different sources, comparing data becomes a problem.Differences in measures: Measures from one data source may be only slightly different from another, and categories of responses or respondents can be different. Timing: Data are often not released concurrently. Data may also not be gathered during the same time period. Regulations: Different jurisdictions (e.g., state vs. Federal) may have different regulations and statutory limitations to what can be gathered and in what way.
This Burden Document is the State of Oregon’s best effort to combine data from a wide variety of sources in order to assemble as complete a picture of oral disease in Oregon as possible. The data are for the purposes of illustration and comparison. Assistance with interpreting the data presented is available from the Oregon Oral Health Program.
Sources of Data Used in This Document
Tables 1a, 1b: Source: Healthy People 2010 Progress Review, 2000. Available at: www.cdc.gove/nchs/hpdata2010/focusareas/fa21.xlsAge adjusted to the year 2000 standard population a Data are for 1999-2000 unless otherwise specified b. Data are for 2002 c. Data are for 1988-1994 d. Data are for 1998 e. Data are for 1996-2000 f. Data are for 2000 g. Data are for 1997 h. Data are for 1999i. Smile Survey, 2002j. BRFSS, 2004k. OSCAR, 2003l. DWP, 2005m. OMAP, 2004n. CHS, 2004o. OOHS, 2006p. OHT, 2005
Appendix II: Data Sources

41
Graphic 1: Source Oregon PRAMS
Table 2: CHS
Graphic 2: Source: Oregon Smile Survey
Table 3: Source: Healthy People 2010 Progress Review, 2000. Available at: www.cdc.gove/nchs/hpdata2010/focusareas/fa21.xls
a Data are for children aged 6-8 years old, 1999-2000 unless otherwise specified
b. Data are for Indian Health Services Areas, 1999. c. Data are for California, 1993-1994 d. Data are for Hawaii, 1999 e. Data are from NHANES III, 1988-1994f. Data are from Oregon Smile Survey, 2002
Graphic 3a: Source: Oregon Healthy Teens Survey, 2001 & 2004
Graphic 3b: Source: Oregon BRFSS Survey, 2004
Table 4: Source a. Healthy People 2010, 2nd Ed. U.S. Dept. of Health and Human Services,
November, 2000b. Oregon BRFSS, 2004
Table 5: Source a. Division of Adult and Community Health, National Center for Chronic
Disease Prevention and Health Promotion, Centers for Disease Control and Prevention, National BRFSS, 1995-2000. Available at: www.cdc.gov/brfss
b. Oregon BRFSS, 2004
Table 6: Source Healthy People 2010 Progress Review, 2000. Available at: www.cdc.gove/nchs/hpdata2010/focusareas/fa21.xls
a National data are for 1999-2000 unless otherwise specifiedb. National data are for 2002 unless otherwise specified c. Data are for Indian Health Services, 1999 d. Data are from NHANES III, 1988-1994e. Data are from Oregon BRFSS, 2004
Graphic 4a, 4b, 5a, 5b: Source Oregon Smile Survey, 2002
Graphic 6: Source DWP, 2005

42
Table 7: Source National data are from NHANES 1���-2000 unless otherwise indicated
a Data are for HIS service areas, 1999b. Data are for Hawaii, 1999 c. Data are from HNANES III, 1988-1994 d. Data are from Oregon Smile Survey, 2002
Graphic 7: Source Oregon Smile Survey, 2002
Table 8: Source Healthy People 2010 Progress Review, 2000. Available at: www.cdc.gove/nchs/hpdata2010/focusareas/fa21.xls National data are for 1996-2000 unless otherwise specified
a Healthy People 2010, 2nd Ed. U.S. Dept. of Health and Human Services, November, 2000
b. Data are from Oregon OSCAR, 1996-2003
Graphic 8: Source HSP, 2006
Glossary of Data-Related Terms
BRFSS – Oregon Behavioral Risk Factor Surveillance System. An on-going data collection program designed to measure behavioral risk factors in the adult population 18 years of age or over living in households. http://www.dhs.state.or.us/dhs/ph/chs/brfs/index.shtml
CHS – Center for Health Statistics. The Center is Oregon’s vital records office. Each birth, marriage, divorce, and death - that occurs in Oregon is registered and filed with our office. http://oregon.gov/DHS/ph/chs/index.shtml
DWP – Drinking Water Program. The program focuses resources on the areas of highest public health benefit and promotes voluntary compliance with drinking water standards. http://oregon.gov/DHS/ph/dwp/
DNA – Data not analyzed
DNC – Data not collected
DSU – Data statistically unreliable
OHT – Oregon Healthy Teens Survey. A comprehensive, school-based, anonymous and voluntary survey that monitors risk behaviors and other factors that influence the health and well-being of Oregon’s children and adolescents. http://www.dhs.state.or.us/dhs/ph/chs/youthsurvey/index.shtml
43
OOHSS - Oregon Oral Health Surveillance System
PRAMS – Pregnancy Risk Assessment Monitoring System. Collects data on maternal attitudes and experiences prior to, during, and immediately after pregnancy. http://oregon.gov/DHS/ph/pnh/prams/index.shtml
SMILE – Oregon Smile Survey. A statewide survey and clinical exam to evaluate the oral health of Oregon children aged 6-8 years. http://oregon.gov/DHS/ph/oralhealth/docs/smile.pdf


Oregon Department of Human Services
Public Health DivisionOffice of Family Health
800 N.E. Oregon Street, Suite 850Portland, Oregon 97232
Phone: 971.673.0525Fax: 971.673.2040
http://www.oregon.gov/DHS/ph/oralhealth
If you need this document in an alternate format, call the Office of Family Health, Oral Health at
�71-673-0525.