the burden of multiple myeloma · the purpose of this report is to raise awareness and...
TRANSCRIPT

THE BURDEN OFM U L T I P L E MYELOMA
A STUDY OF THE HUMAN AND ECONOMIC COSTS
OF MYELOMA IN NEW ZEALAND
Richard Milne
Matt Boyd
Henry Chan
Barr y Milne
Doney Zhang
Health Outcomes Associates Auckland
Adapt Research LtdWellington
Waitemata District Health BoardAuckland
Compass Research CentreAuckland
Compass Research CentreAuckland
Master Report Gradient Adjust 21st.indd 1 21/06/19 9:23 AM
© Myeloma New Zealand 2019
Published by Myeloma New ZealandRegistered Charity No. CC53924PO Box 25162Wellington 6011New Zealand
www.multiplemyeloma.org.nz
ISBN: 978-0-473-48520-7 - printISBN: 978-0-473-48521-4 - online/PDF
Cover design by Dennis HearfieldPrinted by City Print Communications
June 2019
i
THE BURDEN OF MULTIPLE MYELOMA: A STUDY OF THE HUMAN AND ECONOMIC COSTS OF
MYELOMA IN NEW ZEALAND
Authors Richard Milne BSc (Hons) , MSc, PhD, MRSNZ Managing Director of Health Outcomes Associates Ltd & Honorary Associate Professor in the School of Pharmacy at the University of Auckland
Mat t Boyd MBChB, MA, PhD Owner and Research Director of Adapt Research, Wellington
Henry Chan MBChB, FRACP, FRCPA Consultant Haematologist at Waitemata District Health Board
Barry Mi lne BA (Hons) , MSc, PhD Director of COMPASS Research Centre, University of Auckland
Doney Zhang BSc, MStats Data Analyst at COMPASS Research Centre, University of Auckland while this research was undertaken.
Myeloma New Zealand is a charitable trust established in 2016 to focus specifically on multiple myeloma and to improve the quality of life and survival of New Zealanders living with it.
We are primarily a patient advocacy organisation, that seeks to empower patients with information, research and support; to advocate with government to allow myeloma patients access to the remarkable treatments that are transforming lives and survival in other comparable countries; and to raise awareness and understanding among the general public of myeloma, one of our most common blood cancers.

The Burden of Multiple Myeloma in New Zealand
ii

June 2019
iii
FOREWORD
Being diagnosed with multiple myeloma can be a devastating, life-shattering experience. It marks the beginning of an unpredictable emotional and physical rollercoaster, characterised by potentially very taxing treatments, periods of depression and anxiety, remission, relapse, and hope alternating with despair. Only those with close experience of this terrible disease can understand its impact on patients and their families, and thus the value of the unprecedented improvements in management and treatment that are already available or are on the horizon.
This is why this burden of disease report is so important. It examines in detail the heavy social and economic burden that myeloma inflicts on individual patients and caregivers, as well as on the New Zealand healthcare system. The report brings together for the first time ‘real-world’ New Zealand data across a whole population,
rather than patients selected as participants in a clinical trial. It provides an indication of the expected survival of myeloma patients in New Zealand and enables us to compare treatment patterns and outcomes here with those of patients in other countries.
The evidence shows that up to 2500 New Zealanders are currently living with myeloma, that one new case of myeloma is diagnosed every day on average, and one person dies of myeloma every second day, on average. This consolidates our view that this is a significant blood cancer and a major health issue.
The report identifies regional variations in treatment pathways and survival outcomes, and that survival is worse for people living in deprived areas, including Māori and Pasifika. It is deeply concerning to find that over one-third of patients did not receive the most effective first line myeloma treatments, and others discontinued early, yet alternative novel therapies such as lenalidomide are still not funded for first-line use. These are among the critical findings that need to be fully investigated and addressed.
The patient survey carried out in conjunction with the report provides valuable, real-life insights into what it is like to live with myeloma, and lessons on what can be done to improve support and quality of life for our patients and their families. We are grateful to the patients and caregivers who completed the survey and provided their stories.
These insights illustrate the reality that myeloma is a highly individual cancer, with a wide variation in experiences and responses to treatment. Our increasing ability to understand and predict the likely course of the disease is already enabling us to tailor precise, personalised, combination treatments for an individual patient, rather than a one-size-fits-all approach. And this is increasingly seen as the pathway to eventually treating myeloma as a chronic disease, rather than a fatal one.
Myeloma New Zealand is very pleased to have this report completed. It has been a mammoth undertaking and is a credit to all involved, in particular, Richard Milne, who has put an enormous amount of time into assembling and analysing the material. This is in many respects a pioneering piece of work, given the challenges of merging disparate data sets, some of which had incomplete
Ken Romeril Chief Executive Myeloma New Zealand

The Burden of Multiple Myeloma in New Zealand
iv
or inadequate data (see the Preface to this report). We believe it is also unique in world myeloma literature, with nothing comparable of this depth having been produced by any other country.
It is also timely to have produced the report during a period of unprecedented change in the field of blood cancers, with new treatments constantly coming onstream. These developments give good reason for hope for myeloma patients.
Currently, however, many of these new treatments that could improve survival and quality of life are not funded in New Zealand or are so restricted that they cannot be used in the right combination or at the most beneficial time in the disease. Some of these treatments are available on compassionate access programmes or in clinical trials, but not all centres are able to take advantage of these.
While the cost might seem prohibitive, many countries less wealthy than New Zealand have funding systems that have been able to afford these life-extending drugs. The gap between New Zealand and comparable countries is steadily widening.
We therefore encourage patients, their families, clinicians and all involved in this sector to bring these issues to the attention of policy makers, to challenge the current process of ‘rationing by delay,’ and to spell out the human and social value of these new treatments and strategies, in terms of lives transformed and spared, and hope becoming a reality.
Ken Romeril MBChB, FRACP, FRCPA Chief Executive Myeloma New Zealand NZ Member of the International Myeloma Working Group

June 2019
v
PREFACE
The purpose of this report is to raise awareness and understanding of multiple myeloma and its treatments and outcomes among policy makers, clinicians, patients and the general public, and to report on the human, psycho-social and economic costs of this disease in New Zealand. The economic perspective of the study is societal, in that it attempts to assess as many as possible of the costs relevant to myeloma.
The study is the first of its kind internationally, in both scope and depth. As with any work of this nature, it raises a number of further questions beyond the scope of this report that are well worthy of further research. These are set out in Section VII, Conclusions, Outlook and Recommendations.
The main strength of this study is that it is based on real-world New Zealand data across a whole population, rather than patients who were selected as participants in a clinical trial or as optimally managed cases in a medical practice. Real-world evidence has prognostic value (for example, it gives a better indication of expected survival in the New Zealand setting), and it allows comparisons with other countries.
Secondly, the study provides strong evidence for the effectiveness of autologous stem cell transplant (ASCT) and bortezomib in New Zealand patients under local management strategies. This complements and extends information obtained in randomised clinical trials, which provide more definitive information on the effectiveness of clinical management strategies and new pharmaceuticals for selected groups of patients, but which cannot readily be generalised to whole populations.
Thirdly, a major strength is that it contains detailed costs to Government in one year (2016), which can help inform resource allocation. This is new information.
The main limitation of the study is that it is based partly on the New Zealand cancer registry (NZCR) which contains little clinical information such as the type of myeloma and the stage of disease at diagnosis. Genetic information is not included, and there is no information on the treatments provided. The NZCR is subject to misallocation: i.e. inclusion of patients who might not have myeloma, and exclusion of patients who do have myeloma (see Section V, Conclusions, Outlook and Recommendations).
Further limitations include the following:
- Timing of diagnosis: for example, a patient with smouldering myeloma might not be identified until he or she develops bone fractures or other symptoms. Nevertheless, this is the real-world situation at present. It could change as imaging techniques are used more widely. Some of these difficulties can be overcome by merging datasets, as we have done. But this does not compensate for misallocation of cases or limitations of the clinical data that is reported to the registry.
- Confounding factors that cannot readily be adjusted for: for example, when comparing age/sex-matched patients with and without ASCT, those patients who are considered to be

The Burden of Multiple Myeloma in New Zealand
vi
eligible for this therapy will be likely to have better overall survival than the group that was considered to be ineligible for it because of their comorbidities and/or frailty.
- Lack of data on primary care costs: the Integrated Data Infrastructure (IDI) has very limited evidence on primary care consultations and costs, and therefore was not utilised. As a result, we have probably underestimated the true cost of primary care. Although cancer is generally managed by specialists, patients are likely to consult their general practitioner as well, for therapies to ameliorate both the effects of the disease and the impact of aggressive therapies. Better information on GP consultations is required.
- Pharmaceutical costs: we relied for costs on data from the IDI, which are incomplete. Counts of pharmaceuticals are relatively secure because they are based on claims, which provides an incentive for reporting. But pharmaceutical costs are complex, due to the confidential nature of negotiated rebates.
- Costs incurred by patients and caregivers: these exclude travel to medical centres, over-the-counter medications, nutraceuticals and supplementary medicines. Our analysis also excludes the costs of private importing of medicines and other therapies, including expensive new biologicals.
- Lack of national information on health insurance premiums or privately funded healthcare, because this information is not publicly available.
As part of this study, a survey of patients was conducted by Myeloma New Zealand to add depth and context to the report by gaining an understanding of the personal, psycho-social and financial costs to patients and their families. An analysis of this survey, and accounts by patients and caregivers of their personal journeys with myeloma, are included as appendices to this report. It should be noted that the data collection technique used in the survey (via a link on a website) means the survey has a significant self-selection bias, and views expressed do not necessarily represent the view of all New Zealand myeloma patients and caregivers. Also, elderly patients were under-represented. Nonetheless the survey provides valuable insights into the real-life burden of myeloma on individuals, and how its impact could be alleviated.
While this report was being finalised, two other reports on the epidemiology of myeloma were published.
Sneyd et al. 2019.1
This study confirms our findings on both the incidence of myeloma at national level, and its mortality, based on the NZCR. For comparison, we report the age standardised incidence rate (ASIR) for patients registered in 2012-2016 as 5.19 per 100,000 per annum (Table 1) and the Sneyd study reported 5.29 per 100,000 in 2015/2016. It also shows that the unadjusted (crude) incidence increased since 1994 and the age standardised incidence rate was higher for men than women and also for Māori versus non-Māori patients, as we also report. Pacific and Asian incidence rates were not reported. This study also confirms a steady increase in overall survival in the period 2004 to 2015.

June 2019
vii
Hock et al. 2019.2
This study, which was set in a tertiary hospital with a broad catchment (Christchurch), was relatively small but it had the advantage of having direct access to some clinical information. By comparing cohorts who were registered before and after 2010, it showed that the increased availability of new antimyeloma agents (bortezomib and lenalidomide) was associated with a significant improvement in both the overall survival of older patients (as we also report) and the progression free survival of patients who had ASCT. As in our study, association does not prove causation, but it is both rational and suggestive.
Neither of these papers reported survival by region, DHB or socioeconomic status.

The Burden of Multiple Myeloma in New Zealand
viii
ACKNOWLEDGEMENTS
This report was commissioned by Myeloma New Zealand, to create more awareness and understanding of multiple myeloma as distinct from other blood cancers, and to estimate the burden of this disease in New Zealand in both personal and economic terms. The authors are grateful to Dr. Ken Romeril (CEO, Myeloma New Zealand) for initiating this study and providing clinical information, ongoing commentary and review; and to Dr. David Simpson (consultant haematologist, Waitemata District Health Board), Professors Nick Wilson and Mark Elwood for their insightful comments. We also thank Tania Crosbie for her expert editorial services and Catherine Isaac for her thoughtful and constructive input. We are especially grateful to the six individuals who have described their personal journeys with myeloma and four caregivers (of other individuals) for their stories. We thank Maddie Shannon and Joanna Bullock for their advice and assistance in preparing and analysing the survey of patients. The lead author takes full responsibility for this report.
Approval to utilise the IDI was obtained from Statistics New Zealand, the Health and Disability Committee of the Ministry of Health and the University of Auckland Human Ethics Committee. More details are provided in Section IV below.
Funding was provided to Myeloma New Zealand by Janssen New Zealand. The sponsor had no input into the design, analyses or interpretation of this study.

June 2019
ix
CONTENTS
FOREWORD .............................................................................................................................iii
PREFACE .................................................................................................................................... v
ACKNOWLEDGEMENTS ....................................................................................................... viii
CONTENTS .............................................................................................................................. ix
TABLES .................................................................................................................................... xiii
FIGURES ................................................................................................................................... xv
GLOSSARY ............................................................................................................................ xvii
ABBREVIATIONS .................................................................................................................. xxiii
Jessica’s story ..................................................................................................................... xxv
EXECUTIVE SUMMARY ............................................................................................................ 2
The disease: its diagnosis, incidence, prevalence and treatment (see Sections I and II) ............. 2
Diagnosis .............................................................................................................................................................. 2
Incidence and prevalence...................................................................................................................................... 3
Treatment .............................................................................................................................................................. 4
Stem cell transplant ................................................................................................................................................. 5
Treatment for patients who are not eligible for stem cell transplant ................................................................... 5
Unfunded treatments ............................................................................................................................................... 6
Survival outcomes (see Section III) ................................................................................................... 7
Uptake and impact of new therapies and combinations (see Section IV) .................................... 8
Quality of life (see section V) ............................................................................................................ 8
Costs of myeloma (see Section VI) ................................................................................................... 9
Costs to the healthcare system ............................................................................................................................... 9
Loss of personal income ....................................................................................................................................... 10
Loss of tax revenue................................................................................................................................................ 10
Conclusions, outlook and recommendations (see Section VII) .................................................... 11
Epidemiology ........................................................................................................................................................ 11
Clinical management ............................................................................................................................................ 11
Costs to government and families ........................................................................................................................ 12
Living with myeloma.............................................................................................................................................. 12
The outlook: scanning the horizon for new management strategies ................................................................. 14
An overall transformation in myeloma treatment ............................................................................................... 16
Recommendations ................................................................................................................................................. 16
John’s story .......................................................................................................................... 20

The Burden of Multiple Myeloma in New Zealand
x
I MULTIPLE MYELOMA AND ITS CLINICAL MANAGEMENT ................................... 22
Summary .......................................................................................................................................... 22
The disease ...................................................................................................................................... 23
Management of multiple myeloma ................................................................................................ 31
Treatment strategies ......................................................................................................................... 32
Treatment for transplant ineligible patients ......................................................................................................... 35
Established international practice for treatment for transplant eligible patients .............................................. 36
Clinical management of relapsed/refractory myeloma .................................................................................... 37
Clinical management of myeloma in New Zealand ..................................................................... 39
Newly diagnosed myeloma ................................................................................................................................ 39
Treatment for relapsed/refractory myeloma ...................................................................................................... 40
Unfunded treatments ............................................................................................................................................. 42
Ben’s story ........................................................................................................................... 44
II EPIDEMIOLOGY OF MULTIPLE MYELOMA AND ITS TREATMENTS ...................... 46
Summary .......................................................................................................................................... 46
Methodology ................................................................................................................................... 47
Diagnosis of myeloma ..................................................................................................................... 48
Incidence of myeloma in New Zealand ........................................................................................ 49
Mortality from myeloma in New Zealand ..................................................................................... 56
Prevalence of myeloma in New Zealand ...................................................................................... 57
James’ story ......................................................................................................................... 58
Briar’s story ......................................................................................................................... 60
III SURVIVAL IN NEW ZEALAND ................................................................................... 62
Summary .......................................................................................................................................... 62
Methodology ................................................................................................................................... 62
All-cause and cause-specific survival ............................................................................................ 63
Comparative survival across Cancer Network Regions ............................................................... 66
Survival by level of socioeconomic deprivation ............................................................................ 67
International comparisons: incidence, mortality and survival rates for myeloma ....................... 69
Susan’s story ....................................................................................................................... 72
IV UPTAKE AND IMPACT OF STEM CELL TRANSPLANT, BORTEZOMIB AND LENALIDOMIDE...................................................................................................................... 74
Summary .......................................................................................................................................... 74
Uptake .............................................................................................................................................. 75
Dosage of bortezomib .................................................................................................................... 80

June 2019
xi
Uptake of bortezomib, ASCT and lenalidomide by patients ............................................................................ 81
Uptake of lenalidomide ........................................................................................................................................ 85
Total amount of bortezomib dispensed ............................................................................................................... 85
Impact of stem cell transplant and novel pharmaceutical therapies on survival ......................... 85
Summary ............................................................................................................................................................ 85
Findings ............................................................................................................................................................ 86
Prognostic factors: multivariate analysis ........................................................................................ 89
Tania’s story ........................................................................................................................ 91
V QUALITY OF LIFE ........................................................................................................ 92
Summary .......................................................................................................................................... 92
Jim’s story ............................................................................................................................ 94
VI COSTS OF MYELOMA ............................................................................................... 96
Summary .......................................................................................................................................... 96
Overview & methodology .............................................................................................................. 96
Hospital admissions ...................................................................................................................... 100
Pharmaceuticals ............................................................................................................................ 101
Overview ......................................................................................................................................................... 101
Laboratory tests............................................................................................................................. 102
Outpatient and emergency department consultations ............................................................... 103
Additional Costs ........................................................................................................................... 105
Imaging costs ..................................................................................................................................................... 106
Laboratory costs ................................................................................................................................................. 106
Primary care consultations ................................................................................................................................ 106
Costs incurred by patients and families ............................................................................................................ 106
The total government health system cost of multiple myeloma .................................................. 107
The costs attributable to multiple myeloma ................................................................................. 108
Summary of healthcare costs ....................................................................................................... 110
Loss of income ............................................................................................................................... 111
Loss of tax revenue ....................................................................................................................... 113
Overall costs ................................................................................................................................. 113
Samuel’s story .................................................................................................................. 115
VII CONCLUSIONS, OUTLOOK & RECOMMENDATIONS ...................................... 118
Epidemiology & clinical management ............................................................................................................. 118
Clinical data collection ...................................................................................................................................... 119
Costs ......................................................................................................................................................... 119

The Burden of Multiple Myeloma in New Zealand
xii
Patient support .................................................................................................................................................... 120
Outlook: scanning the horizon for new management strategies .............................................. 121
1. Molecular profiling ......................................................................................................................... 121
2. Testing for minimal residual disease (MRD) .................................................................................. 122
3. Novel treatments and combinations .............................................................................................. 123
An overall transformation in myeloma treatment ............................................................................................ 123
Recommendations ........................................................................................................................ 124
1. Systems for collaboration, data collection and benchmarking to ensure equitable quality of care ................................................................................................................................. 124
2. Efficient delivery of medications ..................................................................................................... 124
3. Facilitating access to compassionate-use programmes ............................................................... 125
4. Investment in more effective first-line treatments ........................................................................... 125
5. Supporting and facilitating the conducting of clinical trials in New Zealand ............................ 125
6. Improving support , information and advocacy for patients........................................................ 125
7. Investing in research and facilitating collaboration among centres engaged in research ....... 126
8. Introducing performance-based risk management and cost-effectiveness analyses ................ 126
9. Research funding for New Zealand-specific economic evaluation of therapies to treat myeloma .......................................................................................................................................... 126
10. Further research based on the findings of this report ................................................................... 126
Robert’s story ................................................................................................................... 128
REFERENCES ....................................................................................................................... 130

June 2019
xiii
TABLES
Table 1. Registrations and annual incidence rates per 100,000 population in 2012-2016 by ethnic group. ............................................................................................................................................... 3
Table 2. Medications for treatment of myeloma. ..................................................................................... 4
Table 3. Estimated healthcare costs of myeloma patients and the age/sex matched general population. ............................................................................................................................................... 10
Table 4. Common complications of myeloma. ...................................................................................... 26
Table 5. Myeloma disease staging. ....................................................................................................... 28
Table 6. Criteria used to measure the response to treatment. .............................................................. 31
Table 7. Medications for treatment of myeloma. .................................................................................. 35
Table 8. Major international treatment regimens in first line myeloma treatment. .............................. 36
Table 9. Major international treatment regimens in treatment of relapsed/refractory myeloma. .... 38
Table 10. Registrations and annual incidence rates per 100,000 by sex and ethnic group. .......... 51
Table 11. Age at registration in 2012-2016, by sex and ethnic group. ........................................... 53
Table 12. Registrations for multiple myeloma by District Health Board of domicile, in 2012 to 2016..................................................................................................................................................... 54
Table 13. Cancer registrations by cancer network regions in the period 2012 to 2016. ............... 55
Table 14. Proportions of individuals with myeloma by ethnic group and socio-economic deprivation. .............................................................................................................................................. 55
Table 15. All-cause mortality for patients with myeloma in the period 2011 to 2015, by sex. ....... 56
Table 16. All-cause mortality for patients with myeloma in the period 2011 to 2015, by ethnicity................................................................................................................................................ 57
Table 17. Estimation of the prevalence of myeloma at December 2018. .......................................... 57
Table 18. 12-month, 3-year, 5-year and median overall survival, by era, for all New Zealand. .. 64
Table 19. Mean 12-month, 3-year, 5-year and median survival in the period 2012 to 2016, by region. ....................................................................................................................................................... 67
Table 20. Survival by level of socioeconomic deprivation. ................................................................. 68
Table 21. International incidence, mortality and survival rates for myeloma. .................................... 69
Table 22. Numbers of patients with a hospital coding for ASCT vs patients who received HDM melphalan. ................................................................................................................................................ 75
Table 23. Numbers and proportions of patients who received bortezomib and/or ASCT. ............. 77
Table 24. Numbers of patients registered in 2012-2015 who received bortezomib and/or ASCT. .......................................................................................................................................... 78
Table 25. Numbers of patients up to 70 years who received bortezomib and/or ASCT, by region. ................................................................................................................................................. 79
Table 26. Proportions of patients up to 70 years who received bortezomib and/or ASCT, by ethnic group. ....................................................................................................................................... 79

The Burden of Multiple Myeloma in New Zealand
xiv
Table 27. Proportions of patients up to 70 years who received bortezomib and/or ASCT, by deprivation. ......................................................................................................................................... 80
Table 28. Prognostic factors for survival of patients registered in 2012-2016 (N=1864). ............. 90
Table 29. Number of patients alive in all or part of 2016, by age and sex. ..................................... 99
Table 30. Number of patients alive in all or part of 2016, by status. ............................................... 100
Table 31. Total cost and numbers of hospital admissions for patients with myeloma in 2016....... 100
Table 32. Total cost to government of pharmaceuticals dispensed to myeloma patients in 2016, by region. ............................................................................................................................... 102
Table 33. Total cost of community laboratory tests in 2016 for patients with myeloma, by region. ............................................................................................................................................... 103
Table 34. Total cost of visits to the emergency department by patients with myeloma in 2016, by region. ............................................................................................................................................... 105
Table 35. Total cost of outpatient events for patients with myeloma in 2016, by region................ 105
Table 36. Estimated total health system costs of patients with myeloma in 2016, by sex. .............. 107
Table 37. Estimated total health system costs of patients with myeloma in 2016, by region ($m). 108
Table 38. Estimated healthcare costs of myeloma patients and the age/sex matched general population. ............................................................................................................................................. 109
Table 39. Healthcare costs attributable to myeloma in 2016 by age and sex ($m). ..................... 109
Table 40. Mean attributable healthcare cost per patient attributable to myeloma in 2016, by age and sex. ..................................................................................................................................... 110
Table 41. Estimated mean annual pre-tax income from all sources, and disparity in income, in 2016 for myeloma patients compared to the age/sex matched general population. ............... 112
Table 42. Estimated disparity in income tax revenue by Government in 2016 ($m, 2016). ......... 113

June 2019
xv
FIGURES
Figure 1. Development and diagnosis of multiple myeloma. ............................................................... 30
Figure 2. Overall treatment strategies for multiple myeloma. .............................................................. 33
Figure 3. Classes of pharmaceuticals used in treatment of myeloma. ................................................. 32
Figure 4. International treatment approaches for myeloma at relapse (ESMO Guidelines 2017). 39
Figure 5. First line clinical approach to myeloma management in New Zealand. ............................ 40
Figure 6. Clinical approach to relapsed/refractory myeloma treatment in New Zealand. ............. 41
Figure 7. Registrations for myeloma in the period 2004 to 2016, by sex and main ethnic group. . 49
Figure 8. Annual incidence rates from 2004 to 2016. ........................................................................ 50
Figure 9. Incidence rates per 100,000 by age group for Māori/Pasifika compared to all others combined. ................................................................................................................................................. 52
Figure 10. Age distribution of registrations for multiple myeloma in the period 2012 to 2016. ..... 52
Figure 11. Crude and age standardised all-cause mortality for patients with myeloma. .................. 56
Figure 12. All-cause and cause-specific survival for patients registered in 2004 to 2015. ............. 63
Figure 13. Overall survival by era and age group. .............................................................................. 65
Figure 14. Overall survival and cause-specific survival by age group over the period 2012 to 2016. ........................................................................................................................................................ 65
Figure 15. Overall survival for Māori/Pasifika patients registered in 2012 to 2016 by age group. .......................................................................................................................................... 66
Figure 16. Overall survival across cancer network regions in the period 2012 to 2016. ............... 67
Figure 17. Overall survival in the period 2012 to 2016, by deprivation quintile. ............................ 68
Figure 18. Age distribution of patients who received ASCT and/or bortezomib. ............................. 76
Figure 19. Interval between doses of bortezomib and distribution of the cumulative dose (N=1620). ................................................................................................................................................ 81
Figure 20. Uptake of bortezomib and ASCT by age group for patients registered in 2012-2016. 81
Figure 21. Uptake of bortezomib and ASCT for men and women registered with myeloma (95%CI). ................................................................................................................................................... 82
Figure 22. Uptake of bortezomib (all ages) and ASCT (age ≤ 70y) following registration, by region (N=1864). .............................................................................................................................. 82
Figure 23. Uptake of ASCT by age group and region (N=1864). .................................................... 83
Figure 24. Uptake of ASCT by patients age<=70y who had previously received bortezomib, by region (N=556). ................................................................................................................................. 83
Figure 25. Uptake of bortezomib and ASCT by ethnic group. ............................................................ 84
Figure 26. Uptake of bortezomib and ASCT by patients registered in 2012-2016. ........................ 84
Figure 27. Total quantity of bortezomib dispensed in May 2011 to June 2016, by region. ........... 85
The Burden of Multiple Myeloma in New Zealand
xvi
Figure 28. Overall and cause-specific survival before and after bortezomib was funded in May 2011. ............................................................................................................................................... 86
Figure 29. Overall survival by age group, before and after bortezomib was funded in May 2011. ........................................................................................................................................... 87
Figure 30. Overall survival for patients who did not receive ASCT, before and after funding of bortezomib. .............................................................................................................................................. 87
Figure 31. Overall survival of patients registered in 2012-2016 with or without bortezomib, without ASCT. ........................................................................................................................................... 88
Figure 32. Overall survival of patients who were treated with bortezomib and/or ASCT. .............. 89
Figure 33. Ratio of ED and outpatient visits to general population visits by age and sex in 2016. ................................................................................................................................................................. 103
Figure 34. Median personal NZ income by age group for 2006 and 2013 ................................. 112
June 2019
xvii
GLOSSARY
Albumin: A protein found in the blood. A patient’s albumin level can provide some indication of overall health and nutritional status and may also be useful in staging myeloma.
Allogeneic stem cell transplant:
A procedure in which stem cells from a compatible donor (usually a sibling) are collected, stored and given to the patient following high-dose chemotherapy.
Ambulatory care: Medical care provided on an outpatient basis.
Anaemia: A decrease in the number of red blood cells, or the haemoglobin that they contain. This can cause shortness of breath, weakness and tiredness.
Anaesthetic: A type of medicine used to temporarily reduce or take away sensation so that otherwise painful procedures or surgery can be performed. A general anaesthetic makes the patient unconscious and therefore unaware of what is happening. A local anaesthetic numbs the part of the body that would otherwise feel pain.
Antibiotics: Medicines used to prevent or treat an infection caused by bacteria.
Antibodies (immunoglobulins): Also known as immunoglobulins, antibodies are proteins found in the blood which are produced by cells of the immune system, called plasma cells. Their function is to bind to substances in the body that are recognised as foreign such as bacteria and viruses. They enable other cells of the immune system to destroy and remove them, thereby helping to fight infection.
Anticoagulant: Medicines used to prevent blood clots from forming.
Anti-emetics: Medicines used to prevent or minimise nausea and vomiting.
Apheresis: A procedure in which stem cells are collected from the blood using a machine that separates them out and returns the remainder of the blood components to the patient or donor.
Autologous stem cell transplantation:
A procedure in which a patient’s own stem cells are collected, stored and then given back following high-dose chemotherapy.
β2-microglobulin: A protein normally found on the surface of various cells in the body. Increased serum levels can occur in patients with myeloma or kidney disease. Lower levels are associated with a more favourable prognosis in myeloma.
Bisphosphonate: A type of medicine used to protect bone from being broken down and reduce the risk of fractures.

The Burden of Multiple Myeloma in New Zealand
xviii
Blood count: The number of red blood cells, white blood cells and platelets in a sample of blood.
Bone marrow: The soft, spongy tissue in the centre of bones that produces white blood cells, red blood cells and platelets.
Bone marrow biopsy: A procedure that involves putting a needle into a bone under local anaesthetic (usually the hip bone) to get a small sample of the bone marrow. The sample is then examined to count the number of plasma cells in the bone marrow. Normal bone marrow has less than 5% plasma cells. Bone marrow in a myeloma patient may have up to 100% plasma cells.
Bortezomib (Velcade®): An anti- myeloma medication within the class of medications known as a ‘proteasome inhibitor’.
Central line: A catheter (tube) that is inserted or tunnelled under the skin in the chest into a large vein just above the heart. It can be kept in for several months and is used to administer treatments, like chemotherapy, and to take blood samples.
Chemotherapy: Treatment with potent drugs intended to kill cancer cells. Chemotherapy drugs can be injected into a vein (intravenous or IV) or swallowed as tablets (orally).
Chromosomes: Structures comprising the DNA package and some proteins within a cell.
Consolidation treatment: Treatment given over a short period of time after the main standard dose of treatment has finished. The aim is to prolong the period of response.
Cost effectiveness analysis: A formal analytical process that compares the costs and clinical benefits of an intervention.
Cyclophosphamide: A type of chemotherapy drug which is given orally or intravenously.
Dexamethasone: A steroid often given in combination with other medicines in the treatment of myeloma.
DNA: Deoxyribonucleic acid, a molecule that contains the instructions an organism needs to develop, live and reproduce.
Duration of response: The length of remission or plateau before relapse.
Engraftment: The process by which transplanted stem cells travel to the recipient’s bone marrow, where they begin to grow and develop into new blood cells. During this time the number of red blood cells, white blood cells and platelets in the blood may be lower than normal.
EORTC: European Organisation for Research and Treatment of Cancer

June 2019
xix
Excess cost method: The total cost of the health condition minus the cost of an equal size population group, matched for age and sex (= the cost attributable to myeloma).
Extramedullary plasmacytoma:
A collection of myeloma cells found in a single location outside of the bone.
Fluorescence in situ hybridisation (FISH):
A test used to detect chromosomal abnormalities in myeloma cells.
Free light chain: Part of an antibody that circulates freely in the blood.
Genes: Strands of DNA which act as a set of instructions to make molecules called proteins. Together these make up the blueprint of life that determines how the body develops, grows and functions.
Haemoglobin: The protein found in red blood cells that carries oxygen around the body.
High-dose therapy: High-dose chemotherapy given intravenously, usually via a central line prior to patients receiving healthy stem cells as part of the transplantation procedure.
High-risk myeloma: A more active or more difficult to treat myeloma, often associated with certain genetic abnormalities.
Hypercalcaemia: A higher than normal level of calcium in the blood, which may cause loss of appetite, nausea, thirst, fatigue, muscle weakness, restlessness and confusion. Often associated with reduced kidney function since calcium can be toxic to the kidneys.
Immune system: The complex group of cells and organs that protect the body against infection and abnormal cells.
Immunocompromised: The term used to describe a person whose immune system is impaired and unable to fight infection or disease as normal.
Immunoglobulins (antibodies): Also known as antibodies, immunoglobulins are proteins found in the blood which are produced by cells of the immune system, called plasma cells. Their function is to bind to substances in the body that are recognised as foreign such as bacteria and viruses. They enable other cells of the immune system to destroy and remove them, thereby helping to fight infection.
Immunofixation: A test to identify and type immunoglobulins in the blood or urine.
Immunomodulator: A chemical agent that modifies the immune system or function of the immune system.
Immunotherapy: A type of treatment which uses the patient’s own immune system to attack the myeloma cells with a view to killing them or stopping them from growing.
The Burden of Multiple Myeloma in New Zealand
xx
Induction treatment: The initial standard-dose chemotherapy that patients receive as part of the stem cell transplant procedure. Induction treatment aims to reduce the amount of myeloma in the bone marrow before the stem cells are collected.
Intravenously: Into a vein.
Lactate dehydrogenase (LDH): Enzyme found in body tissues. Elevated blood levels occur when there is tissue damage and may occur in myeloma, where they reflect tumour-cell burden.
Lenalidomide (Revlimid®): A type of immunomodulatory medicine used in myeloma.
Light chain: Antibodies are made up of two identical heavy chains and two identical light chains. Free light chains circulate in the blood and can be measured using a highly sensitive serum free light chain assay.
Light chain myeloma: A type of myeloma where only the light chain portion of the immunoglobulin is produced. It occurs in approximately 20% of myeloma patients.
Maintenance treatment: Treatment given over an extended period, often at a lower dose, after the main standard dose of treatment has finished. Maintenance treatment aims to reduce the risk of the disease worsening (e.g. increasing paraprotein and worsening end organ damage).
Malignant: Cancerous cells which can invade and destroy tissue.
Melphalan: A type of chemotherapy drug used to treat myeloma and some other cancers.
Monoclonal Gammopathy of Undetermined Significance:
A pre-cancerous condition in which low levels of paraprotein are present in the blood. Patients do not have symptoms but have an increased risk of developing myeloma.
Mucositis: Pain and inflammation of the lining of the mouth and/or gastrointestinal tract.
NZCR: New Zealand Cancer Registry.
Non-secretary myeloma: A type of myeloma characterised by the absence of a paraprotein in both the blood and the urine. It occurs in less than 1% of patients.
Osteopaenia: Loss of bone mass and strength.
Pan-HDAC inhibitor: A medication that inhibits histone deacetylases in the treatment of some cancers.
Paraprotein: An abnormal antibody (immunoglobulin) produced in myeloma. Measurements of paraprotein in the blood can be used to diagnose and monitor the disease. Also known as myeloma protein, M protein or monoclonal immunoglobulin.
June 2019
xxi
Performance status: A measure of a patient’s ability to perform everyday functions and self-care.
Peripheral neuropathy: Damage to the peripheral nerves, particularly in the hands and feet causing pain, tingling and altered sensation.
Plasma cells: Specialised white blood cells that produce antibodies (immunoglobulins).
Plasma cell leukaemia: A cancer characterised by unusually high levels of abnormal plasma cells in the blood. It can start by itself or it can evolve from advanced myeloma.
Platelets: Small blood cells which are involved in blood clotting.
Prednisone: Type of steroid used to treat myeloma. It is frequently given in combination with a chemotherapy drug such as melphalan.
Prognosis: A medical term for predicting the probable course and outcome of a disease.
Progressive disease: Active myeloma that is worsening (e.g., increasing paraprotein and worsening end organ damage).
Quality of life: A term that refers to a person’s level of comfort, enjoyment, and ability to pursue daily activities. It is a measure of an overall sense of wellbeing.
Radiotherapy: Treatment with X-rays, gamma rays or electrons to damage or kill cancerous cells.
Red blood cells: Blood cells which transport oxygen around the body.
Refractory: Unresponsive to treatment.
Relapse: The point where disease returns or becomes more active after a period of remission or plateau (often referred to as stable disease).
Remission: The period following treatment when myeloma cells and paraprotein are no longer detectable, and there are no clinical symptoms of myeloma.
Renal impairment: Reduced kidney function. A type of protein called creatine, found in the blood, is used to monitor kidney function.
Slippage: Administration of a drug before or after the recommended interval .
Societal costs: This includes all costs to society including those to Government, institutions, families and individuals.
Spinal cord compression: The term is used to describe pressure on the spine. In myeloma, it can be caused by collapsing vertebra or by the growth of a plasmacytoma within the spinal cord.

The Burden of Multiple Myeloma in New Zealand
xxii
Stable disease: Treatment outcome where the disease has not responded to therapy (no change in paraprotein) but has not progressed. It also refers to disease that initially responded to therapy and remains stable after treatment is stopped.
Stem cell transplant: The infusion of healthy stem cells into the body. This allows the bone marrow to recover and renew its blood-forming capacity following the administration of high-dose chemotherapy.
Stem cells: The cells from which all blood cells develop. Stem cells give rise to red blood cells, white blood cells and platelets. Stem cells are normally located in the bone marrow and can be harvested from the blood for transplant.
Steroids: Hormonal substances which are naturally produced by the body, and which can also be produced synthetically to treat disease. Those used in myeloma can suppress the immune system and prevent inflammation.
T-lymphocytes: Immune cells.
Thalidomide: A type of immunomodulatory drug. Thalidomide was originally withdrawn in the 1960s because of birth defects caused when it was used as a treatment for morning sickness in pregnancy. Its use in myeloma is subject to a strict risk management programme.
White blood cells: Blood cells involved in the body’s immune system, which help to fight infection.
Adapted from myeloma.org.uk 3 and themmrf.org 4

June 2019
xxiii
ABBREVIATIONS
AL Amyloid light-chain amyloidosis
AML Acute myeloid leukaemia
ASCT Autologous (or rarely, allogeneic) stem cell transplant [‘transplant’]
ASIR Age standardised incidence rate
BMI Body mass index
BODE3 Burden of Disease Epidemiology, Equity & Cost-Effectiveness Programme
BSA Body surface area
CAR-T cells Chimeric antigen receptor T cells
CR Complete response
CRAB Hypercalcaemia, renal impairment, anaemia, bone disease
CyBorD Cyclophosphamide, bortezomib, dexamethasone
DHB District Health Board (of domicile)
DRd Daratumumab, lenalidomide, dexamethasone
DVd Daratumumab, bortezomib, dexamethasone
ESMO European Society for Medical Oncology
F-FDG PET Fluorodeoxyglucose positron emission tomography
GST Goods and Services tax (15%)
HDT High dose therapy
HRQoL Health related quality of life
IDI Integrated Data Infrastructure (Statistics NZ)
IMiD Immunomodulatory Agent
IMWG International Myeloma Working Group
IV Intravenous
mAb Monoclonal antibody
mg Milligram
MGUS Monoclonal gammopathy of undetermined significance
MM Multiple myeloma
MRD Minimal residual disease
MRDR Myeloma and Related Diseases Registry
MRI Magnetic resonance imaging

The Burden of Multiple Myeloma in New Zealand
xxiv
NDMM Newly diagnosed multiple myeloma
NGS Next generation sequencing
NHI National Health Index (National Healthcare User)
NNPAC Non-admitted patient collection
NPPA Named patient pharmaceutical assessment
NZ New Zealand
PCT Pharmaceutical cancer treatment
PI Proteasome inhibitor
PR Partial response
QALY Quality adjusted life year
Rd Lenalidomide and dexamethasone
RRMM Relapsed or refractory multiple myeloma
SC Subcutaneous
sCR Stringent complete response
SEER Surveillance, Epidemiology and End Results
SMM Smouldering multiple myeloma
SRE Skeletal related event
Vd Bortezomib and dexamethasone
VGPR Very good partial response
VTD Bortezomib, thalidomide and dexamethasone
VT Bortezomib, and thalidomide
VTP Bortezomib, thalidomide and prednisone
WHO World Health Organisation
WIES Weighted Inlier Equivalent Separations

June 2019
xxv
Jessica’s story The words “Multiple Myeloma” changed every aspect of my life. I still remember the day I first heard those words vividly, a beautiful Sunday morning in the middle of summer. I was 29, carefree, putting in offers on what we hoped would be our very first home, planning on expanding our family. In the blink of an eye that day
my entire world fell apart. Becoming a caregiver to my husband hadn’t featured in my dreams of the immediate future. My biggest dream now is our daughter growing up with her father. It still seems such a foreign dream for someone my age to hold onto so ferociously.
My rock, the strongest man I knew was in immense pain. The most attentive and playful father could no longer pick up or play with his baby due to numerous fractures. The main provider for our family could no longer work. The confident man I fell in love with began to suffer from anxiety and didn’t want to be left alone. My comedian, the most beautiful, brightest soul I have ever met stopped smiling, stopped laughing. Thank goodness I’ve got him back for the most part, but I think it’s a carer’s love and energy that feeds their patient, so I run on empty.
It’s hard to pinpoint words to describe the impact Myeloma has had on our family and particularly myself as a caregiver, yet not one area of my life remains untouched. The option of having more children being taken away due to treatment was one thing we both particularly struggled with. It was just one more choice, and part of our future that had been taken away by this disease. This is the one and only aspect that we found lacked a lot of early discussion, possibly as majority of people diagnosed with Multiple Myeloma tend to be older.
Practically, it’s incredibly difficult being a carer and juggling a young child. Providing my husband with the best care and as much love as possible, whilst keeping our baby’s life consistent. Minimising any negative impact to ensure a happy, loving, fun filled childhood that every child deserves. There aren’t enough hours in the day to do both to what I feel is the standard they deserve whilst working to put food on the table. Guilt is a regular feature in my mind now days.
Financially we have lost everything we worked for. It took over a month to even get a WINZ appointment booked. We have encountered many costs since diagnosis and although most treatments are funded, sometimes there are better treatments available which unfortunately aren’t funded in certain circumstances.
I’m a positive and strong person but this illness is a hideous beast and takes its toll on all within its reach. Emotionally I’m completely drained. I’m a mum, a wife, the provider, some days I’m a nurse, a counsellor, the pharmacist, his advocate, the protector, I’m terrified, I’m wiser and much older than my years.
Names and identifiers have been changed.

The Burden of Multiple Myeloma in New Zealand
1
June 2019
2
EXECUTIVE SUMMARY
The disease: its diagnosis, incidence, prevalence and treatment (see Sections I and II)
Multiple myeloma (myeloma) is a blood cancer that resides in the bone marrow. It affects multiple sites in the body where bone marrow is normally active in adults, including the spine, skull, pelvis, ribs, shoulders and hips. Sufferers of myeloma experience serious complications including bone and kidney disease, serious infections, and excessive levels of calcium which can lead to confusion, disorientation and weakness.
Although it is treatable, myeloma is not currently curable, and follows a remitting, relapsing course, requiring continued interventions aimed at destroying myeloma cells and controlling the symptoms and complications they give rise to. All myeloma patients eventually become unresponsive to treatment (refractory), or their disease returns (relapse). As myeloma relapses, periods of remission often become shorter and the disease becomes increasingly difficult to treat, with most patients eventually dying from the complications.
The cause of myeloma is not fully understood, although it is believed to involve an interaction of both genetic and environmental factors. It develops when plasma cells, a type of white blood cell, undergo a cancerous change and become myeloma cells. As these cells multiply, they crowd the bone marrow and prevent it from making normal numbers of red cells, white cells and platelets, leading to anaemia and a higher risk of infections, bruising and bleeding.
Diagnosis
Myeloma is a very individual cancer, and patients present with a highly varied set of clinical signs and symptoms. Classic symptoms include calcium elevation (hypercalcaemia), renal impairment, anaemia and bone disease, collectively known as CRAB. Other less common presentations of myeloma include recurrent infections, hyperviscosity (increased thickness of the blood), visual changes, headaches and dizziness. The way patients respond to treatment can also vary greatly.
These variations can be explained in part by the different features, types and subtypes of myeloma, involving factors that can influence the onset and speed of the progression of the disease. Detection of these, through analysis of the abnormal plasma cells, together with factors such as the stage of the disease, disease biology and gene mapping through the use of fluorescent in situ hybridisation (known as FISH), can be used to identify patients with high-risk disease.
The effect the myeloma is having on the patient’s body is assessed by using an international ‘staging’ system. Patients are classified into one of three risk stages, each with progressively worsening survival. The stage of myeloma is usually assessed at diagnosis and possibly again each time the disease relapses and is used for prognostic purposes. However, decisions regarding treatment depend on the presence of CRAB, the analyses described above, and MRI findings, rather than the stage of disease. The diagnostic criteria for myeloma were established by the International Myeloma Working Group (IMWG) in 2003 and updated in 2014.

The Burden of Multiple Myeloma in New Zealand
3
Myeloma is probably preceded by a pre-cancerous state known as monoclonal gammopathy of undetermined significance (MGUS), which may not have been detected. About 1% of MGUS patients will go on to be diagnosed with symptomatic myeloma each year. In between MGUS and myeloma is a state known as ‘smouldering myeloma.’ Patients in this state are monitored but generally do not receive treatment unless they have concerning signs such as abnormal bony lesions on MRI.
The rate of further progression from smouldering myeloma to symptomatic myeloma (or another blood cancer called amyloid light-chain (AL) amyloidosis) is approximately 10% per year for the first 5 years, reducing over the following years.
Reporting of myeloma to the NZCR in accordance with international guidelines is mandatory. However, it is possible that patients with smouldering myeloma who do not require treatment are classified as having myeloma, and this may explain why some patients in our study period did not receive the standard treatments.
In addition to the physical symptoms described above, many myeloma patients experience psychological distress, depression, anxiety and poor quality of life, in part associated with fear and uncertainty regarding the disease, treatments and their side effects, fear of relapse and an uncertain prognosis.
Incidence and prevalence
In New Zealand, myeloma is the second most common blood cancer (after non-Hodgkin’s lymphoma), with approximately 400 new cases reported each year, equivalent in the period 2012-2016 to 8.2 new cases per 100,000 population, or an age-standardised incidence rate of 5.19 per 100,000 population (Table 1).
Table 1. Registrations and annual incidence rates per 100,000 population in 2012-2016 by ethnic group.
Māori Pacific Asian Eur/Other Total
Total
Registrations 194 111 81 1478 1864
Annual crude incidence rate
5.53 7.59 2.93 9.86 8.20
Age std incidence rate (ASIR)*
7.19 10.13 3.51 5.05 5.19
New cases per 100,000 population; denominator: 2013 household census (non-residents excluded) *Standardised to the WHO standard population
In the same period, age-standardised incidence rates were higher for Māori (7.2 per 100,000) and Pasifika peoples (10.1 per 100,000) than others. The age specific incidence rate was consistently higher for Māori/Pasifika than for all others, especially the elderly. The causes for the

June 2019
4
differences are unknown. In the same period, myeloma incidence was higher among men (58% of new cases).
Approximately 2500 New Zealand residents, 60% of whom are male, are currently living with myeloma (54 per 100,000 population) and there are about 180 deaths each year with myeloma as the underlying cause (4.0 per 100,000 population).
Considering Australia, Canada, the UK, USA, and Sweden, the age-standardised incidence of myeloma ranged from 5.6 in Canada to 9.3 per 100,000 in the UK. Worldwide, including in New Zealand, the incidence rate is rising but the death rate (mortality) in New Zealand remains relatively stable and these trends are likely to continue. Taken together, these observations are consistent with improvements in clinical management. The median age at diagnosis was 70, although Māori and Pasifika were diagnosed at a younger age than other ethnicities (64 and 66 respectively).
Myeloma registrations in the period 2010 to 2016 were distributed unevenly around DHBs, with the highest rates in the North Island. Some of the variation could be explained by different age structures, as older populations would be expected to have higher crude incidence rates.
Treatment
The goal of myeloma treatment is to prolong survival by achieving the best possible response while ensuring quality of life is maintained. Responses to treatment are monitored regularly, using a set of highly sensitive measures. Table 2 lists medications used in the treatment of myeloma in New Zealand as well as those available and used internationally but not currently funded here.
Table 2. Medications for treatment of myeloma.
Chemotherapy drugs Cyclophosphamide Melphalan Doxorubicin
Steroids Dexamethasone Prednisone
Proteasome inhibitors (PIs) Bortezomib (Velcade®)
Carfilzomib (Kyprolis®)*
Ixazomib (Ninlaro®)*
Immunomodulatory agents (IMiDs)
Thalidomide (Thalamid®)
Lenalidomide (Revlimid®)**
Pomalidomide (Pomalyst®)*
Monoclonal antibodies (Mabs)
Daratumumab (Darzalex®)****
Elotuzumab* (Empliciti®)
Isatuximab*
pan-HDAC inhibitor Panobinostat (Farydac®)*
Funded in NZ *Not yet funded in NZ **Funded in NZ for third-line/relapse only ****Currently available in NZ on compassionate access for third-line plus only
Patients diagnosed with symptomatic myeloma usually require immediate treatment and are generally grouped by their eligibility to undergo stem cell transplant. This can be an arduous

The Burden of Multiple Myeloma in New Zealand
5
treatment with challenging side effects and a long recovery period, and eligibility is therefore largely determined by the patient’s age and health status.
Stem cell transplant
This treatment entails giving high doses of chemotherapy (known as high dose therapy or HDT) to destroy myeloma cells, and then giving stem cells to the patient to ‘rescue’ the bone marrow. If the patient’s own stem cells are given back to them, it is called an autologous stem cell transplantation (ASCT). This is by far the most common type of transplant used for myeloma.
Prior to the transplant, induction treatment is given to reduce the amount of myeloma in the bone marrow before stem cells are collected. Induction regimens vary but usually last several months, during which a combination of medications is given in cycles. These combinations usually include chemotherapy, a steroid and another novel agent such as a proteasome inhibitor (e.g. bortezomib) or an immunomodulatory agent (e.g. thalidomide or lenalidomide).
Induction treatment is followed by collecting the patient’s own stem cells, before the HDT (melphalan) is given with the aim of destroying the remaining myeloma cells. The healthy stem cells are then returned to the patient’s blood where they travel to the bone marrow and start to make new blood cells. After a period of recovery, a fixed period of chemotherapy may be given to consolidate the impact of the HDT and ASCT, although longer-term follow-up is needed to confirm evidence for consolidation treatment. Increasingly, maintenance therapy may be used where an agent such as thalidomide or lenalidomide may be given until the disease progresses.
Response rates to induction treatment followed by HDT and ASCT vary across regimens used and patient populations. The proteasome inhibitor-based combination of bortezomib, cyclophosphamide and dexamethasone has shown a complete response or near complete response rate of 39% following induction, rising to 70% following transplantation. For the combination of proteasome inhibitor carfilzomib with immunomodulatory agent lenalidomide plus steroid dexamethasone, it has been reported that 62% of patients achieved at least a near complete response in newly diagnosed myeloma after 17 months of follow-up.
Treatment for patients who are not eligible for stem cell transplant
Newly diagnosed patients in New Zealand who are ineligible for transplant typically receive several cycles of a bortezomib-based regimen. These first-line approaches are in line with international practice, although the option of an induction regimen that includes lenalidomide or carfilzomib, which is often used overseas, is not publicly funded in this setting in New Zealand.
At first relapse (second line) in New Zealand, patients are typically treated with thalidomide and dexamethasone, unless side effects compromise treatment. When patients relapse again (third line), they may receive treatment with lenalidomide and dexamethasone. Bortezomib is also funded for those patients with relapsed or refractory disease as long as they have not received funded bortezomib previously.

June 2019
6
Unfunded treatments
Compared with international guidelines, the publicly funded options for relapsed myeloma patients in New Zealand are severely limited, and a high unmet need exists. Potential gains in health-related quality of life are greater with earlier lines of therapy than later in the course of the disease, suggesting that greater gains in quality of life and overall survival could be achieved by moving other novel agents, such as lenalidomide and monoclonal antibodies (if funded) up the treatment hierarchy.
At the time of finalising this report, (May 2019), Pharmac, the national pharmaceutical management agency in New Zealand, was considering several new therapies for the treatment of myeloma, including three FDA-approved medicines: monoclonal antibody daratumumab, proteasome inhibitor carfilzomib in relapsed disease, and immunomodulatory agent lenalidomide earlier than the currently funded third-line setting. [ Record of the Pharmacology and Therapeutics Advisory Committee Meeting Held on 21 & 22 February 2019].
Daratumumab is currently provided free of charge on a case-by-case basis to New Zealand patients who have failed all available lines of therapy by the pharmaceutical supplier through a compassionate access programme. Carfilzomib has been available in New Zealand until recently on a compassionate access programme, but this has now closed.
Combination therapy with daratumumab + bortezomib + dexamethasone was approved in April 2019 by the National Health System in England and Wales for use after the first relapse.
Options for obtaining unfunded treatments are very limited. They include:
1. Named Patient Pharmaceutical Assessment
A patient’s physician may opt to apply to Pharmac for an unfunded treatment for an individual patient who may have exceptional clinical circumstances.
2. Clinical trials
Some pharmaceutical suppliers run clinical trials that make medicines available prior to Medsafe registration, subject to very specific patient criteria and strict protocols. These may only be available at 1 or 2 sites. Late stage clinical trials of medicines that have been registered by Medsafe but are not yet funded by Pharmac may also be considered.
3. Private funding
Patients and their families may consider paying privately for unfunded myeloma treatments directly from their retail pharmacies with a prescription from their specialist. Some health insurers provide subsidies for unfunded medicines, although the shortfall is often substantial.
4. Pharmaceutical supplier access programmes
There are two types of programmes:
The Burden of Multiple Myeloma in New Zealand
7
- shared cost programmes, whereby unfunded medicines are made available by the supplier at a discount. Any medicine funded privately by the patient, either fully or in part, cannot be administered on DHB sites, so the patient must find a private facility for this, and
- compassionate, early access or patient familiarisation programmes, whereby a pharmaceutical supplier may open a programme providing an unfunded medicine free of charge for specific patient populations. Sometimes these programmes cannot be taken up by all DHBs, due to lack of facilities or staff. For example, in the carfilzomib and daratumumab programmes, the treatment requires long infusions, initially on a weekly basis, and some centres are reluctant to offer it to patients because of lack of infusion chair time and nursing staff. Once a medicine is funded, however, it must be made available by all DHBs.
Survival outcomes (see Section III)
Survival statistics for myeloma are grim but improving, with long-term survival lengthening significantly with the availability of newer anti-myeloma therapies.
Over the period 2004 to 2016, both all-cause survival and cause-specific survival increased. Across all ages combined, 5-year survival increased from 36% to 45% when comparing patients who registered in the period 2004 to 2007 to the period 2012 to 2016. Likewise, 28% of patients aged 70 or over who were diagnosed in 2012 to 2016 survived for more than 5 years, compared to 18% of those who were diagnosed in 2004 to 2007.
Five-year overall survival for all patients who were registered in New Zealand in 2012 to 2016 was 45% and median survival was 51.2 months. Five-year overall survival was the same for men and women. Survival was strongly age specific, with younger individuals surviving longer than older.
Overall survival was worse for younger Māori/Pasifika peoples than for other ethnicities, however cause-specific survival did not differ between Māori/Pasifika and others in that age group, suggesting that the ethnic difference can be attributed to factors other than genetics or management of myeloma.
Overall survival at 3 years and 5 years as well as median survival was better for patients living in the Northern region than elsewhere. Overall survival was best for individuals living in least deprived regions of the country (deciles 1 to 4). Five-year survival varied from 40.5% to 50% and median survival varied from 43.8 to 60.9 months.
For comparison, 5-year relative survival ranged from 42% in Canada to 52.4% in the USA. A previous comparison between New Zealand and Australia based on patients diagnosed in the period 2006-2010 showed no statistically significant difference in 5-year relative survival rates between the countries.
Multivariate analysis showed that in New Zealand overall survival depends primarily on age, socioeconomic status, geographic location, and uptake of ASCT and novel pharmaceutical therapies (see below).

June 2019
8
Uptake and impact of new therapies and combinations (see Section IV)
Uptake of bortezomib-containing drug regimens was independent of ethnicity and higher for Northern region than other regions. Uptake of ASCT was lower for Māori/ Pasifika and slightly lower in Central cancer network region than elsewhere. ASCT was only rarely given to patients over 70 years of age because of its toxicity.
Lenalidomide-containing regimens were funded as third line therapy in September 2014. Prior to funding it was made available through a compassionate access programme and a clinical trial. Up to October 2018 lenalidomide had been given to 846 New Zealand patients 6,7.
Over 20% of patients up to 70 years of age, comprising 36% of all patients, received neither of the two most effective funded first-line therapies (bortezomib and ASCT) and many others received considerably fewer than the funded 36 doses of bortezomib. This could have been because of unwillingness to undergo the therapy, comorbidities, not requiring treatment due to only having smouldering myeloma, limited access to infusion facilities and/or lack of alternative less toxic first-line therapies. Additionally, in 2012-2016, there was regional variation in the time taken from registration to utilisation of ASCT. These two disparities both deserve explanation and remedy.
ASCT and bortezomib individually and together were associated with improved overall survival. There was a clear improvement in both overall survival and cause-specific survival after 1 May 2011 when bortezomib was funded, especially for patients over 70 years of age. The improvement in survival was larger for those patients who did not also receive ASCT.
Multivariate analysis showed that younger age at registration, higher socioeconomic status, and being domiciled in the Northern cancer region were independently associated with better survival.
There is great opportunity to improve New Zealand survival statistics further, thanks to a surge in research and the development of innovative myeloma treatments over the past couple of decades. However, funding is not keeping up with Australia and elsewhere because of the different funding models and processes that determine if, when, and how these treatments can be used in New Zealand. (Access to Medicines Report 2018, IQVIA)
Quality of life (see section V)
Quality of life was not studied formally for this report, but it includes a number of patient and carer stories that provide insights, sometimes harrowing, on reduced health-related quality of life (HRQoL). The report is also accompanied by the results of a survey of patients and carers that sheds significant light on this issue.
It is clear from these that myeloma carries a high burden of symptoms and reduced HRQoL, which varies with the course of the disease. Fatigue and physical weakness are common especially after transplant.
Osteolytic lesions develop in nearly 90% of myeloma patients, and these are frequently complicated by skeletal-related events such as severe bone pain, pathologic fractures, vertebral

The Burden of Multiple Myeloma in New Zealand
9
collapse, calcium elevation (hypercalcaemia), and spinal cord compression. These have a negative effect on patients' quality of life and affect their long-term outcomes, including survival.
Only a few formal studies on HRQoL are available, and a review of these demonstrates that extensive physical, emotional, and social challenges can be experienced by patients throughout their illness trajectories, even in periods of remission.
Large and medium HRQoL improvements occur during first-line treatments, but no clinically beneficial change or deteriorations in scores of global QoL or fatigue were reported during treatment of relapse.
A Global Burden of Disease study reported that myeloma caused 2.1 million disability adjusted life years globally in 2016 but the contribution of New Zealand to the total was not reported.
Costs of myeloma (see Section VI)
Multiple myeloma is characterised by intense use of healthcare resources for cancer treatment, adverse effects of treatment, management of disease symptoms, imaging, pharmacotherapies, comorbidities, loss of income by affected families, increases in taxpayer-funded benefits and loss of tax revenue to the government. While some of these costs are borne by patients and their families, in New Zealand, most fall on the taxpayer-funded public healthcare system.
To calculate the costs of myeloma to the healthcare system, the well-established ‘excess’ or ‘attributable’ cost approach was used, using the IDI (Statistics NZ). First, the expected health system cost in 2016 of a New Zealand resident without a diagnosis of myeloma, by sex and 5-year age group, was calculated. This was then subtracted from the health system costs of myeloma patients in the same sex and age groups. Loss of personal income was calculated in a similar way, and loss of income tax revenue for the Government was estimated for each individual from Inland Revenue Department tax tables.
Costs to the healthcare system
In 2016, the healthcare system incurred costs of at least $46.3 million on New Zealanders with myeloma, over and above what was spent on a same-sized group of the general population when matched for age group and sex.
Some of the costlier treatments for multiple myeloma include: therapy with novel medicines including bortezomib and lenalidomide; stem cell transplant; radiotherapy; surgery; intravenous bisphosphonates, and diagnostics such as MRI and FISH chromosomal analysis.
The largest expenditure attributable to myeloma in 2016 was for pharmaceuticals ($30.3 million). However, pharmaceutical costs could be greatly overestimated because of confidential rebates paid by the pharmaceutical industry to Pharmac.
Compared to the general population matched for age and sex, myeloma patients also had higher average costs for hospital admissions ($10.65 million), outpatient hospital visits ($4.41 million), laboratory testing ($0.66 million), emergency department visits ($0.30 million) and other miscellaneous items (Table 3). Laboratory costs are probably under-estimated, and primary care

June 2019
10
costs of myeloma patients have been assumed (conservatively) to be similar to those of the general population. This is because myeloma is largely managed by specialists and we did not have convincing information on primary care visits or costs.
Table 3. Estimated healthcare costs of myeloma patients and the age/sex matched general population.
Patients General population Disparity Attributable cost (%)
Items Cost ($m) Items Cost ($m) Items Cost ($m)
Admissions 3,804 $14.86 775 $4.21 3,029 $10.65 23.0%
OP 18,255 $5.16 2673 $0.76 15,582 $4.41 9.5%
ED 1,107 $0.40 271 $0.10 836 $0.30 0.6%
Labs 99,528 $0.87 20,481 $0.20 79,047 $0.66 1.4%
Pharms 138,375 $31.07 61,905 $0.81 76,470 $30.27 65.4%
Total 261,069 $52.35 86,106 $6.07 174,963 $46.28 100.0%
OP = outpatient; ED = Emergency dept; Labs = laboratory tests; Pharms = pharmaceuticals
Loss of personal income
Most men and women under 65 years of age have paid employment in addition to financial and social responsibilities. Many over 65 years of age also have full-time or part-time work. Because individuals with myeloma usually have to scale down their workload or retire from the workforce, a diagnosis of myeloma signals substantial loss of income to the family, increases to taxpayer-funded welfare benefits, and loss of tax revenue to the government.
Compared to the age/sex matched general population, in 2016 individuals with myeloma received lower incomes on average by approximately $20,000 and $10,000 for middle-aged men and women and $9000 and $6000 for men and women aged 65 or upwards. Income lost by caregivers would add to this burden but was not quantified.
Income tax revenue lost by the Government in 2016 was estimated at $2.31m for men and $1.01m for women, a total of $3.31m. Welfare benefits would increase this cost to government but were not calculated because of incomplete records.
Loss of tax revenue
Potential income tax revenue lost by the Government in 2016 varied by age group and was estimated at $1.97m for men and $0.84m for women, a total of $2.58m.

The Burden of Multiple Myeloma in New Zealand
11
Conclusions, outlook and recommendations (see Section VII)
Myeloma is a highly individual cancer, including how the disease progresses and responds to treatment. Getting the best possible outcome for each individual’s unique circumstances and reducing the overall burden of myeloma in New Zealand will require a unique approach. This report recommends moves to hasten the public funding for proven innovations, remove existing restrictions on the available treatments and ultimately give blood cancer specialists the clinical choice to utilise their expertise and the proven treatments as the international evidence base indicates. This will become increasingly important as medical treatments become tailored to the individual characteristics of each patient based on genetic analysis (‘precision medicine’). The current focus on cost must be balanced with the high quality of the outcomes delivered by new biologic therapies in particular.
Our study leads us to draw a number of more detailed conclusions and also reveals issues that warrant further investigation, as follows.
Epidemiology
1. Myeloma incidence rates have increased since 2004, and these rates will continue to increase as the population ages.
2. Overall survival improved substantially for myeloma patients registered in 2012-2016 compared to earlier periods. Our study gives confidence that this was due to developments in the management of myeloma, including funding of bortezomib, ASCT and lenalidomide.
3. Investment in dedicated myeloma nurses has also occurred during this time period, and this may have led to improved uptake of chemotherapy, adherence, and promptness of provision.
4. The Myeloma and Related Diseases Registry (MRDR) established at Monash University is an important resource for New Zealand clinicians and researchers, and can be used to supplement the NZCR, which contains little clinical data. While improving the quality of NZCR data remains a high priority, until such time as that is achieved clinicians and hospitals should be encouraged to enrol in the MRDR.
Clinical management
1. Overall, 36% of patients who registered in 2012-2015 received neither bortezomib nor ASCT therapy in the period 2012-2016. Some of these would have had serious comorbidities and others would have had ‘smouldering myeloma’ which did not require treatment during this period. Others could have declined treatment because of limited first-line treatment options, or limited access to infusion facilities. Moving infusions or subcutaneous injections into primary care or the home setting could improve adherence to bortezomib treatment and would also reduce the cost burden of outpatient visits.

June 2019
12
2. An important finding is that most patients receive a suboptimal (less than the funded) dose of bortezomib, which could be driven by disease progression or by toxicity. This suggests a need for different management strategies and/or more choice in first-line therapies.
3. Socioeconomic deprivation is associated with lower uptake of ASCT following bortezomib, and is also an independent prognostic factor for overall survival, suggesting that poorer survival is associated with both poverty and poorer uptake of ASCT.
4. Patients who are 65 to 69 years of age at registration have relatively low uptake of ASCT. The reasons for this require further study. Māori, Pacific and Asian people, as well as those living in the most deprived regions, were less likely than others to receive both therapies. The same ethnic groups were more likely to receive neither therapy. This should be further investigated.
5. Further research is needed to determine barriers to access. For example, could distance from treatment centres be a barrier? Lack of chairs in day wards could also be an issue.
Costs to government and families
1. Compared to the general population matched for age and sex, in 2016 the annual healthcare cost per myeloma patient varied from about $11,000 for elderly women to $36,000 for young men, (population mean $25,500). Improved therapies could provide cost savings to the government through benefits such as earlier return to work and improved productivity by both patients and caregivers, and recovery of tax revenue lost through absenteeism and early retirement.
2. As noted in the report, our costing of pharmaceuticals is based on list price (i.e. excluding confidential rebates), meaning the total cost of pharmaceuticals will be overestimated to an unknown extent.
3. Analyses of income and income tax in this report are limited by the incompleteness and inaccuracy of the IDI. However, compared to the general population matched for age and sex, in 2016 the disparity in income between myeloma patients and the general population matched for age and sex varied from about $4,000 for older women to $15,000 for young men. Loss of income by informal caregivers will increase this burden on families to an unknown extent.
4. Cost savings could be made in areas such as making more use of primary care, increasing allied health input, and achieving efficiencies in palliative care.
Living with myeloma
As part of this burden of disease study, Myeloma New Zealand conducted a survey of patients to gain their insights into the personal, psychosocial and financial costs of myeloma for New Zealanders living with this disease. The findings of this study have been published separately as part of this suite of reports, titled Managing Multiple Myeloma in New Zealand: Patients’ Perspectives. The following is a summary of the survey’s findings.

The Burden of Multiple Myeloma in New Zealand
13
1. Myeloma has an immense impact on patients and their carers, both in everyday life and on their overall future. They have to come to terms with a shorter life expectancy and the reality of no known cure. Most patients experience fatigue on a daily basis, many are anxious and/or in pain every day, and many suffer from depression due to their illness.
2. Many describe heightened stress levels, falling self-esteem and confidence, feeling out of control and a loss of ‘self’ and personal identity, along with and a heavy impact on their intimate relationships.
The most difficult challenges of living with myeloma are: fear and uncertainty; mental health issues, including sometimes terrifying mood swings and personality changes; loss of physical abilities, independence and income; coping with harsh medical treatments, procedures, and severe, debilitating side effects; and lack of preparation and emotional support for the ‘journey’. For a few, however, myeloma has changed their perspective on life and taken them away from the ‘treadmill of work’.
3. Time taken to diagnose myeloma is a significant issue. While most myeloma patients were diagnosed relatively quickly, many within three months, others described long episodes of GPs misunderstanding their symptoms, some being treated for flu or anaemia, with pain relief for back pain, and antibiotics for recurring infections, before eventually being diagnosed with myeloma.
A sizeable number of patients had suffered years of misdiagnoses and potentially preventable, debilitating pain, and felt the disease is not well enough understood, especially by GPs, but also by specialists. Quite a few had to move to another GP or make multiple trips to the emergency department (ED) to get the correct diagnosis.
4. Going through a stem cell transplant was in many cases a harrowing experience for both patients and carers, although views were often coloured by whether or not the transplant was successful and the length of remission it provided. Severe nausea, fatigue, lethargy and diarrhoea, isolation due to the risk of infection, continuing compromised immunity and the very long road to recovery were among the worst aspects of the treatment.
The care and support of medical staff and their own family members, and being well prepared and fully informed were important factors in getting through the ordeal.
5. The financial impact of a myeloma diagnosis is very significant. Over a quarter have had to leave full-time work, many having to stop working or retire early. While employers were generally supportive of the need for employees to take time out, patients and carers who had their own businesses or were self-employed were hard hit.
6. Almost a quarter of patients/carers have missed over 200 days of work since their diagnosis, significantly affecting income and increasing stress levels, insurance premiums and the costs of private specialists are the major contributors to the increase in patients’ costs due to myeloma diagnosis. Alternative treatments, medications, and travel and accommodation are also significant costs. The average amount a patient or caregiver has spent annually in relation to myeloma is approximately $7,600 and the estimated average loss in income of a myeloma patient since their diagnosis is over $100,000.
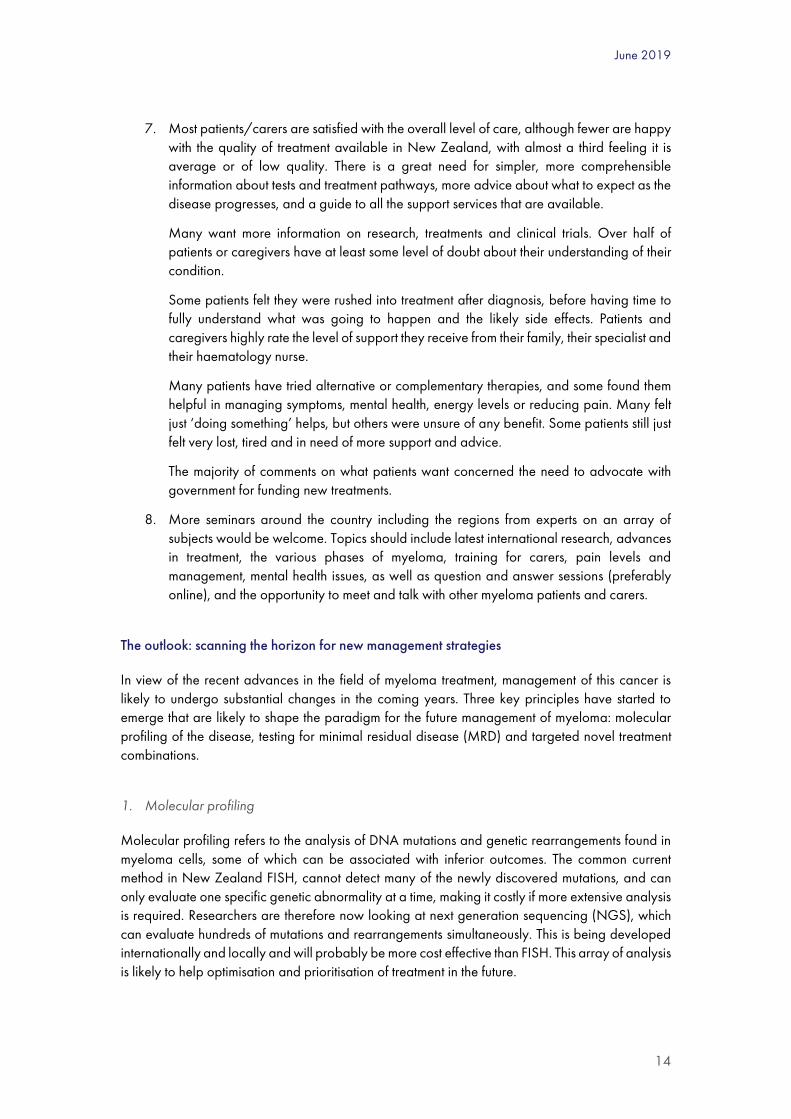
June 2019
14
7. Most patients/carers are satisfied with the overall level of care, although fewer are happy with the quality of treatment available in New Zealand, with almost a third feeling it is average or of low quality. There is a great need for simpler, more comprehensible information about tests and treatment pathways, more advice about what to expect as the disease progresses, and a guide to all the support services that are available.
Many want more information on research, treatments and clinical trials. Over half of patients or caregivers have at least some level of doubt about their understanding of their condition.
Some patients felt they were rushed into treatment after diagnosis, before having time to fully understand what was going to happen and the likely side effects. Patients and caregivers highly rate the level of support they receive from their family, their specialist and their haematology nurse.
Many patients have tried alternative or complementary therapies, and some found them helpful in managing symptoms, mental health, energy levels or reducing pain. Many felt just ‘doing something’ helps, but others were unsure of any benefit. Some patients still just felt very lost, tired and in need of more support and advice.
The majority of comments on what patients want concerned the need to advocate with government for funding new treatments.
8. More seminars around the country including the regions from experts on an array of subjects would be welcome. Topics should include latest international research, advances in treatment, the various phases of myeloma, training for carers, pain levels and management, mental health issues, as well as question and answer sessions (preferably online), and the opportunity to meet and talk with other myeloma patients and carers.
The outlook: scanning the horizon for new management strategies
In view of the recent advances in the field of myeloma treatment, management of this cancer is likely to undergo substantial changes in the coming years. Three key principles have started to emerge that are likely to shape the paradigm for the future management of myeloma: molecular profiling of the disease, testing for minimal residual disease (MRD) and targeted novel treatment combinations.
1. Molecular profiling
Molecular profiling refers to the analysis of DNA mutations and genetic rearrangements found in myeloma cells, some of which can be associated with inferior outcomes. The common current method in New Zealand FISH, cannot detect many of the newly discovered mutations, and can only evaluate one specific genetic abnormality at a time, making it costly if more extensive analysis is required. Researchers are therefore now looking at next generation sequencing (NGS), which can evaluate hundreds of mutations and rearrangements simultaneously. This is being developed internationally and locally and will probably be more cost effective than FISH. This array of analysis is likely to help optimisation and prioritisation of treatment in the future.

The Burden of Multiple Myeloma in New Zealand
15
Advancement in NGS may also improve the ease of diagnosing myeloma, which generally requires a bone marrow biopsy. However, interest is emerging in ‘liquid biopsy’, where circulating tumour DNA is isolated from the peripheral blood and analysed without the need for tissue or bone marrow biopsy. When this technology has matured it could replace the need for bone marrow biopsy when used in conjunction with other assessment tools, such as imaging.
Molecular profiling would also help us better understand the pathophysiology of myeloma and pave the way for more targeted and tailored therapeutic treatments, as opposed to the current somewhat homogeneous approach. Ultimately this is likely to lead to better outcomes and (hopefully) more cost-effective management, as the costs of genetic testing comes down.
2. Testing for minimal residual disease (MRD)
The current evaluation of response to treatment based on bone marrow testing has been around for more than a decade but given the depth of response to novel treatment strategies, these tests are no longer sufficiently sensitive for determining treatment success. A deep response, where only a small number of residual cancer cells are present, is now referred to as minimal residual disease (MRD). Next generation flow cytometry and NGS are currently available to detect MRD in the bone marrow, and fluorodeoxyglucose positron emission tomography (F-FDG PET) can be used to detect MRD outside the bone marrow.
MRD status has significant prognostic value. Patients who are MRD negative after treatment, even those with high-risk disease, often experience a good long-term outcome compared to those who do not achieve MRD negativity. This raises the possibility of having a response-adapted treatment plan based on MRD results, where patients who are MRD negative after initial treatment can forgo further treatment. Meanwhile, patients who failed to achieve MRD negativity, or progressed from MRD negative to positive, can receive intensification or re-initiation of treatment, respectively. This concept is currently being tested in clinical studies across the world. If proven feasible, such a strategy would be a very attractive and cost-effective option, as it would probably minimise unnecessary treatment and toxicities.
3. Novel treatments and combinations
Gone are the days when the only treatment option for myeloma was conventional chemotherapy. Multiple new classes of medications have been developed over the last two decades for the treatment of myeloma, and studies have consistently demonstrated a superior outcome when they are given in combinations. Although the ideal treatment strategy for myeloma remains to be determined, it is doubtful that an outright winner will ever be crowned, due to the heterogeneity of the disease and the better treatments being developed constantly.
What is certain, however, is that the current arsenal we have in New Zealand for the management of myeloma is lagging behind the rest of the world. The decision to fund bortezomib in 2011 has been serving our patients well, with many achieving good long-term outcomes. However, New Zealand still has relatively limited treatment options in frontline, for maintenance, and in particular for relapsed disease, and unless further investment/funding is put in place, we will see a widening gap in patient outcomes between New Zealand and other OECD countries.

June 2019
16
Combination treatment with proteasome inhibitors and immunomodulatory medication is likely to become the standard of care in the frontline setting. With these new combinations, we could question the role of ASCT as a consolidation treatment, although this will remain an important tool. Meanwhile, one would expect newer classes of medication such as monoclonal antibodies to be used more heavily and earlier in the course of the disease. As newer treatments become more effective and better tolerated, the current standard of triplet therapy will probably be replaced by quadruplet regimens in the next 5 to 10 years as data from clinical studies mature.
In recent years, the idea of immunotherapy, where the patient’s own immune system is manipulated to enhance tumour killing, has been gaining momentum. One of the most promising strategies is the use of chimeric antigen receptor (CAR) T-cells, where the patient’s own T-lymphocytes (immune cells) are harvested and modified to target a specific tumour cell type. Such cells would ideally remain within the patient over a long period of time and will provide long-term protection against the disease as a ‘living drug’. Following the recent success in the use of such therapy in acute lymphoblastic leukaemia and aggressive lymphomas, such technology is now being tested in myeloma as well, with promising results. Other forms of immunotherapy such as bispecific antibodies are also in development, with the aim of harvesting the power of the patient’s immune system to achieve disease control.
An overall transformation in myeloma treatment
In addition to the three pivotal points outlined above, the management of myeloma has moved from giving just a finite duration of therapy to continuous treatment, similar to the management of some non-malignant diseases, such as diabetes and cardiovascular risk management. Many other aspects of the management of myeloma have already undergone significant changes in recent years. For example, whole body magnetic resonance imaging (MRI) is now used as part of the diagnostic work-up instead of skeletal survey with x-ray, and more potent bisphosphonates are now available to reduce the risk of fractures.
Together, these developments are likely to transform the treatment of myeloma in the coming years. While we are still some way away from curing myeloma, it is possible to foresee treating myeloma as a chronic disease rather than a fatal disease in the not-too-distant future.
Clinicians and patients are rightly encouraged by these developments, and as a nation we need to embrace them. With a raft of novel myeloma treatments already registered abroad, and others in late stages of development, our policymakers need to ensure New Zealanders living with myeloma receive treatment in line with international best practice. Reducing the burden of this devastating disease is both essential and achievable.
Recommendations
1. Systems for collaboration, data collection and benchmarking to ensure equitable quality of care
The current NZCR lacks important clinical information and needs to enable better and more accurate data capture, to make it a more useful tool for ongoing comparison and monitoring of

The Burden of Multiple Myeloma in New Zealand
17
outcome. In addition, or at least until such time as the NZCR has been made more robust, clinicians should be resourced to participate in the Monash registry.
2. Efficient delivery of medications
Medication is a major cost and needs to be delivered efficiently so that the patient receives the full benefit of the treatment. Initiatives such as district nurse administration, partnering with local general practice and providing equipment for patient self-administering at home should be considered.
3. Facilitating access to compassionate-use programmes
Some medications available in other countries but not currently funded by Pharmac are available to patients via compassionate-use programmes set up by pharmaceutical companies. However, some centres are unable to make full use of these programmes due to lack of infusion chair time and nursing staff. Resolving these capacity issues is likely to lead to better treatment options for the patients at a fraction of the cost.
4. Investment in more effective first-line treatments
As the duration of remission is likely to be the longest during first remission and second remission, investment into better access of novel therapeutic agents in earlier lines of treatment is most likely to lead to better quality of life and less time off work, delay the need for residential care, and improve life-expectancy.
5. Supporting and facilitating the conducting of clinical trials in New Zealand
Another way to improve access to medicine for patients is to work collaboratively with pharmaceutical companies in the formatting and conducting of clinical trials. New Zealand is well positioned for conducting clinical trials due to our small geographic size with relatively dense population in major centres, high quality clinicians and first-world healthcare systems. There should also be equitable access to clinical trials across New Zealand, including support with travel costs if required. Ensuring all eligible patients are offered participation in clinical trials may also lead to better clinical data on effectiveness5.
6. Improving support, information and advocacy for patients
Patients and carers need better preparation and support throughout the treatment process, particularly when undergoing difficult procedures such as ASCT. This includes access to counselling and mental health support, ways to connect with other patients and support groups, and training for caregivers, particularly in coping with patients’ depression and mental health issues.
They also need more and better information, presented in a way that is easy to understand, and at the right time. They want information including seminars and expert talks about: the disease and its
June 2019
18
many treatments; survival rates; new treatments; clinical trials and research; and compassionate access programmes.
Patients want Myeloma New Zealand and other related patient groups to actively advocate to government to fund new treatments and facilitate the opening of more clinical trials and access programmes.
They also see better education of GPs and medical professionals to improve understanding of myeloma as critical. Upskilling doctors at the frontline should lead to earlier tests and earlier diagnoses.
Patients and carers would also like to see greater public understanding and awareness of myeloma.
7. Investing in research and facilitating collaboration among centres engaged in research
Although great work is being done in local hospitals and universities, this is often done in isolation without additional funding or support from the government. Direct investment into these stakeholders and facilitation of collaboration between centres would allow streamlining of research and reduce overlap.
8. Introducing performance-based risk management and cost-effectiveness analyses
In addition to ongoing price negotiations, performance-based risk management of pharmaceutical therapy could be introduced. It might also be possible to divest from some treatments with minimal real-world benefits across the disease spectrum in order to focus on those medicines with larger proven gains. Ongoing improvements in patient selection, and increasing use of generics, are likely to be important in the future6.
9. Research funding for New Zealand-specific economic evaluation of therapies to treat myeloma
This should include ASCT, novel pharmacotherapies and cancer care management7 using real-world evidence as distinct from clinical trials, as shown is this report. There is also a need for methodologically comparable studies across all major cancers, especially those that are particularly costly and/or have high prevalence.
10. Further research based on the findings of this report
The following issues identified in this study require further investigation:
- Small but meaningful differences in survival for patients living in different cancer regions: further study could identify the cause for these differences, and facilitate best management practice in all regions.

The Burden of Multiple Myeloma in New Zealand
19
- The large proportion (36%) of patients who registered in 2012-2015 who received neither bortezomib nor ASCT therapy in the period 2012-2016: potential reasons for this finding are outlined above, but the issue is significant and worthy of further investigation.
- The association of poorer survival both with poverty and poorer uptake of ASCT.
- The causes for the higher age-standardised incidence rate in Māori and Pasifika peoples.
- The finding that most patients receive a suboptimal dose of bortezomib.
- Barriers to access, such as distance from treatment centres and availability of chairs in day wards and
- The relatively low uptake of ASCT by patients who are 65 to 69 years of age at registration, given that in countries such as the US, ASCT is considered up to the age of 75, depending on individual fitness.

June 2019
20
John’s story In 2004 I was a consultant working in Auckland, in my mid-40s. After a few strange symptoms, I was lucky enough to find a rheumatologist who was able to diagnose sarcoidosis. Unbeknown to me, those who have sarcoidosis have a higher risk of developing Myeloma.
Within 18 months the symptoms of sarcoidosis receded, however a final blood test by the specialist showed something unusual, so I was transferred down the corridor at North Shore Hospital to see the haematologist where I was diagnosed with smouldering myeloma in late 2005. Regular monitoring with four-monthly blood tests followed.
In 2009, blood tests showed that the blood condition had changed from ‘smouldering’ to progressive myeloma. One prognosis I was given was 24 months, due to the presence of an aggressive clone. Luckily a brand-new drug called bortezomib (Velcade®) was available for my induction chemotherapy, albeit unfunded. So, I borrowed $20,000 and proceeded to have induction chemo towards the end of 2009.
Since 2009, I seem to have either been in treatment, or recovering from treatment. I have had at least four cycles of chemo for myeloma, and induction chemo for autologous and allogeneic stem cell transplants, followed by Donor Lymphocyte Infusions. I have become resistant to all the front-line drugs that Pharmac provides, so my options are limited to clinical trials or private supply. I have also had to have gruelling chemotherapy for Acute Myeloid Leukaemia (AML), another fatal blood cancer, caused by the treatment for myeloma, due to highly unusual circumstances.
It has been almost impossible to carry out any work, especially given the highly specialised nature of the consultancy services I provide, and the fact that ‘chemo brain’ is real!
My family life and social connections are under stress, as someone frequently on high doses of steroids is not pleasant to live with. My bone marrow has been compromised by all the chemotherapy, and the consequent lowered immunity limits my social activities and friendship maintenance. I have had shingles and have been hospitalised though emergency admissions numerous times for neutropenic fevers and respiratory tract infections.
I am currently undergoing intensive chemotherapy for myeloma over nine months, and the results thus far have been very good, although not the complete remission I was hoping for. Hopefully the treatment will buy me a little breathing space where I am treatment free, and new drugs become available. Finally, even though I have two fatal blood cancers, I feel very lucky. My appreciation of every day, my awareness of the good things moment by moment, is far heightened over the distant time when I was working full time. I have survived far longer than predicted, and the AML is currently in remission.
Names and identifiers have been changed.

The Burden of Multiple Myeloma in New Zealand
21

June 2019
22
I MULTIPLE MYELOMA AND ITS CLINICAL MANAGEMENT
Summary
1. Multiple myeloma is a blood cancer that resides in the bone marrow and is associated with serious complications including hypercalcaemia, renal impairment, anaemia and bone disease.
2. Multiple myeloma, commonly referred to as myeloma, affects multiple sites in the body where bone marrow is normally active in adults, including the spine, skull, pelvis, ribs, shoulders and hips.
3. Myeloma is not currently curable and follows a remitting relapsing disease course, necessitating continued therapeutic interventions to maintain disease control.
4. Myeloma is the second most common blood cancer worldwide. As a region, Australasia reported the highest age standardised incident rate of myeloma at 5.8 cases per 100,000 population.
5. The goals of myeloma treatment are to prolong survival by achieving the best possible response while ensuring quality of life is maintained.
6. Treatment strategies are aimed at destroying myeloma cells in order to control the symptoms and complications they give rise to.
7. At diagnosis, symptomatic myeloma patients requiring treatment are generally grouped by their eligibility to undergo stem cell transplant with high dose chemotherapy. Stem cell transplant can be an arduous treatment, and eligibility is therefore largely determined by a patient’s health status.
8. In New Zealand in the first line setting, transplant-eligible patients typically receive an induction treatment comprising of chemotherapy (cyclophosphamide), with a steroid (dexamethasone) and a newer anti-myeloma therapy called bortezomib. This is followed by high dose chemotherapy with melphalan, and stem cell transplant. Consolidation treatment with bortezomib, dexamethasone and thalidomide typically follows a couple of months after the transplant, when patients have recovered sufficiently to withstand additional therapy.
9. Newly diagnosed patients in New Zealand who are ineligible for transplant typically receive several cycles of a bortezomib based regimen.
10. These first line approaches are in line with international practice, although the choice of an induction regimen that includes lenalidomide or carfilzomib is often used overseas, but this is not publicly funded in this setting in New Zealand.

The Burden of Multiple Myeloma in New Zealand
23
11. At second line (first relapse) in New Zealand, patients are typically treated with thalidomide and dexamethasone, unless side effects compromise treatment. A small proportion of patients received a second transplant in the period 2012-2016.
12. When patients relapse again (third line), they may receive treatment with lenalidomide and dexamethasone.
13. Compared with international guidelines, the publicly funded options for relapsed myeloma patients in New Zealand are extremely limited.
14. At the time of writing, Pharmac, the funding agency for pharmaceuticals in New Zealand, was considering several new therapies for the treatment of myeloma, including daratumumab and carfilzomib in relapsed disease and lenalidomide earlier than the currently funded third line setting.
The disease
The diagnosis of any cancer can be a shocking, difficult and bewildering process for patients and their families. This is true for myeloma where the process involves discovering a future of treatments, remissions, complications and relapses.
Myeloma is a blood cancer that resides in the bone marrow and is associated with serious complications including bone disease and renal impairment8. Myeloma affects multiple sites in the body where bone marrow is normally active in adults including within the bones of the spine, skull, pelvis and rib cage, and the areas around the shoulders and hips9. Despite many recent advances in the treatment of myeloma, it remains incurable, with patients experiencing periods of remission before the disease inevitably relapses. As myeloma relapses, periods of remission often become shorter and the disease becomes increasingly difficult to treat, with most patients eventually dying from the complications of myeloma8. This remitting relapsing nature of myeloma necessitates continued therapeutic intervention to maintain disease control8 and highlights the importance of access to new therapeutic options, particularly for patients whose disease has relapsed or is non-responsive to interventions at diagnosis.
“Not knowing what the future holds and how long my husband will be alive for, when will the myeloma get worse and how will we cope...”
“Multiple myeloma has turned me from a fit, active retired person into an old man.”
“Sorrow. Feeling 'different' from other people. Isolation. Uncertainty.”
“It's very stressful living with the disease, especially knowing it's incurable and many of the more effective treatments aren't available here in NZ.”
“The shattering decrease in my physical abilities and fitness.”
“It has been life-changing. It turned our world upside down.”

June 2019
24
Although sometimes referred to as rare and occurring in mostly older patients, myeloma is the second most common blood cancer10 and up to 10% of those diagnosed with myeloma are aged younger than 509. Myeloma is not considered by Pharmac to be a rare disease; therefore, it does not qualify for special contestable funding that is available for medicines to treat rare disorders11.
Worldwide in 2016 there were 138,509 incident cases of myeloma and the disease was responsible for 98,437 deaths, equating to an age standardised incidence rate of 2.1 cases per 100,000 persons and an age-standardised death rate of 1.5 per 100,000 persons12. Between 1990 and 2016, new (incident) cases of myeloma increased 126% and deaths increased by 94% worldwide12. Considering Australia, Canada, the UK, USA, and Sweden, the age-standardised incidence of myeloma ranged from 5.6 in Canada to 9.3 per 100,000 in the UK. As a region, Australasia reported the highest age standardised incidence rate of myeloma at 5.8 per 100,000 persons, and the second highest age standardised death rate of 2.8 per 100,000 persons, behind North America 12. In the period 2011 to 2013, myeloma was ranked the number 13 cancer in New Zealand for new cases.
According to US registry data, myeloma represents approximately 1.8% of all new cancer cases and about half of those individuals diagnosed with myeloma are still alive 5 years later13. Survival is better for younger patients than the elderly. Recently published real-world data based on almost 5,000 myeloma patients in Sweden found that individuals aged under 65 years had a median survival of 7.7 years, compared with a median of 3.4 years for those aged over 65 years14. From the same study, patients diagnosed with myeloma in more recent years experienced significantly higher rates of response to treatment and survived significantly longer than those diagnosed earlier in the 8-year study period14. Importantly, the period of this study included the introduction and standard use of newer anti-myeloma medications14. Although survival has lengthened with the increased availability of newer anti-myeloma therapies, unmet need remains considerable due to the relapsing nature and highly individual course of the disease.
The goals of treating myeloma are to prolong survival by achieving the best possible response while ensuring quality of life is maintained for as long as possible 10. These goals have been made more possible in recent years with the introduction
“Loss of life and living on a knife edge.”
“The transplant was an extremely gruelling process, got infections afterwards as well, and the myeloma came back within 3 months.”
“I was delighted to be able to have a transplant after successful treatment with Velcade. Although I was pretty sick afterwards (as expected) it kept the myeloma at bay for 7 years. I was back at work after 3 months and felt great.”
“There is no support for families, nothing around the reality of what is in the future and dealing with issues around death. This has never even been addressed.

The Burden of Multiple Myeloma in New Zealand
25
of newer anti-myeloma medications known as PIs and IMIDs, together with the increasing use of ASCT 14. Even more recently the introduction of monoclonal antibodies has demonstrated additional improvement to response rates and survival15,16.
Risk factors for myeloma include age, ethnicity, sex (being male), obesity, and having MGUS or solitary plasmacytoma17.
The cause of myeloma is not fully understood 18 although it is believed to involve an interaction of both genetic and environmental factors. It develops when plasma cells, a type of white blood cell, undergo a cancerous change and become myeloma cells19. Myeloma cells multiply without any proper order, forming tumours that accumulate in different parts of the body. As myeloma cells multiply, they crowd the bone marrow and prevent it from making normal numbers of red cells, white cells and platelets, leading to anaemia and a higher risk of infections, bruising and bleeding18.
Myeloma is often described as being a very individual cancer. This is because the way that patients experience symptoms and the way that they respond to treatment can vary greatly 19. This variation can be explained in part by the different serological and genetic types and subtypes of myeloma 19. In general, the serological type of myeloma is described by which type of excess immunoglobulin is produced. Each immunoglobulin is made up of a combination of two ‘heavy’ chains and two ‘light’ chains18. The immunoglobulin type can then be further sub-classified depending on the type of light chain it has 19. Approximately two-thirds of myeloma patients have what is called IgG type myeloma, with either a kappa or lambda light chain component19. In about 20% of patients, the myeloma cells only produce light chains and no whole immunoglobulins19.
Patients with myeloma can also be grouped on the basis of the disease’s genetic subtype. Myeloma is associated with genetic abnormalities, with many of these occurring as abnormal rearrangement or abnormal quantity of the chromosomes19. These chromosomal abnormalities can be detected when analysing the abnormal plasma cells, and can influence the onset and speed of the progression of myeloma, and how well a patient responds to treatment 19. The more common genetic subtypes of myeloma include hyperdiploidy (having extra copies of the chromosomes),
“Even though the scans showed multiple fractures in my spine…at no time did anyone mention that it might be MM. The pain was so severe I could barely breathe… and two weeks before I was finally diagnosed I had pain so bad in the top of my right leg I couldn’t walk. The ortho specialist admitted me to hospital with a suspected broken hip. After more x-rays and scans they found 2 spots on my pelvic bone, hence I was given a bone marrow biopsy, and then was told I had MM (stage 3). I have been left severely disabled and feel this could have been prevented if I was diagnosed sooner.”

June 2019
26
t(4;14), t(14;16), t(11;14), t(14;20), abnormalities of chromosome 1, and del(17p) 19. Patients presenting with del(17p), t(4; 14), t(14;16) or t(14;20) are considered to be genetically high risk 20. In addition to chromosomal abnormalities, other features such as stage of disease at diagnosis, disease biology and gene expression can also be used to identify patients with high-risk disease21.
The stage of myeloma is usually assessed at diagnosis and possibly again at each time the disease relapses, and it is used for prognostic purposes 19. The goals of staging are to assess the effect that the myeloma is having on the body 19; however, the decision regarding treatment depends on the presence of CRAB, (Hypercalcaemia, Renal impairment, Anaemia, Bone disease (Table 4), light chain, plasma cell burden, and magnetic resonance imaging (MRI) findings rather than the stage of disease.
Table 4. Common complications of myeloma.
C Hypercalcaemia Hypercalcaemia is often a prominent feature late in the course of myeloma 22.
Hypercalcaemia is primarily a consequence of tumour-induced bone disease, where widespread destruction of bone tissue and bone resorption leads to an efflux of calcium 22, 23.
Renal impairment may also play a role, as damaged kidneys are unable to efficiently clear excess calcium load from the serum 23.
Approximately 13% of myeloma patients present with hypercalcaemia 24. Patients may show signs of confusion, disorientation, muscle weakness, needing to urinate often and cardiac arrhythmia 23, 25.
R Renal impairment
Renal impairment is a common and potentially serious complication of myeloma that results from the accumulation of excess M-protein in the renal tubules.
Renal impairment is observed in approximately 20% to 25% of patients at myeloma presentation 26 and up to 50% of patients at some point during the course of the disease 27, 28.
A Anaemia Anaemia is another common complication of myeloma. This condition results from the disruption of red blood cell production that is caused by the excessive amount of plasma cell clones in the bone marrow 29.
About two thirds of patients present with anaemia at diagnosis 30. Patients with anaemia may experience fatigue, difficulty with breathing or angina31.
B Bone disease Bone disease is the most common complication of myeloma.
Approximately 80% of myeloma patients experience a pathological fracture over the course of their disease and 90% will have bone lesions 32.
Invasion and expansion of plasma cell clones from the bone marrow weakens and damages the bone, leading to the formation of osteolytic bone lesions and the development of bone fractures, spinal cord compression, hypercalcaemia and osteoporosis 22.
The International Staging System (ISS), is a commonly used prognostic system for patients with previously untreated myeloma (Table 5). This system combines host (serum albumin) and tumour

The Burden of Multiple Myeloma in New Zealand
27
(serum β2-microglobulin) factors to assess disease stage. In this model, serum albumin reflects general performance status and serum β2-microglobulin reflects both tumour burden and renal function.
Using the ISS, patients are classified into one of three risk stages (I−III), each with progressively worsening median survival 33. The ISS can also be combined with risk assessments for serum lactate dehydrogenase (LDH) and chromosomal abnormalities to form the Revised International Staging System (R-ISS). (Table 5). The R-ISS aims to stage the disease more effectively 34.
Serum lactate dehydrogenase (LDH) is a biomarker used in myeloma. LDH above the upper limit of normal suggests a more aggressive disease course with a high proliferation rate and/or the presence of tumour mass35.
Chromosomal abnormalities detected by interphase fluorescent in situ hybridization (iFISH) are a key element to decide the genetic features of myeloma. The iFISH test is used to map the genetic material in human cells, including specific genes or portions of genes. It can detect chromosomal abnormalities such as deletions (e.g. del[17p]) or translocations (e.g. t[4;14]) and is carried out using a sample of the patient’s bone marrow.
In newly diagnosed myeloma, standard-risk disease is characterised by the absence of del(17p), translocation t(4;14), translocation t(14;16), or translocation t(14;20). High-risk disease is characterised by at least one of the aforementioned abnormalities 20, 36.
“My son had debilitating back pain from age 27 until diagnosis of myeloma (Solitary Plasma Cytoma) aged 31 years. There was ongoing misdiagnosis by GPs, a rheumatologist, and an orthopaedic surgeon during this period. Eventually my son started losing feeling and function in his legs, and an after-hours GP contacted the Neurology Department. They admitted him urgently through the Wellington Hospital ED. A large lesion was found in his spine, and he felt overwhelming relief that the pain 'wasn't in his head' and ‘able to be controlled by a spa bath and exercises.”

June 2019
28
Table 5. Myeloma disease staging.
Prognostic factor
ISS Stage Criteria
I Serum β2-microglobulin <3.5 mg/L and serum albumin ≥3.5g/dL
II
Not stage I or III, i.e.:
- Serum β2-microglobulin <3.5 mg/L, but serum albumin <3.5g/dL, or
- serum β2-microglobulin 3.5 to <5.5 mg/L irrespective of the serum albumin
III Serum β2-microglobulin ≥5.5 mg/L
Chromosomal abnormalities (CA) by iFISH
High risk Presence of del(17p) and/or translocation t(4;14) and/or translocation t(14;16)
Standard risk No high-risk CA
LDH
Normal Serum LDH < the upper limit of normal
High Serum LDH > the upper limit of normal
R-ISS stage
I ISS stage I and standard-risk CA by iFISH and normal LDH
II Not R-ISS stage I or III
III ISS Stage III and either high-risk CA by iFISH or high LDH
CA, Chromosomal abnormalities; iFISH, interphase fluorescent in-situ hybridisation; ISS, International Staging System; LDH, lactate dehydrogenase; R-ISS, revised International Staging System. Sourced from Moreau et al. (2017) 34
Myeloma is probably preceded by a pre-cancerous state known as MGUS, although it may not have been documented in the patients beforehand. Like myeloma, MGUS has a detectable paraprotein in the blood, although it has no associated symptoms. About 1% of MGUS patients will go on to be diagnosed with symptomatic myeloma 9. In between MGUS and myeloma is a state known as ‘smouldering myeloma.’ This is when the amount of abnormal plasma cells in the bone marrow or abnormal paraprotein in the blood exceed that of those individuals with MGUS,

The Burden of Multiple Myeloma in New Zealand
29
but the patient remains asymptomatic without CRAB symptoms. The rate of further progression from this smouldering state to symptomatic myeloma (or another blood cancer called AL amyloidosis) is approximately 10% per year for the first 5-years, then 3% per year for the next 5 years, then 1% to 2% per year for the following 10 years 37.
Monitoring of these patients is important to detect any changes that could indicate transformation to myeloma, and the need for treatment. There have been suggestions that smouldering myeloma could benefit from early treatment 38.
Patients with myeloma usually present with a highly varied set of clinical signs and symptoms31. Classic myeloma complications include serious end-organ damage collectively referred to as ‘CRAB’, representing hypercalcaemia, renal impairment, anaemia and bone disease 39 (see Table 4).
Other less common presentations of myeloma include recurrent infections, hyperviscosity (increased thickness of the blood), which may cause problems including confusion, visual changes, headaches and dizziness 31.
In addition to the complications described above, many myeloma patients may also experience psychological distress and poor quality of life 40-42. This is in part associated with the fear and uncertainty regarding the disease, treatments and their side effects, fear of relapse and an uncertain prognosis 43, 44.
In a study undertaken in the United Kingdom with myeloma patients and their caregivers, approximately 27% of patients reported signs of anxiety and 25% reported signs of depression. Almost half (49%) of caregivers reported signs of anxiety and 14% signs of depression 45. Anxious and or depressed patients had more than double the unmet needs of non-anxious/depressed patients 45. The study participants were on average 5 years post-diagnosis, highlighting the importance of long-term supportive care and the need for screening of psychological disorders in both patients and their caregivers 45.
The development and diagnosis of myeloma is summarised in Figure 1.
“Should have been picked up earlier but appears not well known. My GP was clueless and kept treating me with ibuprofen for rib pain. Referred me to an endocrinologist after a blood test showed low iron. Finally had a CT scan after he couldn't find anything obvious. Came back with diagnosis of multiple myeloma. ….There is not a lot of awareness of MM symptoms by GPs in general. I had months of pain and frustration before getting a correct diagnosis.”
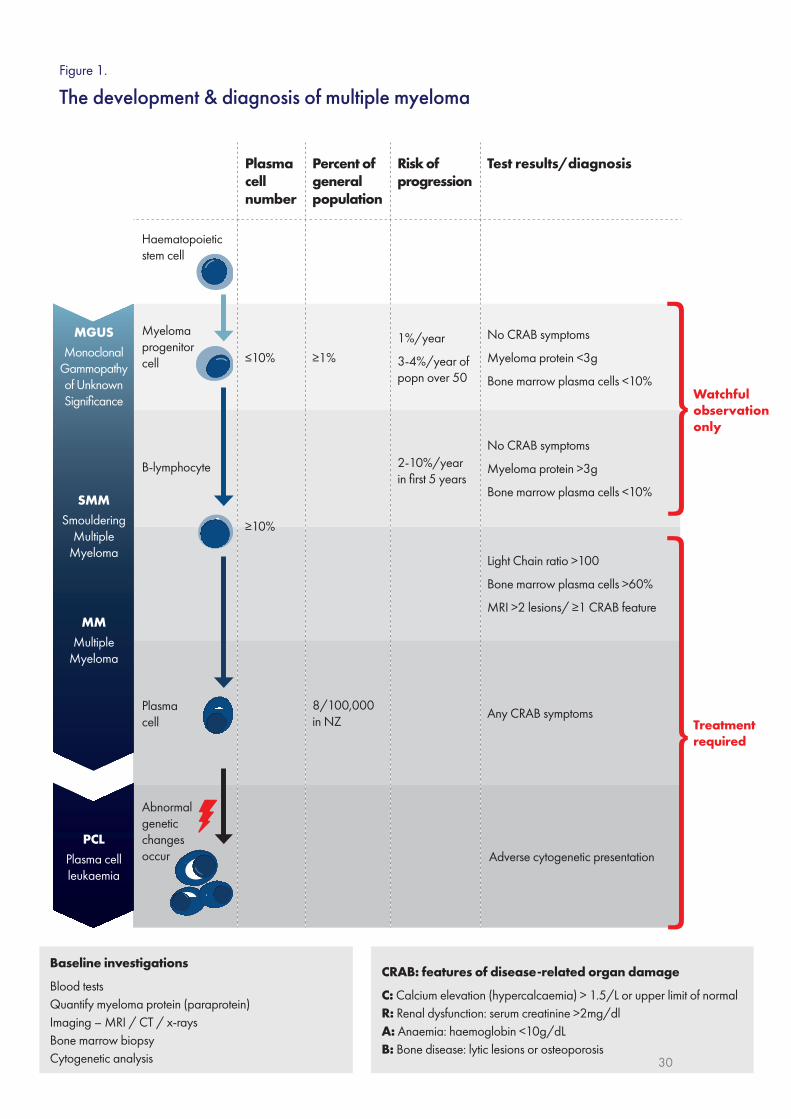
Plasma cell number
Percent of general population
Risk of progression
Test results/diagnosis
≤10% ≥1%1%/year
3-4%/year of popn over 50
No CRAB symptoms
Myeloma protein <3g
Bone marrow plasma cells <10%
≥10%
2-10%/year in first 5 years
No CRAB symptoms
Myeloma protein >3g
Bone marrow plasma cells <10%
Light Chain ratio >100
Bone marrow plasma cells >60%
MRI >2 lesions/ ≥1 CRAB feature
8/100,000 in NZ
Any CRAB symptoms
Adverse cytogenetic presentation
Treatment required
Haematopoietic stem cell
Myeloma progenitor cell
Watchful observation only
B-lymphocyte
Plasma cell
Abnormal genetic changes occur
Baseline investigations
Blood testsQuantify myeloma protein (paraprotein)Imaging – MRI / CT / x-raysBone marrow biopsyCytogenetic analysis
CRAB: features of disease-related organ damage
C: Calcium elevation (hypercalcaemia) > 1.5/L or upper limit of normalR: Renal dysfunction: serum creatinine >2mg/dlA: Anaemia: haemoglobin <10g/dLB: Bone disease: lytic lesions or osteoporosis
MGUSMonoclonal
Gammopathy of Unknown Significance
MMMultiple
Myeloma
PCLPlasma cell leukaemia
SMMSmouldering
Multiple Myeloma
Figure 1.
The development & diagnosis of multiple myeloma
30

The Burden of Multiple Myeloma in New Zealand
31
Management of multiple myeloma
The aim of myeloma treatment is to destroy myeloma cells in order to control the symptoms and complications that they give rise to 19. Monitoring the response to a treatment is carried out regularly, and typically includes regular blood and sometimes urine testing, a bone marrow biopsy and occasional radiological scans. The main categories of treatment are described in Table 619, 46.
Table 6. Criteria used to measure the response to treatment.
Treatment outcome Definition
Minimal Residual Disease (MRD) negativity
A highly sensitive measure of disease in the bone marrow, used predominantly in clinical trials. Less than 1 myeloma cell per million bone marrow cells.
Stringent Complete Response (sCR)
No detectable paraprotein, below-normal free light chain ratio and absence of myeloma cells in bone marrow.
Complete Response (CR)
5% or less plasma cells in the bone marrow, no detectable paraprotein and disappearance of any plasmacytomas.
Very Good Partial Response (VGPR)
90% or greater reduction in blood and urine paraprotein.
Partial Response (PR) Greater than or equal to 50% reduction of paraprotein in blood or greater than or equal to 90% reduction in 24h urinary paraprotein or light chain excretion.
Stable Disease (SD) Not meeting criteria for CR, VGPR, PR or progressive disease.
Progressive Disease (PD)
Increase of more than 25% in blood or urine paraprotein or the development of new myeloma-related symptoms.
Adapted from Kumar et al (2016) 46

June 2019
32
Treatment strategies
Level I evidence from clinical trials of the efficacy of ASCT and novel pharmacotherapies is well established. Patients diagnosed with symptomatic myeloma usually require immediate treatment. If a patient is ‘transplant eligible’, treatment that is recommended by guidelines typically will consist of a ASCT in combination with high dose chemotherapy, together with other cycles of anti-myeloma medication 10. High dose chemotherapy with transplant is an intensive treatment option that is not suitable for all patients. It is generally limited to younger and/or fitter patients – although there is no rigid age cut-off 3. Decisions to transplant or not are guided by the overall health, impact of any other illnesses and the biological age of each patient 10. In New Zealand, very few patients over 70 years of age are offered a transplant.
Figure 2. Classes of pharmaceuticals used in treatment of myeloma.
For abbreviations see the Glossary.
Figure 3 provides an overview of New Zealand and international treatment regimens. These are explained in more detail in the text that follows.
“Everyone knows that from the first day of diagnosis your life will never be the same… I had always had a busy, well-structured life controlled by me…..but we were in a fog. No support services offered and no clue about who to ask. Just an overall feeling of we must get this started NOW. So much wiser now. And now I am no longer in control.”

Maintenance options
Consolidation
Treatment options
VMP: Bortezomib + melphalan + prednisone
MPT: Melphalan + prednisone + thalidomide
VD: Bortezomib + dex
CTD: Cyclophosphamide + thalidomide + dex
Rd: Lenalidomide + dex
CRD: Cyclophosphamide + lenalidomide + dex
VRd: Bortezomib + lenalidomide + dex
CyBorD: Cyclophosphamide + bortezomib + dexamethasone (dex)
VTD: Bortezomib + thalidomide + dex
Consolidation options
Transplant
M: high-dose melphalan, then
ASCT: autologous stem cell transplant
VTD: Bortezomib + thalidomide + dex
Induction options
CyBorD: Cyclophosphamide + bortezomib* + dexamethasone (dex)
VRD: Bortezomib + lenalidomide + dex
KCd: Carfilzomib + cyclophosphamide + dex
KRd: Carfilzomib + lenalidomide + dex
VTD: Bortezomib + thalidomide + dex
CTD: Cyclophosphamide + thalidomide + dex
VTD: Bortezomib + thalidomide + dex
V: Bortezomib
R: Lenalidomide
VRD: Bortezomib + lenalidomide + dex
V: Bortezomib
R: Lenalidomide
Second transplant
T: Thalidomide
No further treatment until relapse
Candidate for transplant?
First line treatment
Assessment & maintenance
First relapse
Usual practice in NZ (funded)
Preferred guideline recommended regimens unfunded in NZ
Other funded options available in NZ but less commonly or not used
A maximum of 36 doses (up to 9 cycles) of bortezomib is permitted per patient
*
Note:
Yes No
Figure 3
New Zealand & international myeloma treatment options & pathways

Preferred guideline recommended regimens unfunded in NZ
Other funded options available in NZ but less commonly or not used
Usual practice in NZ (funded)
A maximum of 36 doses (up to 9 cycles) of bortezomib is permitted per patient
Lenalidomide is funded in NZ only at 3rd line, or at 2nd line if patient has a neuropathy
Daratumumab is currently available in NZ on compassionate access
B Cell Maturation Antigen
Bispecific T cell engager
Antibody drug conjugate
*
**
***
****
*****
******
Note:
Thalidomide-based treatment
or Bortezomib-based treatment
or Carfilzomib-based treatment
TD: Thalidomide + dexamethasone (dex)
CTD: Cyclophosphamide + thalidomide + dex
Thalidomide-based treatment
or Lenalidomide**/bortezomib/ carfilzomib-based treatment
CRD: Cyclophosphamide + lenalidomide + dex
DVD: Daratumumab*** + bortezomib + dex
DRD: Daratumumab + lenalidomide + dex
KRd: Carfilzomib + lenalidomide + dex
Kd: Carfilzomib + dex
PomD: Pomalidomide + dex
VD-Pano: Panobinostat + bortezomib + dex
Elo-Rd: Elotuzumab** + lenalidomide + dex
IRd: lxazomib** + lenalidomide + dex
Vd: Bortezomib + dex
IsaLd: Isatuximab + lenalidomide + dex
Kd: Carfilzomib + dex
KRd: Carfilzomib + lenalidomide + dex
KCd: Carfilzomib + cyclophosphamide + dex
DVD: Daratumumab + bortezomib + dex
DRD: Daratumumab + lenalidomide + dex
VD-Pano: Bortezomib + dex + panobinostat
Elo-VD: Elotuzumab + bortezomib + dex
CTD: Cyclophosphamide + thalidomide + dexamethasone (dex)
TD: Thalidomide + dex
Vd: Bortezomib + dex
CyBorD: Cyclophosphamide + bortezomib + dex
VCD: Bortezomib + cyclophosphamide + dex
PomD: Pomalidomide + dex
DRD: Daratumumab + lenalidomide + dex
DVD: Daratumumab + bortezomib + dex
D: Daratumumab (single agent)
Isa-Ld: Isatuximab + lenalidomide + dex
Clinical trials, eg:
Anti-BCMA**** Car-T cell therapy
Anti-BCMA BiTE*****
Anti-BCMA ADC******
RD: Lenalidomide + dex
Rd: Lenalidomide + dex
If transplant eligible, consider second ASCT
First line treatment?
Second (3rd line) or subsequent relapse
If prior bortezomib* or carfilzomib treatment
If no prior bortezomib or carfilzomib (or if patient received first-line
lenalidomide**)
First relapse (2nd line treatment)
34
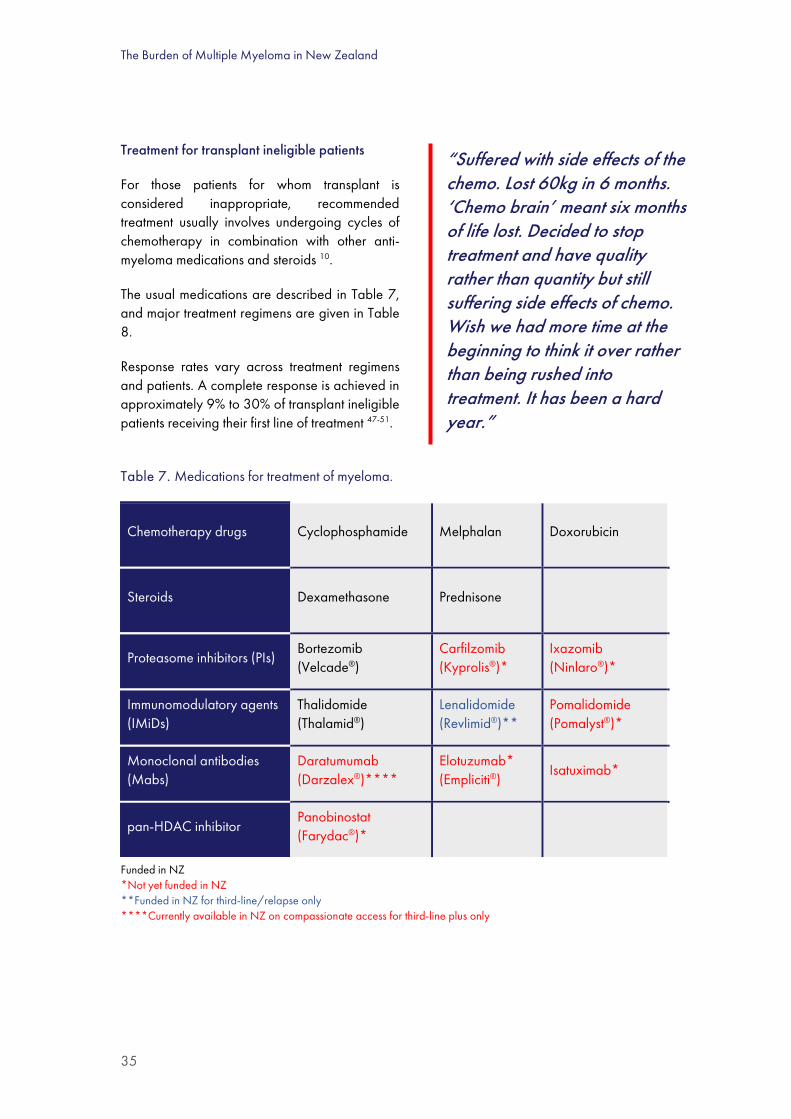
The Burden of Multiple Myeloma in New Zealand
35
Treatment for transplant ineligible patients
For those patients for whom transplant is considered inappropriate, recommended treatment usually involves undergoing cycles of chemotherapy in combination with other anti-myeloma medications and steroids 10.
The usual medications are described in Table 7, and major treatment regimens are given in Table 8.
Response rates vary across treatment regimens and patients. A complete response is achieved in approximately 9% to 30% of transplant ineligible patients receiving their first line of treatment 47-51.
Table 7. Medications for treatment of myeloma.
Chemotherapy drugs Cyclophosphamide Melphalan Doxorubicin
Steroids Dexamethasone Prednisone
Proteasome inhibitors (PIs) Bortezomib (Velcade®)
Carfilzomib (Kyprolis®)*
Ixazomib (Ninlaro®)*
Immunomodulatory agents (IMiDs)
Thalidomide (Thalamid®)
Lenalidomide (Revlimid®)**
Pomalidomide (Pomalyst®)*
Monoclonal antibodies (Mabs)
Daratumumab (Darzalex®)****
Elotuzumab* (Empliciti®)
Isatuximab*
pan-HDAC inhibitor Panobinostat (Farydac®)*
Funded in NZ *Not yet funded in NZ **Funded in NZ for third-line/relapse only ****Currently available in NZ on compassionate access for third-line plus only
“Suffered with side effects of the chemo. Lost 60kg in 6 months. ‘Chemo brain’ meant six months of life lost. Decided to stop treatment and have quality rather than quantity but still suffering side effects of chemo. Wish we had more time at the beginning to think it over rather than being rushed into treatment. It has been a hard year.”
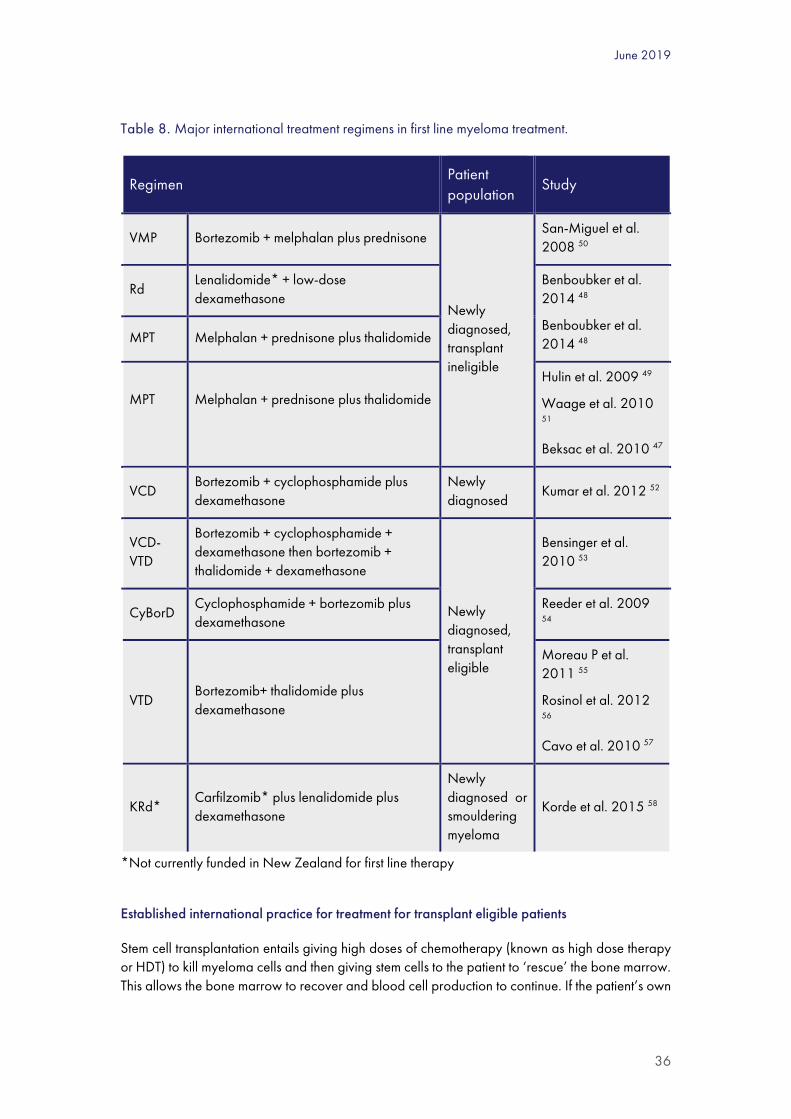
June 2019
36
Table 8. Major international treatment regimens in first line myeloma treatment.
Regimen Patient population
Study
VMP Bortezomib + melphalan plus prednisone
Newly diagnosed, transplant ineligible
San-Miguel et al. 2008 50
Rd Lenalidomide* + low-dose dexamethasone
Benboubker et al. 2014 48
Benboubker et al. 2014 48 MPT Melphalan + prednisone plus thalidomide
MPT
Melphalan + prednisone plus thalidomide
Hulin et al. 2009 49
Waage et al. 2010 51
Beksac et al. 2010 47
VCD Bortezomib + cyclophosphamide plus dexamethasone
Newly diagnosed
Kumar et al. 2012 52
VCD-VTD
Bortezomib + cyclophosphamide + dexamethasone then bortezomib + thalidomide + dexamethasone
Newly diagnosed, transplant eligible
Bensinger et al. 2010 53
CyBorD Cyclophosphamide + bortezomib plus dexamethasone
Reeder et al. 2009 54
VTD Bortezomib+ thalidomide plus dexamethasone
Moreau P et al. 2011 55
Rosinol et al. 2012 56
Cavo et al. 2010 57
KRd* Carfilzomib* plus lenalidomide plus dexamethasone
Newly diagnosed or smouldering myeloma
Korde et al. 2015 58
*Not currently funded in New Zealand for first line therapy
Established international practice for treatment for transplant eligible patients
Stem cell transplantation entails giving high doses of chemotherapy (known as high dose therapy or HDT) to kill myeloma cells and then giving stem cells to the patient to ‘rescue’ the bone marrow. This allows the bone marrow to recover and blood cell production to continue. If the patient’s own
The Burden of Multiple Myeloma in New Zealand
37
stem cells are given back to them, it is called an ASCT. This is by far the most common type of transplant used for myeloma 3. An allogeneic transplant uses donor marrow, usually from a sibling, and is uncommonly used for myeloma treatment.
Prior to the transplant, induction treatment is given to reduce the amount of myeloma in the bone marrow before stem cells are collected. Induction regimens vary but usually last several months, during which a combination of medications are given in cycles 3. Induction combinations usually include chemotherapy, a steroid and another novel agent such as a proteasome inhibitor (e.g. bortezomib) or an immunomodulatory agent (e.g. thalidomide or lenalidomide) 31. Major treatment regimens for myeloma in first line treatment are described in Table 8, with the types of medications summarised above (Table 7).
Induction treatment is followed by collecting the patient’s own stem cells before a high dose of chemotherapy (usually melphalan) is given with the aim of destroying the remaining myeloma cells. The healthy stem cells are then returned to the patient’s blood where they travel to the bone marrow and start to make new blood cells 3. After a period of recovery, a fixed period of chemotherapy is usually given to consolidate the impact of the HDT and ASCT. Increasingly, maintenance therapy may be used where an agent such as thalidomide or lenalidomide may be given until the disease progresses 10.
Response rates to induction treatment followed by high dose therapy and ASCT vary across regimens used and patient populations. The proteasome inhibitor-based combination of bortezomib, cyclophosphamide and dexamethasone has shown a complete response or near complete response rate of 39% following induction, rising to 70% following transplantation 54. For the combination of proteasome inhibitor carfilzomib with immunodulatory agent lenalidomide plus steroid dexamethasone, it has been reported that 62% of patients achieved at least a near complete response in newly diagnosed myeloma after 17 months of follow-up 58.
While evidence from clinical trials shows that HDT with ASCT can improve the duration of response and extend life when compared with standard dose anti-myeloma treatment, the doses used are more toxic and increase the risk of side-effects 3. There is also a long recovery period associated with HDT and ASCT 3.
Clinical management of relapsed/refractory myeloma
All patients with myeloma eventually become unresponsive to treatment (refractory), or their myeloma disease returns (relapse)8. A new course of treatment is required when symptoms return or escalate, paraprotein rises rapidly or additional myeloma disease is found outside of the bone marrow (e.g. new bone lesions)59. Clinical management for these patients takes into consideration several factors including disease characteristics such as genetic risk status, details and outcomes of prior therapies, and patient characteristics such as general health status and any other illnesses suffered 59.
General management recommendations for relapsed and/or refractory myeloma from the International Myeloma Working Group (IMWG) include treating the patient with a medication (or a class of medication) that they have not yet been exposed to in their prior line of therapy 59. For example, a patient treated with a proteasome inhibitor such as bortezomib at their initial diagnosis,

June 2019
38
may benefit from treatment with an immunomodulatory agent such as lenalidomide when they experience relapse. Additionally, if a patient has responded to their first line treatment for at least 6-12 months, there may be benefit in retreating with a similar regimen at relapse 59.
The combinations of therapies used in the treatment of relapsed/refractory myeloma are increasing as newer therapies are developed and trialled. Until recently, treatment typically included an immunomodulatory agent, or a proteasome inhibitor combined with dexamethasone 60, 61. The registration of therapies with novel modes of action such as daratumumab and panobinostat, together with new versions of proteasome inhibitors and immunomodulatory agents, have added to this already growing pool of options and increased the potential for combinations of therapies (Table 9).
Table 9. Major international treatment regimens in treatment of relapsed/refractory myeloma.
Regimen Evidence
Rd Lenalidomide plus dexamethasone Stewart et al. 201562
KRd* Carfilzomib plus lenalidomide plus dexamethasone
Stewart et al. 201562
VD-Pano* bortezomib plus dexamethasone plus panobinostat
San-Miguel et al. 201463
Kd Carfilzomib plus dexamethasone Dimopoulos et al. 201664
Rd-Elo* Lenalidomide plus dexamethasone plus elotuzumab
Lonial et al. 201565
IRd* Lenalidomide plus dexamethasone plus ixazomib
Moreau et al. 201666
DVd* bortezomib plus dexamethasone plus daratumumab
Palumbo et al. 201616
DRd* Lenalidomide plus dexamethasone plus daratumumab
Dimopoulos et al. 201615
Adapted from Moreau et al. 2017 34 CR, complete response * not currently funded in New Zealand
Evidence of response to these combinations varies across the regimens and populations studied. Differences such as performance status, number and type of prior lines of therapies and risk status of the patients make it difficult to compare outcomes that are not compared in head to head trials.
Recently published guidelines from the European Society of Medical Oncology (ESMO) propose two-drug (doublet) and three-drug (triplet) combinations for patients with relapsed disease, depending on which anti-myeloma therapy was initially used (Figure 4).

The Burden of Multiple Myeloma in New Zealand
39
Figure 4. International treatment approaches for myeloma at relapse (ESMO Guidelines 2017).
Adapted from Moreau et al. 2017 34
In addition to the treatments described above, patients with symptomatic myeloma also undergo treatment with bone protecting bisphosphonate medication to reduce the risk of vertebral fractures, pain and other skeletal events 31. Supportive care including anti-nausea medications, antibiotics and antivirals are also commonly used to prevent and manage side effects of the chemotherapy and anti-myeloma treatments.
Clinical management of myeloma in New Zealand
Newly diagnosed myeloma
As with international recommendations, choice of treatment for newly diagnosed myeloma patients in New Zealand is guided by the patient’s suitability and willingness to undergo high dose therapy with melphalan followed by ASCT (Figure 5). This approach is increasingly favoured, even in older patients, provided they have adequate health status to cope with what is often described as an intensive treatment. In practice, about half of newly diagnosed myeloma patients up to 70 years of age, but very few older patients, undergo ASCT (see Section II).
Transplant eligible myeloma patients undergo approximately 5 cycles of induction treatment, followed by high dose therapy with melphalan and autologous stem cell transplantation. Two to three months later, patients receive approximately 4 cycles of consolidation treatment. The number of induction and consolidation cycles prior to and following transplant may vary depending on availability/scheduling of services for autologous stem cell transplantation. In New Zealand, the aim is to complete a combined (induction plus consolidation) total of 9 bortezomib-based cycles.

June 2019
40
Bortezomib, cyclophosphamide and dexamethasone (CyBorD or VCD) is a standard induction regimen, with bortezomib, thalidomide and dexamethasone (VTD) a standard consolidation regimen in New Zealand. Continuing with VCD at consolidation is an alternative to VTD.
Other considerations for ASCT eligible patients in the first line setting is planned repeat autologous stem cell transplantation, particularly for younger, fit, high risk patients. In this procedure, it is recommended that the second transplantation be performed 3 to 6 months following the initial transplantation. However, in the period 2012 to 2016, only 3% of patients received repeat ASCT.
Patients for whom high dose therapy and autologous stem cell transplantation are deemed inappropriate generally receive the same, or a similar, induction regimen as transplant eligible patients (Figure 5), bortezomib, cyclophosphamide and dexamethasone for example.
Whilst international guidelines highlight several combinations as potential first line regimens for both transplant eligible and transplant ineligible patients 34, clinical management in New Zealand is restricted to bortezomib containing regimens, as it is the only novel agent publicly funded for myeloma treatment at diagnosis 67.
Figure 5. First line clinical approach to myeloma management in New Zealand.
**Considered for patients unable/unwilling to travel for bortezomib based regimens.
Treatment for relapsed/refractory myeloma
Compared with international guidelines, the publicly-funded options for relapsed myeloma patients in New Zealand are severely limited, and a high unmet need exists. Agents that are used abroad but not funded in New Zealand include the proteasome inhibitors carfilzomib and ixazomib, the immunomodulatory agent pomalidomide, and the monoclonal antibody daratumumab (Table 7).

The Burden of Multiple Myeloma in New Zealand
41
For most New Zealand myeloma patients with relapsed, refractory disease, public funding of novel agents is limited to thalidomide at first relapse (second line) and lenalidomide at second relapse (third line), which is later than international guideline recommendations 67, 68 (Figure 6).
Exceptions to this include patients who did not receive funded bortezomib at first diagnosis (who may receive up to 8 cycles of bortezomib at first relapse) 67, and patients unable to tolerate thalidomide or bortezomib, who may then receive lenalidomide at first relapse 68.
Lenalidomide can also be used in second line if patients experience >Grade 3 peripheral neuropathy with either thalidomide or bortezomib, precluding further treatment with either. At October 2018, lenalidomide had been given to 846 New Zealand myeloma patients69.
Publicly-funded treatment options after a patient’s myeloma disease has stopped responding to lenalidomide are limited to retreatment with chemotherapy agents such as melphalan and cyclophosphamide.
A second autologous transplant may also be considered in the first relapse setting. This can be an effective therapy and can confer remission for a year or more. This practice varies throughout the country, with one DHB having performed over 30 repeat transplants.
Palliative care is available in New Zealand for a person of any age who has a life-limiting illness70. Palliative care, which involves supporting and helping the person to live as comfortably and fully as possible, is provided in the community, hospices and hospitals. This care is available at all stages of the life-limiting illness. The Ministry of Health palliative care team is responsible for coordinating the palliative care work plan and leading national palliative care service development and improvement work 70.
Figure 6. Clinical approach to relapsed/refractory myeloma treatment in New Zealand.
*2nd line bortezomib is available for patients who have not previously received funded bortezomib. ASCT, autologous stem cell transplant NPPA, named patient pharmaceutical assessment.
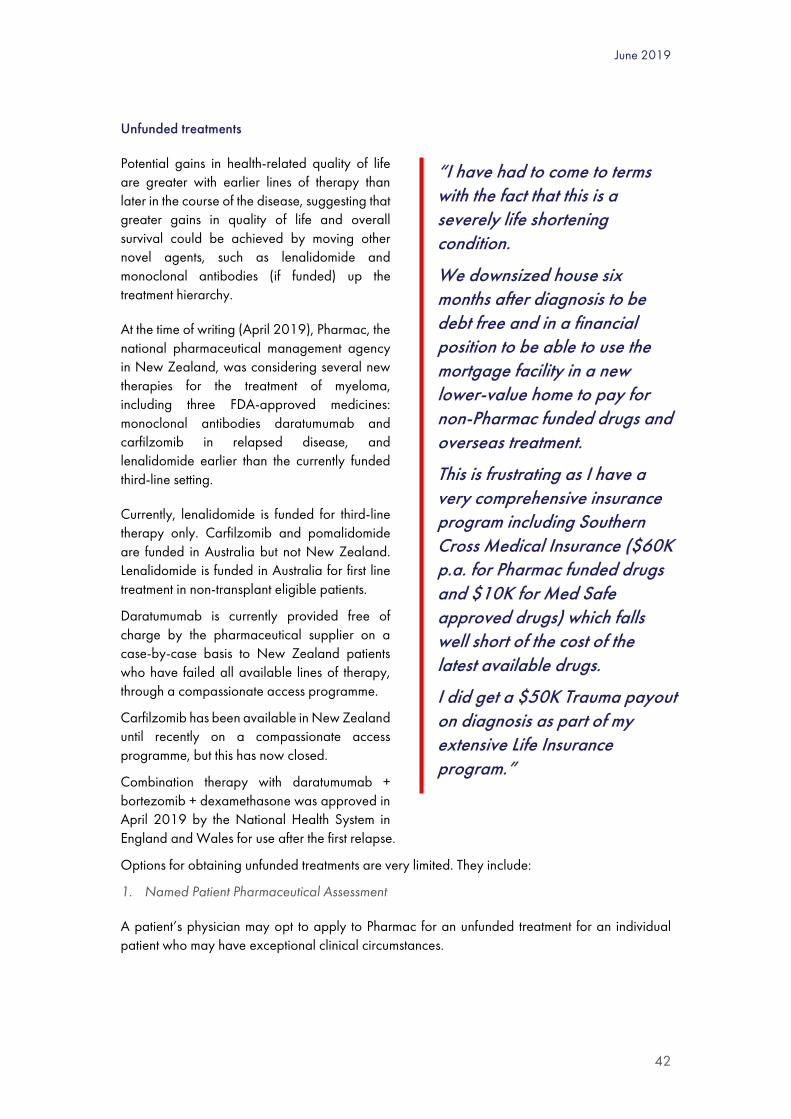
June 2019
42
Unfunded treatments
Potential gains in health-related quality of life are greater with earlier lines of therapy than later in the course of the disease, suggesting that greater gains in quality of life and overall survival could be achieved by moving other novel agents, such as lenalidomide and monoclonal antibodies (if funded) up the treatment hierarchy.
At the time of writing (April 2019), Pharmac, the national pharmaceutical management agency in New Zealand, was considering several new therapies for the treatment of myeloma, including three FDA-approved medicines: monoclonal antibodies daratumumab and carfilzomib in relapsed disease, and lenalidomide earlier than the currently funded third-line setting.
Currently, lenalidomide is funded for third-line therapy only. Carfilzomib and pomalidomide are funded in Australia but not New Zealand. Lenalidomide is funded in Australia for first line treatment in non-transplant eligible patients.
Daratumumab is currently provided free of charge by the pharmaceutical supplier on a case-by-case basis to New Zealand patients who have failed all available lines of therapy, through a compassionate access programme.
Carfilzomib has been available in New Zealand until recently on a compassionate access programme, but this has now closed.
Combination therapy with daratumumab + bortezomib + dexamethasone was approved in April 2019 by the National Health System in England and Wales for use after the first relapse.
Options for obtaining unfunded treatments are very limited. They include:
1. Named Patient Pharmaceutical Assessment
A patient’s physician may opt to apply to Pharmac for an unfunded treatment for an individual patient who may have exceptional clinical circumstances.
“I have had to come to terms with the fact that this is a severely life shortening condition.
We downsized house six months after diagnosis to be debt free and in a financial position to be able to use the mortgage facility in a new lower-value home to pay for non-Pharmac funded drugs and overseas treatment.
This is frustrating as I have a very comprehensive insurance program including Southern Cross Medical Insurance ($60K p.a. for Pharmac funded drugs and $10K for Med Safe approved drugs) which falls well short of the cost of the latest available drugs.
I did get a $50K Trauma payout on diagnosis as part of my extensive Life Insurance program.”

The Burden of Multiple Myeloma in New Zealand
43
2. Clinical trials
Some pharmaceutical suppliers run clinical trials that make medicines available prior to Medsafe registration, subject to very specific patient criteria and strict protocols. These may only be available at 1 or 2 sites. Late stage clinical trials of medicines that have been registered by Medsafe but are not yet funded by Pharmac may also be considered.
3. Private funding
Patients and their families may consider paying privately for unfunded myeloma treatments directly from their retail pharmacies with a prescription from their specialist. Some health insurers provide subsidies for unfunded medicines, although the shortfall is often substantial.
4. Pharmaceutical supplier access programmes
There are two types of programme:
- Shared cost programmes, whereby unfunded medicines are made available by the supplier at a discount. Any medicine funded privately by the patient, either fully or in part, cannot be administered on DHB sites, so the patient must find a private facility for this; and
- Compassionate, early access or patient familiarisation programmes, whereby a pharmaceutical supplier may open a programme providing an unfunded medicine free of charge for specific patient populations.
Sometimes these programmes cannot be taken up by all DHBs, due to lack of facilities or staff. For example, in the carfilzomib and daratumumab programmes, the treatment requires long infusions, initially on a weekly basis, and some centres are reluctant to offer it to patients because of lack of infusion chair time and nursing staff. Once a medicine is funded, however, it must be made available by all DHBs.
“I’ve been fortunate that when I’ve relapsed, there has generally been a new and effective treatment available, either through Pharmac funding, or through a drug trial or compassionate access. It’s only one of the most recent drugs, Pomalidomide, that we’ve had to self-fund. I’m grateful to the medical staff who have navigated the often byzantine drug regulations to achieve this.
The flexibility of my work as a university lecturer, and tolerant colleagues, meant that I had a satisfying career until I retired in 2014.”

June 2019
44
Ben’s story My wife’s initial diagnosis (4.5yrs ago) was very traumatic – having gone to AE with muscles spasms in shoulders - only to be told a few hours later that it was a broken neck caused by multiple myeloma (which we had never heard of before). Our life (and I believe our children’s lives) changed from that point on. We had
been planning to travel to Australia the next week to visit our daughter and I had just started a new job following major heart surgery. The holiday was cancelled, close family had to be told, then friends, and special arrangements had to be made so I could work remotely - all very stressful whilst navigating an unfamiliar medical landscape.
The initial shock lasted a few months while we came to understand what multiple myeloma was, but the complexities of the disease, the science and various treatment protocols took much longer to absorb, and we continue now to try and keep pace with recent developments. It is always changing.The longer-term impact has meant my wife had to give up her job as a practising psychotherapist, and I have taken early retirement to spend more time with her while she is well. My daughter came back from abroad with her partner and settled in Auckland…and my son separated from his wife (which may have been due in part to the added stresses of his mother’s condition). I started drinking more heavily than I had done in the past. Fortunately, money was not an issue since we had been prudent and planned well for retirement during our 35 years of marriage
However, there have been positives. I finally recognised I had a drinking problem and joined AA and have now been sober for 2.5 yrs. I am closer and more emotionally available to my wife now more than ever. We were always close to our children, but now I think we are more honest as a family. We can cut through all the noise & busyness of life in general and make decisions more easily. We know and appreciate what’s important and tend not to put things off, rather do things now & live in the moment, plus we have become more spiritually aware, and we don’t take too much for granted. Saying all that – it is still very difficult to live with multiple myeloma. The emotional roller coaster has very high and low dips. Our understanding and compassion are often stretched and after 3.5yrs in a treatment-free, very good partial remission, my wife relapsed and following several months back on chemo-therapy, she is soon to undergo her 2nd stem cell transplant. The stress and worry returns, and with it a sense of again facing the unknown.
Our life currently, orbits around doctor’s appointments, blood tests and hospital visits. We are firmly back in the hospital system. The different treatments 2nd time around have caused new and more severe side effects, but we are hopeful that she will again make a good recovery and whilst it probably won’t be a drug free remission this time – we understand that the maintenance regime is better tolerated.
We live in hope that a cure for this terrible disease will not only be found (in the not too distant future) but will also be readily available and accessible for those of us who live in New Zealand and who need it.
Names and identifiers have been changed.

The Burden of Multiple Myeloma in New Zealand
45

June 2019
46
II EPIDEMIOLOGY OF MULTIPLE MYELOMA AND ITS TREATMENTS
Summary
1. Myeloma is the second most common haematological malignancy with approximately 400 new cases reported each year (60% male; 17% Māori/Pasifika). In 2012-216, there were approximately 8.2 new cases per 100,000 population or 5.2 per 100,000 when age standardised. Rates were higher for Māori and Pasifika.
2. The age specific incidence rate was consistently higher for Māori/Pasifika over 50 years of age, especially the elderly.
3. The causes for the higher age standardised incidence rate in Māori/Pasifika peoples are unknown. Further analysis would require different data sources and is outside the scope of this report.
4. The incidence (new diagnoses per 100,000 population) has been rising over the last 10 years, and this is likely to continue.
5. The median age at diagnosis is 70, although Māori and Pasifika are in general diagnosed at a younger age than other ethnicities (64 and 66 respectively).
6. The highest numbers of cases were registered in Waitemata, Counties, Canterbury and Waikato District Health Boards of domicile, but the highest incidence rates were in Northland, MidCentral, Whanganui and Wairarapa. Northern and Southern Cancer Network regions together carried 61% of the burden of cases.
7. Approximately 2500 individuals are currently living with myeloma in New Zealand. The patient and carer stories included in this report, and the patient survey, highlight the impact that myeloma has on the individuals and their caregivers physically, emotionally, financially, and the burden on their families.
8. Age standardised mortality varied from year to year but, unlike incidence, did not increase significantly over the period of observation. This suggests improvements in therapy such as better treatments, shorter time to treatment, cancer care coordination and management of co-morbidities, which is especially important for the elderly.
9. Patients with myeloma are now living longer than before. In the latest time period available (2012-2016), approximately 45% of patients with myeloma lived beyond 5 years, compared with only 36% in the past.
10. Higher incidence of myeloma is noted amongst Māori and Pasifika, and poorer survival for patients up to 70 years of age compared to other ethnicities. However, cause-specific survival is similar between Māori/Pasifika and other ethnicities, indicating that the higher mortality rate is not the direct result of myeloma or myeloma-related treatment but rather deaths from other causes.

The Burden of Multiple Myeloma in New Zealand
47
11. Māori and Pasifika patients were over-represented in the highest level of socio-economic deprivation, as they are in the general population. Patients in the more deprived areas of New Zealand had worse uptake of ASCT and inferior survival, but ethnicity was not found to be an independent prognostic factor. This suggests that factors other than ethnicity, such as access to healthcare, may be the cause for the inferior outcome.
12. A significant improvement in survival has been observed following Pharmac’s funding of bortezomib in 2011 and lenalidomide in 2014. The proportion of patients who received bortezomib (viz. the uptake) was higher for men than women; independent of ethnicity; and higher for Northern region than other regions.
13. Uptake of ASCT was higher for men than women; lower for Māori/Pasifika; and slightly lower in Central cancer network region than elsewhere.
14. The greatest impact of Pharmac’s funding decision was seen in those patients over 70 years of age, with a marked improvement from 18% to 28% 5-year survival.
15. Māori, Pacific and Asian people, and those living in the most deprived regions were less likely than others to receive the most effective fully funded first-line therapies, viz. bortezomib-containing drug regimens followed by ASCT. The same ethnic groups were more likely to receive neither therapy.
16. Almost one-quarter of patients up to 70 years of age received neither bortezomib nor ASCT, especially in Central region where 28% of patients received neither therapy. This could have been because they had smouldering myeloma and were deemed not to need treatment, or were unwilling to undergo the therapy, had comorbidities, had limited access to infusion facilities, and/or lack of less toxic alternative first-line therapies.
17. Although usage of bortezomib without ASCT was similar across regions, there were variations in optimal therapy with bortezomib-containing regimens followed by ASCT. This combination was highest in Midland region and lowest in Central region, and the proportions of patients who were not given either therapy was lowest in Midland region and highest in Central region.
18. The best 5-year survival was experienced by those patients who were younger, received bortezomib-based treatment, proceeded with autologous stem cell transplant, were not in the top 4 deciles of socioeconomic deprivation, and lived in the Northern cancer network region (Northland, Waitemata, Auckland and Counties Manukau).
19. Patients living in poorer regions of the country have poorer survival, at least partly because of lower uptake of ASCT.
Methodology
The following national data collections were used in these analyses:
National Cancer Registry: ICD10 C90.00, C90.10, C90.01 (or ICD9-AM 20300, 20310, 20301) in 2004-2016

June 2019
48
National Mortality Register, 2004-2015 (latest available)
National Pharmaceutical Collection, 2011-2016
National Minimum Dataset (NMDS), 2004-2016
Plasmacytomas (ICD10-AM C90.2 and C90.3) were excluded because some of these can be cured with radiotherapy and others progress to myeloma, which is registered separately. It is noted that the Ministry of Health includes these in its reports, but they are relatively rare and therefore will have little impact on population costs or outcomes. The epidemiological analyses were conducted using the above datasets directly (i.e. outside of the IDI).
Statistical analyses were performed on Stata v.12 and Excel 2010. Comparisons between Kaplan-Meier survival curves used either the log rank test by default and/or the Wilcoxon test (stated).
Note: the Monash registry (not used in these analyses)
An additional data collection of growing value is the Myeloma and Related Diseases Registry (MRDR), established in 2012 at Monash University71. This is a bi-national (Australia and New Zealand) register of patients diagnosed with myeloma, plasmacytoma, plasma cell leukaemia and monoclonal gammopathy of undetermined significance (MGUS). It gathers information on these diseases including the date of diagnosis, staging, blood test and x-ray findings, survival, quality of life and the type of treatment. The MRDR has proved to be a valuable resource for studies of renal failure and survival. As it develops, this register is expected to help clinicians and hospitals to provide the best possible care to people with these conditions and allow evaluation of the translation of advances in therapy (such as the introduction of new targeted therapies) into long-term outcomes, outside the setting of clinical trials (see Section VII: Recommendations).
Diagnosis of myeloma
The diagnosis of myeloma depends on the combination of histology (from bone marrow) and clinical findings (the presence of end organ damage – CRAB symptoms, see Table 4) The diagnostic criteria were established by the International Myeloma Working Group (IMWG) in 2003. In 2014, the IMWG also recommended that patients with ‘smouldering myeloma’ (i.e. asymptomatic patients) also receive treatment if they have abnormal bony lesions on MRI, plasma cell burden greater than 60% of those with light chain ratio greater than 100.
Reporting to the NZCR is mandated under the Cancer Registry Act 1993 and registrations are made in accordance with International Agency for Research on Cancer (IARC) guidelines. Validation of the NZCR is available for breast cancer staging 72, lung cancer reporting (1% under reported) 73, and colon cancer staging (pre 2004) 74. Because of the need to correlate histological and clinical findings to formulate the diagnosis of myeloma, it is possible that there will be misclassification of diagnosis within the NZCR. For example, patients may be classified in the NZCR as having multiple myeloma even though they are asymptomatic and do not require immediate treatment (‘smouldering myeloma’). This could explain why some patients in our study period did not receive either bortezomib or ASCT, even though they were younger than 70. The exact

The Burden of Multiple Myeloma in New Zealand
49
proportion of this misclassification is difficult to determine. It would be helpful if the NZCR could provide the date of initial treatment as a marker for the start of myeloma.
Incidence of myeloma in New Zealand
The numbers of new cases of myeloma for both men and women and for all main ethnic groups in New Zealand increased steadily under the period of study (Figure 7). Some increase could be expected as the population ages, however both the unadjusted (crude) incidence rate and the age standardised rate (which compensates for population aging) increased, showing that the increase in registrations was not due solely to aging of the population (Figure 8), although this was a contributing factor.
Figure 7. Registrations for myeloma in the period 2004 to 2016, by sex and main ethnic group.
050
100150200250300350400450
2004 2005 2006 2007 2008 2009 2010 2011 2012 2013 2014 2015 2016
Ann
ual n
umbe
r
Male Female
0
50
100
150
200
250
300
350
400
450
2004 2005 2006 2007 2008 2009 2010 2011 2012 2013 2014 2015 2016
Ann
ual n
umbe
r
Maori Pacifika Asian Eur/other

June 2019
50
Figure 8. Annual incidence rates from 2004 to 2016.
Incidence rates in the period 2012 to 2016 were higher for men than women. Although the crude (unadjusted) incidence rates were highest for individuals who were non-Māori/Pasifika/Asian, the age standardised rates were highest for Māori and Pasifika (Table 10). The difference is largely attributable to demographics: myeloma is predominately a disease of the elderly, and Māori and Pasifika populations have lower proportions of elderly women and men, resulting in lower unadjusted (crude) rates than other population groups. However, the age specific incidence rate was consistently higher for Māori/Pasifika over 50 years of age, especially the elderly (Figure 9).
0
1
2
3
4
5
6
7
8
9
10
2004 2005 2006 2007 2008 2009 2010 2011 2012 2013 2014 2015 2016
Regi
stra
tion
per 1
00,0
00
Year
Crude rate ASIR
ASIR, age standardised incidence rate (World Health Organisation standard population)

The Burden of Multiple Myeloma in New Zealand
51
Table 10. Registrations and annual incidence rates per 100,000 by sex and ethnic group.
Māori Pacific Asian Eur/Other Total
Total
Registrations 194 111 81 1478 1864
Annual crude incidence rate 5.53 7.59 2.93 9.86 8.20
Age std incidence rate* 7.19 10.13 3.51 5.05 5.19
Male
Registrations 104 55 46 909 1114
Annual crude incidence rate 6.06 7.61 3.41 12.32 9.98
Age std incidence rate* 8.53 10.71 4.26 6.65 6.64
Female
Registrations 90 56 35 569 750
Annual crude incidence rate 5.02 7.58 2.47 7.48 6.49
Age std incidence rate* 6.13 9.55 2.83 3.61 3.92
*Standardised to the World Health Organisation population using the direct method. Incidence rates are per 100,000 population; patients were registered in 2012-2016.

June 2019
52
Figure 9. Incidence rates per 100,000 by age group for Māori/Pasifika compared to all others combined.
The age at registration was distributed approximately normally around the median age (Figure 10) and 31% of patients (358 men and 228 women) were under 65 years of age and therefore were not receiving universal Government superannuation. Māori and Pasifika men and women were diagnosed at a younger age than European, Asian or other ethnicities (Table 10), possibly related to their younger age distributions.
Figure 10. Age distribution of registrations for multiple myeloma in the period 2012 to 2016.
020406080
100120140160180
30-49 May-54 55-59 60-64 65-69 70-74 75-79 80-84 80+
Regi
stra
tion
per 1
00,0
00
Age group (y)
Maori/Pacifika European/other
050
100
20 40 60 80 100 20 40 60 80 100
Female Male
Numb
er of
indivi
duals
Age at registration1114 males, 750 females

The Burden of Multiple Myeloma in New Zealand
53
Table 11. Age at registration in 2012-2016, by sex and ethnic group.
Registrants Mean age SD Median age IQR
Male
Māori 104 64.8 11.6 64 16.5
Pasifika 55 65.3 10.9 66 13
Asian 46 68.1 13.4 68.5 19
Eur/other 909 70.4 11.7 71 16
Total 1114 69.5 11.9 70 17
Female
Māori 90 64.0 11.9 64 15
Pasifika 56 67.9 10.3 67.5 14.5
Asian 35 66.2 12.0 67 22
Eur/other 569 72.1 12.0 73 18
Total 750 70.6 12.2 71 18
Grand total 1864 69.9 12.0 71 17
IQR, interquartile range; SD, standard deviation
Registrations for multiple myeloma were distributed unevenly across District Health Boards of domicile, partly because of their differing population sizes. The highest numbers of cases were registered in Waitemata, Counties, Canterbury and Waikato District Health Boards but the highest incidence rates were in Northland, MidCentral, Whanganui and Wairarapa (Table 12).

June 2019
54
Table 12. Registrations for multiple myeloma by District Health Board of domicile, in 2012 to 2016.
District Health Board Total Percent of cases Annual crude incidence rate*
Northland 109 5.8 13.07
Midcentral 106 5.7 12.41
Whanganui 37 2.0 11.84
Wairarapa 24 1.3 11.21
South Canterbury 30 1.6 10.32
Southern 139 7.5 8.94
Bay of Plenty 96 5.2 8.77
Taranaki 50 2.7 8.70
West Coast 14 0.8 8.53
Canterbury 218 11.7 8.44
Nelson Marlborough 60 3.2 8.36
Waikato 160 8.6 8.31
Hawkes Bay 64 3.4 8.05
Waitemata 224 12.0 7.92
Lakes 38 2.0 7.29
Hutt Valley 52 2.8 7.24
Counties Manukau 177 9.5 6.93
Auckland 158 8.5 6.62
Tairawhiti 15 0.8 6.35
Capital and Coast 93 5.0 6.24
Total 1864 100.0 8.23
*New cases per 100,000 population; denominator: 2013 household census (17 non-residents excluded)
New Zealand is divided into four cancer network regions based on domicile 75 having different demographics and varying numbers of registrations for multiple myeloma. In the period 2012 to 2016, Northern region had the largest number of registrations, followed by Southern region; however, the incidence rate was highest in Midland region. Northern and Southern regions jointly carried 61% of the caseload (Table 13).

The Burden of Multiple Myeloma in New Zealand
55
Table 13. Cancer registrations by cancer network regions in the period 2012 to 2016.
Region 2012 2013 2014 2015 2016 Total Mean annual incidence*
Central 72 59 78 66 87 362 7.30
Midland 72 72 83 64 82 373 9.87
Northern 122 123 140 149 134 668 7.77
Southern 84 103 78 101 95 461 8.68
Total 350 357 379 380 398 1,864 8.23
* New cases per 100,000 population; denominator: 2013 household census Northern region: Northland, Waitemata, Auckland, Counties Midland region: Waikato, Lakes, Bay of Plenty, Tairawhiti Central region: Taranaki, Hawke’s Bay, Midcentral, Whanganui, Capital and Coast, Hutt Valley, Wairarapa Southern region: Nelson/Marlborough, West Coast, Canterbury, South Canterbury, Southern
Māori and Pasifika patients were over-represented in the highest levels of deprivation (NZDep2013 deciles 9 and 10) [Table 14], as they are in the general population.
Table 14. Proportions of individuals with myeloma by ethnic group and socio-economic deprivation.
NZ Socioeconomic Deprivation Index 2013 decile
1-2 3-4 5-6 7-8 9-10 Total
Numbers of new cases
Māori 11 17 35 50 81 194
Pacific 7 11 8 26 59 111
Asian 16 26 10 16 13 81
Eur/other 311 291 299 351 226 1,478
Total 345 345 352 443 379 1,864
Percent by deprivation index
Māori 5.7% 8.8% 18.0% 25.8% 41.8% 100%
Pacific 6.3% 9.9% 7.2% 23.4% 53.2% 100%
Asian 19.8% 32.1% 12.3% 19.8% 16.0% 100%
Eur/other 21.0% 19.7% 20.2% 23.7% 15.3% 100%
Total 18.5% 18.5% 18.9% 23.8% 20.3% 100%
Patient registration 2012 to 2016

June 2019
56
Mortality from myeloma in New Zealand
Mortality with myeloma as the underlying cause varied year by year but increased only slightly over the period of study, if at all. Despite a rising incidence, age standardised mortality was relatively stable (Figure 11). Taken together, these findings suggest improvements in clinical management.
Figure 11. Crude and age standardised all-cause mortality for patients with myeloma.
WHO, age standardised to the World Health Organisation (WHO) population using the direct method. Source: MoH
Age standardised mortality, like incidence rates, was higher for men than women (Table 15) and higher for Māori and Pasifika peoples than for others (Table 16). At the time of writing, mortality containing the underlying cause of death was not available beyond December 2015.
Table 15. All-cause mortality for patients with myeloma in the period 2011 to 2015, by sex.
Male Female Total
All-cause deaths 521 371 892
Mean mortality rate per 100,000 4.73 3.25 3.98
Age std mortality per 100,000* 2.99 1.77 2.33
*Standardised to the World Health Population using the direct method
00.5
11.5
22.5
33.5
44.5
5
2004 2005 2006 2007 2008 2009 2010 2011 2012 2013 2014 2015
Deat
hs p
er 1
00,0
00
Year
Crude rate WHO

The Burden of Multiple Myeloma in New Zealand
57
Table 16. All-cause mortality for patients with myeloma in the period 2011 to 2015, by ethnicity.
Māori Pasifika Asian Eur/Other Total
All-cause deaths 95 52 27 718 892
Mean mortality rate per 100,000 2.75 3.59 1.01 4.83 3.98
Age std mortality rate per 100,000* 3.81 3.20 1.29 2.22 2.33
*Standardised to the World Health Population using the direct method
Prevalence of myeloma in New Zealand
There are several methods for estimating prevalence, none of them entirely satisfactory. We took the simple approach of counting the numbers of registrations in the period 1990 to 2016 and subtracting the number of all-cause deaths for the same individuals over the same time. Prior to 2000, most cases of myeloma were reported by ICD9-AM codes 20300, 20301, 20310 corresponding to ICD10-AM C90000, C9001, C9010. From 2000 onwards some were reported with both ICD9 and ICD10 codes. For both registrations and deaths, non-residents and permanent emigrants were excluded.
Based on this methodology, we estimate that there will be 998 women and 1466 men with myeloma by December 2018, a total of 2463 individuals and a prevalence rate of 54 per 100,000 population (Table 17). This process could underestimate the prevalence slightly, because some cases that were diagnosed prior to 1994, when reporting of cancer became mandatory, might not have been reported to the NZCR; however, very few of these will have survived to the present day. In addition, an unknown but small number of cases registered prior to 2004 could have been misallocated because of changes in diagnostic criteria in 2003.
Table 17. Estimation of the prevalence of myeloma at December 2018.
Female Male Total
Period New cases Deaths Survivors New cases Deaths Survivors Survivors
1990-2016 2946 2231 715 4190 3131 1059 1774
2017* 175 43 132 255 64 191 323
2018* 191 40 150 274 58 216 366
1990-2018 3312 2314 998 4719 3253 1466 2463
Prevalence 40.3 70.3 54.0
Sources: IDI; Mortality Register (MoH) and Department of Internal Affairs Register (see Section III) *Estimated from the mean 5-year rate in 2012-2016 assuming linear extrapolation ** per 100,000 population

June 2019
58
James’ story Because we were reasonably well-off financially, and had a family of adult children, the practical and financial burdens of myeloma were not too severe, but the emotional roller coaster was huge.
1. Diagnosis
"MGUS with a high probability of multiple myeloma"
Lethargy and quite a few unusual pains including rib pain led my wife to the GP initially, and IgA readings from a blood test produced this diagnosis. It was 2002 and she was aged 56. We were about to meet our children overseas involving a three-month journey. Her reaction to being told a bone marrow biopsy was needed to confirm whether or not she had myeloma, was: "Well, we are going overseas and if I’ve got myeloma, I would rather not know until we come home.”
I accepted this was the right decision for my wife, but I was in the agonising situation of not knowing for nearly five months, during which time I did a great deal of research and reading about the disease, concluding that the future was bleak.
On our return we undertook the bone marrow biopsy with the result being a negative diagnosis of myeloma. The relief, particularly for me, was quite extraordinary. My wife put it out of her mind.
"Likely active multiple myeloma with spinal lesions"
Seven years later my wife developed significant back discomfort and, after several visits to her GP, a young relieving GP picked up on the MGUS diagnosis and sent us immediately to a haematologist in Dunedin. She was then admitted to public hospital with the above diagnosis confirmed from blood tests, a scan and a bone marrow biopsy.
After much discussion we decided that a stem cell transplant was her best hope of life extension, and immediate radiotherapy to deal with her spinal lesions was undertaken. My wife's attitude and reaction to this was amazing. She often said "I'm not going to concern myself about this. They know what they’re doing, I'm in their hands." I was devastated and wanted to know all of the implications and possible treatments.
Immediately after the radiotherapy we drove home, a three-hour drive from Dunedin. Later that evening her legs became completely paralysed. She had no wish to return to hospital on Easter Thursday, so we battled through the night trying to manage her pain and paralysis. Fortunately, a GP friend who was in town came around at 8.00am with an immediate diagnosis of post-radiation swelling around the spinal cord, which would likely dissipate by the afternoon, and it did.
2. Pre-stem cell transplant chemotherapy
This was a terrible five months, with nausea, hair loss, weight loss, total lethargy, and multiple side effects from nerve damage, steroid induced changes, and infections. We were told only 16% of patients get any benefit from this gruelling treatment.
3. Stem cell transplant

The Burden of Multiple Myeloma in New Zealand
59
A seven-week spell in Christchurch Public Hospital included a successful stem cell harvest, bone marrow destruction, a near death experience, extreme illness which required supervision from ICU staff, and slow recovery.
4. Remission
The next 18 months was a time of hope and we restored our lives to reasonable normality. We planned to go to India to get Velcade which wasn’t funded in NZ.
5. Relapse
After that brief reprieve, pain returned, and a scan showed many new lesions. I was devastated, while my wife switched into practical mode, getting things into order. We went to Hanmer Springs for a break, then told all three of our children, a hideous task.
When it came to considering further treatment, we discovered she had contracted an avian strain of tuberculosis, which made further treatment impracticable. She developed shingles during this time and gradually declined.
6. Death
My wife was 64 when she died a harrowing death in a local hospital. She managed a trip to Australia with our whole family including a newborn granddaughter four weeks before she died. She was extraordinarily courageous, caring more for her husband and family than herself. Her pain was reasonably well-managed, but we had one long Sunday night after a GP had left her vomiting and in much pain without providing the relief she needed. Next day she was fitted with a morphine pump. A long trip in an ambulance to Dunedin for more radiotherapy which she didn’t want was a mistake. It was traumatic, made her ill and did not prolong her life.
7. Grief
About three weeks after my wife’s death I went into a terrible decline, overwhelmed by the loss. I went to my GP who, without attempting to talk to me, just handed me a script for sleeping pills and a therapist’s business card. I changed to a more sensitive GP and was put on an anti-anxiety drug, which did not remove my grief but took the sharp edge away and made me feel back in control.
8. What we needed to know
- possible side effects from spinal radiotherapy
- likely outcome from oral cortisone – the possibility of post dosage depression
- infection risk and essential protection – a check list of essential post stem cell transplant vaccinations including shingles. (My wife suffered a shingles episode which left her in pain until she died).
- high infection risk places to avoid. We went to the Hanmer Hot Pools which is probably where she picked up her avian TB infection. We should not have done that.
- If you can’t get help from your GP when you hit rock bottom, where else can you turn?
Names and identifiers have been changed.

June 2019
60
Briar’s story How the Multiple Myeloma has affected me and my family
Numb: On 20th September 2016 my GP told me my bloods indicated Multiple Myeloma. Further tests were required. Two days later it was confirmed. My partner, of 30 years, and I went numb. We didn’t even know what Multiple
Myeloma was.
Sad: We had little sleep for three days and just held each other and cried. Research told us it was incurable, and we felt a tsunami of sadness for so many reasons.
Acceptance: We quickly accepted the diagnoses and went into total research mode needing to know everything there is to know about this cancer. The more we found out the sadder we felt. We have fought many things during our lives but never a fight I would ultimately lose regardless of the intensity of our fight. Our lives were changed forever and the sooner we accepted this the better.
Financial Loss: Chemotherapy starts and our weekly drive from our distant residence to North Shore Hospital in Auckland dominated our week. We run a home accommodation business and had to reduce bookings and ultimately close it for 5 months. The costs remained the same – but little to no income. This, along with the cost of travel, hit us badly. I was declined any type of government benefit. Early superannuation due to my partner being a superannuant was declined, as it is means tested. For the first time in 40 years I had to be financially reliant on someone else – humiliating. The financial losses got worse as treatment progressed to and through Stem Cell Transplant – mine went terribly wrong and my recovery was long and slow.
Unsafe: No matter where I went, I felt so unsafe. Fear of catching any infection overtook me. I wore a mask in theatres, public transport, meetings etc. I could no longer ‘meet and greet’ guests arriving to our business. This put a huge load on my partner.
Buck up: A few months after diagnosis everything changed, and I went into fight mode. I dug deep and found every survival gene within me.
Stem Cell Transplant: Could anything go more wrong. Ending up in critical care and on life support was a nightmare of the worse kind imaginable. Family were gathered; accommodation and air fares had to be thought through. How valuable are friends. However, the psychological scars from this horrendous experience were to last for months and months. Months of sobbing every day and physical weakness leaving me unable to be left alone. I was terrified of darkness and of life itself. The psychologist made available to us was invaluable and a huge part of my recovery.
My partner: She is resentful of the massive aging effect it has had on her yet totally dedicated as a caregiver she never faulted but has paid a huge price. Some home help would have been worth diamonds.
My daughter: How Myeloma has affected her family “It has changed our perception of you. We always knew you were tough, but this has really highlighted how super strong and brave and

The Burden of Multiple Myeloma in New Zealand
61
positive you are. It increases our respect because it’s very impressive how your attitude has been so positive. It’s given me a great example for my own children to be positive. We’ve always thought of you as so young, so having a mortality scare makes us all realise your role as grandmother and, I guess, matriarch is more recognised”.
Summary: What a ghastly experience SCT was. I want to live, and I want a respectful death. I am a fighter for medicinal cannabis and euthanasia. Whoever said, ‘an attitude is a bad thing’. That’s how I got through to today. I love life and, damn it, I’ll live it to the end.
A GIFT: Given I am 65 now, in some ways I consider this cancer a gift. I have had time to access what is and isn’t important. No more mucking around. Catching up with people and putting things to rest OR thanking them for their role in my life.
I am living with cancer – not dying of it.
Names and identifiers have been changed.

June 2019
62
III SURVIVAL IN NEW ZEALAND
Summary
1. Survival statistics for myeloma are grim but improving, with overall survival lengthening significantly with the availability of newer anti-myeloma therapies.
2. Over the entire period of observation (2004 to 2016), both all-cause survival and cause-specific survival increased.
3. Five-year overall survival for all patients who were registered in New Zealand in 2012 to 2016 was 45% and median survival was 51.2 months.
4. Both overall survival and cause-specific survival were strongly age specific, with younger individuals surviving longer than older.
5. Overall survival was worse for younger Māori/Pasifika peoples than for other ethnicities, however cause-specific survival did not differ between Māori/Pasifika and others in that age group, suggesting that the ethnic difference can be attributed to factors other than genetics or management of myeloma.
6. Overall survival at 3 years and 5 years as well as median survival was better for patients living in the Northern region than elsewhere.
7. Overall survival was best for individuals living in least deprived regions of the country (deciles 1 to 4). Five-year survival varied from 40.5% to 50% and median survival varied from 43.8 to 60.9 months.
8. A previous comparison between New Zealand and Australia based on patients diagnosed in the period 2006-2010 showed no statistically significant difference in 5-year relative survival rates between the countries.
Methodology
Survival of a population is usually shown using the Kaplan-Meier method or similar methodology. Over a specified period of time, the proportion of individuals who are still alive after some defined starting point (in this case registration, which occurs soon after diagnosis) is shown graphically and an adjustment (‘right censoring’) is made for those individuals who are still alive at the end of the defined time period.
The following graphs show the proportion of a group of individuals who were registered with myeloma in the three successive time periods and who were still alive at the intervals shown on the graph. This includes patients who had received a diagnosis of myeloma based on histological findings from bone marrow but were not yet symptomatic at diagnosis (‘smouldering myeloma’). Cause-specific survival depicts what could be expected if patients died from myeloma but not from other causes. At the time of the following analyses, information on deaths with myeloma as

The Burden of Multiple Myeloma in New Zealand
63
underlying cause were available to the end of 2015 and deaths from any cause were available in the NZCR up to 18 February 2018.
All-cause and cause-specific survival
Over the period of observation, both all-cause survival and cause-specific survival increased. Importantly, there was a substantial increase in survival over the last few years of the period of observation (Figure 12). We note that bortezomib was funded in May 2011 and lenalidomide in September 2014. These novel pharmacotherapies will undoubtedly contribute to the observed improvement in overall survival.
Figure 12. All-cause and cause-specific survival for patients registered in 2004 to 2015.
Because patients older than 70 years of age are generally managed differently from younger patients, these age groups were analysed separately.
Overall survival was considerably better for younger than older patients and it improved over the period of observation, for both age groups (Table 18 and Figure 13).
There was no significant difference in survival between men and women (p=0.75, not shown). 28% of individuals aged 70 or over who were diagnosed in 2012 to 2016 survived for at least 5 years, compared to 18% of those who were diagnosed in 2004 to 2007.
0.00
0.25
0.50
0.75
1.00
Prop
ortio
n aliv
e
0 20 40 60 80 100 120 140 160Months
era = 2004-2007 era = 2008-2011era = 2012-2015
Overall survival in 2004-20150.0
00.2
50.5
00.7
51.0
0Pr
opor
tion w
ho ha
d not
died f
rom
myelo
ma
0 20 40 60 80 100 120 140 160Months
era = 2004-2007 era = 2008-2011era = 2012-2015
Cause specific survival 2004-2015

June 2019
64
Table 18. 12-month, 3-year, 5-year and median overall survival, by era, for all New Zealand.
Era # Patients
Mean survival Median survival (months)
12 months
36 months
60 months
Median -95%CI +95%CI
All ages
2004-2007 934 73% 49% 36% 34.8 31.4 39.3
2008-2011 1124 75% 52% 40% 38.1 33.9 43.2
2012-2016 1864 81% 62% 45% 50.7 48.5 57.3
Age <= 70y
2004-2007 461 84% 68% 54% 65.2 59.1 73.1
2008-2011 546 87% 70% 58% 73.0 65.7 80.2
2012-2016 931 90% 78% 62% NE NE NE
Age > 70y
2004-2007 473 63% 31% 18% 17.7 15.2 20.8
2008-2011 578 63% 34% 22% 21.9 18.4 24.3
2012-2016 933 71% 45% 28% 28.6 24.4 33.6
NE, non-estimable

The Burden of Multiple Myeloma in New Zealand
65
Figure 13. Overall survival by era and age group.
Both overall survival and cause-specific survival were strongly age specific, with individuals who were less than 60 years of age at diagnosis faring much better than older patients, even when other causes of death were excluded from the analysis (Figure 14).
Figure 14. Overall survival and cause-specific survival by age group over the period 2012 to 2016.
In the period 2012-2016, overall survival was worse for younger Māori/Pasifika peoples than for other ethnicities (Figure 15) but not different for older patients.
0.00
0.25
0.50
0.75
1.00
Prop
ortion
alive
0 20 40 60 80 100 120 140 160 180Months
2004-2007 2008-20112012-2016
Age <= 70y
0.00
0.25
0.50
0.75
1.00
0 20 40 60 80 100 120 140 160 180Months
2004-2007 2008-20112012-2016
Age > 70y0.0
00.2
50.5
00.7
51.0
0
Prop
ortion
alive
0 10 20 30 40 50 60 70 80Mths
<50 50-5960-69 70-7980+
Overall survival
0.00
0.25
0.50
0.75
1.00
Prop
ortion
who
did n
ot die
from
myelo
ma
0 10 20 30 40 50 60 70 80Mths
<50 50-5960-69 70-7980+
Cause specific survival
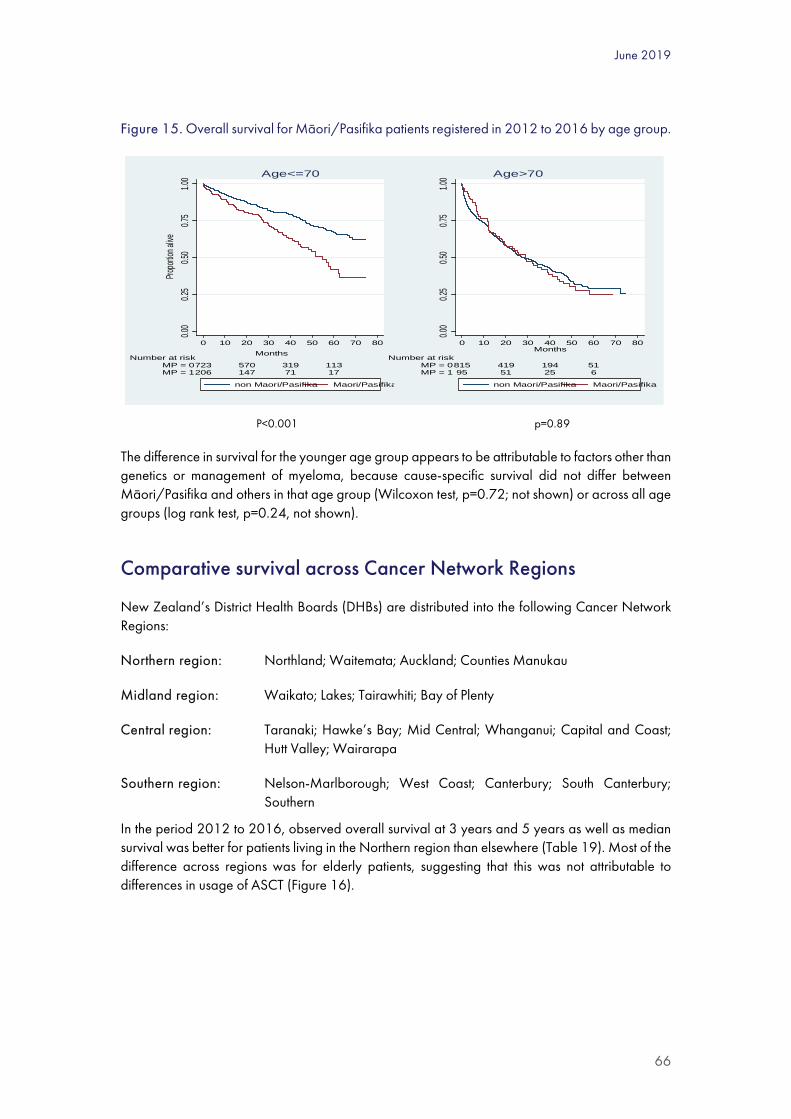
June 2019
66
Figure 15. Overall survival for Māori/Pasifika patients registered in 2012 to 2016 by age group.
P<0.001 p=0.89
The difference in survival for the younger age group appears to be attributable to factors other than genetics or management of myeloma, because cause-specific survival did not differ between Māori/Pasifika and others in that age group (Wilcoxon test, p=0.72; not shown) or across all age groups (log rank test, p=0.24, not shown).
Comparative survival across Cancer Network Regions
New Zealand’s District Health Boards (DHBs) are distributed into the following Cancer Network Regions:
Northern region: Northland; Waitemata; Auckland; Counties Manukau
Midland region: Waikato; Lakes; Tairawhiti; Bay of Plenty
Central region: Taranaki; Hawke’s Bay; Mid Central; Whanganui; Capital and Coast; Hutt Valley; Wairarapa
Southern region: Nelson-Marlborough; West Coast; Canterbury; South Canterbury; Southern
In the period 2012 to 2016, observed overall survival at 3 years and 5 years as well as median survival was better for patients living in the Northern region than elsewhere (Table 19). Most of the difference across regions was for elderly patients, suggesting that this was not attributable to differences in usage of ASCT (Figure 16).
0.00
0.25
0.50
0.75
1.00
Propo
rtion a
live
206 147 71 17MP = 1723 570 319 113MP = 0
Number at risk
0 10 20 30 40 50 60 70 80Months
non Maori/Pasifika Maori/Pasifika
Age<=70
0.00
0.25
0.50
0.75
1.00
95 51 25 6MP = 1815 419 194 51MP = 0
Number at risk
0 10 20 30 40 50 60 70 80Months
non Maori/Pasifika Maori/Pasifika
Age>70

The Burden of Multiple Myeloma in New Zealand
67
Table 19. Mean 12-month, 3-year, 5-year and median survival in the period 2012 to 2016, by region.
# Patients 1 year 3 years 5 years Median survival (months)
Overall survival Median -95%CI +95%CI
Northern 668 83% 67% 51% 62.7 50.7 NE
Midland 373 78% 58% 43% 46.6 39.7 57.8
Central 362 80% 59% 41% 51.0 40.2 58.7
Southern 461 79% 58% 41% 48.5 40.6 55.7
NZ Total 1864 81% 62% 45% 51.2 48.5 57.3
CI, confidence interval; NE, not estimable
Figure 16. Overall survival across cancer network regions in the period 2012 to 2016.
p<0.001 p<0.001
Survival by level of socioeconomic deprivation
The analysis was stratified by 5 deciles in the NZDep2013. In the period 2012-2016, overall survival was best for individuals living in least deprived regions of the country, viz deciles 1 to 4 (Figure 17).
0.00
0.25
0.50
0.75
1.00
Propo
rtion a
live
0 10 20 30 40 50 60 70 80Months
Central MidlandNorthern Southern
Survival in 2012-2016 for age<=70
0.00
0.25
0.50
0.75
1.00
0 10 20 30 40 50 60 70 80Months
Central MidlandNorthern Southern
Survival in 2012-2016 for age>70

June 2019
68
Figure 17. Overall survival in the period 2012 to 2016, by deprivation quintile.
P<0.001
Five-year survival varied from 40.5% to 50% and median survival varied from 43.8 to 60.9 months (Table 20).
Table 20. Survival by level of socioeconomic deprivation.
NZDep2013 No. patients Survival
12 mths 36 mths 60 mths Median (mths)
1-2 344 85.5% 67.7% 50.0% 60.9
3-4 339 83.8% 66.9% 48.7% 56.1
5-6 347 80.1% 58.9% 41.1% 49.5
7-8 435 78.6% 58.7% 45.5% 48.5
9-10 374 76.7% 57.4% 40.5% 43.8
Overall 1839 80.8% 60.6% 45.2% 50.7
Highest numbers represent highest levels of deprivation. Some patients (25/1864 = 1.3%) had no NZDep2013 level stated. Kaplan Meier analysis with log rank test; p<0.05 across the survival curves
0.00
0.25
0.50
0.75
1.00
Prop
ortio
n al
ive
0 10 20 30 40 50 60 70 80Mths
1-2 3-45-6 7-89-10
Overall survival by deprivation quintile

The Burden of Multiple Myeloma in New Zealand
69
International comparisons: incidence, mortality and survival rates for myeloma
The Global Burden of Disease Study has identified multiple myeloma as having disproportionate incidence in high-income countries in Western Europe, North America and Australasia, where incidence and mortality rates are well above the global average12. Table 21 details the comparative myeloma statistics for other countries.
Table 21. International incidence, mortality and survival rates for myeloma.
Study Population Incidence* Mortality* Survival
This study New Zealand 2012-2016:
Male 6.6
Female 3.9
Total 5.2
2011-2015:
Male 3.0
Female 1.8
Total 2.3
1y: 81%
3y: 62%
5y: 45% Median: 51.2 months (male & female)
New Zealand & Australia (comparison) Aye, Elwood & Stevanovich (2014) 76
Patients diagnosed in 2006–2010 in the whole populations of New Zealand and Australia.
Includes all new cases of myeloma diagnosed in Australia and recorded by state and territory cancer registries. New Zealand data were from the New Zealand Cancer Registry (NZCR)
Female NZ relative survival: 75.9% (1-year) 39.0% (5-year)
Male NZ relative survival: 76.1% (1-year) 43.5% (5-year)
Not statistically significantly different from Australian rates
Global Burden of Disease Study Cowan, A.J., et al., (2018) 12
A Systematic Analysis of the Global Burden of Disease Study 2016.
Data sources include national vital registration systems and cancer registries.
Data sources used for myeloma mortality can be found in the GBD source tool:
Global 2.1 (95% UI, 1.8-2.3)
Australasia 5.8 (95% UI, 4.4-6.5)
High-income North America 5.2 (95% UI, 4.7-6.5)
Global 1.5 (95%UI, 1.3-1.7)
High-income North America 3.0 (95% UI, 2.6-3.6)
Australasia 2.8 (95% UI, 2.1-3.1)
Not reported

June 2019
70
http://ghdx.healthdata.org/gbd-2016/data-input-sources
Western Europe 4.6 (95% UI, 3.7-5.5)
Western Europe 2.6 (95% UI, 2.1-3.1)
Australia Cancer in Australia Report (AIHW, 2017) 77
Incidence (2013) and survival (2009-2013) extracted from Australian Cancer Database (ACD) and the National Mortality Database (NMD)
7.6 (men) 5.1 (women) 6.3 (all)
4.0 (men) 2.6 (women) 3.3 (all)
1-year relative survival at diagnosis: 82.2% (men) 81.4% (women) 81.9% (all)
5-year relative survival at diagnosis: 48.8% (men) 48.2% (women) 48.5% (all)
Canada Canadian Cancer Statistics 2017 78
Canadian Cancer Registry (1992–2012)
Excludes non-residents
Canadian Vital Statistics Death Database (1988–2012)
Excludes non-residents
2017 data projections account for the M1 medium population growth scenario of Statistics Canada
Relative survival is based on 2006-2008 diagnoses
9.1 (men) 5.6 (women)
4.4 (men) 2.9 (women) 3.5 (all)
5-year relative survival: 42% (men) 41% (women) 42% (all)
5-year overall survival: 36% (men) 36% (women) 36% (all)
United Kingdom Cancer Research UK statistics 79
ICD-10, C90
2015 data for incidence
2016 data for mortality
Deprivation quintiles from 2006-2010 data
11.8 (men) 7.2 (women) 9.3 (all)
No evidence of association of incidence with deprivation quintiles
6.4 (men) 4.1 (women) 5.1 (all)
5-year relative survival: 49.8% (men) 43.8% (women) 47.0% (all)
USA National Cancer Institute
Data from registries included in the SEER 18 report (2008-2014)
8.4 (men) 5.3 (women) 6.7 (all)
4.2 (men) 2.7 (women) 3.3 (all)
1-year relative survival: 82.8% (all)
5-year relative survival: 52.2%

The Burden of Multiple Myeloma in New Zealand
71
*Incidence and mortality rates are age standardised, per 100,000 population UI, uncertainty interval
A comparison between New Zealand and Australia based on patients diagnosed in the period 2006-2010 showed no statistically significant difference in 5-year relative survival rates between the countries 76.
When considering just Australia, Canada, the UK, USA, and Sweden, age-standardised incidence for men and women combined ranged from 5.6 in Canada to 9.3 per 100,000 in the UK. In every region described, the incidence for men was greater than women but survival was similar. Age-standardised mortality ranged from 3.3 in Australia and the USA to 5.1 in the UK and 5.2 per 100,000 in our study. Five-year relative survival ranged from 42% in Canada to 52.4% in the USA. However, we note that Canadian survival is based on 2006-2008 data, whereas USA survival data is based on 2008-2014 data. Five-year overall survival for all patients who were registered in New Zealand in 2012 to 2016 was 45% and median survival was 51.2 months. Because survival is very age dependent, some of the differences could be accounted for by relatively minor differences in age distributions across countries.
Surveillance SEER (NIH) 13
(men) 52.7% (women) 52.4% (all)
Sweden
Blimark, C.H., et al. (2018) 14
Real-world data on 4,904 patients from the Swedish Myeloma Registry diagnosed between 2008 and 2015
A near complete 'real-world' population of myeloma patients during an 8-year period
8.2 (men) 5.3 (women) 6.8 (all)
5-year overall survival 38.3%
5-year relative survival 44.9%

June 2019
72
Susan’s story When I was first diagnosed with Multiple Myeloma 6 years ago, I had never heard of the disease and knew nothing about it. It was discovered only when I damaged my spine hauling a heavy suitcase in (of all places) Paris. It seems that a good number of cases are diagnosed because of a fracture or something similar.
Things moved very fast, with my GP sending me off to Haematology at North Shore Hospital and treatment beginning without delay. At first this was Velcade (bortezomib), Cyclophosphamide and Dexamethasone for 6 cycles after which I underwent a stem cell transplant at Auckland City Hospital. This went well and a few months later I completed a further 3 cycles of the above. I didn’t have too many problems with the Velcade treatment, very little nausea and perhaps one or two days after each treatment when I just felt generally tired and unwell. In fact, fatigue has been the main problem with all treatments, some more so than others.
After the Velcade cycles I was in remission until November 2016 when I began Lenalidomide/Dexamethasone treatment. This was continued until October 2017, but it seemed to be less effective after a break while I had back surgery. Since then I have been on Carfilzomib/Dexamethasone which has been effective for the myeloma. I have, however, had some problems with shortage of breath, which seems to be linked to the drug. Other than that, the main problem is the fatigue which seems to be present regardless of the treatment. The myeloma seems to have taken over our lives over the past 6 years, especially the last few months, with twice a week infusion at the hospital plus the usual clinic visits, blood and various other tests and so on. It is fortunate that my husband and I are pretty much retired. I am not sure how we would handle the appointments if either of us were working full time not to mention the fatigue which, at times, is very draining.
I cannot stress strongly enough how important it is to have a support person whenever possible for all these procedures. I don’t think my husband has missed one of the many appointments I have had over these 6 years. What is significant is that when I was undergoing the stem cell transplant at Auckland Hospital the specialist haematologist was not optimistic about the survival rate for myeloma patients. I did, in fact, wonder if it was worth going ahead with the transplant but now, 5 years later, it has all been worthwhile. I have also found great support with the ‘Leukaemia and Blood Cancer’ (LBC) meetings and forums. Initially I was not keen to attend (“my name is …… and I am an alcoholic” phobia) but it wasn’t like that at all. I can safely say that at every meeting you learn something useful and the support has been invaluable. The same can be said for Haematology Day Stay at North Shore Hospital. The staff have always been helpful and supportive, and we appreciate everything they do.
Names and identifiers have been changed.

The Burden of Multiple Myeloma in New Zealand
73
June 2019
74
IV UPTAKE AND IMPACT OF STEM CELL TRANSPLANT, BORTEZOMIB AND LENALIDOMIDE
Summary
1. Uptake is defined as the proportion of those patients who were registered in the period 2012 to 2016 and for whom the medicine was dispensed at least once (and assumed to be taken) or the procedure (ASCT) undertaken.
2. Uptake of bortezomib-containing drug regimens was greater for men than women; independent of ethnicity; and higher for Northern region than other regions.
3. Uptake of ASCT was also greater for men than women but lower for Māori/ Pasifika compared to others and slightly lower in Central cancer network region than elsewhere.
4. ASCT was only rarely given to patients over 70 years of age, possibly due to concern regarding treatment toxicity, comorbidities, and local practice.
5. Over 20% of patients up to 70 years of age, comprising 36% of all patients, received neither of the two most effective funded first-line therapies (bortezomib and ASCT) and many others received considerably fewer than the funded 36 doses of bortezomib. In this age group, Māori, Pacific and Asian people, and also patients living in the most economically deprived regions, were less likely than others to receive bortezomib-containing drug regimens followed by ASCT.
6. Usage of bortezomib without ASCT was similar across regions although optimal therapy with bortezomib-containing regimens followed by ASCT varied. It was more commonly used in Midland region and lowest in Central region, and the proportions of patients who were not given either therapy was lowest in Midland region and highest in Central region.
7. ASCT and bortezomib individually and together were associated with improved overall survival.
8. International evidence has demonstrated that lenalidomide has significantly prolonged survival following relapse. However insufficient information is available on the use of lenalidomide in New Zealand for detailed analysis.
9. There is great opportunity to improve New Zealand survival statistics further, thanks to a surge in research and development for innovative myeloma treatments over the past couple of decades. However, funding is not keeping up with Australia and elsewhere because of the different funding models and processes that determines if, when, and how these treatments can be used in New Zealand.

The Burden of Multiple Myeloma in New Zealand
75
Uptake
For the purposes of this study, uptake was defined as the proportion of patients who received bortezomib or ASCT at least once following their registration in the period 2012-2016. Bortezomib (Velcade®) was funded on May 1st, 2011 for both first line therapy (up to 9 cycles) and relapsed or refractory myeloma (up to 8 cycles) in bortezomib-naïve patients and it became widely used almost immediately in all 4 cancer network regions, across all age groups. It is given in combination with other agents, particularly cyclophosphamide and dexamethasone, as CyBorD (see Section II). We identified patients who received bortezomib by merging the pharmaceuticals collection with the New Zealand Cancer Register.
Both autologous and allogeneic stem cell transplant (ASCT) have been available for many years for patients with myeloma and other blood cancers. We identified patients who had received ASCT in two ways: either with a hospital coding of ASCT or with high dose melphalan (≥140mg per square metre) as conditioning for ASCT. The two methods corresponded reasonably well, and hospital coding was used as the more direct indicator of ASCT for the main part of our analysis (Table 22.
Table 22. Numbers of patients with a hospital coding for ASCT vs patients who received HDM melphalan.
Year dispensed or admitted
HDM Admission Difference (%)
2012 95 89 6.7%
2013 94 88 6.8%
2014 103 110 -6.4%
2015 116 121 -4.1%
2016 120 122 -1.6%
Total 599 594 0.8%
*Minimum 140 mg/sqm, usually 200 mg/sqm Hospital procedure codes for ASCT: 1370600, 1370606, 1370607, 1370608, 1370609,1370610 HDM, high dose melphalan
“Most horrendous part of the treatment. Ten days after the SCT I was hospitalized with infection for 5 days. I only got around 15 months remission from my SCT. I would most probably have a completely different view of the SCT if I was still in remission as a result of it.”

June 2019
76
Lenalidomide (Revlimid®) has also been available for several years for compassionate use or for individual named patients, as third-line therapy, and based on international experience it is highly likely to have improved survival. But its use was not recorded in the national pharmaceuticals collection until it was funded in September 2014, and it is given following a range of other therapeutic regimens, therefore its impact on overall survival is difficult to determine. However, lenalidomide was included in the costings (Section V1).
Since bortezomib was funded, it has been administered over a wide age range, whereas ASCT was restricted largely to patients up to and including 70 years of age (Figure 18).
Figure 18. Age distribution of patients who received ASCT and/or bortezomib.
Patient registration in May 2011 to December 2016; ASCT, autologous stem cell transplant;
In the period 2012 to 2016, 21% of patients received bortezomib followed by ASCT, and 41% received bortezomib but not ASCT. Although three-quarters of patients up to 70 years of age received bortezomib, only 42% also received ASCT. Almost one-quarter of the younger age group, comprising 11% of all patients, received neither bortezomib nor ASCT. Overall, 38% of patients who registered in 2012-2016 received neither therapy in this time period (Table 23 ).
050
100
150
20 40 60 80 100 20 40 60 80 100
Without ASCT With ASCT
Num
ber o
f pat
ient
s0
5010
0
20 40 60 80 100 20 40 60 80 100
Without Bortezomib With Bortezomib
Num
ber o
f pat
ient
s
Age at registration
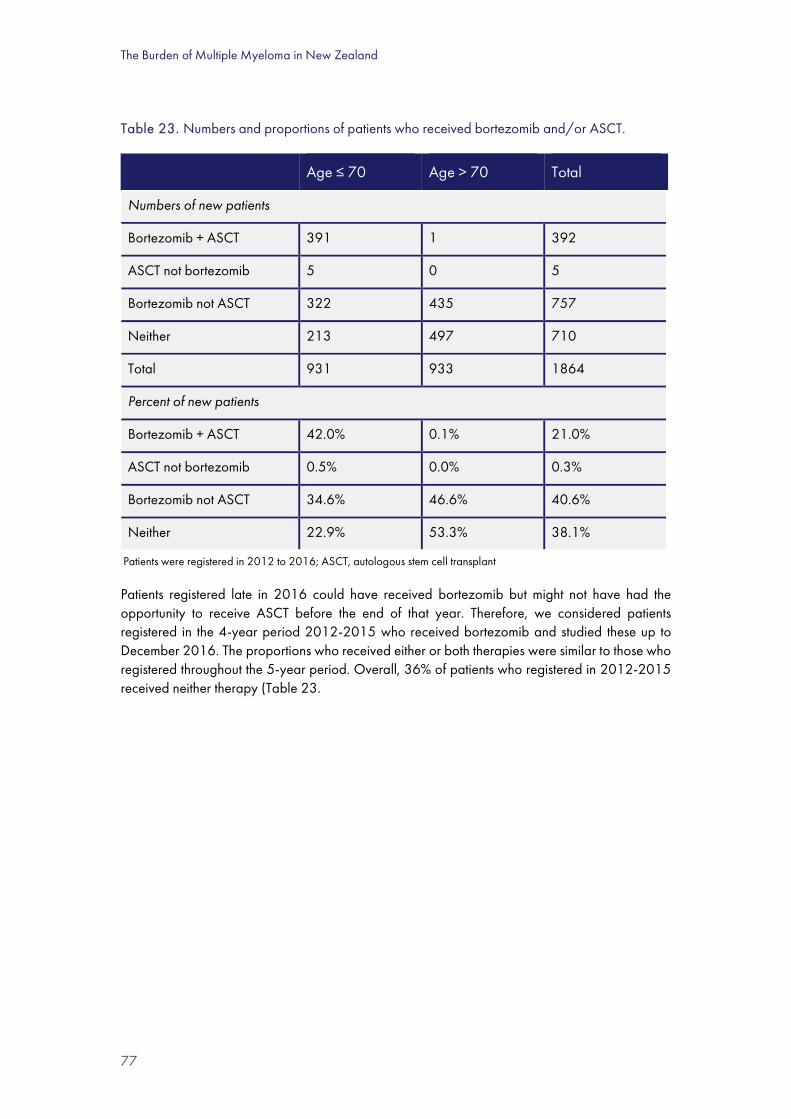
The Burden of Multiple Myeloma in New Zealand
77
Table 23. Numbers and proportions of patients who received bortezomib and/or ASCT.
Age ≤ 70 Age > 70 Total
Numbers of new patients
Bortezomib + ASCT 391 1 392
ASCT not bortezomib 5 0 5
Bortezomib not ASCT 322 435 757
Neither 213 497 710
Total 931 933 1864
Percent of new patients
Bortezomib + ASCT 42.0% 0.1% 21.0%
ASCT not bortezomib 0.5% 0.0% 0.3%
Bortezomib not ASCT 34.6% 46.6% 40.6%
Neither 22.9% 53.3% 38.1%
Patients were registered in 2012 to 2016; ASCT, autologous stem cell transplant
Patients registered late in 2016 could have received bortezomib but might not have had the opportunity to receive ASCT before the end of that year. Therefore, we considered patients registered in the 4-year period 2012-2015 who received bortezomib and studied these up to December 2016. The proportions who received either or both therapies were similar to those who registered throughout the 5-year period. Overall, 36% of patients who registered in 2012-2015 received neither therapy (Table 23.

June 2019
78
Table 24. Numbers of patients registered in 2012-2015 who received bortezomib and/or ASCT.
Age ≤ 70 Age > 70 Total
Numbers of new patients
Bortezomib + ASCT 354 1 355
ASCT not bortezomib 4 0 4
Bortezomib not ASCT 224 354 578
Neither 157 372 529
Total 739 727 1466
Percent of new patients
Bortezomib + ASCT 47.9% 0.1% 24.2%
ASCT not bortezomib 0.5% 0.0% 0.3%
Bortezomib not ASCT 30.3% 48.7% 39.4%
Neither 21.2% 51.2% 36.1%
Patients were registered in 2012 to 2016; ASCT, autologous stem cell transplant
Although usage of bortezomib without ASCT was similar across regions, there were variations in optimal therapy with bortezomib-containing regimens followed by ASCT. This combination was highest in Midland region and lowest in Central region, and the proportions of patients who were not given either therapy was lowest in Midland and highest in Central (Table 25. )

The Burden of Multiple Myeloma in New Zealand
79
Table 25. Numbers of patients up to 70 years who received bortezomib and/or ASCT, by region.
Northern Central Midland Southern Total
Numbers of patients
Bortezomib + ASCT 141 68 78 104 391
ASCT not bortezomib 2 0 0 3 5
Bortezomib not ASCT 122 68 57 75 322
Neither 81 54 28 50 213
Total 346 190 163 232 931
Percent of patients
Bortezomib + ASCT 40.8% 35.8% 47.9% 44.8% 42.0%
ASCT not bortezomib 0.6% 0.0% 0.0% 1.3% 0.5%
Bortezomib not ASCT 35.3% 35.8% 35.0% 32.3% 34.6%
Neither 23.4% 28.4% 17.2% 21.6% 22.9%
ASCT as % of bortezomib patients
53.6% 50.0% 57.8% 58.1% 54.8%
Patients were registered in 2012 to 2016; ASCT, autologous stem cell transplant
Exploring uptake further, we considered the uptake of bortezomib and ASCT by deprivation and ethnicity. In summary for this age group, Māori, Pacific and Asian people, and those living in the most deprived regions, were less likely than others to receive both therapies. The same ethnic groups were more likely to receive neither therapy (Tables 26 and 27).
Table 26. Proportions of patients up to 70 years who received bortezomib and/or ASCT, by ethnic group.
Treatment Māori Pacific Asian Eur/other
Bortezomib + ASCT 33.6% 30.6% 34.1% 45.4%
ASCT not bortezomib 0.0% 0.0% 0.0% 0.7%
Bortezomib not ASCT 34.3% 41.7% 34.1% 33.9%
Neither 32.1% 27.8% 31.8% 20.0%
Total 100.0% 100.0% 100.0% 100.0%
Patients were registered in 2012 to 2016; ASCT, autologous stem cell transplant

June 2019
80
Table 27. Proportions of patients up to 70 years who received bortezomib and/or ASCT, by deprivation.
Treatment NZDep2013
1-2 3-4 5-6 7-8 9-10
Bortezomib + ASCT 47.7% 50.3% 41.4% 37.8% 33.7%
ASCT not bortezomib 0.5% 1.7% 0.0% 0.0% 0.5%
Bortezomib not ASCT 25.4% 29.1% 33.6% 41.9% 41.6%
Neither 26.4% 18.9% 25.0% 20.3% 24.2%
Total 100.0% 100.0% 100.0% 100.0% 100.0%
Patients were registered in 2012 to 2016; ASCT, autologous stem cell transplant; NZDep2013, socioeconomic deprivation index
Dosage of bortezomib
The typical dosage regimen for bortezomib in New Zealand currently is 1.5-1.6 mg/m2 sub cutaneous weekly. Some patients receive lower doses. Depending on disease progression and tolerability, up to 9 cycles of bortezomib at four doses per cycle may be given as first line therapy. Based on the average height and weight for men (175.5cm, 84.7kg) and women (162.5cm, 72.1kg) 80 the mean body surface area (BSA) is 2.0 m2 for men and 1.8 m2 for women. For 36 funded doses of 1.6 mg/m2, the mean cumulative dose is 36x2.0x1.6 = 117mg for men and 36x1.8x1.6 = 104mg for women. Therapy extending beyond 9 cycles, which is used elsewhere for maintenance, is not yet funded in New Zealand.
The total amount of bortezomib that each patient received was calculated from the pharmaceutical (dispensing) collection. This includes either first line therapy or treatment of relapsed/refractory myeloma, but not both. Doses were mostly given weekly and some fortnightly, with some split (same-day) doses but minimal slippage in the timing of administration (Figure 19). The cumulative dose of bortezomib per patient could be as high as 150mg or more, but commonly it was in the range 50 to 100mg (mean 66.4, median 67.1mg) which is 23 doses each on average (median 24). The large proportion of patients having a suboptimal dose shows that therapy with bortezomib was terminated early for a high proportion of patients, presumably because of disease progression or toxicity (Figure 19). This suggests a need for different management strategies and/or more choice in first-line therapies (see Section IV).

The Burden of Multiple Myeloma in New Zealand
81
Figure 19. Interval between doses of bortezomib and distribution of the cumulative dose (N=1620).
Patients were registered in 2012 to 2016
Uptake of bortezomib, ASCT and lenalidomide by patients
Uptake of both therapies was lower for the 60 to 69-year age group than for younger ages (Figure 20).
Figure 20. Uptake of bortezomib and ASCT by age group for patients registered in 2012-2016.
ASCT, autologous stem cell transplant
050
001.0
e+04
1.5e+
042.0
e+04
Numb
er of
dose
s disp
ense
d
0 2 4 6 8 10 12 14 16 18 20 22Interval between doses (days)
Interval between doses of bortezomib
020
4060
8010
012
0
Numb
er of
patie
nts
0 20 40 60 80 100 120 140 160 180Cumulative dose (mg)
Cumulative quantity of bortezomib
0.00
0.25
0.50
0.75
1.00
Prop
ortion
on Bo
rtezo
mib
0 10 20 30 40 50Time from registration (weeks)
<50 50-5960-69 70-7980+
Bortezomib
0.00
0.25
0.50
0.75
1.00
Prop
ortion
on AS
CT
0 10 20 30 40 50 60 70 80Time from registration (months)
<50 50-5960-69 70-79
ASCT

June 2019
82
Uptake of both bortezomib and ASCT was higher for men than women but the difference in uptake of ASCT was not statistically different, probably because of lower numbers of patients (Figure 21).
Figure 21. Uptake of bortezomib and ASCT for men and women registered with myeloma (95%CI).
Bortezomib: p<0.01 (Wilcoxon test) ASCT: p=0.088 (Wilcoxon test)
Patients were registered in 2012 to 2016; ASCT, autologous stem cell transplant
Uptake of bortezomib was comparable across regions, however the time from registration to ASCT was greater in the Northern region compared to others (Figure 22).
Figure 22. Uptake of bortezomib (all ages) and ASCT (age ≤ 70y) following registration, by region (N=1864).
Bortezomib: p=0.13 ASCT: p<0.01
Patients were registered in 2012 to 2016; ASCT, autologous stem cell transplant
0.25
.5.75
1
Prop
ortion
rece
iving b
ortez
omib
0 10 20 30 40 50Weeks
95% CI 95% CIFemale Male
Bortezomib uptake, all ages
0.25
.5.75
1Pr
oport
ion re
ceivin
g ASC
T
0 10 20 30 40 50 60Months
95% CI 95% CIFemale Male
ASCT uptake age<=70
0.00
0.25
0.50
0.75
1.00
Prop
ortion
on bo
rtezo
mib
0 10 20 30 40 50 60 70 80 90 100Weeks after registrationCentral MidlandNorthern Southern
Bortezomib
0.00
0.25
0.50
0.75
1.00
Prop
ortion
on AS
CT
0 10 20 30 40 50 60 70 80 90 100Weeks after registrationCentral MidlandNorthern Southern
ASCT
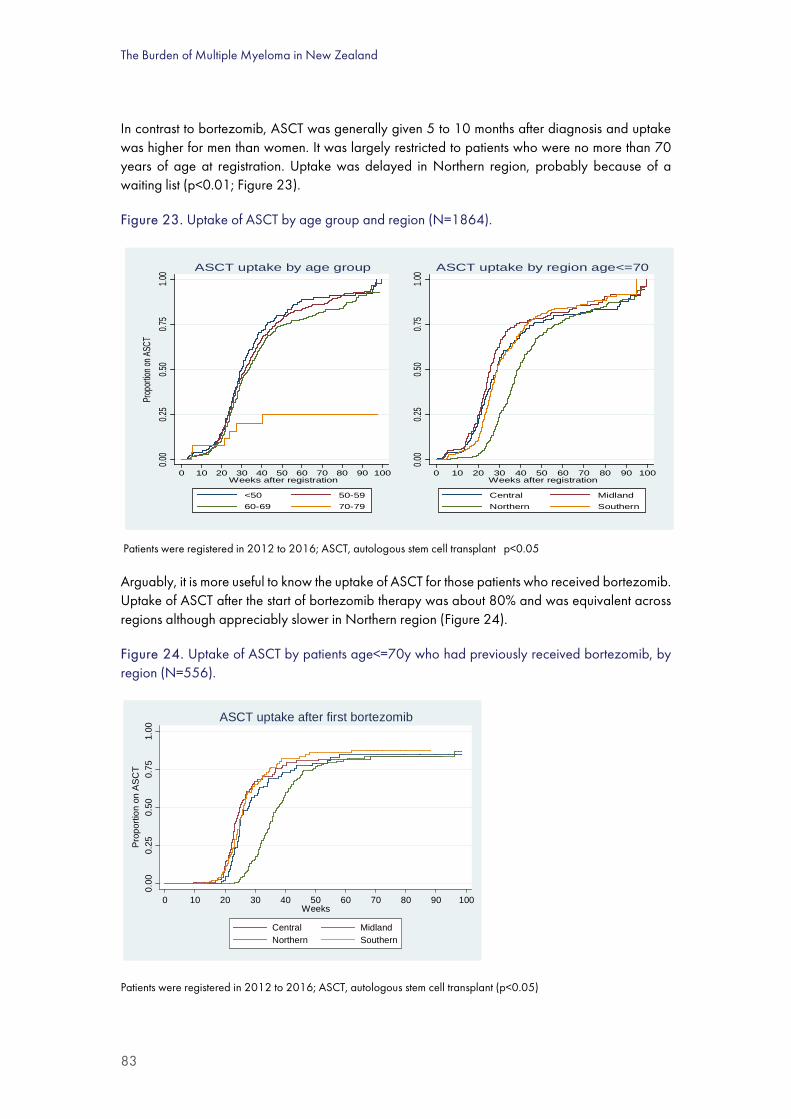
The Burden of Multiple Myeloma in New Zealand
83
In contrast to bortezomib, ASCT was generally given 5 to 10 months after diagnosis and uptake was higher for men than women. It was largely restricted to patients who were no more than 70 years of age at registration. Uptake was delayed in Northern region, probably because of a waiting list (p<0.01; Figure 23).
Figure 23. Uptake of ASCT by age group and region (N=1864).
Patients were registered in 2012 to 2016; ASCT, autologous stem cell transplant p<0.05
Arguably, it is more useful to know the uptake of ASCT for those patients who received bortezomib. Uptake of ASCT after the start of bortezomib therapy was about 80% and was equivalent across regions although appreciably slower in Northern region (Figure 24).
Figure 24. Uptake of ASCT by patients age<=70y who had previously received bortezomib, by region (N=556).
Patients were registered in 2012 to 2016; ASCT, autologous stem cell transplant (p<0.05)
0.00
0.25
0.50
0.75
1.00
Prop
ortion
on AS
CT
0 10 20 30 40 50 60 70 80 90 100Weeks after registration
<50 50-5960-69 70-79
ASCT uptake by age group
0.00
0.25
0.50
0.75
1.00
0 10 20 30 40 50 60 70 80 90 100Weeks after registration
Central MidlandNorthern Southern
ASCT uptake by region age<=70
0.00
0.25
0.50
0.75
1.00
Prop
ortio
n on
ASC
T
0 10 20 30 40 50 60 70 80 90 100Weeks
Central MidlandNorthern Southern
ASCT uptake after first bortezomib

June 2019
84
Uptake of bortezomib was similar for Māori/Pacific patients up to 70 years of age at registration, compared to others, however uptake of ASCT following bortezomib was lower (Figure 25).
Figure 25. Uptake of bortezomib and ASCT by ethnic group.
p= 0.80 p<0.001
ASCT, autologous stem cell transplant
Uptake of bortezomib was similar for patients living in areas with high socioeconomic deprivation but uptake of ASCT was significantly lower (Figure 26.)
Figure 26. Uptake of bortezomib and ASCT by patients registered in 2012-2016.
p = 0.39 p<0.01 ASCT, autologous stem cell transplant
0.00
0.25
0.50
0.75
1.00
Prop
ortion
takin
g bort
ezom
ib
0 5 10 15 20 25 30 35 40 45 50Weeks after registrationMaori/Pacifika Other
Bortezomib
0.00
0.25
0.50
0.75
1.00
Prop
ortion
havin
g ASC
T
0 5 10 15 20 25 30 35 40Months after starting bortezomib
Other Maori/Pasifika
ASCT
0.00
0.25
0.50
0.75
1.00
Prop
ortio
n on B
ortez
omib
0 10 20 30 40 50 60 70 80 90 100Weeks after registration
NZDep 1-5 NZDep 6-10
Bortezomib
0.00
0.25
0.50
0.75
1.00
Prop
ortio
n hav
ing A
SCT
after
borte
zomi
b
0 5 10 15 20 25 30 35 40Months after starting bortezomib
NZDep 1-5 NZDep 6-10
ASCT after bortezomib

The Burden of Multiple Myeloma in New Zealand
85
Uptake of lenalidomide
Lenalidomide was registered by Medsafe on 16 October 2008 and funded on September 1, 2014 as third line therapy. Prior to funding it was made available through a compassionate access programme and a clinical trial.
Total amount of bortezomib dispensed
After the funding year (2011), approximately 20,000mg of bortezomib was dispensed each year across the country, with Northern region using the most (Figure 27).
Figure 27. Total quantity of bortezomib dispensed in May 2011 to June 2016, by region.
Possible explanations for suboptimal uptake include unwillingness to undergo the therapy, comorbidities, ineligibility due to having (asymptomatic) smouldering myeloma, limited access to infusion facilities and/or unavailability of alternative less toxic first-line therapies. Additionally, in 2012-2016, there was regional variation in the time taken from registration to utilisation of ASCT (see above). While the causes of these disparities (viz. low uptake, low cumulative dosage and regional variation) is beyond the scope of this report, they all deserve explanation and remedy.
Impact of stem cell transplant and novel pharmaceutical therapies on survival
Summary
1. There was a clear improvement in both overall survival and cause-specific survival after April 2011 when bortezomib was funded, especially for patients over 70 years of age.
2. The improvement in survival was larger for those patients who did not receive ASCT.
0
5000
10000
15000
20000
25000
2011 2012 2013 2014 2015 2016
Am
ount
of b
orte
zom
ib
disp
ense
d (m
g)
Northern Midland Central Southern2016 is for the first 6 months only

June 2019
86
3. Multivariate analysis showed that younger age at registration, higher socioeconomic status, and being domiciled in the Northern cancer region were independently associated with better survival.
Findings
Bortezomib was funded on May 1, 2011, for use in combination with cyclophosphamide or thalidomide plus dexamethasone. We explored its probable impact on overall survival in 2 complementary ways:
1. By comparing survival before and after funding (January 2006 to April 2011 vs May 2011 to December 2016).
2. For patients who were registered in 2012 to 2016, by comparing survival for those who received bortezomib with those who did not.
There was a clear improvement in both overall survival and cause-specific survival after April 2011 (Figure 28.) This finding provides important prognostic information; however, because of confounding factors such as other improvements in clinical management over time (including lenalidomide as third line therapy for some patients), the advantage of bortezomib-containing regimens could be overstated.
Figure 28. Overall and cause-specific survival before and after bortezomib was funded in May 2011.
p<0.01 p<0.01
Study period: 2006-2016.
Most of the difference in survival was experienced by the older patient group who had fewer treatment options (Figure 29.) While the differences are encouraging, factors other than novel drug therapies have been occurring in the New Zealand health sector could have contributed (see Discussion, Section VII).
0.00
0.25
0.50
0.75
1.00
Prop
ortion
alive
0 20 40 60 80 100 120Months
After funding Before funding
Observed survival
0.00
0.25
0.50
0.75
1.00
Prop
ortion
who
had n
ot die
d from
mye
loma
0 20 40 60 80 100 120Months
After funding Before funding
Cause specific survival

The Burden of Multiple Myeloma in New Zealand
87
Figure 29. Overall survival by age group, before and after bortezomib was funded in May 2011.
Study period January 2006 to December 2016 (p<0.05 for both age groups)
Patients who did not receive ASCT in the pre-bortezomib era had the most pronounced improvement in survival benefit when compared with patients who did not receive ASCT in the post-bortezomib era (Figure 30.)
Figure 30. Overall survival for patients who did not receive ASCT, before and after funding of bortezomib.
Study period January 2006 to December 2016 (p<0.05 for both age groups)
ASCT, autologous stem cell transplant
0.00
0.25
0.50
0.75
1.00
Prop
ortion
alive
0 20 40 60 80 100Months
After funding Before funding
Age<70y
0.00
0.25
0.50
0.75
1.00
0 20 40 60 80 100 120Months
After funding Before funding
Age>=70y
0.00
0.25
0.50
0.75
1.00
Prop
ortion
alive
0 20 40 60 80 100 120Months
After funding Before funding
Survival age<70 without ASCT
0.00
0.25
0.50
0.75
1.00
0 20 40 60 80 100 120Months
After funding Before funding
Survival age>=70 without ASCT

June 2019
88
Greater survival benefit of bortezomib without ASCT was accrued by patients in the older than the younger age group (Figure 31. )
Figure 31. Overall survival of patients registered in 2012-2016 with or without bortezomib, without ASCT.
ASCT, autologous stem cell transplant
Comparing patients who received bortezomib with or without ASCT, along with those who received neither, shows a strong contrast consistent with the well-established benefits of both therapies (Figure 32). Although these results are impressive, the comparison is confounded by patient selection: i.e. some of the survival benefit comes from selecting the fittest patients to receive both therapies, and this group would probably have survived longer than the control (untreated) group if they had also not been treated. Nevertheless, the analysis has prognostic value because it shows comparative survival in the real-world situation. The flat portion of the top curve represents patients who had bortezomib and survived long enough to receive ASCT. Those who had bortezomib but did not live that long are included in the first 10 months of the middle curve.
0.00
0.25
0.50
0.75
1.00
Prop
ortio
n aliv
e
0 10 20 30 40 50 60Months
Without bortezomib With bortezomib
Age<70y, no ASCT
0.00
0.25
0.50
0.75
1.00
0 10 20 30 40 50 60Months
Without bortezomib With bortezomib
Age>=70y, no ASCT

The Burden of Multiple Myeloma in New Zealand
89
Figure 32. Overall survival of patients who were treated with bortezomib and/or ASCT.
Patients were registered in 2012 to 2016; N=1834; (p<0.001)
ASCT, autologous stem cell transplant
The dispersal of these graphs can be explained partly by selection of patients: in general, younger patients with the best health received both treatments (upper curve) while older patients with the poorest health received neither (lower curve). Nevertheless, the separation of these graphs is consistent with highly effective therapies in the New Zealand setting.
Prognostic factors: multivariate analysis
It is important to discern which variables contribute independently to overall survival; in particular, which treatments are effective in the real world setting as distinct from clinical trials. This can be done using multivariate analysis, which quantifies the impact of each prognostic factor independently. Essentially, 9 potential prognostic factors were analysed in a Cox proportional hazard model, and factors that did not contribute to the outcome were eliminated sequentially, leaving 5 independent prognostic factors. Regions were numbered 1 to 4 (categorical variables) sequentially from north to south of New Zealand, with Northern cancer network region being numbered 1.
For individuals registered in the period 2012-2016, both ASCT and bortezomib were available throughout the period of observation and both of these interventions substantially improved survival. In contrast, older age at registration, low socioeconomic status, and being domiciled outside the Northern cancer region were independent adverse prognostic factors (i.e. they were
0.00
0.25
0.50
0.75
1.00
Prop
ortio
n al
ive
0 10 20 30 40 50 60 70 80Months
Bortezomib + ASCT (N=392) Bortezomib (N=757)Neither (N=685)
Survival by treatment in 2012-2016

June 2019
90
associated with reduced overall survival). Covariates that did not contribute independently to survival were sex and ethnicity (Table 28).
There were no significant interactions among the prognostic factors (not shown).
Table 28. Prognostic factors for survival of patients registered in 2012-2016 (N=1864).
Prognostic factor Hazard Ratio +95%CI -95%CI
ASCT 0.661 0.505 0.866
Bortezomib 0.740 0.635 0.861
Age at registration (y) 1.058 1.049 1.066
NZDep2013 (Quintiles) 1.098 1.043 1.155
Region 1.118 1.055 1.185
Hazard ratios <1 are favourable; those >1 are unfavourable. Regions are given as 4 categories numbered from 1 to 4, from Northern to Southern region, respectively. P<0.001 CI, confidence interval
The Burden of Multiple Myeloma in New Zealand
91
Tania’s story My husband was diagnosed with myeloma a few years ago at the age of 45. At the time our two sons were aged 7 and 4. Like most of the population we knew very little about this nasty disease, but we became fast learners.
Within a year and a half my husband had undergone high dose steroid treatment, radiation therapy, induction therapy, high dose chemotherapy with autologous stem cell transplant and some follow-up chemotherapy when he was well enough after the transplant. Overall the process of treatment and recovery took him away from full-time employment for about 2 and half years.
The memories of this crazy time are a little bit blurry now, but some things stand out. The support of our family and community. The meals, the school and kindy pick-ups and the much-needed hugs. Our 7-year-old correcting me with ‘don’t you mean plasmacytoma’ when I referred to a tumour as a ‘lump’. Those young ears and minds don’t miss a thing. The kindness and understanding of employers. The uncertainty and fear for our future. The incredible people that serve our hospitals.
The anxiety of relapse is never far away, but we do our best to focus on raising our family and getting on with life.
People often think if you have cancer, you’re either cured or you’re dying. We have so much hope in new treatments that I try to think of it as living as best you can with cancer. I try to think of it as a chronic illness rather than a terminal one.
Names and identifiers have been changed.

June 2019
92
V QUALITY OF LIFE
Summary
1. Myeloma carries a high burden of symptoms and reduced health-related quality of life (HRQoL).
2. HRQoL varies with the course of the disease.
3. Fatigue and physical weakness are common especially after transplant.
4. Osteolytic lesions develop in nearly 90% of patients with myeloma, and these are frequently complicated by skeletal-related events (SREs) such as severe bone pain, pathologic fractures, vertebral collapse, hypercalcaemia, and spinal cord compression.
5. SREs have a negative effect on patients' quality of life and affect their long-term outcomes, including survival.
6. Patients with myeloma require a different form of follow-up compared to patients with many other cancers, because of its chronic nature.
7. Widespread physical, emotional, and social challenges can be experienced by patients throughout their illness trajectories, even in periods of remission.
8. Large and medium HRQoL improvements occur during first line treatments, but no clinically beneficial change or deteriorations in scores of global QoL or fatigue were reported during treatment of relapse.
9. A Global Burden of Disease study reported that myeloma caused 2.1 million disability adjusted life years globally in 2016 but the contribution of New Zealand to the total was not reported.
10. Stories of patients and informal caregivers in this report provide a valuable resource, and a New Zealand myeloma Facebook group is also useful, although this is not a public resource.
Quality of life was not studied formally for New Zealand but is reviewed here. Individuals with multiple myeloma report a high burden of symptoms and reduced HRQoL compared to patients with other haematological malignancies. As with other cancers, HRQoL varies with the course of the disease. This report includes patient stories that provide insights, sometimes harrowing, about HRQoL.
In particular, fatigue and physical weakness are common especially following ASCT. Bone involvement, manifesting as osteolytic bone disease or osteopenia, is one of the defining features of multiple myeloma and can be the first presenting symptom. Osteolytic lesions develop in nearly 90% of patients with myeloma, and these are frequently complicated by skeletal-related events (SREs) such as severe bone pain, pathologic fractures, vertebral collapse, hypercalcaemia, and spinal cord compression. SREs have a negative effect on patients' quality of life and affect their long-term outcomes, including survival 81.
The Burden of Multiple Myeloma in New Zealand
93
Only a few formal studies on HRQol are available. Hauksdottir and colleagues systematically reviewed 11 studies on HRQoL in patients with myeloma. They concluded that patients with myeloma require a different form of follow-up compared to patients with many other cancers, because of its chronic nature. Their results demonstrate that widespread physical, emotional, and social challenges were experienced by patients throughout their illness trajectories, even in periods of remission 82.
Nielsen and colleagues reviewed publications with longitudinal follow-up using the European Organization for Research and Treatment (EORTC) QLQ-C30 instrument for HRQoL measurement of physical functioning, global quality of life, fatigue and/or pain [83]. An analysis of mean change from baseline was carried out according to minimal important difference (MID). They reported that large and medium HRQoL improvements were reported during first line treatments, but no clinically beneficial change or deteriorations in scores of global QoL or fatigue were reported during relapse treatment 83.
A Global Burden of Disease study using global disutility values reported that myeloma caused 2.1 million disability adjusted life years globally in 2016, however the contribution of New Zealand to the total was not reported 12.
Other than the studies that are reviewed above, little published information is available. Stories of patients and informal caregivers in this report provide a valuable resource, and a New Zealand myeloma Facebook group is also useful, although this is not a public resource.
“My partner’s diagnosis has quite radically changed our lives. From having active lives diving, boating, fishing etc, and with very good salaries, we sold everything and moved cities to be close to family for support. [My partner] had 2 years of no work and I took a $15,000 annual salary drop in a new job, and my career has limited options here. We must plan everything around his ability to cope with pain and lethargy.”

June 2019
94
Jim’s story I was jogging in early 2001 when a sharp pain in my hip left me barely able to walk. The GP diagnosed a groin strain, and the physio recommended a set of exercises that seemed to be improving things, until a winter ski crash had me hobbling again. An X-ray confirmed that my hip had been weakened by multiple
myeloma. As an aside, before seeing the specialist who confirmed the diagnosis, I showed the X-Ray to a surgeon friend. He examined the dark smudges on the image and said quietly “this needs to be investigated”. Some years later he told me that what he was really thinking was “Jim won’t be with us much longer”.
Which brings me to survival. When I was diagnosed, multiple myeloma was generally considered to have a 3-4 year median survival, which of course sounds scary. But the distribution is skewed, with a long tail of people who survive much longer than the median. If you’re otherwise healthy, you’ve got a good chance of being in that long tail. Biologist Stephen Jay Gould wrote an excellent essay explaining this: “The median isn’t the message” <https://www.cancerguide.org/ median_not_msg.html>.
In 2002 I had a relatively uneventful stem cell transplant, and was symptom free through to 2007, when lesions appeared in my chest and spine. Since then the journey has been an approximately 2 year cycle: (1) relapse (2) have radiotherapy and chemotherapy (3) achieve stability (4) repeat.
I’ve been fortunate that when I’ve relapsed, there has generally been a new and effective treatment available, either through Pharmac funding, or through a drug trial or compassionate access. It’s only one of the most recent drugs, Pomalidomide, that we’ve had to self-fund. I’m grateful to the medical staff who have navigated the often byzantine drug regulations to achieve this.
The flexibility of my work as a university lecturer, and tolerant colleagues, meant that I had a satisfying career until I retired in 2014.
The biggest impact of multiple myeloma has been on recreation. I had to give up running and skiing, and scale back tramping trips - although I walked the Routeburn track in 2014. But I’ve kept up cycling, more recently with the assistance of an electric bike. When I thought that my legs might not be up to carrying me for long distances, I took up sea kayaking. Thanks to travel insurance that recognises pre-existing conditions, I’ve been able to continue overseas travel, most recently a family bike ride down the Rhine river, although I have to be careful of fatigue.
Cycling has been a big part of my life - as well as recreation, it has been my main transport around town. I’ve been able to bike to the majority of my hospital appointments, and I think the fitness engendered by cycling has helped me survive the rigours of treatment.
My myeloma journey has been a “good” one, if such a thing is possible. For this I have to thank my ever supportive partner, as well as the medical staff. I’m aware that had things been slightly different - if the stem cell transplant hadn’t lasted as long, for example - the journey would have been rockier.
Names and identifiers have been changed.

The Burden of Multiple Myeloma in New Zealand
95

June 2019
96
VI COSTS OF MYELOMA
Summary
1. In 2016, the healthcare system spent at least $46.28 million on men and women with myeloma, over and above what was spent on the general population when matched for age group and sex. The total spending attributable to myeloma in 2016 was $26,550 for men and $23,984 for women on average.
2. The largest expenditure attributable to myeloma was for pharmaceuticals ($30.3 million). However, pharmaceutical costs could be greatly overestimated because of confidential rebates paid by the pharmaceutical industry to Pharmac.
3. In 2016, myeloma patients also had higher than average need for hospital admissions (costing $10.7 million), outpatient hospital visits ($4.4 million), laboratory testing ($0.7 million), emergency department visits ($0.3 million) and other miscellaneous items. Laboratory costs are probably under-estimated, and primary care costs of myeloma patients have been assumed (conservatively) to be similar to those of the general population. This is because myeloma is largely managed by specialists and because convincing information on primary care is unavailable.
4. Compared to the age/sex matched general population, in 2016 individuals with myeloma received lower incomes on average by approximately $20,000 and $10,000 for middle-aged men and women respectively and were $9000 and $6000 lower for men and women aged 65 or upwards.
5. Income lost by caregivers would add to the cost burden, as shown by stories in this report (Appendix C) but was not studied systematically. Based on other studies, most of the cost burden would be incurred within the first year after diagnosis or in the last six months before death.
6. Income tax revenue lost by the Government in 2016 was estimated at $2.31m for men and $1.01m for women, a total of $3.31m.
Overview & methodology
Multiple myeloma is characterised by intense use of healthcare resources for cancer treatment, adverse effects of treatment, management of disease symptoms, imaging, pharmacotherapies, and comorbidities. All of these are costly to the healthcare system, and some costs fall to patients and their families. In New Zealand, most of these costs fall on the public healthcare system, although private specialists perform some insurance-funded and some publicly-funded healthcare.
Some of the costlier treatments for multiple myeloma include:
- Newer drug therapies (bortezomib, lenalidomide)
- Stem cell transplants
The Burden of Multiple Myeloma in New Zealand
97
- Radiotherapy
- Surgery
- Intravenous bisphosphonates, and
- Diagnostics such as MRI and FISH chromosomal analysis.
Other costs to the public health system include:
- Haematology services
- Oncology services
- Transfusions
- Cardiovascular therapies (e.g. For arrythmias)
- Respiratory therapies
- Other diagnostics
- Imaging (Positron-emission tomography, magnetic resonance imaging (MRI), computerised tomography (CT) scans)
- Laboratory tests
- Older hospital drug therapies (dexamethasone, thalidomide and others)
- Community prescription medicines
- General practitioner consultations (mean cost per consultation), and
- Non-admitted patient costs:
- Emergency department presentations
- Outpatient clinics
Medical costs to patients include:
- GP visits
- Over-the-counter medicines (i.e. Those which do not require a prescription)
- Nutraceuticals, and
- Nutritional supplements.
Analysing all these costs is a formidable task, as data are stored across a number of databases and in many cases are not routinely collected. Therefore, to simplify the analysis, only healthcare costs to the government and personal income and income tax were included. Welfare and other government- funded benefits in 2016 were considered but not included because there were too many missing records.
No attempt was made to classify what was and was not a specific ‘myeloma-related’ cost. Rather, we used the well-established ‘excess’ or attributable cost approach, whereby we calculated the

June 2019
98
expected health system cost of a New Zealand resident by sex and 5-year age groups without the cancer diagnosis, then subtracted this from the observed total costs in the same sex and age groups, one at a time84 85.The costs of primary care both to the government and to patients were not included. This is because myeloma is largely managed by specialists and because we did not have convincing information on primary care. We therefore assumed (conservatively) that primary care costs of myeloma patients were similar to those of the general population. These costs are likely to comprise a relatively small proportion of the cost that is attributable to myeloma
A bottom-up costing approach using the Integrated Data Infrastructure (IDI) was undertaken. The following disclaimer applies:
Statistics NZ Disclaimer:
The results in this paper are not official statistics. They have been created for research purposes from the Integrated Data Infrastructure (IDI), managed by Statistics New Zealand. The opinions, findings, recommendations, and conclusions expressed in this paper are those of the author(s), not Statistics NZ. Access to the anonymised data used in this study was provided by Statistics NZ under the security and confidentiality provisions of the Statistics Act 1975.
Only people authorised by the Statistics Act 1975 are allowed to see data about any particular person, household, business, or organisation, and the results in this paper have been confidentialised to protect these groups for identification and to keep their data safe. Careful consideration has been given to the privacy, security, and confidentiality issues associated with using administrative and survey data in the IDI. Further detail can be found in the Privacy impact assessment for the Integrated Data Infrastructure available from www.stats.govt.nz.
The following national data collections were used in these analyses:
NZ Cancer Registry: ICD10 C90.00, C90.10, C90.01
National Mortality Register
Department of Internal Affairs Register (for deaths in 2016)
National Pharmaceutical Claims Collection
National Minimum Dataset (NMDS)
National Non-admitted Patient Collection (NNPAC)
National Laboratory Claims Collection
Inland Revenue Service IDI file: ‘data.income_cal_yr’
Analyses were undertaken under the standard operating conditions of the IDI, including confidentiality and data security, which entailed working in a private space, rounding numbers to base 3 and suppression of low numbers 86. In each case, the relevant datasets were linked probabilistically at patient level through the IDI central linking database (‘spine’) and non-residents and emigrants were excluded. Except for prevalence calculations (see Section II), registrations prior to 2004 were excluded because the International Myeloma Working Group revised the
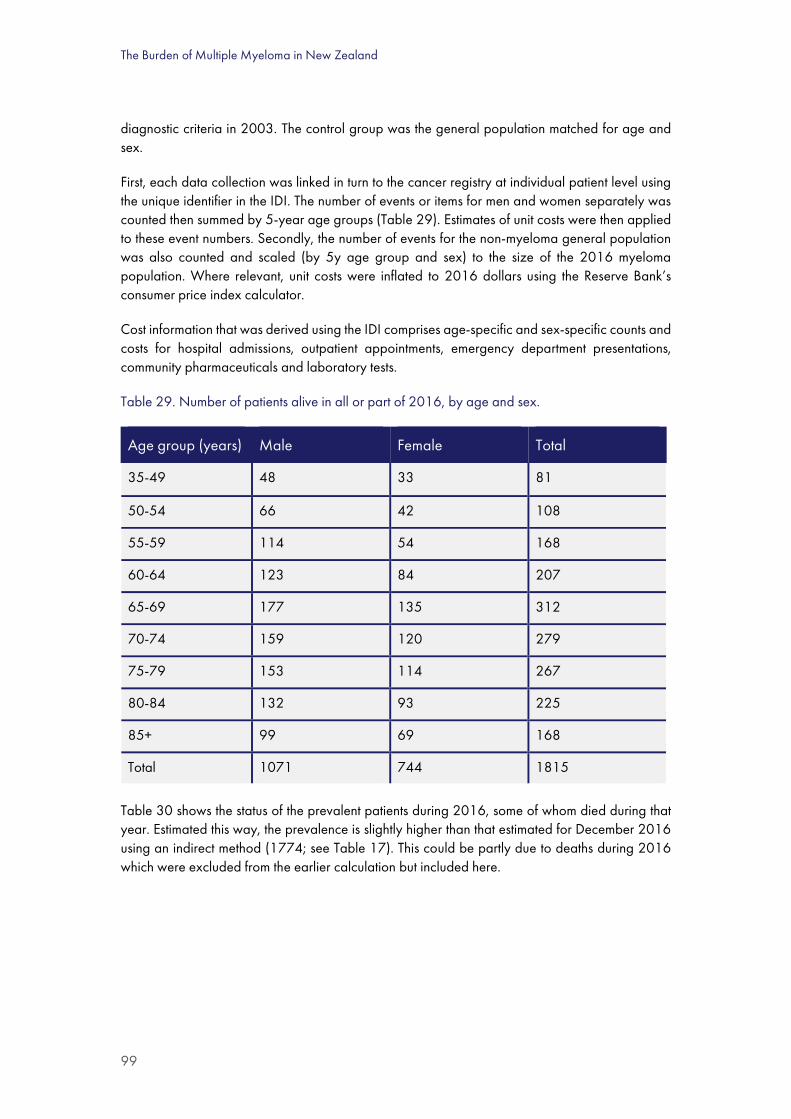
The Burden of Multiple Myeloma in New Zealand
99
diagnostic criteria in 2003. The control group was the general population matched for age and sex.
First, each data collection was linked in turn to the cancer registry at individual patient level using the unique identifier in the IDI. The number of events or items for men and women separately was counted then summed by 5-year age groups (Table 29). Estimates of unit costs were then applied to these event numbers. Secondly, the number of events for the non-myeloma general population was also counted and scaled (by 5y age group and sex) to the size of the 2016 myeloma population. Where relevant, unit costs were inflated to 2016 dollars using the Reserve Bank’s consumer price index calculator.
Cost information that was derived using the IDI comprises age-specific and sex-specific counts and costs for hospital admissions, outpatient appointments, emergency department presentations, community pharmaceuticals and laboratory tests.
Table 29. Number of patients alive in all or part of 2016, by age and sex.
Age group (years) Male Female Total
35-49 48 33 81
50-54 66 42 108
55-59 114 54 168
60-64 123 84 207
65-69 177 135 312
70-74 159 120 279
75-79 153 114 267
80-84 132 93 225
85+ 99 69 168
Total 1071 744 1815
Table 30 shows the status of the prevalent patients during 2016, some of whom died during that year. Estimated this way, the prevalence is slightly higher than that estimated for December 2016 using an indirect method (1774; see Table 17). This could be partly due to deaths during 2016 which were excluded from the earlier calculation but included here.

June 2019
100
Table 30. Number of patients alive in all or part of 2016, by status.
Status Male Female Total
Diagnosed before 2016 and survived 2016 717 510 1227
Newly diagnosed and survived 2016 207 135 342
Diagnosed before 2016 and died in 2016 105 72 177
Newly diagnosed and died in 2016 39 24 63
Total 1068 741 1809
A slight discrepancy between the totals in Table 28 and Table 29. (<0.5%) is due to rounding of small numbers to base 3 as required by Statistics NZ.
Hospital admissions
The National Minimum Dataset (NMDS) was used to calculate hospital inpatient events. Events were included where a diagnosis of myeloma (C9000, C9010, or C9001) was recorded as the principal or secondary (any other) diagnosis. Event counts and Weighted Inlier Equivalent Separations (WiesNZ) costweights were obtained for hospital admissions of patients who were registered in any year and who were discharged or died in 2016. The 2016 WiesNZ unit price of $4824.67 was applied to these counts and cost-weights (Table 31). The actual cost for admissions with a principal diagnosis of myeloma is less than half this figure: however, because our purpose was to estimate the cost attributable directly to myeloma, it is necessary for consistency to count and cost all hospital admissions.
Table 31. Total cost and numbers of hospital admissions for patients with myeloma in 2016.
Region Cost ($m) Number of admissions
Central $3.0 702
Midland $3.4 1095
Northern $5.0 972
Southern $3.5 1032
New Zealand $14.9 3,801
Source: NMDS event counts for C9000, C9010 or C9001 in 2016, as supplied by Statistics NZ; WiesNZ 2016 costweight applied as published by the Ministry of Health. Excludes individuals with region unspecified.
Overall, hospital inpatient events cost $14.9 million and accounted for 28.4% of the included healthcare costs for patients with myeloma.

The Burden of Multiple Myeloma in New Zealand
101
Pharmaceuticals
Overview
In this section, only dispensed community pharmaceuticals and cancer specific hospital pharmaceuticals, designated as pharmaceutical cancer treatments (PCTs) by Pharmac, are included. Other hospital pharmaceuticals are included in the hospital admission case-mix costweight and were excluded to avoid double counting.
Pharmaceuticals are a major contributor to the cost burden of myeloma. Myeloma is not considered by Pharmac to be a ‘rare disorder’ as its prevalence is considerably higher than the funder’s budget-driven definition (≤2 per 100,000)[11]. Therefore it does not qualify for a contestable budget that is ring fenced for rare disorders.
The real cost of pharmaceuticals in New Zealand is determined partly by confidential rebates paid by pharmaceutical manufacturers to funders, based on Pharmac’s bulk purchasing negotiating power. Where pharmaceutical companies are reluctant to make a low-price public, they can offer confidential rebates rather than price reductions. Furthermore, rebate contracts are often volume-dependent rather than a fixed discount, so the true expenditure on some pharmaceuticals is not known until the end of the financial year87. This applies particularly for novel therapies with high unit costs, such as bortezomib which was dispensed for over 75% of patients in 2012-2016 and lenalidomide which was used for a minority of patients in 2016. In 2016, the weighted average rebate for about 150 listed pharmaceuticals, including bortezomib and lenalidomide, was 45%87.
The cost incurred by the funder (e.g. DHBs when paying pharmacies for pharmaceutical dispensing) includes the full pharmaceutical price, and this is the cost that appears in the IDI Pharmaceutical Claims dataset. The IDI also records the cost of pharmacy mark-up and associated dispensing fees. The rebates are then collected by Pharmac and paid to the funder separately [88].
The BODE3 costing protocol for pharmaceuticals notes that, ‘Due to the confidentiality of these price negotiations, it is not possible to calculate a precise cost for any given pharmaceutical’ [BODE Pharmaceutical Costing Protocol, p.10]89.
In our analysis, the costliest pharmaceuticals by unit price, based on list price (i.e. excluding confidential rebates) are bortezomib and lenalidomide. We have no information on the specific rebates; therefore, the total cost of pharmaceuticals will be overestimated to an unknown extent.
We report the cost to the government of these pharmaceuticals at their price listed by Pharmac plus associated dispensing costs, excluding patient co-payment, as recorded in the Pharmaceutical Claims Collection (Table 32) using the variable below:
IDI variable name: ‘moh_pha_remimburs_cost_exc_gst_amt’
Definition: ‘Value reimbursed to the pharmacy, on this dispensing of a prescription item that excludes GST, and can be negative’
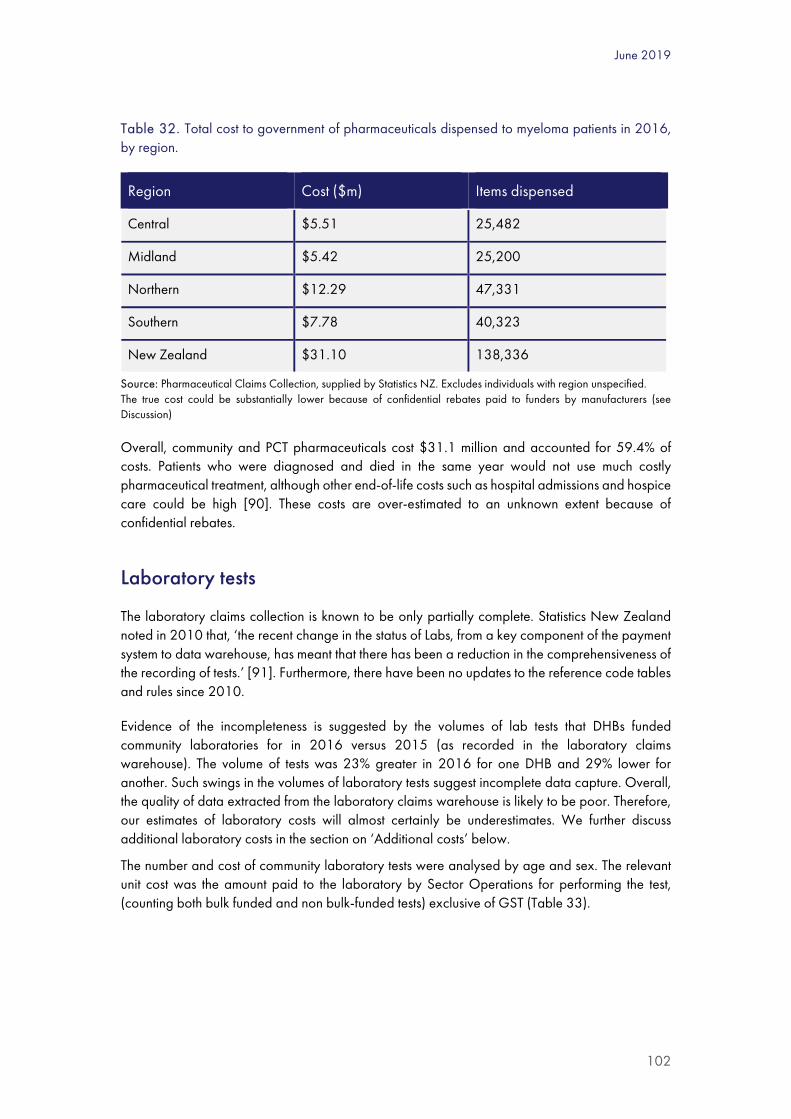
June 2019
102
Table 32. Total cost to government of pharmaceuticals dispensed to myeloma patients in 2016, by region.
Region Cost ($m) Items dispensed
Central $5.51 25,482
Midland $5.42 25,200
Northern $12.29 47,331
Southern $7.78 40,323
New Zealand $31.10 138,336
Source: Pharmaceutical Claims Collection, supplied by Statistics NZ. Excludes individuals with region unspecified. The true cost could be substantially lower because of confidential rebates paid to funders by manufacturers (see Discussion)
Overall, community and PCT pharmaceuticals cost $31.1 million and accounted for 59.4% of costs. Patients who were diagnosed and died in the same year would not use much costly pharmaceutical treatment, although other end-of-life costs such as hospital admissions and hospice care could be high [90]. These costs are over-estimated to an unknown extent because of confidential rebates.
Laboratory tests
The laboratory claims collection is known to be only partially complete. Statistics New Zealand noted in 2010 that, ‘the recent change in the status of Labs, from a key component of the payment system to data warehouse, has meant that there has been a reduction in the comprehensiveness of the recording of tests.’ [91]. Furthermore, there have been no updates to the reference code tables and rules since 2010.
Evidence of the incompleteness is suggested by the volumes of lab tests that DHBs funded community laboratories for in 2016 versus 2015 (as recorded in the laboratory claims warehouse). The volume of tests was 23% greater in 2016 for one DHB and 29% lower for another. Such swings in the volumes of laboratory tests suggest incomplete data capture. Overall, the quality of data extracted from the laboratory claims warehouse is likely to be poor. Therefore, our estimates of laboratory costs will almost certainly be underestimates. We further discuss additional laboratory costs in the section on ‘Additional costs’ below.
The number and cost of community laboratory tests were analysed by age and sex. The relevant unit cost was the amount paid to the laboratory by Sector Operations for performing the test, (counting both bulk funded and non bulk-funded tests) exclusive of GST (Table 33).

The Burden of Multiple Myeloma in New Zealand
103
Table 33. Total cost of community laboratory tests in 2016 for patients with myeloma, by region.
Region Cost ($m) Tests purchased
Central $0.09 10,428
Midland $0.15 21,201
Northern $0.54 58,548
Southern $0.09 9399
New Zealand $0.87 99,576
Source: National laboratory claims warehouse, provided by Statistics NZ. Excludes individuals with region unspecified.
Overall, community laboratory claims accounted for 1.7% of multiple myeloma patient costs in 2016, and costs attributed to myeloma patients were 4.3 times the laboratory costs of age-matched general population controls.
Outpatient and emergency department consultations
The National Non-Admitted Patient Collection (NNPAC) database was analysed and the number of events in each 5-year age group was counted. Events were categorised as either emergency department visits or outpatient events. The frequency of outpatient events was over 20 times higher for patients under 35 years of age compared to the general population, and ED visits were about 5-fold more frequent at all ages (Figure 33).
Figure 33. Ratio of ED and outpatient visits to general population visits by age and sex in 2016.
ED, emergency department; OP, outpatient
05
10152025303540
35-49 50-54 55-59 60-64 65-69 70-74 75-79 80-84 85+
Patie
nt /
Con
trol
Age group (Year)ED female OP female ED male OP male

June 2019
104
For costing purposes we then apportioned the other outpatient events into these categories: initial specialist visits; chemotherapy administration; or follow-up specialist visits. All patients diagnosed in 2016 were attributed one initial physician appointment (n = 405). An estimate of the number of outpatient visits for chemotherapy was obtained from the IDI pharmaceuticals dispensing dataset (n = 13,102) (e.g. whenever bortezomib was dispensed we assumed that this was administered subcutaneously at a supervised outpatient clinic), and remaining events were categorized as follow-ups (n = 4,748).
Anecdotally the frequency of follow-ups for patients with myeloma in remission is approximately three to six-monthly and patients in their first year of diagnosis can have follow-ups as frequently as monthly while they are undergoing chemotherapy.
Using Pharmac’s2018 Cost Resource Manual92 we then attributed the emergency department event unit cost ($358 in 2016), initial physician visit unit cost ($339), and follow-up visit unit cost ($242). However, Pharmac does not publish estimates of the total unit cost for outpatient chemotherapy, so we took the midpoint between Auckland District Health Board’s cost to non-residents for “follow-up visit chemotherapy”93 and the estimate for “oral chemotherapy oncology” published in the Ministry of Health’s Price of Cancer report [94]. This resulted in an estimate for outpatient chemotherapy event of $296 (2016) excluding the cost of pharmaceuticals.
Given that Pharmac’s estimated outpatient costs are for all medical specialties combined, the cost of individual haematology clinic appointments or treatments could be higher. There is some evidence for this higher cost of haematology in the Ministry of Health’s Price of Cancer Report [94]. However, we took a conservative approach to estimating the outpatient costs and used the most up-to-date estimates as determined by Pharmac.
Controls attended outpatient events at approximately one-tenth the rate of myeloma cases, and for simplicity we assumed that half of these were initial specialist visits and half were follow-up appointments on the basis that many referrals to specialists from the general population are then referred back to primary care for ongoing management. We applied Pharmac’s cost estimates accordingly.
We report separately the cost of emergency department events (Table 34) and other outpatient events (Table 35).
Overall, emergency department events accounted for only 0.8% of costs, however, ED costs attributed to myeloma patients in 2016 were 4.1 times the costs of age-matched controls.

The Burden of Multiple Myeloma in New Zealand
105
Table 34. Total cost of visits to the emergency department by patients with myeloma in 2016, by region.
Region Cost ($m) Events
Central $0.09 243
Midland $0.08 219
Northern $0.14 387
Southern $0.10 270
New Zealand $0.40 1,119
Source: National non-admitted patient collection (NNPAC) for event counts supplied by Statistics NZ; Pharmac’s 2018 ‘Cost-Resource Manual’ estimate of $358 per ED visit, adjusted to 2016 dollars. Excludes individuals with region unspecified.
Table 35. Total cost of outpatient events for patients with myeloma in 2016, by region.
Region Cost ($m)* Events
Central $1.14 4038
Midland $0.76 2697
Northern $1.89 6675
Southern $1.38 4872
New Zealand $5.17 18,282
Source: National non-admitted patient collection (NNPAC) event counts as supplied by Statistics NZ; authors’ analysis of costs based on estimated proportions of outpatient event types (initial appointments, 2.2% of events; follow-up appointments, 26.0% of events; and chemotherapy infusions, 71.8% of events). * Based on Pharmac’s list prices for initial and follow-up physician visits and the Price of Cancer report and ADHB nonresident prices for chemotherapy visits. Excludes individuals with region unspecified.
Overall, outpatient events, excluding the cost of PCT pharmaceuticals, accounted for 9.9% of the costs of multiple myeloma patients in 2016.
Additional Costs
We identified additional health system costs of up to $2.1 million that may not be captured in the datasets reported above. These additional costs comprise imaging, primary care and laboratory costs.

June 2019
106
Imaging costs
Medical imaging of myeloma patients, when it occurs in hospital, will be included in the costweight estimates for the admission event or the estimated outpatient event cost, however community-based imaging costs will not. By far the most expensive of these tests are MRI scans for diagnostic purposes.
While at one New Zealand hospital it is standard practice for all new myeloma patients to have a full body MRI, elsewhere in New Zealand that is not the case. Multi body region MRI can cost over $3000 according to private radiology practice price lists in New Zealand (see for example:95). If all newly diagnosed myeloma patients receive such an MRI, then unaccounted for MRI alone could contribute an additional $1.2 million per year to the costs of myeloma.
Additional non-laboratory diagnostic tests, if they are undertaken in the community, may not be captured by NMDS or NNPAC. Tests such as echocardiography or lung-function testing will add upwards of $300 per investigation93, or potentially another $240,000 per year.
Laboratory costs
In addition to costs recorded in the community laboratory claims warehouse, and those costs included in hospital case-mix costweights, there are likely to be additional laboratory costs that we have not counted. For example, the cost per patient of a FISH analysis (assuming 3 probes) is approximately $1500 [96]. If patients who are eligible for stem cell transplant (usually those under 70 years of age) standardly have such analysis, perhaps through a DHB internal hospital laboratory, then this could add up to $300,000 if half of newly diagnosed patients are tested. Laboratory tests processed by DHB internal laboratories are excluded from the laboratory claims dataset.
Primary care consultations
Anecdotally, cancer patients are largely managed by hospital specialists. In the absence of adequate information in the IDI, we assumed that age/sex specific GP consultation rates would be similar to the general population. This is most likely an under-estimate (see the Discussion). If, however, GP visits for the group of myeloma patients were twice as frequent as the general population, then this would have cost the government an additional $350,000 at current Ministry of Health 2018 capitation rates.
Costs incurred by patients and families
These costs are outside the scope of this study; however they can be very significant for cancer sufferers and families (see the patient stories and the patient survey in this report). Some of these costs comprise co-payments on GP consultations and pharmaceuticals; reductions in income for patients and informal caregivers; the costs of travel to and from treatments and appointments; and the value of leisure time.

The Burden of Multiple Myeloma in New Zealand
107
The impact of these costs for cancer patients can be quite substantial, as a report by Treasury shows. The author reported that the incomes of breast cancer patients were 15-16% lower in the first 12 months after diagnosis compared to average pre-diagnosis earnings or incomes of a comparison group [97].
The total government health system cost of multiple myeloma
The total government health system costs attributed to patients with a diagnosis of multiple myeloma in 2016 as identified in NMDS, NNPAC, the Laboratory Claims Warehouse, and the Pharmaceuticals Collection, are presented by sex (Table 36). and by region (Table 37). These costs sum to $52.4 million excluding the possible $2.1 million in additional imaging, laboratory and primary care costs that discussed above. This cost excludes costs incurred by patients and their families and it also excludes privately funded treatment provision. The overall higher cost for men is in direct proportion to the number of men in the cohort (see Table 29) and the cost per patient was higher for men than women in every category.
Table 36. Estimated total health system costs of patients with myeloma in 2016, by sex.
Admissions OP ED Labs Pharms Total
Total cost ($m)
Female $5.85 $2.04 $0.14 $0.35 $11.69 $20.07
Male $9.01 $3.12 $0.25 $0.52 $19.38 $32.28
Total $14.86 $5.16 $0.40 $0.87 $31.07 $52.35
% of total 28% 10% 1% 2% 59% 100%
% male cost 61% 61% 64% 60% 62% 62%
Cost per patient
Female $7,864 $2,738 $192 $469 $15,716 $26,980
Male $8,409 $2,917 $237 $482 $18,094 $30,138
Total $8,186 $2,844 $219 $477 $17,119 $28,844
Source: Authors’ cost analysis of data provided by Statistics NZ; figures do not include primary care costs, private health care, costs to patients and families, and some additional costs as detailed in main text. OP, outpatient clinic; ED, emergency department; Labs, laboratory tests Pharms, pharmaceuticals
The average cost per patient varied by region (Table 36), with Northern region being highest and Midland being lowest.

June 2019
108
Table 37. Estimated total health system costs of patients with myeloma in 2016, by region ($m).
Region Admissions Outpatient ED Labs Pharms Total cost
Cost per patient
Central $3.04 $1.14 $0.09 $0.09 $5.51 $9.88 $28,016
Midland $3.41 $0.76 $0.08 $0.15 $5.42 $9.81 $27,013
Northern $4.96 $1.89 $0.14 $0.54 $12.29 $19.81 $30,462
Southern $3.46 $1.38 $0.10 $0.09 $7.78 $12.80 $28,508
NZ $14.86 $5.17 $0.40 $0.87 $31.1 $52.3 $28,814
Source: Authors’ cost analysis of data provided by Statistics NZ; figures do not include primary care costs, private health care, costs to patients and families, and some additional costs as detailed in main text. The total cost differs between tables 37 and 38 because of mandatory rounding to base 3. ED, Emergency department; Labs, laboratory tests; Pharms, pharmaceuticals
The costs attributable to multiple myeloma
Costs were calculated for an age/sex-matched control population (representing the full New Zealand population) in the same way as the costs for patients with a diagnosis of multiple myeloma. Total government health system costs for this group were $6.07 million in 2016. This means that the attributable government cost of multiple myeloma was $46.28 million in 2016. Almost two-thirds of this was due to pharmaceuticals at their publicly listed price; however these costs are over-estimated because of unknown confidential rebates to suppliers. Costs will be higher for patients leading up to diagnosis and in the first year following diagnosis, and at the end of life, with years of remission costing considerably less [84]. The attributable cost per person was slightly higher for men than women, with a combined mean cost of $25,498 (Table 40 )

The Burden of Multiple Myeloma in New Zealand
109
Table 38. Estimated healthcare costs of myeloma patients and the age/sex matched general population.
Patients General population Disparity Attributable cost (%)
Items Cost ($m) Items Cost ($m) Items Cost ($m)
Admissions 3,804 $14.86 775 $4.21 3,029 $10.65 23.0%
OP 18,255 $5.16 2673 $0.76 15,582 $4.41 9.5%
ED 1,107 $0.40 271 $0.10 836 $0.30 0.6%
Labs 99,528 $0.87 20,481 $0.20 79,047 $0.66 1.4%
Pharms 138,375 $31.07 61,905 $0.81 76,470 $30.27 65.4%
Total 261,069 $52.35 86,106 $6.07 174,963 $46.28 100.0%
OP = outpatient; ED = Emergency dept; Labs = laboratory tests; Pharms = pharmaceuticals
Costs attributable to myeloma were higher for all age groups compared to the age/sex matched general population, especially for younger patients (Table 39.)
Table 39. Healthcare costs attributable to myeloma in 2016 by age and sex ($m).
Patients General population Attributable cost
Age group Female Male Total Female Male Total Female Male Total
35-49 $0.75 $1.77 $2.52 $0.04 $0.05 $0.09 $0.71 $1.72 $2.44
50-54 $1.14 $2.64 $3.77 $0.06 $0.09 $0.15 $1.08 $2.54 $3.62
55-59 $1.70 $3.70 $5.40 $0.09 $0.19 $0.28 $1.62 $3.51 $5.12
60-64 $2.45 $3.84 $6.29 $0.15 $0.28 $0.43 $2.30 $3.57 $5.86
65-69 $4.47 $5.62 $10.09 $0.31 $0.51 $0.82 $4.17 $5.11 $9.28
70-74 $3.30 $4.39 $7.68 $0.34 $0.58 $0.92 $2.96 $3.81 $6.77
75-79 $2.94 $4.90 $7.84 $0.42 $0.71 $1.13 $2.51 $4.19 $6.71
80-84 $2.18 $3.51 $5.70 $0.43 $0.74 $1.16 $1.76 $2.78 $4.54
85+ $1.14 $1.91 $3.05 $0.40 $0.70 $1.10 $0.75 $1.20 $1.95
Total $20.07 $32.28 $52.35 $2.23 $3.84 $6.07 $17.84 $28.43 $46.28

June 2019
110
Except for males under 55 years, the mean healthcare cost per person in 2016 was similar for men and women (Table 40).
Table 40. Mean attributable healthcare cost per patient attributable to myeloma in 2016, by age and sex.
Age group Female Male Total
35-49 $23,730 $35,911 $31,226
50-54 $25,677 $38,533 $33,534
55-59 $28,338 $31,588 $30,485
60-64 $27,340 $28,991 $28,321
65-69 $30,874 $28,387 $29,453
70-74 $24,635 $23,529 $24,000
75-79 $22,059 $27,411 $25,126
80-84 $18,903 $21,536 $20,433
85+ $10,801 $12,145 $11,593
Overall $23,984 $26,550 $25,498
Summary of healthcare costs
In summary, multiple myeloma is a major cost burden on the New Zealand healthcare system. Total costs per annum to the government healthcare system are estimated to be $52.35m and include the following: $31.07m in pharmaceutical dispensing; $14.86m for hospital inpatient events; $5.16m for hospital outpatient events; $0.87m of community laboratory testing; $0.40m for emergency department visits; and an additional estimated $2.1m of other costs potentially not accounted for in the databases we analysed. Importantly, the actual net costs of pharmaceuticals is likely to be considerably lower because of confidential rebates on pharmaceuticals (see the Discussion). Based on other studies, most of the cost burden would be incurred within the first year after diagnosis, because of the high cost of treatment, and the last six months before death.[90]
Some of these costs are over-estimates because it is difficult to attribute all the costs of medical care to myeloma; for example, some hospitalisations with a principal diagnosis of a severe infection might be unrelated to myeloma except for the additional diagnostic tests and/or level of care required. Likewise, some outpatient and emergency department visits could be unrelated to myeloma. However, the ‘attributable cost’ methodology captures comorbidities in both the patient group and the general population. Compared to an age and sex-matched control population, myeloma carries an additional cost burden (attributable cost) of $46.28m per year, or a mean of $25,498 per patient. The largest component of the attributable cost burden (65%) is due to the

The Burden of Multiple Myeloma in New Zealand
111
high cost of newly approved pharmaceuticals for treating myeloma, particularly bortezomib and lenalidomide. However, these costs are over- estimated to an unknown extent, because they exclude confidential rebates paid by suppliers to funders (see the Discussion).
Costs are distributed by sex in approximately the proportions of males and females in the study population. The largest cost burden for multiple myeloma falls to the Northern Region Cancer Network ($19.8m or 38% of total costs) which supports the largest number of patients. In addition to these health system costs, there are likely to be significant cost burdens to sectors other than health.
Loss of income
The main financial cost to families is reduction in income for both patients and their formal and informal caregivers, which varies over the course of the disease. As a population measure of the financial impact of myeloma on families, we estimated the disparity in pre-tax income between patients and the age/sex matched general population. This includes both earned income (including wages and salaries; business income; investments) and non-earned income (universal superannuation, ACC payments, welfare and other welfare benefits).
Income records are available for approximately 83% of the patient cohort and the general population. Therefore we adjusted the mean income in each age/sex group (except age 65+ years) downwards by assuming that missing records represent zero income. Income for patients from age 65 upwards was not adjusted because long term residents become eligible for the universal pension at their 65th birthday, and therefore mostly have an income. Outliers (defined as more than 3 standard deviations above the mean) were truncated to reduce bias, then low values (<20) of any parameter were suppressed and base 3 rounding was applied in accordance with Statistics NZ rules (see above). The same procedure was applied to income by patients and by the general population.
The disparity in income in 2016 was substantial and varied by age and sex, from about $4000 for older women to over $20,000 for middle aged men (table 41). This represents a significant loss to families.
Loss of income by caregivers is difficult to estimate because the relationship between patient and caregiver is not available on the IDI; and this estimate is beyond the scope of this study. Income lost by caregivers would add to the cost burden, as shown by stories in this report (Appendix C) but was not studied systematically. Based on other studies, most of the cost burden would be incurred within the first years after diagnosis or in the last six months before death from any cause.[90][84]
“At the time my husband and I owned a business. We had to sell the business at a huge financial impact which put us under enormous pressure in addition to finding out he was seriously ill.”
“I am in partnership with my own business which had to be closed for 5 months.”

June 2019
112
Table 41. Estimated mean annual pre-tax income from all sources, and disparity in income, in 2016 for myeloma patients compared to the age/sex matched general population.
Myeloma cohort mean income
Population mean income Disparity in mean income
Age group
Male Female Total Male Female Total Male Female Total
35-49 $47,489 $30,471 $40,556 $67,397 $44,915 $56,124 $19,909 $14,444 $15,568
50-54 $62,116 $37,279 $52,181 $68,595 $45,753 $57,721 $6,479 $8,474 $5,540
55-59 $44,713 $33,561 $40,996 $65,135 $43,254 $54,856 $20,423 $9,693 $13,860
60-64 $47,407 $25,276 $38,620 $57,345 $37,853 $48,256 $9,937 $12,577 $9,636
65+ $21,276 $20,203 $20,821 $28,066 $24,137 $26,880 $6,789 $3,934 $6,059
Overall $28,913 $22,809 $26,452 $46,601 $39,563 $41,079 $9,159 $6,022 $7,871
Individuals age less than 65 years with missing income records were assumed to have no declared taxable income. Individuals 65+ years of age (i.e. the majority) without income records were assumed to have universal superannuation but no other income.
For comparison, the estimated mean income distribution for the 2016 general population was similar to that in 2013 for males and females combined (Figure 34).
Figure 34. Median personal NZ income by age group for 2006 and 2013
Sourced from Statistics NZ 98
0
10000
20000
30000
40000
50000
15-19 20-24 25-29 30-34 35-39 40-44 45-49 50-54 55-59 60-64 65+
Inco
me
($)
Age (y)
2013 2016

The Burden of Multiple Myeloma in New Zealand
113
Loss of tax revenue
Because the mean annual income was lower for the myeloma patients than the age/sex matched general population, there will have been a disparity in income tax revenue. An adjustment to income was made for missing records (see above), then income tax was estimated for each patient and each individual in the age/sex matched general population, using IRS tax tables, and cumulated across all patients in each age/sex group. The total disparity between general population and patient cohort amounted to $3.32m and 70% of this was for men (Table 42). Although this is not a direct measure, it gives an indication of the potential loss by the Government of income tax revenue.
Table 42. Estimated disparity in income tax revenue by Government in 2016 ($m, 2016).
Myeloma patients’ income tax
General population income tax
Disparity in income tax
Age group
Male Female Total Male Female Total Male Female Total
35-49 $0.472 $0.155 $0.627 $0.710 $0.282 $0.992 -$0.238 -$0.127 -$0.365
50-54 $0.899 $0.267 $1.166 $0.964 $0.365 $1.329 -$0.065 -$0.098 -$0.163
55-59 $1.063 $0.332 $1.394 $1.634 $0.460 $2.095 -$0.572 -$0.129 -$0.700
60-64 $1.228 $0.315 $1.542 $1.504 $0.552 $2.056 -$0.276 -$0.238 -$0.514
65+ $2.255 $1.467 $3.722 $3.412 $1.883 $5.295 -$1.157 -$0.416 -$1.573
Total $5.916 $2.536 $8.452 $8.224 $3.543 $11.767 -$2.308 -$1.008 -$3.316
Individuals with missing records were assumed conservatively to earn no income and pay no income tax, except for individuals 65+ years of age (the majority), who were eligible for (taxable) universal superannuation. This will underestimate income tax.
Welfare benefits would amplify this cost to government but were not calculated because of incomplete records.
Overall costs
Our findings on the overall cost to government of myeloma in New Zealand are consistent with the findings of the BODE3 group (University of Otago, Wellington), which reported that in 2009, costs attributable to myeloma (in 2011 dollars) were, for example, $42,689 in the first year of diagnosis (for a woman aged 60-64) and $61,792 in the last year of life, but much lower during periods of

June 2019
114
remission. The BODE3 analysis did not include the cost of bortezomib and lenalidomide, because these therapies were funded more recently, and it did not include loss of income or tax revenue.
The BODE3 Programme estimated the total cost attributable to myeloma in 2010/11 at $24.8m (including primary care consultations) [99]. This is $26.3m in 2016 dollars. Given our estimate of $46.28m in 2016 (which excludes approximately $2.1m of primary care, imaging and lab costs), it appears that real (inflation adjusted) attributable costs for myeloma have increased substantially since 2011, probably partly because of the funding of novel therapies and also the increase in new diagnoses and diagnostic methods. The same study reported an average remaining lifetime cost after diagnosis of $80,000 per patient.
For comparison with our analysis population, BODE3 reported that costs in the first year following diagnosis ranged from $81,674 (in 2011 dollars) for the female 35–39 age group, to $22,868 for males aged 85–89. Costs per year for patients in remission were approximately $18,000 to $11,000 and for the final year of life $109,000 to $30,000.
Aside from the study by BODE3 and ours, we are aware of only one cross-sectional study of the healthcare cost of myeloma, based on a single clinical centre in Italy 100, from which we quote:
Data on 236 patients were analyzed (39 asymptomatic, 17%; 29 symptomatic receiving autologous stem-cell transplantation, 12%; 105 symptomatic receiving drugs, 44%; 63 plateau/remission, 27%). The total cost of illness reached 19,267.1 +/- 25,078.6 (asymptomatic, 959.3 +/- 1091.6; symptomatic receiving drugs, 21,707.8 +/- 21,785.3; symptomatic receiving autologous stem-cell transplantation, 59,243.7 +/- 24,214.0; plateau/remission, 8130.7 +/- 15,092.5). The main cost drivers of total cost of illness were drugs and hospital admissions (46.1% and 29.4%, respectively). Antineoplastics and immunomodulators drove the cost of drugs (21.6% and 21.1% of the total cost of illness). Cost of antineoplastics was led by bortezomib (97.4%), whereas the cost driver for immunomodulators was lenalidomide (99.4%). Cost of hospitalization funded by the Italian National Health Service was strongly influenced by transplantation (94.6%), whereas chemotherapy and skeletal fractures did not exceed 1% and 2%, respectively.
Like ours, this study included asymptomatic patients, presumably with smouldering myeloma. Like ours, this study also reported that the overall healthcare cost is driven by pharmaceuticals, largely bortezomib and lenalidomide, followed by hospital admissions for stem cell transplants. Our cross-sectional study for 2016 is much larger and uses national rather than local or regional data.
In addition to the above study, one multisite, international randomised clinical trial of 236 patients (92% of whom were described as ‘Caucasian’) with relapsed or refractory myeloma (RRMM), reported that 42% of patients had at least one hospitalisation. Only 11% of patients were working, and 48% of those who were not working indicated that it was due to RRMM 101. This study did not report on the financial circumstances of older patients who would have retired from the workforce for reasons other than myeloma.

The Burden of Multiple Myeloma in New Zealand
115
Samuel’s story 21 Years Visiting Riddiford St
The first indication of the cancer occurred while I was doing the Tongariro Crossing in 1997. I had some pain in my groin, which I convinced myself was
muscular. It occurred on and off over the following months, but I still believed I had pulled a muscle, or something similar.
It was not until I was referred by a physiotherapist to a sports medicine doctor that it was discovered I had a somewhat rare plasmacytoma on my pelvis, in effect a single myeloma tumour. Plasmacytomas can be killed stone dead by radiation and mine was blasted away over Christmas and New Year of 1997/1998.
So, at my 50th birthday in February I was able to tell the family I was cancer free – provided it had not metastasised. The radiologist had told me the chances were 50/50 - he was right, but I got the wrong 50! By November 1998 the myeloma was back.
My treatment - three types of chemotherapy over the following 12 months - was a failure. With the proportion of myeloma cells in my bone marrow rising to dangerous heights, the question arose as to whether I should have an autologous bone marrow transplant. The transplant was a huge success and I went into remission for almost 18 months.
It is from this point onwards that I think my myeloma story is most interesting. When I was diagnosed, I told my wife that if I could just hang on for a few years I was confident new treatments would come through. For reasons I cannot explain, I did not even remotely think that the cancer would kill me.
So far, I have been right. Through an extraordinary set of circumstances - too long and complex to explain here - the ugly old drug thalidomide had been shown to be effective first with leprosy, then with multiple myeloma. After causing severe deformities in 12,000 babies, the morning sickness drug was offering hope to myeloma patients around the world.
In my case, I was hyper-sensitive to it and the myeloma was under control for around 14 years. Over that time, I experienced virtually no side-effects, living a perfectly normal life … tramping, mountain biking, travelling overseas and enjoying an active cultural life here in Wellington.
It’s a cliché but fair to say that all good things do come to an end. In my case, that happened about two years ago. The myeloma was on the march again just as I was about to encounter two major health problems – an urgent need to replace a calcified aortic valve, followed some months later by two days on a life support machine then four weeks in hospital suffering from septicaemia.
Over this period, treatment for the myeloma had to be abandoned, resulting in its inextricable rise month after month.

June 2019
116
Fortunately, … and as I had hoped … new myeloma drugs have been developed over the past twenty years. I’m now on Velcade and dexamethasone, a combination which has suppressed the myeloma to almost non-detectible levels.
Of course, the future of any cancer is always uncertain, but I still believe it won’t kill me, not least because there are yet more new drugs on the horizon and one or another of them will do the trick! I must also pay tribute to the wonderful professionalism, care and compassion of the Wellington Blood and Cancer Centre team.
Names and identifiers have been changed.

The Burden of Multiple Myeloma in New Zealand
117

June 2019
118
VII CONCLUSIONS, OUTLOOK & RECOMMENDATIONS
Myeloma is a highly individual cancer, including how the disease progresses and responds to treatment. Getting the best possible outcome for each individual’s unique circumstances and reducing the overall burden of myeloma in New Zealand will require a unique approach.
This report recommends moves to hasten the public funding for proven innovations, remove existing restrictions on the available treatments and ultimately give blood cancer specialists the clinical choice to utilise their expertise and the proven treatments as the international evidence base indicates. This will become increasingly important as medical treatments become tailored to the individual characteristics of each patient based on genetic analysis (‘precision medicine’). The current focus on cost must be balanced with the high quality of the outcomes delivered by new biologic therapies in particular. It should be noted that no new myeloma treatments have been funded in New Zealand in the past five years.
Our study, taken together with the findings of the survey of patients, also leads us to draw a number of more detailed conclusions and reveals issues that warrant further investigation. These are set out below.
Epidemiology & clinical management
- Survival improved substantially for myeloma patients registered in 2012-2016 compared to earlier periods. The additional benefit was still evident when deaths from other causes were excluded from the analysis, giving confidence that the change in survival was due to improved management of myeloma, including ASCT, bortezomib and (probably) also lenalidomide.
- Patients who are 65 to 69 years of age at registration have relatively low uptake of ASCT. This also deserves further study, given the evidence on disease control conferred by ASCT. We note, for example, that in countries such as the US, ASCT is considered up to the age of 75, depending on individual fitness.
- Overall, 36% of patients who registered in 2012-2015 received neither bortezomib nor ASCT therapy in the period 2012-2016. Some of these will have had serious comorbidities and others will have had ‘smouldering myeloma’ which did not require treatment during the period of observation, but which would be treated when it became symptomatic. Other patients could have declined treatment because of limited first-line treatment options, or for logistical reasons such as limited access to infusion facilities, or for personal reasons.
- An important finding is that most patients receive a suboptimal (less than the funded) dose of bortezomib, which could be driven by disease progression (which is not recorded in the NZCR) or by toxicity. This suggests a need for different management strategies and/or more choice in first-line therapies. For selected patients, moving infusions or subcutaneous injections of bortezomib into primary care or the home setting would have the potential to improve persistence and avert the high cost of outpatient visits.

The Burden of Multiple Myeloma in New Zealand
119
- Socioeconomic deprivation and ethnicity is associated with lower uptake of ASCT following bortezomib and is also an independent prognostic factor for overall survival. These two observations suggest that poorer survival is associated with both poverty and poorer uptake of ASCT. These observations should be explored.
- Further research is needed to determine barriers to access. For example, could this relate to distance from treatment centres, and if so, what can be done about this? There is also the possibility that treatments can be delivered at peripheral regional sites.
- Although this was not studied directly, investment in training dedicated myeloma nurses in recent years is likely to have improved uptake of chemotherapy, adherence, and promptness of provision. An evaluation of their contribution in this regard would be useful, to determine whether and how further investment could build on these benefits.
Clinical data collection
- The Myeloma and Related Diseases Registry (MRDR) established at Monash University has to date collected information for about 3,000 patients from Australia and New Zealand. About six centres in New Zealand, including North Shore, Middlemore, Wellington and Christchurch, have enrolled. New Zealand data can be selectively isolated for analysis. This is an important resource for New Zealand clinicians and researchers, and it would be more valuable if more treatment centres enrolled. Information held in the MRDR could be used to supplement the NZCR, which contains little clinical data. While improving the quality of data collected by the NZCR remains a high priority, until such time as that is achieved clinicians and hospitals should be encouraged to enrol in the MRDR.
Costs
- Our analyses show that the annual healthcare cost per myeloma patient is substantially higher than that of the age/sex matched general population, especially for younger patients, and costs to the public healthcare system are likely to rise, given the rising incidence and prevalence of myeloma in New Zealand.
- Improved therapies could provide potential benefits in terms of savings to the government, such as earlier return to work and improved productivity by both patients and caregivers. Improvements in clinical management would also be expected to recover some of the taxation revenue that was lost by work absenteeism, withdrawal and early retirement.
- Cost savings could potentially be achieved by making more use of primary care where hospital follow-up has not been proven to detect additional recurrent disease. There could also be more allied health input, such as ensuring pharmacist review of all prescriptions in the management of myeloma or seeking to reduce variations in practice. Health care costs in the last year of life are very high, so it is important to evaluate whether the preferences and needs of patients near the end of life are being met in the most efficient way102. Palliative care is often underutilised and has lower associated costs than hospital care. To optimise the use of out-of-hospital palliative care, patients need to have accurate awareness of their prognosis, which allows informed resource use choices103.

June 2019
120
- As noted in our analysis, our costing of pharmaceuticals is based on list price (i.e. excluding confidential rebates) as we have no information on the specific rebates. Therefore, the total cost of pharmaceuticals will be overestimated to an unknown extent. The analyses of income and tax in this report are limited by the completeness and accuracy of the IDI. About 17% of income records for myeloma patients and the general population were missing. We estimate that substantial loss of personal income was incurred in 2016 by men and women with myeloma. The corresponding loss of income tax revenue by the government ($2.58m) is likely to be only a small fraction (5.5%) of the cost of medical care that can be attributed to myeloma ($46.28m).
Patient support
- A survey of patients and caregivers undertaken by Myeloma New Zealand in September 2018 (see multiplemyeloma.org.nz) sets out clearly the immense impact myeloma has on patients and their carers, both in everyday life and on their overall future
- Most patients experience fatigue on a daily basis, many are anxious and/or in pain every day, and many suffer from depression due to their illness. They have to come to terms with a shorter life expectancy and the reality of no known cure.
- Many describe heightened stress levels, falling self-esteem and confidence, personality changes, feeling out of control and a loss of ‘self’ and personal identity.
- Time taken to diagnose myeloma is a significant issue. While most myeloma patients were diagnosed relatively quickly, others had suffered years of misdiagnoses and potentially preventable, debilitating pain, and felt GPs and specialists are not nearly well enough informed about the disease.
- Going through a stem cell transplant was in many cases a harrowing experience for both patients and carers, although views were often coloured by whether or not the transplant was successful and the length of remission it provided. Continuing compromised immunity and the very long road to recovery were among the worst aspects of the treatment.
- The care and support of medical staff and their own family members, and being well prepared and fully informed were important factors in getting through the ordeal.
- The financial impact of a myeloma diagnosis is very significant. Over a quarter have had to leave full-time work. Employers were generally supportive of the need for employees to take time out, but those who had their own businesses or were self-employed were hard hit.
- Almost a quarter of patients/carers have missed over 200 days of work since their diagnosis, significantly affecting income and increasing stress levels.
- The average amount a patient or caregiver has spent annually in relation to myeloma is approximately $7,600 and the estimated average loss in income of a myeloma patient since their diagnosis is over $100,000.
- Most patients/carers are satisfied with the overall level of care, although fewer are happy with the quality of treatment available in New Zealand. Many want more information on research, treatments and clinical trials.

The Burden of Multiple Myeloma in New Zealand
121
- There is a great need for simpler, more comprehensible information about tests and treatment pathways, and more advice about what to expect as the disease progresses. Over half of patients or caregivers have at least some level of doubt about their understanding of their condition.
- Some patients felt they were rushed into treatment after diagnosis, before having time to fully understand what was going to happen and the likely side effects
- Many patients have tried alternative or complementary therapies, and many felt just ‘doing something’ helps, but others were unsure of any benefit. Some patients still just felt very lost, tired and in need of more support and advice.
- The majority of comments on what patients want concerned the need to advocate with government for funding new treatments. Improved myeloma therapies would ease the burden of the disease for patients, most importantly in improvements in quality of life and survival.
- More seminars around the country from experts on an array of subjects would be welcome. Topics should include latest international research, advances in treatment, the various phases of myeloma, training for carers, pain management, mental health issues, and the opportunity to meet and talk with other myeloma patients and carers.
Outlook: scanning the horizon for new management strategies
The management of myeloma is likely to undergo substantial changes in the coming years. In view of the recent advances in the field, three key principles have started to emerge that would be likely to shape the paradigm for the future management of myeloma: molecular profiling of the disease, testing for minimal residual disease (MRD) and targeted novel treatment combinations.
1. Molecular profiling
Molecular profiling refers to the analysis of DNA mutations found within myeloma cells. One of the most common reasons for doing such testing is for the purpose of prognostication, as certain mutations or genetic rearrangements are known to be associated with inferior outcomes. As noted earlier in this report, the current method that is commonly used in New Zealand is fluorescence in-situ hybridisation (FISH). Although this technique can detect common genetic rearrangements, it is unable to detect many of the new mutations that have recently been discovered. In addition, FISH testing can only evaluate one rearrangement at a time, making it a costly tool if a more extensive genomic analysis is required. For this reason, many researchers are now looking at the use of NGS for the purpose of molecular profiling. NGS can evaluate many hundreds of mutations and rearrangements simultaneously, and it is currently being developed internationally and locally. The cost of NGS has continued to reduce as the technique becomes more efficient, and it will probably be more economical than FISH when extensive genomic analysis is required. One may wonder why such a vast array of analysis is needed when treatment remains somewhat homogeneous at present; but as discussed below, such information is likely to help optimisation and prioritisation of treatment in the future.

June 2019
122
In addition to prognostication, advancement in NGS may also improve the ease of diagnosing myeloma. Currently, most patients require a bone marrow biopsy at the time of presentation, and maybe also at time of relapse, to confirm the diagnosis histologically and to obtain the needed samples for molecular profiling. However, there is now an emerging interest in the field of ‘liquid biopsy’, where circulating tumour DNA is isolated from the peripheral blood and analysed without the need for tissue or bone marrow biopsy. Although such technology remains somewhat immature at present for day-to-day clinical practice, once the technology has matured it can potentially replace the need for bone marrow biopsy when it is used in conjunction with other assessment tools, such as imaging.
Lastly, as mentioned above, molecular profiling would also allow us to better understand the pathophysiology of multiple myeloma and pave the way for a more targeted therapeutic approach in the future. This has already started happening with recent evidence of how one subtype of myeloma responds better to a targeted treatment than other myeloma subtypes (using the drug venetoclax in patients with t(11:14) translocation subtype). It is likely that with further expansion in our knowledge, we would be able to develop a more tailored and targeted treatment strategy for individual patients based on the information from NGS. On a population scale, transiting from the current treatment paradigm where the same treatment is given to everyone, to one where it is tailored to the disease biology, is likely to lead to better outcomes and (hopefully) more cost-effective management, as the costs of genetic testing comes down.
2. Testing for minimal residual disease (MRD)
The current evaluation of response to treatment, which is based on serological and histological assessment of the bone marrow, has been around for more than a decade. There is now growing evidence that such assessments are no longer sufficiently accurate for determining the success of treatment, as many of the novel treatment strategies are achieving a depth of response that is beyond the sensitivity of these tests. At such deep response, only a small number of residual cancer cells are present in the body, and this is now referred to as minimal residual disease (MRD). Currently, two techniques are available to detect MRD in the bone marrow where these residual cells typically reside: next generation flow cytometry and NGS. In addition, fluorodeoxyglucose positron emission tomography (F-FDG PET) can also be used to detect MRD outside the bone marrow.
MRD status has been shown to carry significant prognostic value. Patients who are MRD negative after treatment, even if they have high-risk disease, often experience a good long-term outcome compared to those who do not achieve MRD negativity. This raises the possibility of having a response-adapted treatment plan based on MRD results, where patients who are MRD negative after initial treatment can forgo further treatment. Meanwhile, patients who failed to achieve MRD negativity, or progressed from MRD negative to positive, can receive intensification or re-initiation of treatment, respectively. This concept is currently being tested in clinical studies across the world. If proven feasible, then such a strategy would be a very attractive and cost-effective option, as it would probably minimise unnecessary treatment and toxicities.

The Burden of Multiple Myeloma in New Zealand
123
3. Novel treatments and combinations
Gone are the days when the only treatment option for myeloma was conventional chemotherapy. Multiple new classes of medications have been developed over the last two decades for the treatment of myeloma, and studies have consistently demonstrated a superior outcome when they are given in combinations. Although the ideal treatment strategy for myeloma remains to be determined, it is doubtful that an outright winner will ever be crowned, due to the heterogeneity of the disease and the better treatments being developed constantly.
What is certain, however, is that the current arsenal we have in New Zealand for the management of multiple myeloma is lagging behind the rest of the world. The decision to fund bortezomib in April 2011 has been serving our patients well, with many achieving good long-term outcomes. However, New Zealand still has relatively limited treatment options in frontline, for maintenance, and in particular for relapsed disease, and unless further investment/funding is put in place we will see an increasing gap in patient outcomes between us and other OECD countries.
Combination treatment with proteasome inhibitors (PI) and immunomodulatory medication (IMiD) is likely to become the standard of care in the frontline setting. With these new combinations, we could question the role of autologous stem cell transplant (ASCT) as a consolidation treatment for those who are eligible, although it is likely that ASCT will remain an important tool in the next decade because of its cost-effectiveness relative to combinations of novel pharmaceuticals. This concept of using a PI-IMiD combination will also apply to those with relapsed disease.
Meanwhile, other new classes of medication, such as monoclonal antibodies, have shown some very promising results, and one would expect these newer classes of medication to be used more heavily and earlier in the course of the disease. As newer treatments become more effective and better tolerated, the current standard of triplet therapy will probably be replaced by quadruplet regimens in the next five to ten years as data from clinical studies mature.
In recent years, the idea of immunotherapy, where one’s immune system is manipulated to enhance tumour killing, has been gaining momentum. One of the most promising strategies is the use of chimeric antigen receptor (CAR) T cells, where the patient’s own T-lymphocytes (immune cells) are harvested and modified to target a specific tumour cell type. Such cells would ideally remain within the patient over a long period of time and will provide long-term protection against the disease as a ‘living drug’. Following the recent success in the use of such therapy in acute lymphoblastic leukaemia and aggressive lymphomas, such technology is now being tested in myeloma as well, with promising results. In addition to CAR-T therapy, other forms of immunotherapy such as bispecific antibodies are also in development, with the aim of harvesting the power of the patient’s immune system to achieve disease control.
An overall transformation in myeloma treatment
In addition to the three pivotal points outlined above, the management of myeloma has moved from giving just a finite duration of therapy to continuous treatment. Although this requires a shift in the mind-set for many patients and clinicians, this is actually no different from the management of other non-malignant diseases, such as diabetes and cardiovascular risk management, where treatment is often continuous.

June 2019
124
Many other aspects of the management of myeloma have already undergone significant changes in recent years. For example, whole body magnetic resonance imaging (MRI) is now used as part of the diagnostic work-up instead of skeletal survey with x-ray, and more potent bisphosphonates are now available to reduce the risk of fractures.
Together, these developments are likely to transform the treatment of myeloma in the coming years. While we are still some way away from curing this disease, it is possible to foresee treating myeloma as a chronic disease rather than a fatal disease in the not-too-distant future.
Clinicians and patients are rightly encouraged by these developments, and as a nation we need to embrace them. With a raft of novel myeloma treatments already registered abroad, and others in late stages of development, our policymakers need to ensure New Zealanders living with myeloma receive treatment in line with international best practice. Reducing the burden of this devastating disease is both essential and achievable.
Recommendations
1. Systems for collaboration, data collection and benchmarking to ensure equitable quality of care
Systems should be put in place to allow easy collaboration and comparison of outcomes between centres as a benchmark for ensuring quality of care. The current New Zealand Cancer Registry has provided much of the needed baseline data for comparison, but it lacks important clinical information. The NZCR should be improved to allow better and more accurate data capture, to make it a more useful tool for ongoing comparison and monitoring of outcome. For example, it would be helpful if the NZCR could provide the date of initial treatment as a marker for the start of myeloma, to assist in avoiding misclassification of patients who are asymptomatic. By developing the NZCR into a more robust database, the government will also have a better understanding of the incidence prevalence, trend, and survival outcome of the disease, allowing better investment decision making.
In addition, or at least until such time as the NZCR has been made more robust, clinicians should be resourced to participate in the Monash registry.
2. Efficient delivery of medications
As the cost of medicine is the single biggest cost to the public healthcare system for patients with myeloma, it is important to ensure that medication is delivered efficiently so that the patient receives the full benefit of the treatment. For example, patients may find it difficult to attend the weekly outpatient visit to receive bortezomib, and as a result may have an interrupted course and not receive the full funded treatment. Initiatives such as district nurse administration, partnering with local general practice and providing equipment for patient self-administering at home would likely help in these solutions. Moving infusions into primary care or the home setting could also reduce the cost of outpatient visits. Use of oral agents would also facilitate compliance and delivery.

The Burden of Multiple Myeloma in New Zealand
125
3. Facilitating access to compassionate-use programmes
Although many of the medications available elsewhere in the world are not currently Pharmac funded in New Zealand, some are available to our patients via compassionate-use programmes set up by pharmaceutical companies. This fulfils some of the unmet need of patients with myeloma, but some centres are unable to make full use of these programmes due to lack of hospital staff for administration.
For example, carfilzomib, an FDA-approved second-generation proteasome inhibitor that is given intravenously, is currently available free-of-charge to New Zealand patients under the compassionate-use programme (due to cease mid 2019). However, as the treatment requires an intravenous infusion six times a month, some centres are reluctant to offer it to patients because of lack of infusion chair time and nursing staff. Resolving these capacity issues is likely to lead to better treatment options for the patients at a fraction of the cost.
4. Investment in more effective first-line treatments
As the duration of remission is likely to be the longest during first remission and second remission, investment into better access of novel therapeutic agents in earlier lines of treatment is most likely to lead to better quality of life and less time off work, delay the need for residential care, and improve life-expectancy.
5. Supporting and facilitating the conducting of clinical trials in New Zealand
Another way to improve access to medicine for patients is to work collaboratively with pharmaceutical companies in the formatting and conducting of clinical trials. New Zealand is well positioned for conducting clinical trials due to our small geographic size with relatively dense population in major centres, high quality clinicians and first-world healthcare systems. These are all attractive attributes for conducting clinical trials, and in return the patients obtain access to medication that is otherwise not available in New Zealand for years to come. Ensuring that all eligible patients are offered participation in clinical trials may also lead to better clinical data on effectiveness [5]. It is also important to ensure there is uniform, equitable access to trials across New Zealand, and this may involve assistance with travel costs.
6. Improving support , information and advocacy for patients
Patients and carers need better preparation and support throughout the treatment process, particularly when undergoing difficult procedures such as ASCT. This includes access to counselling and mental health support, ways to connect with other patients and support groups, and training for caregivers, particularly in coping with patients’ depression and mental health issues.
They also need more, better information, presented in a way that is easy to understand, and at the right time. They want information including seminars and expert talks about: the disease and its many treatments; survival rates; new treatments; clinical trials and research; and compassionate access programmes.

June 2019
126
Patients want Myeloma NZ and other related patient groups to actively advocate to government to fund new treatments and facilitate the opening of more clinical trials and access programmes.
They also see better education of GPs and medical professionals to improve understanding of myeloma as critical. Upskilling doctors at the frontline should lead to earlier tests and earlier diagnoses.
Patients and carers would also like to see greater public understanding and awareness of myeloma.
7. Investing in research and facilitating collaboration among centres engaged in research
Great work is being done in local hospitals and universities, but this is often done in isolation without additional funding or support from the government. Direct investment into these stakeholders and facilitation of collaboration between centres would allow streamlining of research and reduce overlap.
8. Introducing performance-based risk management and cost-effectiveness analyses
The 10-fold increase in cost of oncology medicines over 10 years is rapidly becoming a serious threat to patients and health systems [6]. In addition to ongoing price negotiations, performance-based risk management of pharmaceuticals could be introduced. It might also be possible to divest from some treatments with minimal real-world benefits across the disease spectrum in order to focus on those medicines with larger proven gains. Ongoing improvements in patient selection, and increasing use of generics, are likely to be important in the future [6].
9. Research funding for New Zealand-specific economic evaluation of therapies to treat myeloma
This should include ASCT, novel pharmacotherapies and cancer care management [7] using real world evidence as distinct from clinical trials. There is also a need for methodologically comparable studies across all major cancers, especially those that are particularly costly and/or have high prevalence.
10. Further research based on the findings of this report
The following issues identified in this study require further investigation:
- Small but meaningful differences in survival for patients living in different cancer regions: further study could identify the cause for these differences, and facilitate best management practice in all regions
- The large proportion (36%) of patients who registered in 2012-2015 who received neither bortezomib nor ASCT therapy in the period 2012-2016: potential reasons for this finding are outlined above, but the issue is significant and worthy of further investigation
- The association of poorer survival both with poverty and poorer uptake of ASCT

The Burden of Multiple Myeloma in New Zealand
127
- The finding that most patients receive a suboptimal (less than the funded) dose of bortezomib
- Barriers to access, such as distance from treatment centres and availability of chairs in day wards
- The relatively low uptake of ASCT by patients who are 65 to 69 years of age at registration.

June 2019
128
Robert’s story I was diagnosed with IgG Multiple Myeloma in March 2009 at the age of 46 years 8 months. Initial diagnosis was via my GP who took a blood test because I had a summer cold that wouldn’t clear. Two days later I was in Auckland Hospital. My haematologist wanted me to start chemotherapy the following day, but when
I asked him about having children, he delayed treatment so that sperm could be captured prior to treatment. This put us on the expensive path of IVF, and three cycles later we were pregnant and had a son in March 2011. At that point in time I was working for a large infrastructure company as a Performance Excellence Advisor.
After induction treatment I underwent an Autologous Stem Cell Transplant at the end of July 2009. I was told that this had an impact on the body like open heart surgery, and not to expect to return to work for 13 plus weeks. Unfortunately, I had a job to consider and so pushed my recovery with a return in 6 weeks. Fortunately, none of my employers wanted me to reimburse the company for the time off. A case of “there but for the grace of God go I”. In January 2012 I was made redundant and until June 2015 was only able to get employment in short term contracts, mostly with organisations I already had relationships with. During this period, I was constantly seeking full time employment, but most online applications required statements about health and (despite being informed by the Human Rights Commission that this was only required when discussing employment contract terms) it is impossible to bypass these questions. In some ways this was somewhat of a godsend as I was participating in the Endeavour trial which required attendance at a clinic at least 3 days per week, although the side effects were minimal.
Eventually in June 2015 I was employed by a Not for Profit agency, firstly as a contractor, then 0.8 FTE, then as General Manager (0.8 FTE followed by 0.6FTE) and currently as a contractor doing the jobs of the GM. This unusual set of circumstances surrounding my employment is to show what people in my position are prepared to put up with to stay in some form of employment. This is particularly pertinent, considering that I have at least 10 years until retirement and need to ensure that my family and I are in a position financially that allows me to retire. I was told when diagnosed that most people diagnosed with myeloma are 65 or over. This means they have a totally different perspective on life. Up until mid-2016 I had not experienced the cancer itself, but more the side effects of chemotherapy.
In about August 2016, three events seemed to coincide: the treatments stopped working, the next option meant a referral to North Shore Hospital, and my address changed to Titirangi which changed my hospital from Auckland to North Shore. This change means a further 30 minutes’ drive over what it would take me to drive to Auckland hospital. In addition, depending on the time of appointments, I cannot guarantee making them on time In Auckland’s rush hour traffic. Currently I find myself after 10 years of treatment at a point where despite the continued efficacy of the chemo prescribed, my body is becoming less tolerant and resilient to them. Regrettably this is coinciding with a requirement to seek new employment, but not knowing what to tell a prospective employer about my health status.

The Burden of Multiple Myeloma in New Zealand
129
Being at this point on the cancer continuum, i.e. the survivorship stage, I have found several omissions in people’s perspectives on cancer. Firstly, there is a belief that if you are not on chemotherapy, are possibly in remission and look OK, then there is nothing wrong with you. This is a fallacy, as there is a likely degenerative effect of all drugs taken. Secondly, survivorship is a very personal perspective of the patient and his or her context, and as such is difficult for support agencies to deal with because there is no silver bullet for all patients. This is probably why Diagnosis, Treatment, Palliative Care, and Education have all been put on a path of continuous improvement, but survivorship has been ignored.
Names and identifiers have been changed.

June 2019
130
REFERENCES
1. Sneyd, M.J., B. Cox, and I.M. Morison, Trends in myeloma incidence, mortality and survival in New Zealand (1985-2016). Cancer Epidemiology, 2019. 60: p. 55-59.
2. Hock, B.D., et al., Impact of increased access to novel agents on the survival of multiple myeloma patients treated at a single New Zealand centre. Internal Medicine Journal, 2018. 08: p. 08.
3. Myeloma UK, High-dose therapy and autologuous stem cell transplantation, M. UK, Editor. 2017: www.myeloma.org.uk.
4. Multiple Myeloma Research Foundation. About Multiple Myeloma. 2018 3 September 2018]; Available from: https://themmrf.org/multiple-myeloma/.
5. Carey, M., et al., Access to clinical trials among oncology patients: results of a cross sectional survey. BMC Cancer, 2017. 17(1): p. 653.
6. Ma, C.K.K., et al., Dealing with the spiralling price of medicines: issues and solutions. Internal Medicine Journal, 2018. 48(1): p. 16-24.
7. Blakely, T., et al., Cancer care coordinators in stage III colon cancer: a cost-utility analysis. BMC Health Serv Res, 2015. 15: p. 306.
8. Kumar, S.K., et al., Natural history of relapsed myeloma, refractory to immunomodulatory drugs and proteasome inhibitors: a multicenter IMWG study. Leukemia, 2017.
9. Myeloma Australia. What is myeloma? 2017 20 August 2018]; Available from: http://myeloma.org.au.
10. Mateos, M.V. and J.F. San Miguel, Management of multiple myeloma in the newly diagnosed patient. Hematology Am Soc Hematol Educ Program, 2017. 2017(1): p. 498-507.
11. Pharmac. Medicines for rare disorders. 2014; Available from: https://www.pharmac.govt.nz/medicines/how-medicines-are-funded/medicines-for-rare-disorders/.
12. Cowan, A.J., et al., Global Burden of Multiple Myeloma: A Systematic Analysis for the Global Burden of Disease Study 2016. JAMA Oncol, 2018.
13. National Cancer Instittue Surveillane, E.a.E.R.P.S., Cancer Stat Facts: Myeloma. 2018.
14. Blimark, C.H., et al., Outcome and survival of myeloma patients diagnosed 2008-2015. Real-world data on 4904 patients from the Swedish Myeloma Registry. Haematologica, 2018. 103(3): p. 506-513.
15. Dimopoulos, M.A., et al., Daratumumab, Lenalidomide, and Dexamethasone for Multiple Myeloma. N Engl J Med, 2016. 375(14): p. 1319-1331.
16. Palumbo, A., et al., Daratumumab, Bortezomib, and Dexamethasone for Multiple Myeloma. N Engl J Med, 2016. 375(8): p. 754-66.
17. American Cancer Society. Multiple myeloma: causes, risk factors, and prevention. 2018 [cited 2018 6 November 2018]; Available from: https://www.cancer.org/cancer/multiple-myeloma/causes-risks-prevention/risk-factors.html.
18. Leukaemia & Blood Cancer New Zealand. Myeloma. 2015 20 August 2018]; Available from: https://www.leukaemia.org.nz/information/about-blood-cancers/myeloma/.

The Burden of Multiple Myeloma in New Zealand
131
19. Myeloma UK. Understanding myeloma. 2018 21 August 2018]; Available from: https://www.myeloma.org.uk/understanding-myeloma/.
20. Joseph, N.S., et al., High-risk Multiple Myeloma: Definition and Management. Clin Lymphoma Myeloma Leuk, 2017. 17S: p. S80-S87.
21. Lonial, S., L.H. Boise, and J. Kaufman, How I treat high-risk myeloma. Blood, 2015. 126(13): p. 1536-43.
22. Terpos, E. and M.A. Dimopoulos, Myeloma bone disease: pathophysiology and management. Ann Oncol, 2005. 16(8): p. 1223-31.
23. Oyajobi, B.O., Multiple myeloma/hypercalcemia. Arthritis Res Ther, 2007. 9 Suppl 1: p. S4.
24. Kyle, R.A., et al., Review of 1027 patients with newly diagnosed multiple myeloma. Mayo Clin Proc, 2003. 78(1): p. 21-33.
25. Bird, J.M., et al., Guidelines for the diagnosis and management of multiple myeloma 2011. Br J Haematol, 2011. 154(1): p. 32-75.
26. Knudsen, L.M., et al., Renal function in newly diagnosed multiple myeloma--a demographic study of 1353 patients. The Nordic Myeloma Study Group. Eur J Haematol, 1994. 53(4): p. 207-12.
27. Eleutherakis-Papaiakovou, V., et al., Renal failure in multiple myeloma: incidence, correlations, and prognostic significance. Leuk Lymphoma, 2007. 48(2): p. 337-41.
28. Kyle, R.A., Multiple myeloma: review of 869 cases. Mayo Clin Proc, 1975. 50(1): p. 29-40.
29. Fonseca, R. and J. Monge, Myeloma: classification and risk assessment. Semin Oncol, 2013. 40(5): p. 554-66.
30. Ludwig, H., G. Pohl, and A. Osterborg, Anemia in multiple myeloma. Clin Adv Hematol Oncol, 2004. 2(4): p. 233-41.
31. Eslick, R. and D. Talaulikar, Multiple myeloma: from diagnosis to treatment. Aust Fam Physician, 2013. 42(10): p. 684-8.
32. Melton, L.J., 3rd, et al., Fracture risk with multiple myeloma: a population-based study. J Bone Miner Res, 2005. 20(3): p. 487-93.
33. Greipp, P.R., et al., International staging system for multiple myeloma. J Clin Oncol, 2005. 23(15): p. 3412-20.
34. Moreau, P., et al., Multiple myeloma: ESMO Clinical Practice Guidelines for diagnosis, treatment and follow-up. Ann Oncol, 2017.
35. Terpos, E., et al., High serum lactate dehydrogenase adds prognostic value to the international myeloma staging system even in the era of novel agents. Eur J Haematol, 2010. 85(2): p. 114-9.
36. Fonseca, R., et al., International Myeloma Working Group molecular classification of multiple myeloma: spotlight review. Leukemia, 2009. 23(12): p. 2210-21.
37. Kyle, R.A., et al., Clinical course and prognosis of smoldering (asymptomatic) multiple myeloma. N Engl J Med, 2007. 356(25): p. 2582-90.
38. Carvalho, J. Some with Smoldering Multiple Myeloma May Benefit from Immediate Treatment, Study Suggests. 2018 27 September 2018]; Available from: https://myelomaresearchnews.com/2018/09/10/genetic-alterations-underlie-the-progression-of-smm-to-myeloma/.

June 2019
132
39. Palumbo, A., et al., International Myeloma Working Group consensus statement for the management, treatment, and supportive care of patients with myeloma not eligible for standard autologous stem-cell transplantation. J Clin Oncol, 2014. 32(6): p. 587-600.
40. Allart, P., P. Soubeyran, and F. Cousson-Gelie, Are psychosocial factors associated with quality of life in patients with haematological cancer? A critical review of the literature. Psychooncology, 2013. 22(2): p. 241-9.
41. Allart-Vorelli, P., et al., Haematological cancer and quality of life: a systematic literature review. Blood Cancer J, 2015. 5: p. e305.
42. Sherman, A.C., et al., Psychosocial adjustment and quality of life among multiple myeloma patients undergoing evaluation for autologous stem cell transplantation. Bone Marrow Transplant, 2004. 33(9): p. 955-62.
43. Lobb, E.A., et al., When the safety net of treatment has been removed: patients' unmet needs at the completion of treatment for haematological malignancies. Patient Educ Couns, 2009. 77(1): p. 103-8.
44. Oberoi, D.V., et al., Distress and unmet needs during treatment and quality of life in early cancer survivorship: A longitudinal study of haematological cancer patients. Eur J Haematol, 2017. 99(5): p. 423-430.
45. Molassiotis, A., et al., Unmet supportive care needs, psychological well-being and quality of life in patients living with multiple myeloma and their partners. Psychooncology, 2011. 20(1): p. 88-97.
46. Kumar, S., et al., International Myeloma Working Group consensus criteria for response and minimal residual disease assessment in multiple myeloma. Lancet Oncol, 2016. 17(8): p. e328-46.
47. Beksac, M., et al., Addition of thalidomide to oral melphalan/prednisone in patients with multiple myeloma not eligible for transplantation: results of a randomized trial from the Turkish Myeloma Study Group. Eur J Haematol, 2011. 86(1): p. 16-22.
48. Benboubker, L., et al., Lenalidomide and dexamethasone in transplant-ineligible patients with myeloma. N Engl J Med, 2014. 371(10): p. 906-17.
49. Hulin, C., et al., Efficacy of melphalan and prednisone plus thalidomide in patients older than 75 years with newly diagnosed multiple myeloma: IFM 01/01 trial. J Clin Oncol, 2009. 27(22): p. 3664-70.
50. San Miguel, J.F., et al., Bortezomib plus melphalan and prednisone for initial treatment of multiple myeloma. N Engl J Med, 2008. 359(9): p. 906-17.
51. Waage, A., et al., Melphalan and prednisone plus thalidomide or placebo in elderly patients with multiple myeloma. Blood, 2010. 116(9): p. 1405-12.
52. Kumar, S., et al., Randomized, multicenter, phase 2 study (EVOLUTION) of combinations of bortezomib, dexamethasone, cyclophosphamide, and lenalidomide in previously untreated multiple myeloma. Blood, 2012. 119(19): p. 4375-82.
53. Bensinger, W.I., et al., Phase 2 study of two sequential three-drug combinations containing bortezomib, cyclophosphamide and dexamethasone, followed by bortezomib, thalidomide and dexamethasone as frontline therapy for multiple myeloma. Br J Haematol, 2010. 148(4): p. 562-8.
54. Reeder, C.B., et al., Cyclophosphamide, bortezomib and dexamethasone induction for newly diagnosed multiple myeloma: high response rates in a phase II clinical trial. Leukemia, 2009. 23(7): p. 1337-41.
The Burden of Multiple Myeloma in New Zealand
133
55. Moreau, P., et al., Bortezomib plus dexamethasone versus reduced-dose bortezomib, thalidomide plus dexamethasone as induction treatment before autologous stem cell transplantation in newly diagnosed multiple myeloma. Blood, 2011. 118(22): p. 5752-8; quiz 5982.
56. Rosinol, L., et al., Superiority of bortezomib, thalidomide, and dexamethasone (VTD) as induction pretransplantation therapy in multiple myeloma: a randomized phase 3 PETHEMA/GEM study. Blood, 2012. 120(8): p. 1589-96.
57. Cavo, M., et al., Bortezomib with thalidomide plus dexamethasone compared with thalidomide plus dexamethasone as induction therapy before, and consolidation therapy after, double autologous stem-cell transplantation in newly diagnosed multiple myeloma: a randomised phase 3 study. Lancet, 2010. 376(9758): p. 2075-85.
58. Korde, N., et al., Treatment With Carfilzomib-Lenalidomide-Dexamethasone With Lenalidomide Extension in Patients With Smoldering or Newly Diagnosed Multiple Myeloma. JAMA Oncol, 2015. 1(6): p. 746-54.
59. Laubach, J., et al., Management of relapsed multiple myeloma: recommendations of the International Myeloma Working Group. Leukemia, 2016. 30(5): p. 1005-17.
60. Lopuch, S., P. Kawalec, and N. Wisniewska, Effectiveness of targeted therapy as monotherapy or combined therapy in patients with relapsed or refractory multiple myeloma: a systematic review and meta-analysis. Hematology, 2015. 20(1): p. 1-10.
61. Nooka, A.K., et al., Treatment options for relapsed and refractory multiple myeloma. Blood, 2015. 125(20): p. 3085-99.
62. Stewart, A.K., et al., Carfilzomib, lenalidomide, and dexamethasone for relapsed multiple myeloma. N Engl J Med, 2015. 372(2): p. 142-52.
63. San-Miguel, J.F., et al., Panobinostat plus bortezomib and dexamethasone versus placebo plus bortezomib and dexamethasone in patients with relapsed or relapsed and refractory multiple myeloma: a multicentre, randomised, double-blind phase 3 trial. Lancet Oncol, 2014. 15(11): p. 1195-206.
64. Dimopoulos, M.A., et al., Carfilzomib and dexamethasone versus bortezomib and dexamethasone for patients with relapsed or refractory multiple myeloma (ENDEAVOR): a randomised, phase 3, open-label, multicentre study. Lancet Oncol, 2016. 17(1): p. 27-38.
65. Lonial, S., et al., Elotuzumab Therapy for Relapsed or Refractory Multiple Myeloma. N Engl J Med, 2015. 373(7): p. 621-31.
66. Moreau, P., et al., Oral Ixazomib, Lenalidomide, and Dexamethasone for Multiple Myeloma. N Engl J Med, 2016. 374(17): p. 1621-34.
67. PHARMAC, VELCADE (bortezomib) Special Authority. 2017.
68. PHARMAC, Lenalidomide Special Authority. 2017.
69. Data sourced from Celgene Pty Ltd 16th Oct 2018 2018.
70. Ministry of Health. Palliative Care. 2016 24 August 2018]; Available from: https://www.health.govt.nz/your-health/services-and-support/health-care-services/palliative-care.
71. Bergin, K., et al., Design and development of the Australian and New Zealand (ANZ) myeloma and related diseases registry. BMC Med Res Methodol, 2016. 16(1): p. 151.
72. Seneviratne, S., et al., Accuracy and completeness of the New Zealand Cancer Registry for staging of invasive breast cancer. Cancer Epidemiol, 2014. 38(5): p. 638-44.
June 2019
134
73. James, V. and C. Fowler, A response to: Characteristics of lung cancers and accuracy and completeness of registration in the New Zealand Cancer Registry. N Z Med J, 2018. 131(1479): p. 93-94.
74. Cunningham, R., et al., An audit of colon cancer data on the New Zealand Cancer Registry. N Z Med J, 2008. 121(1279): p. 46-56.
75. Ministry of Health. Regional cancer networks. Ministry of Health 2018 4 April 2018 27 September 2018]; Available from: https://www.health.govt.nz/our-work/diseases-and-conditions/national-cancer-programme/cancer-initiatives/regional-cancer-networks.
76. Aye, P.S., J.M. Elwood, and V. Stevanovic, Comparison of cancer survival in New Zealand and Australia, 2006-2010. N Z Med J, 2014. 127(1407): p. 14-26.
77. Australian Institute of Health and Welfare, Cancer in Australia 2017, in Cancer series no. 101. 2017, AIHW: Canberra.
78. Canadian Cancer Society's Advisory Committee on Cancer Statistics, Canadian Cancer Statistics 2017. Toronto, ON: Canadian Cancer Society,. 2017.
79. Cancer Research UK. Myeloma statistics. 2018 27 September 2018]; Available from: https://www.cancerresearchuk.org/health-professional/cancer-statistics/statistics-by-cancer-type/myeloma.
80. Daley, C. Body shape and dieting - average heights and weights. 2013 [cited 2018 6 November 2018]; Available from: https://teara.govt.nz/en/body-shape-and-dieting/page-1].
81. O'Donnell, E.K. and N.S. Raje, Myeloma bone disease: pathogenesis and treatment. Clin Adv Hematol Oncol, 2017. 15(4): p. 285-295.
82. Hauksdottir, B., et al., Patients' Experiences With Multiple Myeloma: A Meta-Aggregation of Qualitative Studies. Oncol Nurs Forum, 2017. 44(2): p. E64-e81.
83. Nielsen, L.K., et al., A systematic review of health-related quality of life in longitudinal studies of myeloma patients. Eur J Haematol, 2017. 99(1): p. 3-17.
84. Blakely, T., et al., Updated New Zealand health system cost estimates from health events by sex, age and proximity to death: further improvements in the age of 'big data'. N Z Med J, 2015. 128(1422): p. 13-23.
85. Mariotto, A.B., et al., Projections of the cost of cancer care in the United States: 2010-2020. J Natl Cancer Inst, 2011. 103(2): p. 117-28.
86. Stats NZ.Tatauranga Aotearoa. Intergrated Data Infrastructure. 2018 2 July 2018 27 September 2018]; Available from: https://www.stats.govt.nz/integrated-data/integrated-data-infrastructure/.
87. James Harris PHARMAC, personal communication. 2018.
88. PHARMAC, Pharmaceutical Management Agency Annual Report for the year ended 30 June 2016,. 2016.
89. Foster, R., N. Preval, and e. al., Costing of pharmaceuticals in New Zealand for health economic studies: Backgrounder and protocol for costing. 2011.
90. Blakely, T., et al., Health system costs by sex, age and proximity to death, and implications for estimation of future expenditure. N Z Med J, 2014. 127(1393): p. 12-25.
91. Aotearoa, S.N.T. Measuring government sector productivity in New Zealand: a feasibility study. Available from:

The Burden of Multiple Myeloma in New Zealand
135
http://archive.stats.govt.nz/browse_for_stats/economic_indicators/productivity/measuring-govt-productivity/8-data-availability-health-care.aspx.
92. PHARMAC. Cost resource manual: Version 3 - October 2018. 2018; Available from: https://www.pharmac.govt.nz/medicines/how-medicines-are-funded/economic-analysis/cost-resource-manual/.
93. ADHB. Auckland District Health Board - Adult Health Services Charges for Patients not Eligible for Publicly Funded Health Services. 2015 [cited 2018 Sept 24]; Available from: http://adhb.govt.nz/eligibility/Documents/Non_Res_Price_List_Jan_15_Adult.pdf
94. Ministry of Health, The Price of Cancer: The public price of registered cancer in New Zealand. 2011, NZ Ministry of Health Wellington.
95. River Radiology. River Radiology Price List 2018. 2018 [cited 2018 Sept 24]; Available from: http://www.riverradiology.co.nz/diagnostic-solutions/price-list/.
96. Wellington Regional Genetics Laboratory. Fluorescence in situ hybridisation (FISH). 2018 [cited 2018 Sept 24]; Available from: http://www.wellingtongenetics.co.nz/shop/Cytogenetic+Test+List/FISH.html
97. Dixon, S., The employment and income effects of eight chronic and acute health conditions (WP 15/15), T. Treasury, Editor. 2015: Treasury.govt.nz.
98. Aotearoa, S.N.T. 2013 Census QuickStats about income. [cited 2018; Available from: http://archive.stats.govt.nz/Census/2013-census/profile-and-summary-reports/quickstats-income/personal-income-age.aspx.
99. BODE3. Rapid Cost-Effectiveness Calculator - Version 2. [cited 2018 Sept 24]; Available from: https://www.otago.ac.nz/wellington/departments/publichealth/research/bode3/otago076415.html
100. Petrucci, M.T., et al., Cost of illness in patients with multiple myeloma in Italy: the CoMiM study. Tumori, 2013. 99(4): p. e193-202.
101. Robinson, D., Jr., et al., Economic burden of relapsed or refractory multiple myeloma: Results from an international trial. Eur J Haematol, 2017.
102. Reeve, R., et al., Health care use and costs at the end of life: a comparison of elderly Australian decedents with and without a cancer history. BMC Palliat Care, 2017. 17(1): p. 1.
103. Chen, C.H., S.C. Kuo, and S.T. Tang, Current status of accurate prognostic awareness in advanced/terminally ill cancer patients: Systematic review and meta-regression analysis. Palliative Medicine, 2017. 31(5): p. 406-418.

© Myeloma New Zealand 2019Published by Myeloma New Zealand
Registered Charity No. CC53924PO Box 25162
Wellington 6011New Zealand
www.multiplemyeloma.org.nz
ISBN: 978-0-473-48520-7 - printISBN: 978-0-473-48521-4 - online/PDF