the burden of asthma in indiana · pdf file · 2013-02-04department of pediatrics...
TRANSCRIPT


Updated 12/30/2004 Indiana Joint Asthma Coalition
2
The Indiana State Department of Health and Indiana Department of Environmental Management thank the members of the Data and Surveillance Workgroup of the Indiana Joint Asthma Coalition (InJAC) for their dedication in directing this effort and other contributors for their commitment. Without their volunteered time and energy, none of this would be possible. The Indiana Joint Asthma Coalition thanks Elizabeth Hamilton-Byrd, medical epidemiologist, Epidemiology Resource Center, Indiana State Department of Health, for providing mortality data and Linda Stemnock, Epidemiology Resource Center for assistance with BRFSS data interpretation. The Indiana Joint Asthma Coalition thanks Cindy Woodruff, epidemiologist, Indiana Asthma Program for the many hours of detailed work she put into researching and assembling data for this report. This publication was supported by Cooperative Agreement # U59/CCU52080-02 from the Centers for Disease Control and Prevention (CDC). Its contents are solely the responsibility of the authors and do not necessarily represent the official views of the Centers for Disease Control and Prevention. InJAC Data and Surveillance Workgroup Chair: Stephen M. Downs, MD, MS Director, Indiana Children’s Health Services Research Department of Pediatrics Indiana University School of Medicine Workgroup Members Joel Conner Data Section Maternal and Child Health Indiana State Department of Health Mat Delillo Office of Medicaid Policy and Planning Indiana Family and Social Services Administration Elizabeth Hamilton-Byrd, MD Medical Epidemiologist Epidemiology Resource Center Indiana State Department of Health

Updated 12/30/2004 Indiana Joint Asthma Coalition
3
Robert G. Lehnen, PhD Professor, Public and Environmental Affairs Indiana University-Purdue University Indianapolis Jon E. Lewis, PhD Director, Data Analysis Epidemiology Resource Center Indiana State Department of Health Sarah Raymond Environmental Scientist Indiana Department of Environmental Management Marc Rosenman, MD Assistant Professor Department of Pediatrics Indiana University School of Medicine Linda Stemnock, BS BRFSS Coordinator Epidemiology Resource Center Indiana State Department of Health Bernice Ulrich, RHIA Vice President, Indiana Hospital&Health Association Lisa Winternheimer Indiana Primary Health Care Association Cynthia Schamel Woodruff Epidemiologist, Asthma Control Program Indiana State Department of Health Additional Contributors: Frederick Leickly, MD Clinical Associate Professor of Pediatrics Department of Pediatrics Indiana University School of Medicine Judith Ganser, MD, MPH Director, Maternal and Child Health Indiana State Department of Health

Updated 12/30/2004 Indiana Joint Asthma Coalition
4
Table of Contents Executive Summary ...................................................................................................... 8
The Burden of Asthma................................................................................................ 13
Asthma......................................................................................................................... 14
Asthma Triggers ...................................................................................................... 15
Control of Asthma ................................................................................................... 15
Surveillance ................................................................................................................. 16
Asthma in Indiana ....................................................................................................... 20
Prevalence................................................................................................................ 20
Measures of Severity .................................................................................................. 40
Morbidity .................................................................................................................. 40
Mortality.................................................................................................................... 49
Cost of Asthma............................................................................................................ 50
Financial Costs ........................................................................................................ 50
Quality of Life........................................................................................................... 51
Quality of Asthma Care............................................................................................... 57
Environment ................................................................................................................ 67
Appendix...................................................................................................................... 72
Figure 1 Lifetime asthma prevalence by sex: ......................................... 22 Figure 2 Lifetime asthma prevalence by age: ......................................... 22 Figure 3 Lifetime asthma prevalence by race/ethnicity:.................... 23 Figure 4 Lifetime asthma prevalence by household income: ............ 23 Figure 5 Lifetime asthma prevalence by educational attainment:.. 24 Figure 6 Current asthma prevalence by sex:........................................... 25 Figure 7 Sex, percent distribution in respondents with current
asthma: Indiana 2002 ................................................................... 25 Figure 8 Current asthma prevalence by age: .......................................... 26 Figure 9 Current asthma prevalence by race/ethnicity: ..................... 26 Figure 10 Adults with current asthma by race/ethnicity: .................... 27 Figure 11 Current asthma prevalence by household income: ............. 27

Updated 12/30/2004 Indiana Joint Asthma Coalition
5
Figure 12 Current asthma prevalence by educational attainment: ... 28 Figure 13 Current asthma prevalence by employment status: ........... 28 Figure 14 Employment status, percent distribution in respondents
with current asthma: ...................................................................... 29 Figure 15 Current asthma prevalence by marital status: ..................... 29 Figure 16 Current asthma prevalence by BMI category:....................... 30 Figure 17 BMI category, percent distribution in respondents with
current asthma: ................................................................................ 30 Figure 18 Indiana Hospitalizations for Asthma 1997 - 2002............... 42 Figure 19 Number of Asthma Hospitalizations - All Races ................... 43 Figure 20 Number of Asthma Hospitalizations - White.......................... 44 Figure 21 Number of Asthma Hospitalizations - Black........................... 45 Figure 22 Asthma Hospitalization Rate - All Races ................................. 46 Figure 23 Asthma Hospitalization Rate - White........................................ 47 Figure 24 Asthma Hospitalization Rate - Black......................................... 48 Figure 25 Indiana Asthma Mortality 1997 – 2002 Number of Deaths ............................................................................................. 49 Figure 26 Indiana Asthma Mortality 1997 – 2002 Rate per 100,000 ................................................................................................ 50 Figure 27 Direct Medical Costs of Asthma in a Medicaid Cohort of
Children ages 0-17........................................................................... 51 Figure 28 Direct Medical Costs of Asthma in a Medicaid Cohort of
Adults ages 19-64 ............................................................................ 52 Figure 29 Reported health status, distribution in respondents
with/without current asthma: Indiana 2002 ....................... 53 Figure 30 Number of days felt healthy in the last month, distribution
in respondents with/without current asthma: ..................... 54 Figure 31 Number of days felt sad, blue or depressed in last month,
percent distribution in respondents with/without current asthma: ............................................................................................... 55
Figure 32 Number of days felt stressed during the last month, percent distribution in respondents with/without current asthma: ............................................................................................... 56
Figure 33 Number of days didn’t get enough rest during the last month, percent distribution in respondents with/without current asthma: ................................................................................ 57
Figure 34 Current asthma prevalence by medical care in last year: ..................................................................................................... 58 Figure 35 Medical care in last year, percent distribution in
respondents with/without current asthma: .......................... 59 Figure 36 Current asthma prevalence by healthcare coverage:......... 59

Updated 12/30/2004 Indiana Joint Asthma Coalition
6
Figure 37 Healthcare coverage, percent distribution in respondents with/without current asthma: .................................................... 60
Figure 38 Current asthma prevalence by place of usual care: ............ 60 Figure 39 Place of usual care, percent distribution in respondents
with/without current asthma: .................................................... 61 Figure 40 Current asthma prevalence by ability to obtain medical
care in last 6 months: ..................................................................... 61 Figure 41 Ability to obtain medical care in last 6 months, percent
distribution in respondents with/without current asthma: .............................................................................................. 62 Figure 42 Receipt of flu shot in last 12 months, percent distribution
in respondents with/without current asthma: ..................... 63 Figure 43 Rx Claims for Inhaled Steroids for Children under 18 ....... 64 Figure 44 Office Visits for Asthma in Children under 18 ....................... 65 Figure 45 Rx Claims for Inhaled Steroids in Adults 18 - 64 ................. 66 Figure 46 Office Visits for Asthma in Adults 18 - 64............................... 67 Figure 47 Smoking status, percent distribution in respondents
with/without current asthma: Indiana 2002 ....................... 68 Figure 48 Age began smoking regularly, percent distribution in
respondents with/without current asthma: ................... 69 Figure 49 Prevalence of current asthma by age first began smoking: ............................................................................................. 70 Figure 50 Percent distribution of smoking rules at home among
respondents with current asthma: ........................................... 70 Figure 51 Percent distribution of smoking rules in common areas at
work among respondents with current asthma: .................. 71 Figure 52 Percent distribution of smoking rules in work areas at
work among respondents with current asthma: .................. 71 Figure 1a Age, percent distribution in respondents with/without
current asthma: ................................................................................ 72 Figure 2a Educational attainment, percent distribution in
respondents with/without current asthma: .......................... 73

Updated 12/30/2004 Indiana Joint Asthma Coalition
7
Table 1 Sex distribution of those with asthma in Medicaid for at least 11 of 12 months in FY 2003..................................................................................... 32
Table 2 Asthma prevalence by sex: those in Medicaid for at least 11 of 12 months in FY 2003* .................................................................................. 32
Table 3 Race/ethnicity distribution of those with asthma in Medicaid for at least 11 of 12 months in FY 2003 ...................................................................... 32
Table 4 Asthma prevalence by race/ethnicity: those in Medicaid for at least 11 of 12 months in FY 2003* .......................................................................... 33
Table 5 Number and prevalence of asthma in Medicaid cohort, All ages, by county: ..................................................................................................... 33
Table 6 Number and prevalence of asthma in a Medicaid cohort of children age 0 – 17 years, by County: ........................................................................... 35
Table 7 Number and prevalence of asthma in a Medicaid cohort of adulta age 18 – 64 years, by County: ......................................................................... 38

Updated 12/30/2004 Indiana Joint Asthma Coalition
8
Executive Summary Asthma is a pulmonary disease that results from oversensitivity of the airways in the lungs, causing the airways to narrow and clog in response to irritants like allergens, cold, dust, exercise, emotional stress and other stimulation. This report on asthma summarizes data available describing the burden of asthma on the people of Indiana. Because of the intrinsic limitations in the available data, our view of asthma is somewhat imprecise. This is because data collection is often imperfect, some data apply only to certain populations, and different sources of data require different case definitions for asthma. Nonetheless, these data paint a picture of asthma that can guide new initiatives in asthma control and track improvements as these initiatives move forward. We have organized the asthma burden report to answer five questions:
1. Who suffers from asthma in Indiana? 2. How severe is the asthma in our state? 3. What are the costs of asthma in Indiana, including both financial and human
costs? 4. How well do we care for those in Indiana with asthma? 5. How do environmental pollutants contribute to asthma?
To answer these questions, we turned to four primary sources of data:
1. The Behavioral Risk Factor Surveillance Survey (BRFSS), a telephone survey developed by the Centers for Disease Control and Prevention, monitors state-level prevalence of the major behavioral risks among adults associated with premature morbidity and mortality), and includes a module assessing asthma in non-institutionalized civilian adults.
2. Medicaid administrative claims data from the Indiana Office of Medicaid Policy
and Planning. These represent claims for health care expenditures on children under age 18 years from families with incomes below twice the poverty level. Claims are also included for adults and children who qualify for Medicaid because they are blind, disabled or qualify under other provisions. These claims include hospitalizations, emergency room and doctor visits, and medications.
3. Hospital discharge data from the Indiana Hospital&Health Association. These
include information on hospitalizations throughout Indiana with a discharge diagnosis of asthma.
4. Mortality statistics from death certificates, reported to the Indiana State
Department of Health.

Updated 12/30/2004 Indiana Joint Asthma Coalition
9
Who has asthma? The prevalence of asthma is similar to that for the United States as a whole. According to the 2002 Indiana BRFSS survey, 7.5% of adults aged 18 and older currently had asthma. This figure is identical to the overall US statistic. Between 11% and 12% of adults in Indiana reported they had ever had asthma. This is also similar to the US as a whole. Asthma disproportionately affects certain subgroups in the population. Although the population of adult men and women in Indiana was about 50-50 in 2002, more than two-thirds of the adults with current asthma were women. Current asthma prevalence among adult women was 9.8%, nearly twice the 5.1% prevalence among adult men. Hospitalization data showed the largest number of asthma hospitalizations among adults were in women, ages 40-49, with numbers nearly as large in women 50-59 and 30-39. This pattern was seen across all race/ethnic categories. In the Indiana Medicaid population, 14.2% of adults suffer from asthma compared to 10.4% of children. Among children, a slightly higher percentage of boys have asthma than girls. Among adults, women are almost twice as likely to report having asthma as men. Individuals from households with annual household incomes below $15,000 reported having asthma at nearly twice the rate as those with incomes of $25,000 – $49,999, and reported having asthma at more than twice the rate as those with incomes of $50,000 or more. A higher percentage of unmarried and unemployed individuals and those with less than a high school education reported having asthma compared to the rates reported by those who were married, employed or had graduated from high school. According to 2002 BRFSS data, the self-reported prevalence of current asthma in Indiana was lowest among Hispanics (5.6%). Among non-Hispanics, the prevalence of current asthma was higher among the multi-racial (13.5%), black (12.2%) and other (10.9%) racial categories when compared to whites (7.1%). In the Medicaid cohort, the prevalence was lowest among Hispanics (7.2%), and highest among whites (12.6%). Prevalence among blacks in the Medicaid cohort was 10.0%, and 8.6% in the other racial category. The BRFSS data also show a possible association between obesity and asthma. The prevalence of asthma among obese respondents (BMI >30) was 10.1%. The prevalence of asthma among normal weight respondents (BMI 18.5-25) was 6.5%, and 6.3% among overweight respondents (BMI 25-29.9). Whether asthma leads to obesity or obesity leads to asthma is a point of controversy. More detailed analyses available from claims data among Medicaid enrollees, shows a wide variation in the prevalence of asthma among the counties of Indiana, from a low of 7.3% in Elkhart County to a high of 17.3% in Davies County. Despite speculation about

Updated 12/30/2004 Indiana Joint Asthma Coalition
10
health risk behaviors or possible differences in environmental exposures, the reasons for the variation are not known. How bad is the asthma? There is both good news and bad news about what has happened to the severity of asthma in recent years. Longitudinal data gathered by the Indiana State Department of Health show that hospitalization rates have declined almost 20% since 1997. Consistent with the demographic trends in asthma, Hospitalization rates for asthma are higher in blacks than whites and highest among boys under 5 years and women in their 40s. Asthma deaths have also declined 27% since 1997. Nonetheless, other measures indicate that the severity of asthma is significant. Consistent with this, 17.3% of respondents to the BRFSS who have asthma report having symptoms every day; 54.9% said they had had an asthma attack in the last year, and 30% required urgent care for asthma. Among children with asthma who were enrolled in Medicaid at least 11 of 12 months in 2003, 4% were hospitalized with a principal diagnosis of asthma and 10% had an emergency room visit with a principal diagnosis of asthma. What are the costs of asthma? Asthma is associated both with financial costs and human suffering, the real burden of asthma. Direct medical costs are only a fraction of the total financial cost attributable to asthma. They do not include costs to private insurance and uninsured individuals, the indirect costs from lost work, travel, daycare, and the myriad other costs that accompany chronic disease. The cost in human suffering is also significant. In the 2002 BRFSS survey, adults with current asthma rated their own health status lower than adults without current asthma. They reported their health as very good or excellent at a rate 35% lower than those without current asthma and were almost three times as likely to report their health as poor. Those with current asthma also reported fewer days of feeling well in each month. Adults with current asthma reported feeling depressed every day, at a rate three times greater and they reported feeling stressed more frequently and feeling rested less frequently than those without current asthma. How well do we care for asthma? Based on the consensus guidelines of the National Heart Lung and Blood Institute (NHLBI), persons with asthma should have routine visits to the physician twice a year. Indiana’s BRFSS data show that only 52.5% of respondents with current asthma indicated they had at least one routine checkup for their asthma in the past 12 months, and over 27% had no medical care in the preceding year. In fact, 13% reported being unable to get medical care at all in the previous 6 months.

Updated 12/30/2004 Indiana Joint Asthma Coalition
11
When asked what their usual source of care was, 74% of those with current asthma and 78% of those without current asthma reported the doctor’s office. However, those with current asthma reported using public health clinics at a rate about 50% higher than those without current asthma, Respondents with current asthma also reported using an emergency room as their usual source of medical care at a rate nearly twice the rate of those without current asthma. The use of an emergency room as the usual place of care makes continuity of care for a chronic condition impossible, resulting in poor quality of asthma care. Two markers of quality of asthma care are the rate of influenza (flu) vaccination and the use of controller medications. Flu vaccines are recommended for all people with asthma. In Indiana, over 65% of people with asthma had no flu shot, according to the 2002 BRFSS survey. The NHLBI guidelines recommend daily controller medications (e.g., inhaled steroids) for anyone with “persistent asthma.” This would require several controller prescriptions per year. Among a Medicaid cohort of children who met the NCQA criteria for a diagnosis of persistent asthma, using Medicaid claims data, nearly half received no controller medication at all during FY 2003, and, of those who did receive a controller, most had only one or two prescriptions filled. Based on available data, those in Indiana with asthma would benefit from improvements to both access to, and quality of care. How do environmental pollutants contribute to asthma? Environmental triggers are thought to be important contributors to asthma. Environmental pollutants can be categorized as indoor or outdoor. Outdoor pollutants and the role they play in asthma is an area that requires additional work. While the Indiana Department of Environmental Management monitors outdoor pollutants, the impact of these pollutants on asthma needs further investigation. The most significant indoor pollutant affecting asthma is environmental tobacco smoke. Some data on environmental tobacco smoke exposure among adults in Indiana was reported in the 2002 BRFSS survey. Over 30% of Indiana adults with current asthma were smokers. This rate of smoking was higher than that of people without asthma. Even among those who didn’t smoke, there was some risk of smoke exposure at home or at work. BRFSS respondents with current asthma reported that in 26% of their homes and over 10% of their workplaces, there were either no rules governing smoking or rules that allowed smoking in all areas. Because environmental tobacco smoke is a well-established asthma trigger, this may be an important contributor to asthma burden. Summary Adults in Indiana experience asthma at about the same rate as adults in the US overall. Asthma disproportionately affects women, children, certain minorities and the poor. Severity of asthma, based on hospitalizations and deaths appears to have improved in the last seven years, but a large proportion of asthma in Indiana still appears to be

Updated 12/30/2004 Indiana Joint Asthma Coalition
12
severe. The consequences of asthma are financially costly and are associated with decreased quality of life indicated by higher rates of depression, stress and poor self-rated health status among those with the disease. Care of asthma appears to be compromised by barriers to access and deficiencies in quality. The effect of environmental pollutants on asthma needs further investigation, but tobacco smoke – both active and passive – probably contributes to the asthma burden.

The Burden of Asthma The burden of a disease is its impact on the person diagnosed with the disease, his/her family and caregivers and the greater community in which the person lives. Although many people often speak only of monetary cost when they discuss the burden of a disease, the burden also includes the impact on the quality of life for the individual with the disease and his/her caregivers. Asthma is one of the most common chronic diseases in the world, yet asthma is often uncontrolled or poorly controlled, needlessly restricting school, work and leisure activities for countless numbers of asthma sufferers. By collecting and monitoring data on the burden of asthma in Indiana, strategies can be devised to address areas and populations where interventions can be targeted, implemented and evaluated with the goal of reducing the burden of asthma in Indiana, both in terms of the financial cost and quality of life for those with asthma.
From a financial perspective, asthma is a costly disease. Control of asthma requires long-term medical treatment, including at least one prescription medicine. Uncontrolled asthma may require visits to the emergency room and/or hospitalization. According to the Cost of Illness Handbook published by the Environmental Protection Agency (EPA), the lifetime cost (in 1999 dollars) for direct medical care for an average patient with asthma is $50,000. The lifetimpatient with moderate to severe asthmmanaged, soars to $220,000. From a quality of life perspective, asthma isreport more limitations in their daily activitithe most common cause of missed schoworkdays. People with asthma report fewethan people without asthma.
The lifetime direct medical costs for an average person with asthma is $50,000 The lifetime direct medical costs for a person with moderate to severe asthma that has not been carefully controlled is more than $200,000 Source: EPA Cost of Illness Handbook Cost in 1999 dollars
Updated 12/30/2004 Indiana Joint Asthma Coalition
13
e cost for a high use patient, defined as a a whose disease has not been carefully
also a costly disease. Patients with asthma es than patients without asthma. Asthma is ol days and a high percentage of missed r days when they feel healthy and energetic

Asthma Asthma is a chronic disease that affects the lungs. When a person has asthma, the inside walls of the airways of the lungs are inflamed, making them more sensitive and more reactive than the airways of a person who does not have asthma. The airways react more strongly to inhaled irritants, allergens or respiratory tract infections than those of a person without asthma and this reaction can trigger an asthma attack or episode. During an asthma attack, the airways narrow and less air can flow in and out of the lungs. Inflammation increases and the muscles around the airways tighten, which makes the airways more swollen and narrower. More mucus than normal is produced, which further clogs and narrows the airways. These changes cause the symptoms of an asthma attack, like wheezing, coughing, feeling out of air, feeling tightness of the chest or throat, and trouble breathing.
Updated 12/30/2004 Indiana Joint Asthma Coalition
14
Asthma attacks are not all the same. They can vary from mild to severe. A severe asthma attack can be life threatening, since the airways can close to the point that not enough oxygen reaches the vital organs.
In 2001, an estimated 31.3 million Americans had been diagnosed with asthma during their lifetimes.
20.3 million Americans currently had asthma.
12 million Americans had an asthma attack during the previous year.
Source: CDC National Center for Environmental Health, 2001
In most cases it is unknown what causes asthma to develop or why the people who develop asthma have inflamed airways. It is known that asthma is closely linked to allergy and that children with a family history of allergy or asthma are more likely to develop asthma. A person who has a parent with asthma is three to six times more likely to develop asthma than a person who does not have a parent with asthma. Some research suggests that infections and exposures to tobacco smoke and allergens early in life may play a part in the development of asthma. Asthma can be difficult to diagnose, especially in children under the age of 5. In 2001, an estimated 6.3 million children in the United States had asthma, and 4.3 million had an asthma attack in the previous year. Asthma is the most common chronic disease in children and is one of the leading causes of missed school days.

Asthma Triggers Environmental exposures and certain conditions can make asthma worse and trigger asthma attacks. There are literally hundreds of potential triggers for asthma, but the triggers vary from person to person and are unique to each individual. Some common asthma triggers are exercise, allergens, inhaled irritants or viral infections. An individual can have problems with only one or a number of asthma triggers. Here are some examples of typical asthma triggers:
Allergen Source
Dust mites Cockroaches Animal dander Mold (indoor and outdoor) Pollen from trees, grasses and weeds
Irritants
Cigarette smoke Strong painting or cooking odors Perfume or scented products Cold air or a change in the weather (e.g. high humidity and thunderstorms) Air pollution
Other triggers
Physical exercise Aspirin and beta-blocker medicines Sulfites in food and beverages (e.g. dried fruits and wine) Respiratory infections Gastroesophageal reflux disease (GERD) Strong emotions (including crying or laughing hard) Stress
Control of Asthma
Updated 12/30/2004 Indiana Joint Asthma Coalition
15
Although asthma cannot currently be prevented or cured, exacerbations (asthma attacks) can be controlled. Taking medicine as prescribed, knowing the warning signs of an attack, avoiding asthma triggers and following the doctor’s advice are essential to controlling asthma and preventing asthma attacks. Every person with asthma should have a written asthma action plan. The asthma action plan helps each person treat or manage asthma and its symptoms.

Medicines for asthma vary from person to person, and can be inhaled or taken as a pill. There are two basic types of asthma medicines – quick-relief (rescue) and long-term (controller) medicines. The quick-relief medicines are meant to help a person breathe
during an asthma attack, while the long-term controller medicines are meant to prevent or reduce the number and severity of asthma attacks and do not help during an asthma attack. The proper and everyday use of long-term controller medicines should reduce the need to use the rescue medicines. A visit to the doctor is in order if there is a worsening of asthma symptoms and/or an increasing need for the use of rescue medicines.
Every person with asthma should have an asthma management plan
When asthma is controlled, its symptoms are minimal or infrequent, which allows a person with asthma to lead an active life. When asthma is not controlled, it is likely that symptoms will cause missed days at school or work and possible visits to the hospital. To reduce the burden of asthma, the goals for the control of asthma at both the national and state level include:
Collecting and analyzing data on an ongoing basis
Translating scientific information into public health programs and practices that will reduce the burden of asthma
Involving all stakeholders in developing, implementing and evaluating asthma
control program efforts
Ultimately, the goals of the state and national asthma programs are to reduce the number of deaths, hospitalizations, emergency department visits, missed school or work days, and limitations on activity due to asthma
Surveillance Surveillance is a system for the on-going collection, analysis, interpretation and dissemination of health data. The purpose of surveillance is to monitor the impact and trends of a disease in order to guide the planning of disease management, intervention and control strategies. Although surveillance can be expensive, it is essential to targeting and evaluating efforts to reduce the burden of a disease, and even limited data are useful in guiding prevention and control efforts.
Updated 12/30/2004 Indiana Joint Asthma Coalition
16
Initially, surveillance involves the collection of baseline data such as incidence, prevalence, severity and cost. These data provide the information necessary to understand the nature and scope of a disease so that a plan for control and prevention can be devised and implemented. As surveillance efforts continue over time, new data

can be compared to the baseline data. The impact of control and prevention efforts can be evaluated. On-going monitoring and evaluation helps ensure that effective strategies are continued and enhanced while ineffective strategies are changed or discontinued. Data on trends can also show where new intervention strategies are needed. Asthma is a frequent cause of emergency department (ED) visits and hospitalizations and is also a very costly disease, in terms of direct and indirect financial costs as well as reduced quality of life. Surveillance is an important part of the public health effort to reduce the burden of asthma. Because data are collected from a variety of sources such as state Medicaid programs, state mortality statistics, hospitalization records, surveys, etc., caution must be exercised when comparing data, since they may use different case definitions for asthma. The case definition is a set of conditions that must be met in order for a person to be counted as having asthma. Unlike clinical case definitions used to diagnose whether a person has a disease, surveillance case definitions can vary based on the nature of the data and the purpose for which it was collected.
For example, a case of asthma may be defined in these different ways: 1. Hospital discharge data may require asthma to be the discharge diagnosis or
may count asthma as a co-morbid condition 2. Mortality data may require asthma to be the underlying cause of death or may
count asthma as a contributing cause 3. Medicaid data may require paid claims for a service with a diagnosis of
asthma or asthma medication prescriptions 4. Survey data may count respondents who say they currently have asthma or
may count respondents who say that a health care professional has diagnosed them with asthma during their lifetime, even if they have not experienced any symptoms of asthma for many decades
There are asthma control programs at the national, state and local levels, each requiring surveillance targeted at specific populations of interest. Comparison of state and local disease estimates and patterns to each other as well as to national estimates helps define the scope of the problem of asthma. Such comparisons also provide a means to measure the potential positive effects of asthma education and management efforts. The conceptual framework for asthma surveillance developed by the CDC provides for a system that collects and analyzes data in order to answer four basic questions:
1. How much asthma is there?
Updated 12/30/2004 Indiana Joint Asthma Coalition
17
Behavioral Risk Factor Surveillance System (BRFSS)

Population based estimates of statewide prevalence
Trends and disparities in asthma prevalence
Medicaid Administrative Claims Data
Prevalence rates in the Medicaid population, based on diagnostic codes and prescriptions filled in claims data.
2. How severe is the asthma?
Surveillance of asthma is a public health activity, and strategies implemented to reduce the burden of asthma are directed at the population, rather than specific individuals with asthma. Indicators of the severity of asthma in a population include the morbidity and mortality associated with the asthma in that population. This is quite different from the clinical use of the term “severity” when used by a physician in reference to the determination of the level of an individual’s asthma symptoms.
Morbidity
BRFSS
Asthma history module data on urgent care visits and routine care
Indiana Hospital Discharge Data
Medicaid Data
Rates of inpatient, outpatient and emergency department visits due to asthma
Rate of physician visits, prescription drug utilization
Mortality
Indiana Mortality Statistics
Asthma as the underlying cause of death
Trends and disparities in asthma mortality
3. How successful are we in managing asthma?
Updated 12/30/2004 Indiana Joint Asthma Coalition
18
Medicaid Data
Number of routine visits annually
What asthma medicines patients receive
4. What are the costs of asthma?
Medicaid Data
BRFSS
Quality of life indicators for people with asthma compared to those without
asthma At the state level, providing answers to these questions includes:
1. Determination of the extent of asthma in Indiana
a) The lifetime and current prevalence rates of asthma by age, sex, race/ethnicity
b) The incidence of asthma attacks by age, sex, race/ethnicity
2. Determination of the severity of asthma in Indiana
a) The number of asthma deaths b) Number of hospitalizations due to asthma c) Frequency of unscheduled visits to the emergency department, urgent
care centers or other health care providers
d) Data on trends in the above measures of severity
3. Determination of the success of asthma management in Indiana
a) Information on use of prescription medicine
4. Determination of the cost of asthma in Indiana
Updated 12/30/2004 Indiana Joint Asthma Coalition
19
a) Information on the cost of asthma care, i.e. medicines, ED visits, hospitalizations, scheduled and unscheduled visits to healthcare providers

b) Information on quality of life for people with asthma
5. In addition, examination of environmental factors contributing to asthma
a) Information on indoor air quality, tobacco use and environmental tobacco smoke exposure
Asthma in Indiana Prevalence Behavioral Risk Factor Surveillance System The Behavioral Risk Factor Surveillance System (BRFSS) is a random-digit dialed telephone survey of the non-institutionalized civilian population of the United States ages 18 and older. It was initiated by the Centers for Disease Control and Prevention (CDC) in 1984 to monitor state-level prevalence of major behavioral risks among adults associated with premature morbidity and mortality. The BRFSS is an ongoing data collection program administered annually by the CDC, and is the largest telephone survey in the world. All 50 states have participated in the BRFSS since 1994. Additional information on the BRFSS can be found at http://www.cdc.gov/brfss/. The BRFSS consists of three parts. There is a standard core of questions that are included in the survey each year, and are used by all states. The states must ask the core questions without modification. There are also optional health behavior/risk factor modules and state-added questions that states can choose to utilize. The optional modules and questions can be costly and add length to the survey. It is not feasible to include questions on all the topics of interest each year, so states typically rotate the optional modules. There are two optional asthma modules. The first is an asthma history module that includes questions about the “severity” of asthma. The second asthma module is a childhood prevalence module that asks the number of children in the respondents’ households, if the children have ever been diagnosed with asthma and if they still have asthma.
In 2002, an estimated 341,000 adults in Indiana over the age of 18 had asthma. An estimated 514,000 adults in Indiana had been diagnosed with asthma during their lifetimes. Source: CDC BRFSS 2002
Updated 12/30/2004 Indiana Joint Asthma Coalition
20
BRFSS data provide a means to estimate the lifetime and current prevalence of asthma in the adult population, and is a major source of prevalence data used by the Indiana

Updated 12/30/2004 Indiana Joint Asthma Coalition
21
Asthma Program. Because the BRFSS is administered by the CDC, its results are consistent from state to state. The prevalence derived from the BRFSS for Indiana can be reliably compared to the prevalence of other states and the nation as a whole. The BRFSS has a certain number of limitations. Only non-institutionalized adults with home telephones are included in the survey. Children under the age of 18, institutionalized adults, adults in the military service and adults without telephones are not included in the survey population. The prevalence rates derived from the BRFSS are based on a respondent’s self-reported diagnoses of asthma. Since there is no confirmed case definition for a self-reported diagnosis of asthma, the BRFSS prevalence rates are based on probable cases of asthma. BRFSS data from 2002 show the prevalence of asthma in Indiana was comparable to the nationwide prevalence of asthma. No significant differences in prevalence were found among the age, sex, racial/ethnic or income categories between Indiana and the US as a whole. In 2002, the lifetime prevalence of asthma in Indiana was 11.3%, lower than the national prevalence of 11.8%, however the difference was not statistically significant. Lifetime prevalence was calculated from responses of “yes” to the question: “Have you ever been told by a doctor, nurse or other health professional that you have asthma?” The affirmative responses to this question provide information about those who reported they had ever been diagnosed with asthma at any time in their lives, even if they had not had any symptoms of asthma in many years. In 2002, the current prevalence of asthma in Indiana was the same as the prevalence for the United States as a whole, 7.5%. Current asthma prevalence was calculated from responses of “yes” not only to the question: “Have you ever been told by a doctor, nurse or other health professional that you have asthma?” but also a response of “yes” to the question: “Do you still have asthma?” The affirmative responses to both asthma questions provides information about those with current asthma who are incurring the financial costs of asthma as well as the morbidity and mortality associated with the asthma. Targeting interventions aimed at the improvement of the control of asthma requires knowledge of those who are currently suffering from the disease.

Figure 1 Lifetime asthma prevalence by sex: Indiana 2002 Source: BRFSS 2002
9.9
12.7
0
5
10
15
Male Female
Perc
ent
Percentage of respondents within each category who answered “yes” to the question: “Have you ever been told by a doctor, nurse or other health professional that you have asthma?” Note: I = 95% Confidence Interval.
Figure 2 Lifetime asthma prevalence by age: Indiana 2002 Source: BRFSS 2002
9.29.610.6
11.912.7
13.6
0
5
10
15
20
18-24 25-34 35-44 45-54 55-64 65+
Perc
ent
Percentage of respondents within each category who answered “yes” to the question: “Have you ever been told by a doctor, nurse or other health professional that you have asthma?” Note: I = 95% Confidence Interval.
Updated 12/30/2004 Indiana Joint Asthma Coalition
22

Figure 3 Lifetime asthma prevalence by race/ethnicity: Indiana 2002 Source: BRFSS 2002
20.2
13.9
8.4
14.0
11.0
0
5
10
15
20
25
30
35
White* Black* Hispanic Other* Multi-Racial*
Perc
ent
* Non-Hispanic Percentage of respondents within each category who answered “yes” to the question: “Have you ever been told by a doctor, nurse or other health professional that you have asthma?” Note: I = 95% Confidence Interval Figure 4 Lifetime asthma prevalence by annual household income: Indiana 2002 Source: BRFSS 2002
9.88.3
11.2
12.8
16.2
0
5
10
15
20
Less than$15,000
$15-$24,999
$25-$49,999
$50-$74,999
$75,000+
Perc
ent
Percentage of respondents within each category who answered “yes” to the question: “Have you ever been told by a doctor, nurse or other health professional that you have asthma?”
Updated 12/30/2004 Indiana Joint Asthma Coalition
23
Note: I = 95% Confidence Interval.

Figure 5 Lifetime asthma prevalence by educational attainment: Indiana 2002 Source: BRFSS 2002
14.4
10.611.8
10.6
0
5
10
15
20
Less than HighSchool Graduate
High SchoolGraduate/GED
Some post High School
CollegeGraduate
Perc
ent
Percentage of respondents within each category who answered “yes” to the question: “Have you ever been told by a doctor, nurse or other health professional that you have asthma?” Note: I = 95% Confidence Interval. Responses of those with current asthma were examined in greater detail. Those with current asthma are those seen in the healthcare system for asthma treatment, incur direct costs for medicines, medical visits and hospitalizations, as well as suffer the negative impact of asthma to their quality of life.
Updated 12/30/2004 Indiana Joint Asthma Coalition
24

Figure 6 Current asthma prevalence by sex: Indiana 2002 Source: BRFSS 2002
9.8
5.1
0
5
10
15
Male Female
Perc
ent
Percentage of respondents within each category who answered “yes” to the questions: “Have you ever been told by a doctor, nurse or other health professional that you have asthma?” and “Do you still have asthma?” Note: I = 95% Confidence Interval.
Figure 7 Sex, percent distribution in respondents with current
asthma: Indiana 2002 Source: BRFSS 2002
67.3
32.7
Male Female
Adults with Current Asthma
Percentage breakdown of categories within survey population of respondents with current asthma. Survey population of adults with current asthma are respondents who answered “yes” to both asthma core questions: “Have you ever been told by a doctor, nurse or other health professional that you have asthma?” and “Do you still have asthma?”
Updated 12/30/2004 Indiana Joint Asthma Coalition
25

Figure 8 Current asthma prevalence by age: Indiana 2002 Source: BRFSS 2002
8.27.2
7.7 8.0
6.8 6.9
0
5
10
18-24 25-34 35-44 45-54 55-64 65+
Perc
ent
Percentage of respondents within each category who answered “yes” to the questions: “Have you ever been told by a doctor, nurse or other health professional that you have asthma?” and “Do you still have asthma?” Note: I = 95% Confidence Interval
Figure 9 Current asthma prevalence by race/ethnicity:
Indiana 2002 Source: BRFSS 2002
13.5
10.9
5.6
12.2
7.1
0
5
10
15
20
25
White* Black* Hispanic Other* Multi-Racial*
Perc
ent
* Non-Hispanic Percent of respondents within each category who answered “yes” to the questions: “Have you ever been told by a doctor, nurse or other health professional that you have asthma?” and “Do you still have asthma?” Note: I = 95% Confidence Interval
Updated 12/30/2004 Indiana Joint Asthma Coalition
26

Figure 10 Adults with current asthma by race/ethnicity:
Indiana 2002 Source: BRFSS 2002
8,99710,90511,850
274,111
31,374
0
50,000
100,000
150,000
200,000
250,000
300,000
350,000
White* Black* Hispanic Other* Multi-Racial*
Est
imat
ed n
um
ber
* Non-Hispanic Estimated number of adults in Indiana with current asthma in 2002. Estimated counts are based on U.S. Department of the Census July 1, 2002 population estimates for the State of Indiana and BRFSS current asthma prevalence estimates by racial/ethnic category. Note: I = 95% Confidence Interval
Figure 11 Current asthma prevalence by annual household income: Indiana 2002 Source: BRFSS 2002
13.1
8.9
7.05.4 5.7
0
5
10
15
20
Less than$15,000
$15-$24,999 $25-$49,999 $50-$74,999 $75,000+
Perc
ent
Percent of respondents within each category who answered “yes” to the question: “Have you ever been told by a doctor, nurse or other health professional that you have asthma?” and “Do you still have asthma?”
Updated 12/30/2004 Indiana Joint Asthma Coalition
27
Note: I = 95% Confidence Interval

Figure 12 Current asthma prevalence by educational attainment: Indiana 2002 Source: BRFSS 2002
6.77.47.2
10.8
0
5
10
15
Less than HighSchool
Graduate
High SchoolGraduate/GED
Some post High School
CollegeGraduate
Perc
ent
Percentage of respondents within each category who answered “yes” to the questions: “Have you ever been told by a doctor, nurse or other health professional that you have asthma?” and “Do you still have asthma?” Note: I = 95% Confidence Interval.
Figure 13 Current asthma prevalence by employment status:
Indiana 2002
Source: Indiana BRFSS 2002
6.7
10.1
8.5 9.0
0
5
10
15
Employed Not employed Student/ homemaker
Retired/unable to work
Perc
ent
Percentage of respondents within each category who answered “yes” to the questions: “Have you ever been told by a doctor, nurse or other health professional that you have asthma?” and “Do you still have asthma?”
Updated 12/30/2004 Indiana Joint Asthma Coalition
28

Figure 14 Employment status, percent distribution in respondents
with current asthma: Indiana 2002 Source: Indiana BRFSS 2002
22.7
14.6
7.0
55.7
EmployedNot employedStudent/homemakerRet/unable to work
Adults with Current Asthma Percentage breakdown of categories within survey population of respondents with current asthma. Survey population of adults with current asthma are respondents who answered “yes” to both asthma core questions: “Have you ever been told by a doctor, nurse or other health professional that you have asthma?” and “Do you still have asthma?”
Figure 15 Current asthma prevalence by marital status: Indiana 2002 Source: Indiana BRFSS 2002
9.1
6.6
0
5
10
15
Married Unmarried
Perc
ent
Updated 12/30/2004 Indiana Joint Asthma Coalition
29
Percentage of respondents within each category who answered “yes” to the questions: “Have you ever been told by a doctor, nurse or other health professional that you have asthma?” and “Do you still have asthma?”

Figure 16 Current asthma prevalence by BMI category:
Indiana 2002 Source: BRFSS 2002
6.5 6.3
10.1
0
5
10
15
Normal Overweight Obese
Perc
ent
Percentage of respondents within each category who answered “yes” to the questions: “Have you ever been told by a doctor, nurse or other health professional that you have asthma?” and “Do you still have asthma?”
Figure 17 BMI category, percent distribution in respondents with
current asthma: Indiana 2002 Source: BRFSS 2002
31.2
30.0
32.4
Normal OverweightObese
Adults with Current Asthma Percentage breakdown of categories within survey population of respondents with current asthma. Survey population of adults with current asthma are respondents who answered “yes” to both asthma core questions: “Have you ever been told by a doctor, nurse or other health professional that you have asthma?” and “Do you still have asthma?”
Updated 12/30/2004 Indiana Joint Asthma Coalition
30

Updated 12/30/2004 Indiana Joint Asthma Coalition
31
Obesity has been associated with a number of chronic diseases, including asthma. Body mass index (BMI) is calculated from height and weight data, and used to assess underweight, normal weight, overweight and obesity. In adults 18 and older, a BMI below 18.5 is classified as underweight; a BMI between 19 and 24.9 is classified as normal weight; a BMI between 25 and 29.5 is classified as overweight and a BMI of 30 or greater is classified as obese. In 2001, Indiana BRFSS survey data indicated that 30.1% of people with asthma were diagnosed before the age of 10. The pattern of age at diagnosis is different for males and females. Their ages at diagnosis correspond to the fact that until puberty, nearly twice as many boys as girls have asthma though after puberty and throughout the rest of the lifespan more women than men have asthma. According to the 2002 BRFSS survey, 15.7% of Indiana households have at least one child who has ever been diagnosed with asthma. Of those households, 71.8% reported at least one child who currently has asthma.
Asthma is one of the most common chronic disease of childhood and responsible for more missed school days than any other illness. In children, the prevalence of asthma is higher in boys than girls. At puberty, the gender ratio reverses and the prevalence of asthma becomes greater in girls than boys. This gender difference in prevalence remains through adulthood. Medicaid The Medicaid program is a joint program with costs shared by both federal and state governments. Medicaid is the primary source of health care coverage for low income families and elderly and disabled people. More than half of all Medicaid enrollees are children, making it the largest public provider of children’s health insurance nationwide.
Nationwide, more than half of all Medicaid enrollees are children
In Indiana in 2003, 478,000 children were enrolled in Medicaid at some time
during the year. This number represents 28% of all children. The source of the Medicaid claims and enrollment data for the State of Indiana was the Indiana Office of Medicaid Policy and Planning (OMPP). The data were analyzed and provided by Indiana Children’s Health Services Research (HSR), a research section of the Department of Pediatrics at Indiana University School of Medicine. The Medicaid sample included clinic, ER, hospital and pharmacy claims from Medicaid enrollees. The Medicaid figures exclude people who are 65 and older. We report prevalence figures using individuals who were in Medicaid for at least 11 of 12 months (that is, “continuously enrolled”). HSR used the following two case definitions: for persistent asthma, the NCQA/HEDIS criteria (except the enrollment requirement, which was shortened to the same continuous enrollment of at least 11 of 12 months as that of the rest of the cohort); for any asthma, HSR employed a definition that is currently being used by the Indiana
Updated 12/30/2004 Indiana Joint Asthma Coalition
32
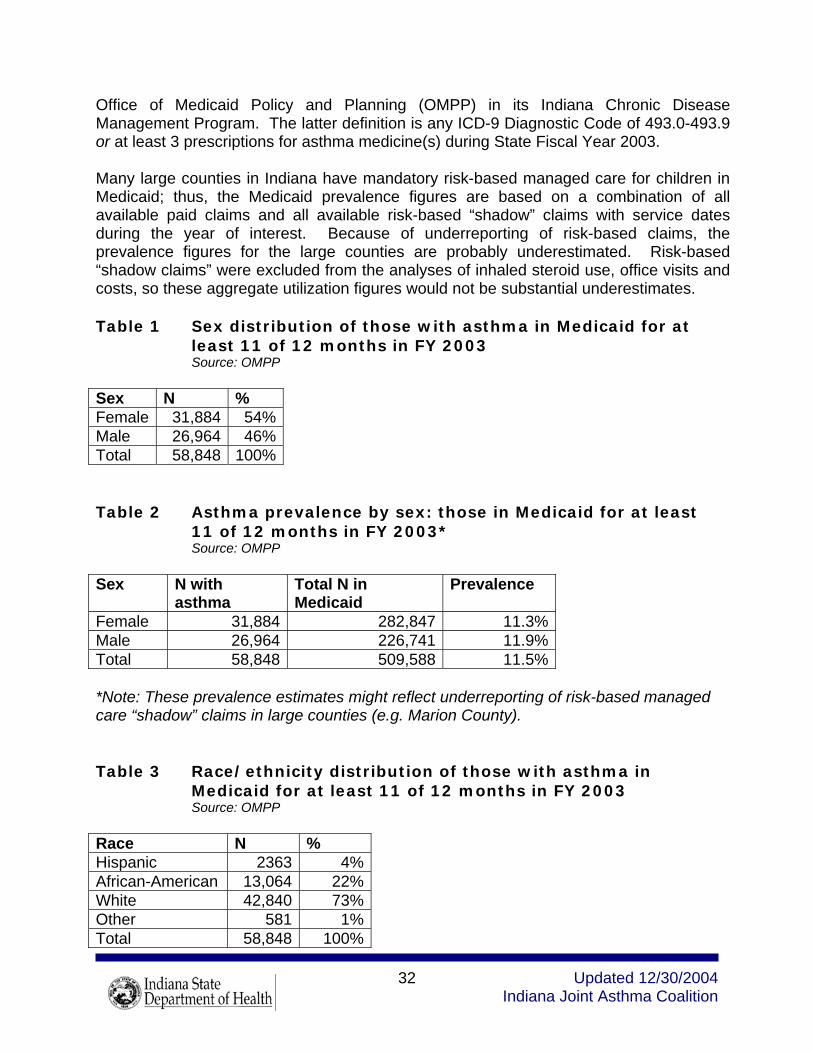
Office of Medicaid Policy and Planning (OMPP) in its Indiana Chronic Disease Management Program. The latter definition is any ICD-9 Diagnostic Code of 493.0-493.9 or at least 3 prescriptions for asthma medicine(s) during State Fiscal Year 2003. Many large counties in Indiana have mandatory risk-based managed care for children in Medicaid; thus, the Medicaid prevalence figures are based on a combination of all available paid claims and all available risk-based “shadow” claims with service dates during the year of interest. Because of underreporting of risk-based claims, the prevalence figures for the large counties are probably underestimated. Risk-based “shadow claims” were excluded from the analyses of inhaled steroid use, office visits and costs, so these aggregate utilization figures would not be substantial underestimates. Table 1 Sex distribution of those with asthma in Medicaid for at
least 11 of 12 months in FY 2003 Source: OMPP Sex N % Female 31,884 54% Male 26,964 46% Total 58,848 100% Table 2 Asthma prevalence by sex: those in Medicaid for at least
11 of 12 months in FY 2003* Source: OMPP Sex N with
asthma Total N in Medicaid
Prevalence
Female 31,884 282,847 11.3%Male 26,964 226,741 11.9%Total 58,848 509,588 11.5% *Note: These prevalence estimates might reflect underreporting of risk-based managed care “shadow” claims in large counties (e.g. Marion County). Table 3 Race/ethnicity distribution of those with asthma in
Medicaid for at least 11 of 12 months in FY 2003 Source: OMPP Race N % Hispanic 2363 4%African-American 13,064 22%White 42,840 73%Other 581 1%Total 58,848 100%

Updated 12/30/2004 Indiana Joint Asthma Coalition
33
Table 4 Asthma prevalence by race/ethnicity: those in Medicaid for at least 11 of 12 months in FY 2003*
Source: OMPP Race N with
asthma Total N in Medicaid
Prevalence
Hispanic 2,363 32,999 7.2% African-American 13,064 130,160 10.0% White 42,840 339,699 12.6% Other 581 6,730 8.6% Total 58,848 509,588 11.5% *Note: These prevalence estimates might reflect underreporting of risk-based managed care “shadow” claims in large counties (e.g. Marion County). Table 5 Number and prevalence of asthma in Medicaid cohort, All ages, by county: Indiana FY 2003
Source: OMPP
Note: The number/prevalence estimates for large counties, e.g. Marion County, may be artificially low due to shadow claims. County N with one dx or
three Rx’s in FY’03
N in Medicaid in June 2003
Prevalence
Adams 227 1640 12.2%Allen 2988 25,067 10.7%Bartholomew 737 4325 14.6%Benton 75 571 11.6%Blackford 147 1306 10.1%Boone 249 1641 13.2%Brown 128 909 12.3%Carroll 115 880 11.6%Cass 394 3391 10.4%Clark 995 6201 13.8%Clay 355 2142 14.2%Clinton 245 2413 9.2%Crawford 143 1186 10.8%Davies 535 2564 17.3%Dearborn 239 2233 9.7%Decatur 250 1502 14.3%DeKalb 267 2151 11.0%Delaware 1613 9682 14.3%Dubois 186 1621 10.3%Elkhart 1099 13,996 7.3%Fayette 387 2434 13.7%Floyd 847 4865 14.8%

Updated 12/30/2004 Indiana Joint Asthma Coalition
34
Fountain 156 1222 11.3%Franklin 173 1403 11.0%Fulton 234 1584 12.9%Gibson 202 2029 9.1%Grant 967 6880 12.3%Greene 455 2791 14.0%Hamilton 517 3903 11.7%Hancock 280 1968 12.5%Harrison 279 2163 11.4%Hendricks 350 2573 12.0%Henry 553 3899 12.4%Howard 1043 6201 14.4%Huntington 377 2060 15.5%Jackson 360 2177 14.2%Jasper 164 1723 8.7%Jay 270 1523 15.1%Jefferson 468 2279 17.0%Jennings 384 2285 14.4%Johnson 736 4788 15.4%Knox 602 3716 13.9%Kosciusko 394 3631 9.8%LaGrange 106 1055 9.1%Lake 6354 52,168 10.9%LaPorte 1304 8056 13.9%Lawrence 687 3334 17.1%Madison 1777 10,942 14.0%Marion 9691 86,866 10.0%Marshall 264 2627 9.1%Martin 162 937 14.7%Miami 384 2770 12.2%Monroe 1112 5937 15.8%Montgomery 445 2397 15.7%Morgan 615 4181 12.8%Newton 99 894 10.0%Noble 265 2327 10.2%Ohio 42 257 14.0%Orange 308 2146 12.6%Owen 309 1962 13.6%Parke 168 1398 10.7%Perry 151 1161 11.5%Pike 124 1007 11.0%Porter 880 6548 11.8%Posey 198 1470 11.9%Pulaski 129 1029 11.1%Putnam 241 2060 10.5%

Updated 12/30/2004 Indiana Joint Asthma Coalition
35
Randolph 317 2077 13.2%Ripley 230 1627 12.4%Rush 145 1154 11.2%St. Joseph 1972 23,472 7.8%Scott 357 2535 12.3%Shelby 471 2405 16.4%Spencer 135 1091 11.0%Starke 290 2302 11.2%Steuben 209 1717 10.9%Sullivan 311 1908 14.0%Switzerland 105 622 14.4%Tippecanoe 1058 7758 12.0%Tipton 117 618 15.9%Union 66 479 12.1%Vanderburgh 2019 14,701 12.1%Vermillion 180 1195 13.1%Vigo 1524 9863 13.4%Wabash 346 2394 12.6%Warren 63 463 12.0%Warrick 263 2422 9.8%Washington 296 2381 11.1%Wayne 796 6162 11.4%Wells 231 1180 16.4%White 208 1880 10.0%Whitley 139 1287 9.7%Total 58,848 509,588 11.5% Table 6 Number and prevalence of asthma in a Medicaid cohort of
children age 0 – 17 years, by County: Indiana Medicaid FY 2003 Source: OMPP Note: The number/prevalence estimates for large counties, e.g. Marion County, may be artificially low due to shadow claims. County N with one dx or
three Rx’s in FY’03
N in Medicaid in June 2003
Prevalence
Adams 149 1,277 11.7Allen 2,072 19,776 10.5Bartholomew 413 3,466 11.9Benton 44 486 9.1Blackford 75 949 7.9Boone 161 1,300 12.4Brown 75 748 10.0Carroll 77 730 10.5

Updated 12/30/2004 Indiana Joint Asthma Coalition
36
Cass 219 2,544 8.6Clark 500 4,690 10.7Clay 201 1,678 12.0Clinton 150 1,925 7.8Crawford 52 878 5.9Davies 346 2,013 17.2Dearborn 124 1,636 7.6Decatur 159 1,180 13.5DeKalb 172 1,706 10.1Delaware 966 7,293 13.2Dubois 116 1,204 9.6Elkhart 635 10,901 5.8Fayette 224 1,744 12.8Floyd 501 3,546 14.1Fountain 95 980 9.7Franklin 104 1,066 9.8Fulton 157 1,318 11.9Gibson 107 1,506 7.1Grant 586 5,238 11.2Greene 264 2,259 11.7Hamilton 310 3,150 9.8Hancock 159 1,500 10.6Harrison 146 1,593 9.2Hendricks 246 2,157 11.4Henry 294 2,882 10.2Howard 612 4,817 12.7Huntington 277 1,725 16.1Jackson 205 1,740 11.8Jasper 96 1,330 7.2Jay 164 1,262 13.0Jefferson 273 1,797 15.2Jennings 269 1,812 14.8Johnson 420 3,735 11.2Knox 310 2,615 11.9Kosciusko 254 2,873 8.8LaGrange 51 800 6.4Lake 4,162 39,679 10.5LaPorte 864 6,528 13.2Lawrence 442 2,716 16.3Madison 989 8,465 11.7Marion 6,684 69,373 9.6Marshall 164 2,075 7.9Martin 101 749 13.5Miami 222 2,169 10.2Monroe 728 4,726 15.4

Updated 12/30/2004 Indiana Joint Asthma Coalition
37
Montgomery 304 1,913 15.9Morgan 375 3,248 11.5Newton 43 668 6.4Noble 150 1,775 8.5Ohio less than 40 200 not reported Orange 175 1,565 11.2Owen 204 1,642 12.4Parke 88 971 9.1Perry 78 820 9.5Pike 60 734 8.2Porter 522 5,017 10.4Posey 102 1,091 9.3Pulaski 67 786 8.5Putnam 155 1,614 9.6Randolph 202 1,704 11.9Ripley 118 1,264 9.3Rush 78 894 8.7St. Joseph 178 1,787 10.0Scott 279 1,892 14.7Shelby 67 839 8.0Spencer 1,192 18,281 6.5Starke 183 1,764 10.4Steuben 119 1,371 8.7Sullivan 182 1,481 12.3Switzerland 40 469 8.5Tippecanoe 643 6,160 10.4Tipton 72 475 15.2Union less than 40 383 not reported Vanderburgh 1,104 11,008 10.0Vermillion 104 934 11.1Vigo 811 7,550 10.7Wabash 217 1,817 11.9Warren less than 40 373 not reported Warrick 158 1,882 8.4Washington 159 1,734 9.2Wayne 439 4,621 9.5Wells 135 988 13.7White 131 1,528 8.6Whitley 89 953 9.3Total 36,308 350,501 10.4

Updated 12/30/2004 Indiana Joint Asthma Coalition
38
Table 7 Number and prevalence of asthma in a Medicaid cohort of adults age 18 – 64 years, by County:
Indiana Medicaid FY 2003 Source: OMPP Note: The number/prevalence estimates for large counties, e.g. Marion County, may be artificially low due to shadow claims. County N with one dx or
three Rx’s in FY’03
N in Medicaid in June 2003
Prevalence
Adams 78 590 13.2Allen 916 8,279 11.1Bartholomew 324 1,596 20.3Benton less than 40 160 not reported Blackford 72 504 14.3Boone 88 590 14.9Brown 53 289 18.3Carroll less than 40 265 not reported Cass 175 1,241 14.1Clark 495 2,506 19.8Clay 154 819 18.8Clinton 95 733 13.0Crawford 91 451 20.2Davies 189 1,086 17.4Dearborn 115 836 13.8Decatur 91 572 15.9DeKalb 95 712 13.3Delaware 647 4,002 16.2Dubois 70 603 11.6Elkhart 464 4,194 11.1Fayette 163 1,077 15.1Floyd 346 2,166 16.0Fountain 61 398 15.3Franklin 69 510 13.5Fulton 77 500 15.4Gibson 95 725 13.1Grant 381 2,609 14.6Greene 191 987 19.4Hamilton 207 1,270 16.3Hancock 121 748 16.2Harrison 133 849 15.7Hendricks 104 766 13.6Henry 259 1,570 16.5Howard 431 2,427 17.8Huntington 100 712 14.0Jackson 155 797 19.4

Updated 12/30/2004 Indiana Joint Asthma Coalition
39
Jasper 68 557 12.2Jay 106 531 20.0Jefferson 195 950 20.5Jennings 115 857 13.4Johnson 316 1,789 17.7Knox 292 1,703 17.1Kosciusko 140 1,152 12.2LaGrange 55 361 15.2Lake 2,192 18,843 11.6LaPorte 440 2,832 15.5Lawrence 245 1,305 18.8Madison 788 4,254 18.5Marion 3,007 27,184 11.1Marshall 100 816 12.3Martin 61 350 17.4Miami 162 985 16.4Monroe 384 2,323 16.5Montgomery 141 929 15.2Morgan 240 1,548 15.5Newton 56 325 17.2Noble 115 817 14.1Ohio less than 40 99 not reported Orange 133 889 15.0Owen 105 629 16.7Parke 80 595 13.4Perry 73 492 14.8Pike 64 397 16.1Porter 358 2,411 14.8Posey 96 577 16.6Pulaski 62 372 16.7Putnam 86 687 12.5Randolph 115 690 16.7Ripley 112 593 18.9Rush 67 405 16.5St. Joseph 179 1,105 16.2Scott 192 984 19.5Shelby 68 387 17.6Spencer 780 7,163 10.9Starke 107 828 12.9Steuben 90 555 16.2Sullivan 129 738 17.5Switzerland 65 258 25.2Tippecanoe 415 2,656 15.6Tipton 45 260 17.3Union less than 40 162 not reported

Vanderburgh 915 5,712 16.0Vermillion 76 441 17.2Vigo 713 3,837 18.6Wabash 129 923 14.0Warren less than 40 153 not reported Warrick 105 803 13.1Washington 137 943 14.5Wayne 357 2,337 15.3Wells 96 423 22.7White 77 560 13.8Whitley 50 473 10.6Total 22,540 159,087 14.2
Measures of Severity
Morbidity The following statistics are derived from responses to the BRFSS optional asthma history module, which was included in Indiana’s BRFSS survey in 2001. The asthma history module asked a number of survey questions that dealt with the severity of asthma. All respondents to this module had answered “yes” to the lifetime asthma core question in the BRFSS survey, indicating they had been told by a doctor, nurse or other health care professional that they had asthma. Asthma symptoms
42.6% of the respondents reported having asthma symptoms on less than 1 day in the past month.
17.3% of the respondents reported having asthma symptoms every day.
Asthma attacks
54.9% of the respondents with current asthma had an asthma attack in the previous 12 months.
62.3% of those who reported asthma attacks were female, 40.7% male.
Emergency room or urgent care center visits
17.9% of respondents with current asthma went to the emergency room or urgent care center because of their asthma.
Updated 12/30/2004 Indiana Joint Asthma Coalition
40

The highest percentage of emergency room or urgent care center use for asthma
was seen in unmarried respondents (23.4% vs. 13.3% for married) and those whose highest educational level was a high school diploma or GED (25.4%).
19.2% of females and 15.6% of males with current asthma went to the emergency room or urgent care center because of their asthma.
19.9% of respondents with annual incomes less than $15,000 who currently have
asthma went to the emergency room or urgent care center because of their asthma.
Unscheduled visit to health care professional
Overall, 29.5% of respondents reporting current asthma were seen by a health care professional in an unscheduled visit for urgent treatment of their asthma.
34.2% of females reporting current asthma were seen in an unscheduled visit for
urgent treatment of their asthma, compared to 20.5% of males.
25.3% of respondents reporting current asthma who earned less than $15,000 a year and 33.9% of respondents who earned between $15,000 – $24,999 a year were seen in an unscheduled visit for urgent treatment of their asthma.
31.6% of married respondents reporting current asthma were seen for urgent
treatment of their asthma, compared to 27.1% of unmarried respondents, a reversal of the trend seen in emergency room data.
Severity in Children Severity of asthma in a cohort of 23,161 children ages 0 to 17 who were continuously enrolled in Medicaid for at least 11 of 12 months during Fiscal Year 2003. Cases selected for inclusion used the OMPP case definition of asthma and included only those with paid claims.
o 18% had an emergency room visit with any diagnosis of asthma o 6% were hospitalized with any diagnosis of asthma o 10% had an emergency room visit with a principal diagnosis of asthma o 4% were hospitalized with a principal diagnosis of asthma
Severity in Adults Severity of asthma in a cohort of 20,030 adults ages 18 to 64 who were continuously enrolled in Medicaid for at least 11 of 12 months during Fiscal Year 2003. Cases selected for inclusion used the OMPP case definition of asthma and included only those with paid claims.
Updated 12/30/2004 Indiana Joint Asthma Coalition
41

o 18% had an emergency room visit with any diagnosis of asthma o 10% were hospitalized with any diagnosis of asthma o 10% had an emergency room visit with a principal diagnosis of asthma o 5% were hospitalized with a principal diagnosis of asthma
Hospitalizations The trend of hospital discharges in Indiana indicating a main diagnosis of asthma has been decreasing from 1997 through 2002. The following figures show the hospital discharge data for 2002. The prevalence of asthma is greater in young boys. The hospitalization rate is highest in males under the age of five. During puberty, however, the prevalence and hospitalization rates reverse. From that age, females have the highest prevalence and hospitalization rates for asthma. It is important to note that the number of hospitalizations is not the same as the number of people hospitalized for asthma, since some people may have been hospitalized more than once during the year. Counts and rates, especially those based on a small number of hospitalizations, should be interpreted with caution. The rate of hospitalizations for asthma was highest among black males under the age of five. There were not enough hospitalizations in the Hispanic community to calculate stable hospitalization rates. The data show disparities in hospitalization rates for asthma between the white and black populations. The largest number of hospitalizations was among females between the ages of 40 and 59 and children, especially boys, under the age of five. This pattern was present in all racial groups. The number of hospitalizations is important when looking at cost and number of hospital beds needed for care. Figure 18 Indiana Hospitalizations* for Asthma 1997 - 2002 Source: Indiana Hospital&Health Association *Asthma was listed as the discharge diagnosis
Updated 12/30/2004 Indiana Joint Asthma Coalition
42
9,9589,247 9,057 8,916 8,174 8,215
0
5,000
10,000
15,000
1997 1998 1999 2000 2001 2002
Num
ber
of Ast
hm
a H
osp
italiz
ations
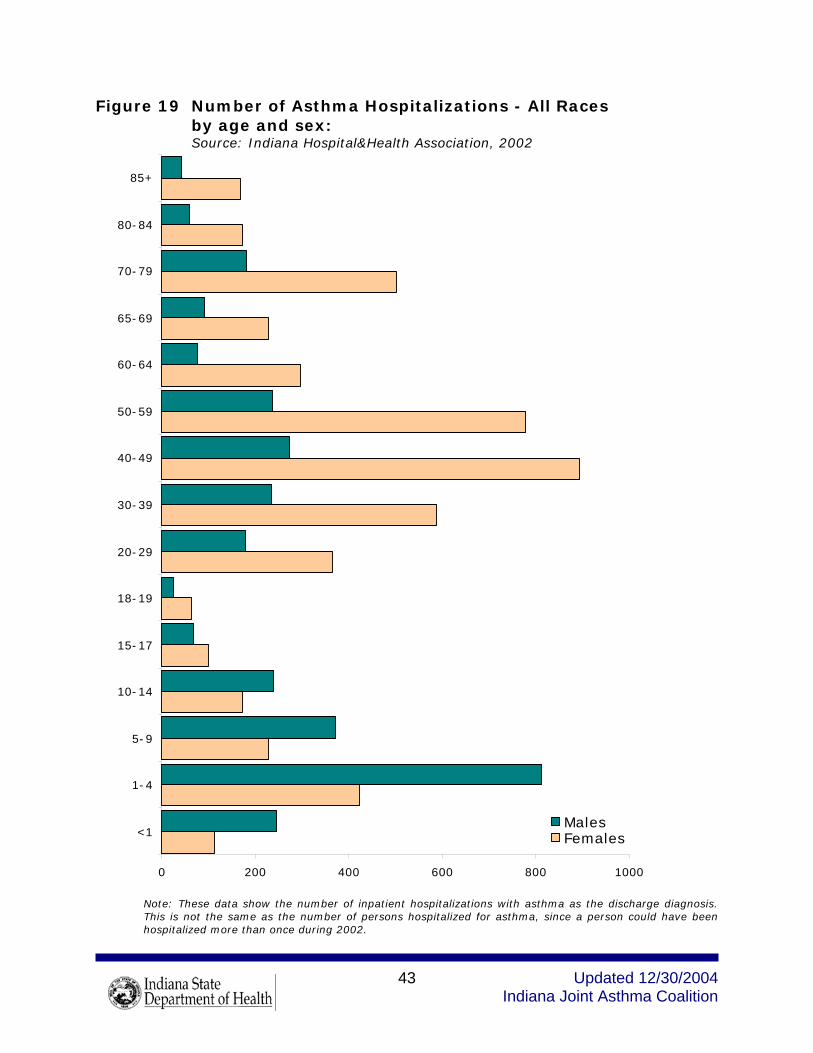
Figure 19 Number of Asthma Hospitalizations - All Races
by age and sex: Source: Indiana Hospital&Health Association, 2002
0 200 400 600 800 1000
<1
1-4
5-9
10-14
15-17
18-19
20-29
30-39
40-49
50-59
60-64
65-69
70-79
80-84
85+
MalesFemales
Note: These data show the number of inpatient hospitalizations with asthma as the discharge diagnosis. This is not the same as the number of persons hospitalized for asthma, since a person could have been hospitalized more than once during 2002.
Updated 12/30/2004 Indiana Joint Asthma Coalition
43
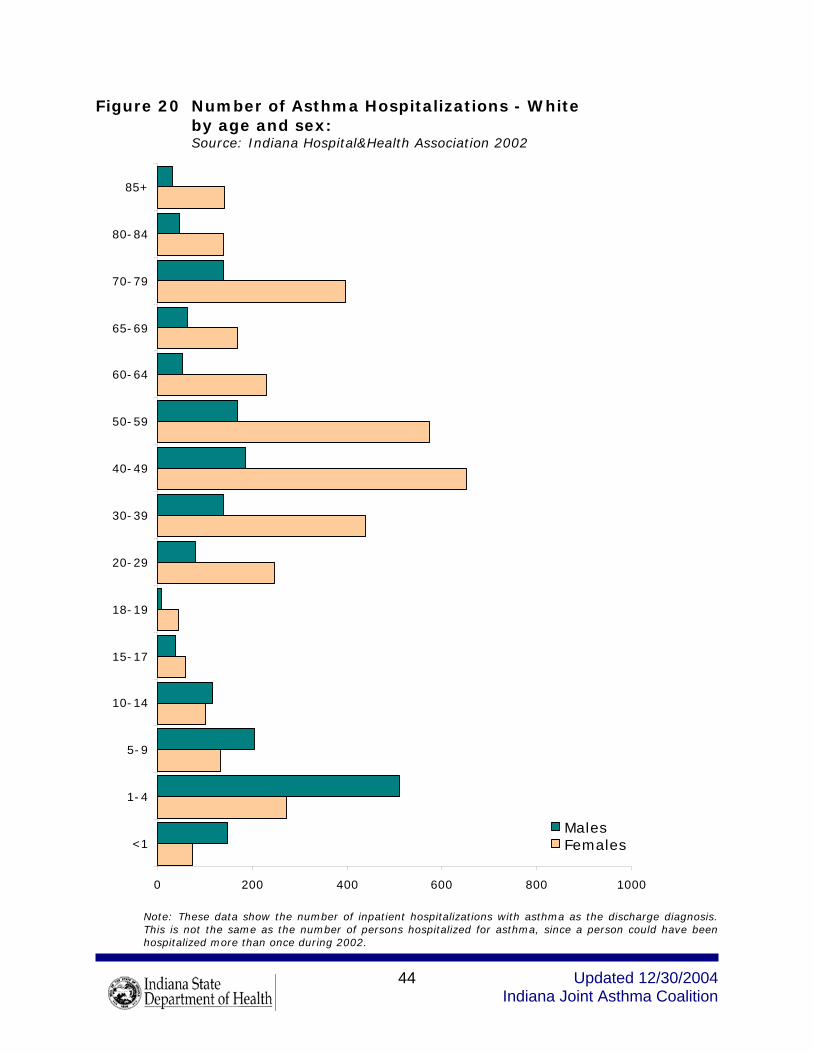
Figure 20 Number of Asthma Hospitalizations - White
by age and sex: Source: Indiana Hospital&Health Association 2002
0 200 400 600 800 1000
<1
1-4
5-9
10-14
15-17
18-19
20-29
30-39
40-49
50-59
60-64
65-69
70-79
80-84
85+
MalesFemales
Updated 12/30/2004 Indiana Joint Asthma Coalition
44
Note: These data show the number of inpatient hospitalizations with asthma as the discharge diagnosis. This is not the same as the number of persons hospitalized for asthma, since a person could have been hospitalized more than once during 2002.

Figure 21 Number of Asthma Hospitalizations - Black
by age and sex: Source: Indiana Hospital&Health Association 2002
0 100 200 300 400 500 600 700 800 900 1000
<1
1-4
5-9
10-14
15-17
18-19
20-29
30-39
40-49
50-59
60-64
65-69
70-79
80-84
85+
MalesFemales
Note: These data show the number of inpatient hospitalizations with asthma as the discharge diagnosis. This is not the same as the number of persons hospitalized for asthma, since a person could have been hospitalized more than once during 2002.
Updated 12/30/2004 Indiana Joint Asthma Coalition
45

Figure 22 Asthma Hospitalization Rate - All Races
by age and sex: Age-specific hospital discharge rates per 100,000 population Source: Indiana Hospital&Health Association 2002
0 1,000 2,000 3,000 4,000 5,000
<1
1-4
5-9
10-14
15-17
18-19
20-29
30-39
40-49
50-59
60-64
65-69
70-79
80-84
85+
MalesFemales
Updated 12/30/2004 Indiana Joint Asthma Coalition
46
Note: Rates are based on the number of inpatient hospitalizations with asthma as the discharge diagnosis. This is not the same as the number of persons hospitalized for asthma, since a person could have been hospitalized more than once during 2002.

Figure 23 Asthma Hospitalization Rate - White
by age and sex: Age-specific hospital discharge rates per 100,000 Source: Indiana Hospital&Health Association 2002 * Rates may be unreliable due to small numbers
Updated 12/30/2004 Indiana Joint Asthma Coalition
47
0 1,000 2,000 3,000 4,000 5,000
<1
1-4
5-9
10-14
15-17
18-19
20-29
30-39
40-49
50-59
60-64
65-69
70-79
80-84
85+
MalesFemales
*
*
Note: Rates are based on the number of inpatient hospitalizations with asthma as the discharge diagnosis. This is not the same as the number of persons hospitalized for asthma, since a person could have been hospitalized more than once during 2002.

Figure 24 Asthma Hospitalization Rate - Black
by age and sex: Age-specific discharge rates per 100,000 Source: Indiana Hospital&Health Association 2002
* Rates may be unreliable due to small numbers
Updated 12/30/2004 Indiana Joint Asthma Coalition
48
0 1,000 2,000 3,000 4,000 5,000
<1
1-4
5-9
10-14
15-17
18-19
20-29
30-39
40-49
50-59
60-64
65-69
70-79
80-84
85+
MalesFemales
*
*
*
*
**
*
*
*
Note: Rates are based on the number of inpatient hospitalizations with asthma as the discharge diagnosis. This is not the same as the number of persons hospitalized for asthma, since a person could have been hospitalized more than once during 2002.

Mortality Mortality data are derived from deaths of Indiana residents, and are based on the cause of death listed on the Indiana death certificate. Information is provided to the state on each cause of death under the authority of Indiana State Code 16-1-15-5. In 1997 and 1998, the International Statistical Classification of Diseases and Related Health Problems Ninth Revision (ICD-9) codes were used to specify the cause of death. Beginning in 1999, ICD-10 codes were used. For the Indiana mortality data that follow, the 1997 and 1998 death rates have been comparability adjusted (comparability ratio of .8938) for the change from ICD-9 to ICD-10 coding. Death rates have been age-adjusted to the year 2000 population. From 1997 through 2001, the number and rate of asthma deaths in Indiana have been decreasing. In 2001, there were 63 deaths attributed to asthma. 76.2% of those deaths were in whites, 22.2% were in blacks. The largest number of deaths (17 or 30%) occurred in the 85 and older age group. Figure 25 Indiana Asthma Mortality 1997 – 2002 Number of Deaths Source: Indiana State Department of Health
79
110
92104
81
63
0
50
100
150
1997 1998 1999 2000 2001 2002
Num
ber
of
Dea
ths
Note: In 1997 and 1998, ICD-9 coding was used to determine the number of asthma deaths. Beginning in 1999, ICD-10 coding was used to determine the number of asthma deaths. Deaths across this change cannot be compared without adjusting for the change in coding. Therefore, the number of deaths in 1997 and 1998 have been comparability adjusted (comparability ratio of .8938) for the change to ICD-10 coding.
Updated 12/30/2004 Indiana Joint Asthma Coalition
49

Figure 26 Indiana Asthma Mortality 1997 – 2002 Rate per 100,000
Source: Indiana State Department of Health
1.11.3
1.81.61.9
1.3
0
1
2
3
4
5
1997 1998 1999 2000 2001 2002
Dea
th r
ate
per
100,0
00
Note: death rates have been age adjusted to the year 2000 population. The 1997 and 1998 death rates have been comparability adjusted (comparability ratio of .8938) for the change to ICD-10 coding in 1999.
Cost of Asthma
Financial Costs The Asthma and Allergy Foundation of America has estimated the costs of asthma for the United States, as well as for individual states. Their estimates include both direct and indirect costs related to asthma. Direct costs are comprised of hospital care, both inpatient and outpatient, emergency care, physician care, and medications. Indirect costs relate to time lost from either school or work (defined to include both outside work and housekeeping.) In1998 direct medical expenditures for asthma in the State of Indiana were estimated to be $161,599,000; indirect costs were estimated to be $116,631,000, for a total of $278,230,000.
Updated 12/30/2004 Indiana Joint Asthma Coalition
50
Medicaid administrative claims data for FY 2003 provided some useful information about the financial costs of asthma in the Medicaid population. As indicated in Figures 27 and 28, the costs directly attributable to asthma are a relatively small percentage of total medical costs, and those in the highest percentiles for total medical costs are those in the highest cost percentiles for asthma medical costs. Among children with claims for asthma services or three or more asthma medications, the average cost of asthma care was $557 per child in FY2003. For adults with asthma, the average annual cost was $880 per person. However, the cost burden was not evenly shared. A small fraction of persons with asthma incurred a large fraction of the costs.

It is important to note that direct medical costs for asthma in the Indiana Medicaid population were, for the most part, low and relatively stable through about the 50th percentile in both adults and children. From the 50th percentile on, costs increased dramatically. In the Medicaid cohort of 23,161 children under the age of 18, the children with the most costly asthma had direct asthma medical costs that reached $125,295 in a year. In the cohort of 20,030 adults, ages 18 – 64, the highest direct asthma medical costs reached $82,005. These findings are comparable to those of Cisternas, et al. (2003). This study found that the direct medical costs of asthma increased dramatically with self-reported asthma severity. They found the average direct medical costs (adjusted to 1998 dollars) were $1,681 for those with mild asthma, $2473 for those with moderate asthma and $6,354 for those with severe asthma. Overall direct medical costs of asthma were $2,697, with asthma medicines accounting for slightly more than half the direct medical costs at $1,605. Cisternas, M. G., Blanc, P. D., Yen, I. H., Katz, P. P., Earnest, G., Eisner, M. D., Shiboski, S., & Yelin, E. H. (2003). A comprehensive study of the direct and indirect costs of adult asthma [Electronic version]. Journal of Allergy and Clinical Immunology, 111, 1212-1218. Figure 27 Direct medical costs of asthma in a Medicaid cohort of children age 0—17: Indiana Medicaid FY 2003
Source: OMPP
Updated 12/30/2004 Indiana Joint Asthma Coalition
51
$30 million
$20 million
Costs in each percentile of total costs (N=23,161 children age 0 to < 18 years)
0
$10 million
Total costs
Each column represents one percentile (231-232 children)
50th 90th80th
$5 million
$5 million
0
Total costs
Asthma costs
Re-scaled y-axis view to showasthma-claim costs as a componentof total claims costs
50th 90th80th
FY’03 dataOMPP case definition

Figure 28 Direct medical costs of asthma in a Medicaid cohort of
Adults age 18—64: Indiana Medicaid 2003 Source: OMPP
C
$30 million
$20 million
osts in each percentile of total costs (N=20,030 adults age 18 to < 65 years)
0
$10 million
Total costs
Each column represents one percentile (200-201 adults)
50th 90th80th
$5 million
$5 million
0
Total costs
Asthma costs
Re-scaled y-axis view to showasthma-claim costs as a componentof total claims costs
50th 90th80th
FY’03 dataOMPP case definition
Updated 12/30/2004 Indiana Joint Asthma Coalition
52

Quality of Life The following charts derived from BRFSS survey data depict some of the impact of asthma on quality of life by comparing the responses of those who reported they had asthma with those who did not have asthma. Although causality cannot be proven by association, it appears that Indiana citizens with asthma are more likely to report that, they felt sad, blue or depressed, that they were worried, tense or anxious, and that they had not had enough rest or sleep.
Respondents with asthma were less likely to report feeling very healthy and full of energy.
Among respondents who reported their perceived health status to be poor,
19.2% had asthma.
Of respondents who reported their perceived health status to be excellent, only 3.8% had asthma.
Figure 29 Reported health status, distribution in respondents with/without current asthma: Indiana 2002 Source: Indiana BRFSS 2002
9.5
25.1
34.1
19.5
11.3
19.5
33.831.4
11.3
3.8
0
10
20
30
40
Excellent Very Good Good Fair Poor
Perc
ent
Adults with Current AsthmaAdults without Current Asthma
Percentage breakdown of categories within survey populations of respondents with/without current asthma. Percentages may not add up to 100% because respondents who refused to answer, or answered “unknown” to the category questions are not shown. Survey population of adults with current asthma are respondents who answered “yes” to both asthma core questions: “Have you ever been told by a doctor, nurse or other health professional that you have asthma?” and “Do you still have asthma?”
Updated 12/30/2004 Indiana Joint Asthma Coalition
53
Survey population of adults without current asthma are respondents who answered “no” to either of the above questions.

Figure 30 Number of days felt healthy in the last month, distribution in respondents with/without current asthma:
Indiana 2002 Source: Indiana BRFSS 2002
15.7
12.0
34.9
19.2
14.8
21.419.8
34.3
11.610.0
0
10
20
30
40
30 21-29 10-20 <10 None
Perc
ent
Adults with Current AsthmaAdults without Current Asthma
Percentage breakdown of categories within survey populations of respondents with/without current asthma. Percentages may not add up to 100% because respondents who refused to answer, or answered “unknown” to the category questions are not shown. Survey population of adults with current asthma are respondents who answered “yes” to both asthma core questions: “Have you ever been told by a doctor, nurse or other health professional that you have asthma?” and “Do you still have asthma?” Survey population of adults without current asthma are respondents who answered “no” to either of the above questions.
Updated 12/30/2004 Indiana Joint Asthma Coalition
54

Figure 31 Number of days felt sad, blue or depressed in last month, percent distribution in respondents with/without current
asthma: Indiana 2002 Source: BRFSS 2002
50.1
26.0
9.2 10.3
61.2
27.5
6.32.8
0
10
20
30
40
50
60
70
None <10 10-20 Every Day
Perc
ent
Adults with Current AsthmaAdults without Current Asthma
Percentage breakdown of categories within survey populations of respondents with/without current asthma. Percentages may not add up to 100% because respondents who refused to answer, or answered “unknown” to the category questions are not shown. Survey population of adults with current asthma are respondents who answered “yes” to both asthma core questions: “Have you ever been told by a doctor, nurse or other health professional that you have asthma?” and “Do you still have asthma?” Survey population of adults without current asthma are respondents who answered “no” to either of the above questions.
Updated 12/30/2004 Indiana Joint Asthma Coalition
55

Figure 32 Number of days felt stressed during the last month, percent distribution in respondents with/without current asthma: Indiana 2002 Source: BRFSS 2002
32.5 33.0
17.3
1.6
12.9
41.1
35.7
12.9
1.2
7.2
0
10
20
30
40
50
None <10 10-20 21-29 30
Perc
ent
Adults with Current AsthmaAdults without Current Asthma
Percentage breakdown of categories within survey populations of respondents with/without current asthma. Percentages may not add up to 100% because respondents who refused to answer, or answered “unknown” to the category questions are not shown. Survey population of adults with current asthma are respondents who answered “yes” to both asthma core questions: “Have you ever been told by a doctor, nurse or other health professional that you have asthma?” and “Do you still have asthma?” Survey population of adults without current asthma are respondents who answered “no” to either of the above questions.
Updated 12/30/2004 Indiana Joint Asthma Coalition
56

Figure 33 Number of days didn’t get enough rest during the last month, percent distribution in respondents with/without current asthma: Indiana 2002 Source: BRFSS 2002
20.0
26.329.7
3.4
18.2
28.7
33.9
22.6
2.8
11.1
0
10
20
30
40
50
None <10 10-20 21-29 30
Perc
ent
Adults with Current AsthmaAdults without Current Asthma
Percentage breakdown of categories within survey populations of respondents with/without current asthma. Percentages may not add up to 100% because respondents who refused to answer, or answered “unknown” to the category questions are not shown. Survey population of adults with current asthma are respondents who answered “yes” to both asthma core questions: “Have you ever been told by a doctor, nurse or other health professional that you have asthma?” and “Do you still have asthma?” Survey population of adults without current asthma are respondents who answered “no” to either of the above questions.
Quality of Asthma Care It is recommended in the asthma care consensus guidelines of the National Heart Lung and Blood Institute (NHLBI) that patients with asthma have at least two scheduled visits annually to care for their asthma. The NHLBI guidelines also recommend that people with “persistent” asthma be managed with a controller medication (e.g., inhaled steroids). The NCQA case definition for persistent asthma, based on claims data, makes it possible to examine the rates at which this recommendation is followed among people in Indiana with persistent asthma.
Updated 12/30/2004 Indiana Joint Asthma Coalition
57
Finally it is recommended that all people with asthma receive an annual influenza vaccine.

Only 52.5% of BRFSS respondents with current asthma indicated they had at
least one routine checkup for their asthma in the past 12 months.
Respondents with the highest percentage of at least one routine checkup for their current asthma were those with annual household incomes less than $15,000 (65.8%) and those with less than a high school education (60.9%).
Of respondents with current asthma, 59.6% of women vs. 38.7% of men had at least one routine checkup for their asthma.
The age group with the highest rate of routine visits for their current asthma was the 35-44 age group (61.3%). The age group with the lowest percentage of routine visits for their current asthma was the 45-54 age group (45.3%).
Figure 34 Current asthma prevalence by medical care in last year: Indiana 2002 Source: Indiana BRFSS 2002
6.4
10.9
0
5
10
15
Received Care in Last Year Did not Receive Care in Last Year
Perc
ent
Percentage of respondents within each category who answered “yes” to the questions: “Have you ever been told by a doctor, nurse or other health professional that you have asthma?” and “Do you still have asthma?”
Updated 12/30/2004 Indiana Joint Asthma Coalition
58

Figure 35 Medical care in last year, percent distribution in respondents with/without current asthma: Indiana 2002 Source: Indiana BRFSS 2002
27.3
72.7
Yes No
40.2
59.7
Yes No Adults with Current Asthma Adults without Current Asthma Percentage breakdown of categories within survey populations of respondents with/without current asthma. Percentages may not add up to 100% because respondents who refused to answer, or answered “unknown” to the category questions are not shown. Survey population of adults with current asthma are respondents who answered “yes” to both asthma core questions: “Have you ever been told by a doctor, nurse or other health professional that you have asthma?” and “Do you still have asthma?” Survey population of adults without current asthma are respondents who answered “no” to either of the above questions.
Figure 36 Current asthma prevalence by healthcare coverage: Indiana 2002 Source: Indiana BRFSS 2002
9.1
7.3
0
5
10
15
Healthcare Coverage No Healthcare Coverage
Perc
ent
Updated 12/30/2004 Indiana Joint Asthma Coalition
59
Percentage of respondents within each category who answered “yes” to the questions: “Have you ever been told by a doctor, nurse or other health professional that you have asthma?” and “Do you still have asthma?”

Figure 37 Healthcare coverage, percent distribution in respondents with/without current asthma: Indiana 2002 Source: Indiana BRFSS 2002
17.8
82.2
Yes No
14.3
85.2
Yes No
Adults with Current Asthma Adults without Current Asthma Percentage breakdown of categories within survey populations of respondents with/without current asthma. Percentages may not add up to 100% because respondents who refused to answer, or answered “unknown” to the category questions are not shown. Survey population of adults with current asthma are respondents who answered “yes” to both asthma core questions: “Have you ever been told by a doctor, nurse or other health professional that you have asthma?” and “Do you still have asthma?” Survey population of adults without current asthma are respondents who answered “no” to either of the above questions.
Figure 38 Current asthma prevalence by place of usual care: Indiana 2002 Source: Indiana BRFSS 2002
3.8
7.57.3
5.2
13.7
11.0
7.2
0
5
10
15
Doctor'soffice
Public health clinic/CHC
HospitalER
Hospitaloutpatient
Urgent care center
Other No usualplace
Perc
ent
Updated 12/30/2004 Indiana Joint Asthma Coalition
60
Percentage of respondents within each category who answered “yes” to the questions: “Have you ever been told by a doctor, nurse or other health professional that you have asthma?” and “Do you still have asthma?”

Figure 39 Place of usual care, percent distribution in respondents with/without current asthma: Indiana 2002 Source: Indiana BRFSS 2002
74.0
7.6
1.2
2.42.8
9.2
2.5
Doctor's Office Public Health Clinic or CHCHospital Outpatient Hospital Emergency RoomUrgent Care Center OtherNo usual place
77.6
5.0
1.8
2.32.9
4.7
5.2
Doctor's Office Public Health Clinic or CHCHospital Outpatient Hospital Emergency RoomUrgent Care Center OtherNo usual place
Adults with Current Asthma Adults without Current Asthma Percentage breakdown of categories within survey populations of respondents with/without current asthma. Percentages may not add up to 100% because respondents who refused to answer, or answered “unknown” to the category questions are not shown. Survey population of adults with current asthma are respondents who answered “yes” to both asthma core questions: “Have you ever been told by a doctor, nurse or other health professional that you have asthma?” and “Do you still have asthma?” Survey population of adults without current asthma are respondents who answered “no” to either of the above questions.
Figure 40 Current asthma prevalence by ability to obtain medical care in last 6 months: Indiana 2002 Source: Indiana BRFSS 2002
17.8
6.9
0
5
10
15
20
Unable to get care in past 6 months Able to get care in past 6 months
Perc
ent
Updated 12/30/2004 Indiana Joint Asthma Coalition
61
Percentage of respondents within each category who answered “yes” to the questions: “Have you ever been told by a doctor, nurse or other health professional that you have asthma?” and “Do you still have asthma?”

Figure 41 Ability to obtain medical care in last 6 months, percent distribution in respondents with/without current asthma: Indiana 2002 Source: Indiana BRFSS 2002
86.4
13.3
Unable to get medical care in last 6 monthsAble to get medical care in the last 6 months
94.8
5.0
Unable to get medical care in last 6 monthsAble to get medical care in the last 6 months
Adults with Current Asthma Adults without Current Asthma Percentage breakdown of categories within survey populations of respondents with/without current asthma. Percentages may not add up to 100% because respondents who refused to answer, or answered “unknown” to the category questions are not shown. Survey population of adults with current asthma are respondents who answered “yes” to both asthma core questions: “Have you ever been told by a doctor, nurse or other health professional that you have asthma?” and “Do you still have asthma?” Survey population of adults without current asthma are respondents who answered “no” to either of the above questions.
Updated 12/30/2004 Indiana Joint Asthma Coalition
62

Figure 42 Receipt of flu shot in last 12 months, percent distribution in respondents with/without current asthma: Indiana 2002 Source: BRFSS 2002
65.4
34.2
Yes No
69.5
30.3
Yes No
Adults with Current Asthma Adults without Current Asthma Percentage breakdown of categories within survey populations of respondents with/without current asthma. Percentages may not add up to 100% because respondents who refused to answer, or answered “unknown” to the category questions are not shown. Survey population of adults with current asthma are respondents who answered “yes” to both asthma core questions: “Have you ever been told by a doctor, nurse or other health professional that you have asthma?” and “Do you still have asthma?” Survey population of adults without current asthma are respondents who answered “no” to either of the above questions.
Updated 12/30/2004 Indiana Joint Asthma Coalition
63

Figure 43 Rx Claims for Inhaled Steroids for Children under 18 Indiana Medicaid FY 2003 Source: OMPP
0500
10001500200025003000350040004500
1 2 3 4 5 6 7 8 9 10
Number of inhaled steroid prescriptions per person
0
N o
f chi
ldre
n
21
37% of the 10,783
17% of the 10,783
Annual number of prescriptions for inhaled steroids among children with persistent asthma: According to NHLBI guidelines, children and adults with persistent asthma should use controller medicines daily. This schedule would require several prescriptions annually. The majority of children with asthma do not receive this recommended number of prescriptions. Note: This figure shows the number of prescription claims for inhaled steroids in the Medicaid cohort of 10,783 children <18 who were identified with persistent asthma using the NCQA case definition and who were also enrolled in Medicaid at least 11 of 12 months during FY 2003. .
Updated 12/30/2004 Indiana Joint Asthma Coalition
64

Figure 44 Office Visits for Asthma in Children under 18 Indiana Medicaid FY 2003 Source: OMPP
Updated 12/30/2004 Indiana Joint Asthma Coalition
65
4500450039% of the 10,783
Annual number of physician office visits for children with persistent asthma: According to NHLBI guidelines, children and adults with asthma should be seen by a physician at least twice annually. The majority of children with asthma do not receive this recommended level of care. Note: This figure shows the number of office visits the Medicaid cohort of 10,783 children <18 who were identified with persistent asthma using the NCQA case definition and who were also enrolled in Medicaid at least 11 of 12 months during FY 2003.
0500
1000150020002500300035004000
1 2 3 4 5 6 7 8 9 10Number of office visits
0 21
The ICD-9 code for asthma need not be the principal diagnosis.
22% of the 10,783
39% of the 10,78340003500 22% of the 10,78330002500200015001000
N o
f chi
ldre
n
5000
21 0 1 2 3 4 5 107 8 96Number of office visits
Office visit is as defined by the NCQA criteria.

Figure 45 Rx Claims for Inhaled Steroids in Adults 18 – 64 Indiana Medicaid FY 2003 Source: OMPP
Updated 12/30/2004 Indiana Joint Asthma Coalition
66
Annual number of prescriptions for inhaled steroids among adults with persistent asthma: According to NHLBI guidelines, children and adults with persistent asthma should use controller medicines daily. This schedule would require several prescriptions annually. The majority of adults with asthma do not receive this recommended number of prescriptions. Note: This figure shows the number of prescription claims for inhaled steroids in the Medicaid cohort of 13,544 adults ages 19-64 who were identified with persistent asthma using the NCQA case definition and who were also enrolled in Medicaid at least 11 of 12 months during FY 2003.
0
1000
2000
3000
4000
5000
6000
7000
1 2 3 4 5 6 7 8 9 10Number of inhaled steroid prescriptions per person
0 21
44% of the 13,544
13% of the 13,544
7000
44% of the 13,544
6000
5000 13% of the 13,544
4000
3000
2000
N o
f adu
lts
1000
01 2 3 4 5 6 7 8 9 10
Number of inhaled steroid prescriptions per person 0 21

Figure 46 Office Visits for Asthma in Adults 18 - 64 Indiana Medicaid FY 2003 Source: OMPP
Updated 12/30/2004 Indiana Joint Asthma Coalition
67
10000 10000 65% of the 13,544
Annual number of physician visits for adults with persistent asthma: According to NHLBI guidelines, children and adults with asthma should be seen by a physician at least twice annually. The majority of adults with asthma do not receive this recommended level of care. Note: This figure shows the number of office visits in the Medicaid cohort of 13,544 adults ages 19-64 who were identified with persistent asthma using the NCQA case definition and who were also enrolled in Medicaid at least 11 of 12 months during FY 2003.
0
1000
2000
3000
4000
5000
6000
7000
8000
9000
1 2 3 4 5 6 7 8 9 10Number of office visits
0 21
Office visit is as defined by the NCQA criteria. The ICD -9 code for asthma need not be the principal diagnosis.
16% of the 13,544
65% of the 13,5449000
8000
16% of the 13,5447000
6000
5000
4000
3000
N o
f adu
lts
2000
1000
0 0 1 2 3 4 5 7 8 9 10 216
Number of office visitsOffice visit is as defined by the NCQA criteria. The ICD -9 code for asthma need not be the principal diagnosis.

Environment The indoor environment can contain a number of asthma triggers, many of them difficult to measure or estimate, such as dust mites and pet dander in homes. Tobacco smoke is a significant asthma trigger, often found in the air indoors. Smoking habits, patterns and areas where smoking is allowed at work and at home can provide information about exposure to cigarette smoke – both from smoking and second-hand smoke, The following charts derived from the 2002 BRFSS survey compare the smoking patterns of respondents who reported they had asthma to those of respondents who reported they did not have asthma. A higher percentage of respondents with asthma started smoking younger than the age of 15 than those without asthma. A higher percentage of respondents with asthma started smoking regularly by age 15-19 than respondents without asthma. A higher percentage of respondents without asthma reported they had not smoked in 10 years or more than those with asthma. Indiana is one of the five worst states for smoking prevalence. Over 27% of adults in Indiana currently smoke. Surprisingly, more than 32% of adults with current asthma in Indiana currently smoke. Figure 47 Smoking status, percent distribution in respondents with/without current asthma: Indiana 2002 Source: BRFSS 2002
44.4
22.3
8.3
24.5
Smoke every day Smoke some daysFormer smoker Never smoked
49.5
23.4
4.3
22.8
Smoke every day Smoke some daysFormer smoker Never smoked
Adults with Current Asthma Adults without Current Asthma Percentage breakdown of categories within survey populations of respondents with/without current asthma. Percentages may not add up to 100% because respondents who refused to answer, or answered “unknown” to the category questions are not shown.
Updated 12/30/2004 Indiana Joint Asthma Coalition
68

Survey population of adults with current asthma are respondents who answered “yes” to both asthma core questions: “Have you ever been told by a doctor, nurse or other health professional that you have asthma?” and “Do you still have asthma?” Survey population of adults without current asthma are respondents who answered “no” to either of the above questions.
Figure 48 Age began smoking regularly, percent distribution in respondents with/without current asthma: Indiana 2002 Source: BRFSS 2002
19.7
5.5
1.9
39.5
28.4
3.0
<=10 11-1516-1819-24>=25Never smoked regularly
27.4
6.64.9
40.2
17.7
1.9
<=10 11-1516-1819-24>=25Never smoked regularly
Adults with Current Asthma Adults without Current Asthma Percentage breakdown of categories within survey populations of respondents with/without current asthma. Percentages may not add up to 100% because respondents who refused to answer, or answered “unknown” to the category questions are not shown. Survey population of adults with current asthma are respondents who answered “yes” to both asthma core questions: “Have you ever been told by a doctor, nurse or other health professional that you have asthma?” and “Do you still have asthma?” Survey population of adults without current asthma are respondents who answered “no” to either of the above questions.
Updated 12/30/2004 Indiana Joint Asthma Coalition
69

Figure 49 Prevalence of current asthma by age first began smoking: Indiana 2002 Source: BRFSS 2002
12.1 12.6
8.0
6.06.9
3.4
0
5
10
15
10 oryounger
11-15 16-18 19-24 25 or older Neversmokedregularly
Perc
ent
Percentage of respondents within each category who answered “yes” to the questions: “Have you ever been told by a doctor, nurse or other health professional that you have asthma?” and “Do you still have asthma?”
Figure 50 Percent distribution of smoking rules at home among respondents with current asthma: Indiana 2002 Source: BRFSS 2002
22.1
3.6
13.7
60.4
0
20
40
60
80
100
Perc
ent
Not allowedanywhere
Allowed in someareas
Allowed in allareas
No rules aboutsmoking
Updated 12/30/2004 Indiana Joint Asthma Coalition
70

Figure 51 Percent distribution of smoking rules in common areas at work among respondents with current asthma: Indiana 2002 Source: BRFSS 2002
7.14.4
19.5
68.8
0
20
40
60
80
100
Perc
ent
Not allowed in anypublic areas
Allowed in somepublic areas
Allowed in allpublic areas
No official policy
Figure 52 Percent distribution of smoking rules in work areas at work among respondents with current asthma: Indiana 2002 Source: BRFSS 2002
Updated 12/30/2004 Indiana Joint Asthma Coalition
71
4.9 5.79.2
80.2
0
20
40
60
80
100
Perc
ent
Not allowed inany work areas
Allowed in somework areas
Allowed in allwork areas
No official policy

Appendix Figure 1a Age, percent distribution in respondents with/without current asthma: Indiana 2002 Source: BRFSS 2002
19.4
11.4
15.0
22.3
17.0
14.1
18-24 25-34 35-4445-54 55-64 65+
18.1
12.7
16.5
20.4
17.8
13.8
18-24 25-34 35-4445-54 55-64 65+
Adults with Current Asthma Adults without Current Asthma Percentage breakdown of categories within survey populations of respondents with/without current asthma. Percentages may not add up to 100% because respondents who refused to answer, or answered “unknown” to the category questions are not shown. Survey population of adults with current asthma are respondents who answered “yes” to both asthma core questions: “Have you ever been told by a doctor, nurse or other health professional that you have asthma?” and “Do you still have asthma?” Survey population of adults without current asthma are respondents who answered “no” to either of the above questions.
Updated 12/30/2004 Indiana Joint Asthma Coalition
72
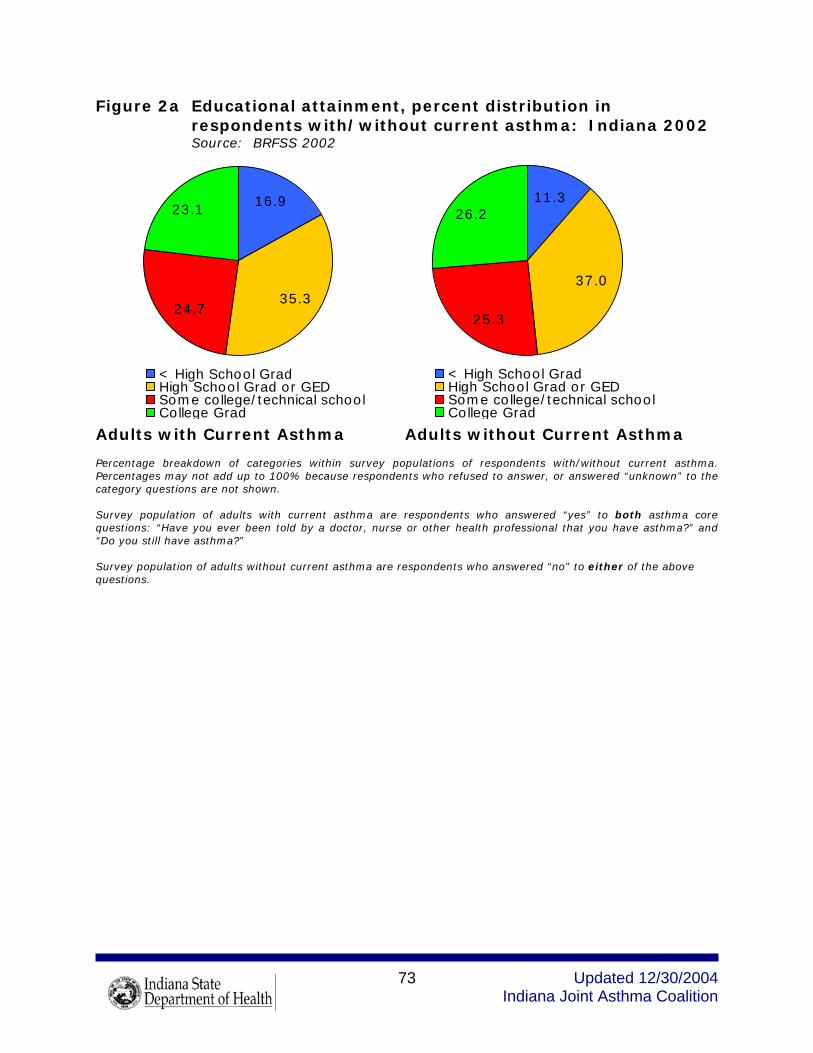
Figure 2a Educational attainment, percent distribution in respondents with/without current asthma: Indiana 2002 Source: BRFSS 2002
23.1
24.735.3
16.9
< High School GradHigh School Grad or GEDSome college/technical schoolCollege Grad
26.2
25.3
37.0
11.3
< High School GradHigh School Grad or GEDSome college/technical schoolCollege Grad
Adults with Current Asthma Adults without Current Asthma Percentage breakdown of categories within survey populations of respondents with/without current asthma. Percentages may not add up to 100% because respondents who refused to answer, or answered “unknown” to the category questions are not shown. Survey population of adults with current asthma are respondents who answered “yes” to both asthma core questions: “Have you ever been told by a doctor, nurse or other health professional that you have asthma?” and “Do you still have asthma?” Survey population of adults without current asthma are respondents who answered “no” to either of the above questions.
Updated 12/30/2004 Indiana Joint Asthma Coalition
73