the buffett plan for reducing the trade deficit · ... quickly reducing the current account deficit...
TRANSCRIPT
Working Paper No. 538
The Buffett Plan for Reducing the Trade Deficit
by
Dimitri B. PapadimitriouThe Levy Economics Institute
Greg HannsgenThe Levy Economics Institute
and
Gennaro ZezzaThe Levy Economics Institute and the University of Cassino
July 2008
The authors thank Wynne Godley for helpful comments on an earlier draft. They alsogratefully acknowledge the support of the Economic Policy Institute (EPI) and the AlfredP. Sloan Foundation.
The Levy Economics Institute Working Paper Collection presents research in progress byLevy Institute scholars and conference participants. The purpose of the series is to
disseminate ideas to and elicit comments from academics and professionals.
The Levy Economics Institute of Bard College, founded in 1986, is a nonprofit,nonpartisan, independently funded research organization devoted to public service.Through scholarship and economic research it generates viable, effective public policyresponses to important economic problems that profoundly affect the quality of life inthe United States and abroad.
The Levy Economics InstituteP.O. Box 5000
Annandale-on-Hudson, NY 12504-5000http://www.levy.org
Copyright © The Levy Economics Institute 2008 All rights reserved.

1
ABSTRACT
This paper considers a plan proposed by Warren Buffett, in which importers would be
required to obtain certificates proportional to the amount of non-oil goods (and possibly
also services) they brought into the country. These certificates would be granted to firms
that exported goods. Exporting firms could then sell certificates to importing firms on an
organized market. In this paper, starting from a relatively neutral projection of all major
variables for the U.S. economy, we estimate that the plan would raise the price of imports
by approximately 9 percent, quickly reducing the current account deficit to about 2
percent of GDP. We discuss several problems that might arise with the implementation of
the Buffett plan, including possible instability in the price of certificates and retaliation
by U.S. trade partners. We also consider an alternative version of the Buffett plan, in
which certificates would be sold at a government auction, rather than granted to
exporters. The revenues from certificate sales would then be used to finance a reduction
in FICA payroll taxes. We report the results of simulations of the alternative plan’s
effects on macroeconomic balances and GDP growth. Notably, the alternative plan would
lessen the severity of the growth recession expected in our base projection.
Keywords: Current Account Deficit; Trade Deficit; Trade Policy; Warren Buffett;
Macroeconomic Model
JEL Classifications: E12, E17, F13, F32

2
EXECUTIVE SUMMARY
1) According to available Bureau of Economic Analysis data, the current account deficit now stands at almost exactly 5 percent of GDP, down from a peak of about 6.5 percent in the fourth quarter of 2005.
2) Economic theory suggests that three forces determine the size of the current account deficit: (a) the relative prices of exports and imports; (b) aggregate demand for goods and services at home and abroad; and (c) the degree to which markets around the world are integrated. Estimates of the Levy Institute macroeconometric model confirm that the first two effects work as theory predicts, though they are not always apparent from a casual inspection of macroeconomic data. The last force is difficult to quantify, but readily observable over the past 25 years.
3) The theory of comparative advantage asserts that as trade expands, nations will specialize in the production of goods and services that they can produce at a relatively low cost. In fact, the data show that as markets have been integrated, imports and exports in particular industries tend to grow simultaneously. However, this generalization does not hold true for U.S. trade in consumer goods: imports of consumer goods have grown rapidly, while exports of these commodities have been stable.
4) The current account balance is one of three macroeconomic balances that are linked by an accounting relationship, which shows that the current account deficit equals the sum of the private- and public-sector deficits. Each deficit can act as a driver of the macroeconomy, but both of them enlarge the nation’s large negative net investment position. A series of deficits that increases the ratio of this stock to GDP cannot be sustained forever.
5) The Buffett plan would attempt to reduce, and eventually eliminate, the current account deficit in goods other than oil (and possibly services). If this plan were adopted, the government would give a certificate to exporting companies for each $100 of goods they sold abroad. Companies would have to obtain one of these certificates for each, say, $105 worth of goods (other than oil) that they wished to import into the United States. The certificates would be traded on modern financial markets.
6) Using the Levy Institute macroeconometric model, we have estimated that the Buffett plan would initially raise the prices of U.S. imports by about 9 percent. The plan would initially raise economic growth above what it would be under current policies, then lower it below that path (see figure 13). The plan would immediately reduce the current account deficit to 2 percent of GDP (including oil
3
imports, which are not covered by the certificate plan under our assumptions) more quickly than a continuation of existing policies (see Figure 11).
7) Aside from our estimates of the effects of the Buffett plan on macroeconomic variables, we have a number of serious reservations about this idea and believe that it might not work well in practice.
8) The proposed import-certificate market could be somewhat unstable, as the price of certificates fluctuated from day to day and season to season. Such fluctuations might discourage investment and cause changes in inflation and employment in the United States.
9) Perhaps the main drawback of the Buffett plan is its susceptibility to diplomatic and economic retaliation by foreign governments, including new trade barriers directed at U.S. exports. Our projections depend on the assumption that retaliation against the Buffett plan would raise foreign prices of U.S. exports by half as much as dollar prices for U.S. imports. The main effect of retaliation would be to reduce the profits of firms that export goods. Thus, if we eliminate the assumption that foreign governments would retaliate, the main effect would be to allow exporting firms to keep more of the revenues they received from certificate sales, boosting their profits by 1.2 percent of projected GDP.
10) An alternative to the Buffett plan, which would be preferable in our view, would be to use government auctions of certificates, instead of granting certificates to firms that export goods. The proceeds would then be used to finance cuts in payroll taxes, making our plan revenue neutral. The payroll tax cut would help consumers cope with the higher import prices that import certificates would impose. It would also provide a stimulus to U.S. industry by cutting costs.
11) Our simulation of the alternative plan shows that revenues from certificate sales would be sufficient to fund a payroll tax cut of approximately 2.4 percentage points each for employees and employers. In terms of economic growth, the alternative plan would perform about as well as the original Buffett plan, increasing growth in the short term by about two percentage points, reducing the severity of the “growth recession” projected in our baseline soft landing scenario, and moderating growth somewhat after that recession (see Figure 13). The alternative plan, like the original, would result in a reduction of the current account deficit to about 2 percent of GDP (see Figure 12).

4
1. INTRODUCTION
We have long argued that the nation’s current account deficit is at unsustainable levels.
The purpose of this paper is not to revisit the argument for cutting the current account
deficit, but to discuss a specific means of achieving a reduction, recently proposed by
Warren Buffett (2003). This paper has 12 sections after this introduction: Section 2
analyzes the forces that determine the current account balance; Section 3 examines the
specific commodities and industries that account for the bulk of foreign trade; Section 4
briefly discusses the effect of imports on import-competing industries; Section 5 sets
forth one view of the role of the current account balance and the other two
macroeconomic balances in the performance of the economy, especially in recent years
and the near future; Section 6 presents a baseline projection of the balances, which is
derived from the Levy Institute macroeconometric model under the assumption that no
major action is taken to reduce the current account deficit; Section 7 describes how the
Buffett plan would work and its advantages over some alternatives; Section 8 presents
our macroeconometric projections of the course of the balances in a scenario in which
Buffett’s plan is adopted; Sections 9 and 10 discuss certain problems that might arise
with the plan; Section 11 presents the case for an alternative version of Buffett’s plan;
Section 12 presents another macroeconometric simulation, this time under the assumption
that the alternative plan is adopted; and Section 13 summarizes what has come before.
2. THE BALANCE OF PAYMENTS DEFICIT
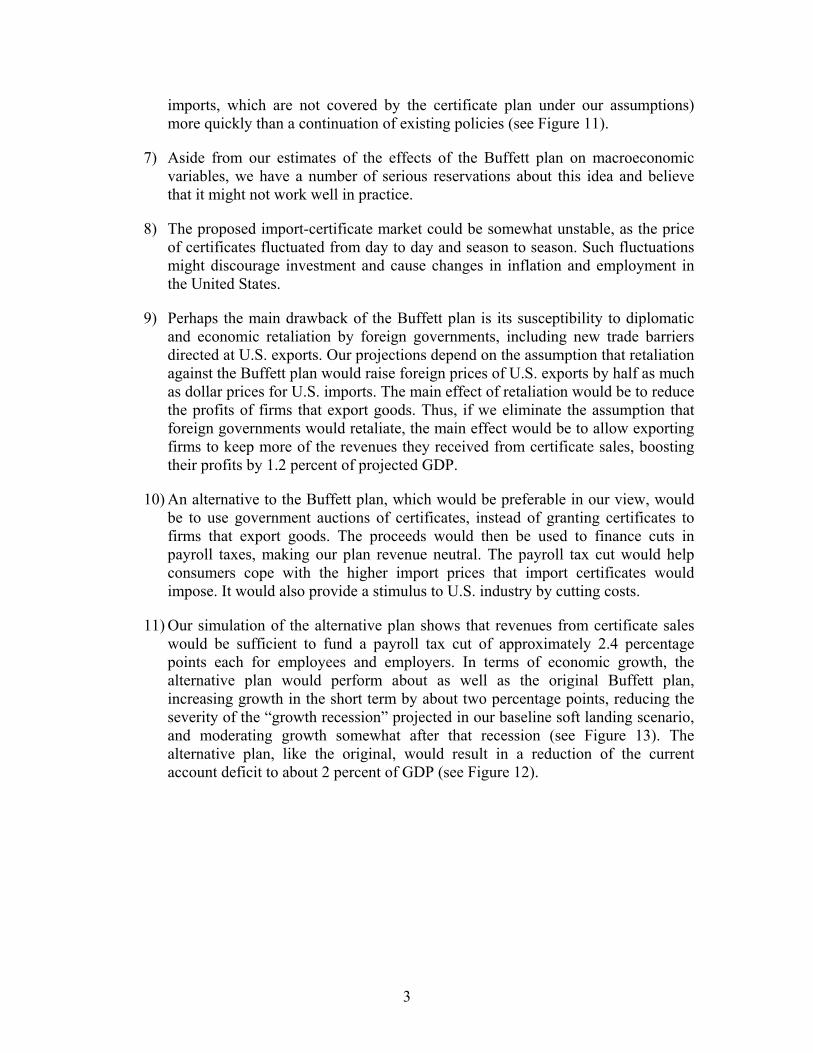
The U.S. current account deficit has become problematic only over a relatively recent
period (Figure 1). For more than 30 years after the war, the United States experienced a
surplus, and the first deficit came in the 1980s. The current account was close to balance
again in 1991, but since 1992, the external deficit has been growing as a share of GDP.
Figure 1 also shows that the deficit is mainly related to trade in goods. To be sure, the
United States runs a surplus in services trade and receives positive income flows from
abroad, but the net trade position has been in deficit.
5
U.S. Balance of Payments and its Components
-8%
-7%
-6%
-5%
-4%
-3%
-2%
-1%
0%
1%
2%
3%
1950 1953 1956 1959 1962 1965 1968 1971 1974 1977 1980 1983 1986 1989 1992 1995 1998 2001 2004 2007
Perc
ent o
f GD
P
Balance on Current Account Balance of Payments:GoodsBalance of Payments: Services Balance of Payments: Income
Figure 1
Source: B.E.A.
Economic theory suggests that trade is largely determined by three factors: relative
prices, aggregate demand at home and abroad, and finally—for a given level of demand
and relative prices—we should expect an increase in trade as a share of GDP with
globalization, as trade barriers are dropped, or when countries’ development leads to
specialization.
U.S. Dollar Nominal Indexes
0
20
40
60
80
100
120
140
160
1975 1977 1979 1981 1983 1985 1987 1989 1991 1993 1995 1997 1999 2001 2003 2005 2007
Broad Measure Major Currencies Other Important Trading PartnersSource: Federal Reserve
Figure 2

6
The exchange rate is a major determinant of relative prices: Figure 2 reports three
weighted indexes for the U.S. dollar exchange rate. The broad index shows an
appreciating trend for the U.S. dollar up to 2001, which took place mostly with respect to
the currencies of developing countries.1 Since 2001, the nominal value of the dollar has
been declining.
A different picture is given by the real U.S. dollar exchange rate, shown in Figure
3. Here the indexes take into account movement in relative prices, so that the real value
of the dollar appreciates, for example, when the nominal exchange rate is stable and
inflation in the United States is lower than inflation abroad. Figures 2 and 3 reveal that
the trend appreciation of the dollar against the currencies of developing countries, up to
2001, was, in fact, largely matched by inflation differentials.
Indices of the Real U.S. Dollar Exchange Rate
70
80
90
100
110
120
130
140
1975 1977 1979 1981 1983 1985 1987 1989 1991 1993 1995 1997 1999 2001 2003 2005 2007
Broad Measure Major Currencies Other Important Trading PartnersSource: Federal Reserve
Figure 3
Figure 3 shows that the U.S. dollar appreciated in real terms from 1979 to 1985;
depreciated in the following years, returning to roughly its 1978 level; appreciated again
1 The Federal Reserve U.S. dollar index for Major Currencies include: the euro, Canadian dollar, Japanese yen, British pound, Swiss franc, Australian dollar, and Swedish krona. Currencies in the Other Important Trading Partners index includes the BRICs (Brazil, Russia, India, and China) and 15 other countries. For details, see Loretan (2005).

7
from 1996 to the first quarter of 2002; then depreciated from 2002 to present, with the
broad index now roughly in line with its 1978 level.
U.S. Balance of Payments and the Real U.S. Dollar Exchange Rate
-7%
-6%
-5%
-4%
-3%
-2%
-1%
0%
1%
2%
1970 1972 1974 1976 1978 1980 1982 1984 1986 1988 1990 1992 1994 1996 1998 2000 2002 2004 2006
Perc
ent o
f GD
P
70
80
90
100
110
120
130
Balance of Payments (l.h.s.)1/Broad Measure of the Real U.S. Dollar Exchange Rate (r.h.s.)
Sources: B.E.A.and Federal Reserve
Figure 4
In Figure 4, we show the current account and the inverse measure of the U.S.
dollar real exchange rate. In this figure, an upward movement of the exchange rate shows
a devaluation of the dollar, which should stimulate a recovery in the current account, and
a downward movement indicates a revaluation. Up to the early 1990s, the current account
seemed to react to movements in the real exchange rate with a lag of about two years (the
so-called J-curve effect). The increase in the external deficit in the first years of the
1990s, however, was not initially related to an appreciation in the dollar, at least up to
1995. Since 2001, the two curves seem to lose their correlation, as the U.S. dollar
devaluation in real terms has not shown up as a reduction in the deficit—although the
annual figures in Figure 4 end with 2006, while quarterly data for 2007 show that the
deficit, now at 5 percent of GDP, is already 1 percent of GDP lower than last year. It may
be the case that the J-curve effect operates with a longer lag now, or other forces may be
at work.

8
United States and U.S. Trading Partners' Real GDPAnnual Growth Rates - Four-Quarter Moving Averages
-2%
-1%
0%
1%
2%
3%
4%
5%
6%
7%
8%
1970 1972 1974 1976 1978 1980 1982 1984 1986 1988 1990 1992 1994 1996 1998 2000 2002 2004 2006
United States U.S. Trading PartnersSource: see text
Figure 5
It is therefore worth examining the relationship between the balance of payments
and the business cycle in the United States and its trading partners, as shown in Figure 5.2
In some cases, the effect of faster growth in the United States over its trading partners is
clear, as it is between 1983 and 1986 and in the second half of the 1990s. In other
periods, as in the beginning of the 2000s, slower growth in the United States was not
followed by an improvement in the balance of payments. One of the reasons why the
response of U.S. trade to growth differentials is asymmetric involves differences in
import elasticities between the United States and its partners:3 it is well known that the
U.S. imports have a high income elasticity, which means that when the U.S. economy is
growing at the same pace as its partners, its balance of payments will deteriorate.
Our evaluation of the linkages between U.S. trade, income, and relative prices in
the Levy Institute macroeconometric model,4 however, gives the following results:
2 In Figure 5, we plot the annual growth rate in U.S. real GDP (source: Bureau of Economic Analysis) along with our measure of real GDP of U.S. trading partners, trade weighted. For details about the construction of our index, see Dos Santos, Shaikh, and Zezza (2003). 3 The so-called Houthakker effect. See Houthakker and Magee (1969). 4 Long-run elasticities are obtained from cointegrating relationships. Short-run elasticities are obtained from error-correction estimates, which are robust to the standard battery of tests. Further details are available from the authors.

9
Long-run Elasticity
Short-run Elasticity
Sample Income RelativePrices
Income Relative Prices
U.S. Non-oil Imports 1970q4–2007q2 1.74 -0.80 1.76 -0.72
U.S. Exports 1970q3–2007q2 1.73 -0.59 3.19 0
For the available sample, our estimates show that the long-run elasticities of U.S. exports
and imports are not very different, with U.S. exports being somewhat less responsive to
movements in relative prices.
If trade elasticities are not responsible for the widening U.S. trade deficit, it is
worth exploring in more detail the composition of U.S. trade and how it changed in the
different exchange rate periods identified above.
3. THE COMPOSITION OF U.S. TRADE
As mentioned before, and shown in Figure 1, the U.S. balance of payments deficit arises
exclusively from trade in goods. Exports of services have always exceeded imports, while
the net inflow from income payments represents a well-known puzzle in U.S. trade
accounts, since the large and growing foreign debt should imply a large and increasing
outflow of payments on U.S. liabilities. Part of the puzzle is explained by the
composition of U.S. financial assets and liabilities: a large portion of U.S. assets is
denominated in euros, while almost all U.S. liabilities are in dollars, so a devaluation of
the U.S. dollar implies positive capital gains for the United States, translating into larger
dollar payments on U.S. assets held abroad—direct investment or financial assets. These
two positive components of the current account are, however, too small (relative to GDP)
to compensate for the large deficit in the trade of goods.

10
U.S. Net Exports of Goods
-4%
-3%
-2%
-1%
0%
1%
2%
1967 1970 1973 1976 1979 1982 1985 1988 1991 1994 1997 2000 2003 2006
Perc
ent o
f GD
P
Foods, Feeds, and Beverages Industrial Supplies and Materials Petroleum and Products Capital Goods, Except AutomotiveAutomotive Vehicles, Engines, and Parts Consumer Goods, Except Automotive
Figure 6
Source: B.E.A.
A profile of the composition of U.S. net trade in goods can be observed in Figure
6. Apart from imports of petroleum products, which fluctuate with changes in oil prices,
the increase in the deficit seems to be associated with a widening deficit for consumer
goods other than automobiles, and also with a deterioration in the trade surplus for capital
goods.
Composition of U.S. Exports of Goods
0%
10%
20%
30%
40%
50%
1967 1970 1973 1976 1979 1982 1985 1988 1991 1994 1997 2000 2003 2006
Perc
ent o
f Tot
al E
xpor
ts o
f Goo
ds
Foods, Feeds, and Beverages Industrial Supplies and MaterialsCapital Goods, Except Automotive Consumer Goods, Except AutomotiveOther Goods Automotive Vehicles, Engines, and Parts
Source: B.E.A.
Figure 7

11
Composition of U.S. Imports of Nonpetroleum Products
0%
5%
10%
15%
20%
25%
30%
35%
40%
1967 1970 1973 1976 1979 1982 1985 1988 1991 1994 1997 2000 2003 2006
Perc
ent o
f Non
-oil
Impo
rts
Foods, Feeds, and Beverages Ind. Supplies (Except Petroleum)Capital Goods, Except Automotive Automotive Vehicles, Engines, and PartsConsumer Goods, Except Automotive Other
Figure 8
Source: B.E.A.
In Figure 7 we show the composition of U.S. exports of goods, while a
comparable composition of U.S. imports, net of oil, is reported in Figure 8. We note that
the decline in the balance of trade for capital goods and automobiles is not caused by a
decrease in the share of these sectors in total exports, but rather by the increase in
imports. The share of consumer goods in exports has increased, and the deficit for this
sector has been generated by a larger increase in imports. The U.S. relative specialization
in capital goods and industrial supplies, which together cover more than 66 percent of
exports of goods, has not changed dramatically over the period, notwithstanding the
different real exchange rate regimes. We believe this is one important reason why U.S.
exports are not very sensitive to relative prices, since presumably production from these
sectors incorporates technologies for which buyers cannot easily find substitutes. On the
other hand, the large share of consumer goods in U.S. imports may be responsible for the
relatively higher import-price elasticity reported above.
12
U.S. Balance of Trade in Goods by Country
-2.0%
-1.5%
-1.0%
-0.5%
0.0%
0.5%
1.0%
1978 1981 1984 1987 1990 1993 1996 1999 2002 2005
Perc
ent o
f GD
P
Europe Canada Japan Mexico China Korea
Figure 9
Source: B.E.A.
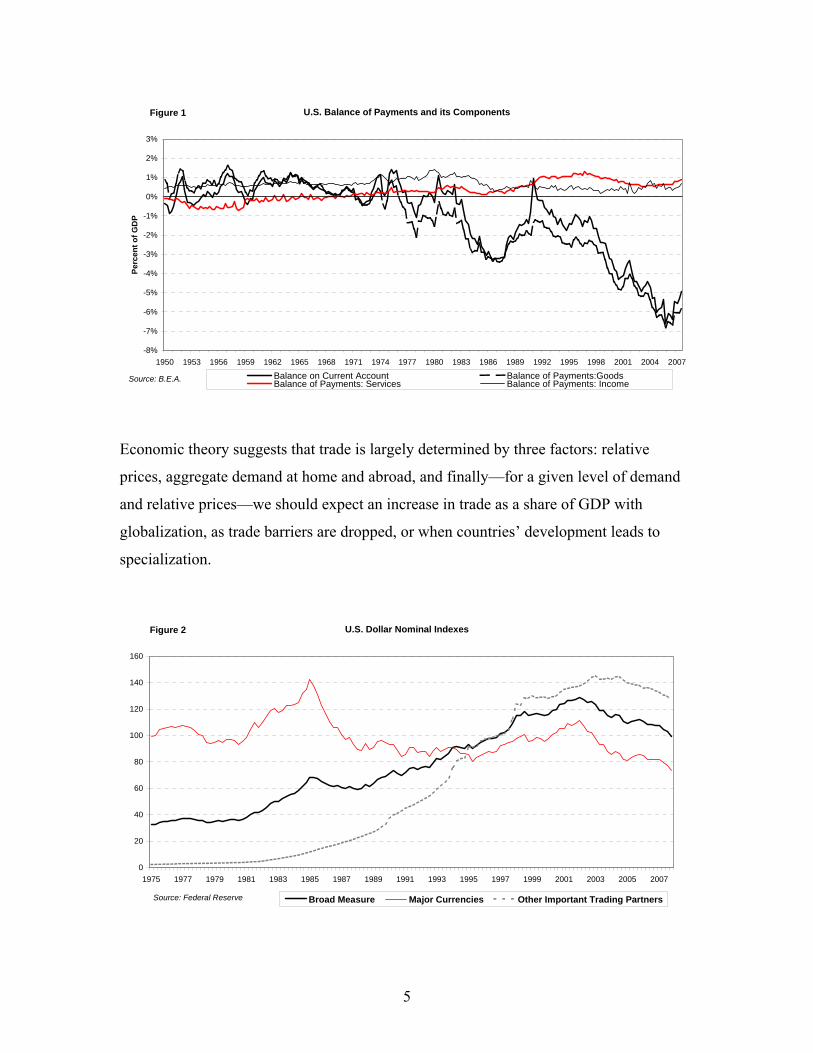
In Figure 9, we report the balance of trade in goods for some important U.S.
trading partners. The countries displayed in the figure account for about 73 percent of
total U.S. exports in 2006, up from 69 percent in 1978, while the same countries
accounted for about 74 percent of total imports in 2006, up from 60 percent in 1978. The
increase in the import share of these countries is entirely due to China, which accounted
for less than 1 percent of U.S. imports at the beginning of the sample, and more than 15
percent in 2006.
Movements in the balance of trade for individual countries cannot always be
explained by exchange rate movements alone. For instance, the large increase in the U.S.
deficit with China can be explained—at least in part—by the relative stability of the
Chinese currency vis-a-vis the U.S. dollar (the Chinese currency appreciated by 8 percent
from 2002 to present, against an appreciation of 36 percent of the euro over the same
period), so that lower production prices in China have increasingly moved production of
goods with a high price elasticity to this country and out of the United States. However,
the Japanese yen has also been relatively stable vis-a-vis the U.S. dollar (an appreciation
of 11 percent from 2002 to present), but the balance of trade in goods with this country
has also remained relatively flat. The large devaluation of the U.S. dollar against the euro

13
has not translated into a surplus with European countries so far, although the deficit has
fallen.
A more detailed analysis of the composition of trade in goods by country of origin
and destination might shed more light on the determinants of the U.S. trade imbalance,
and therefore on the most effective response, but such an analysis is beyond the scope of
this paper. However, the available evidence seems to support the following stylized facts:
− imports from China are more sensitive to relative price movements than
imports from other countries;
− the U.S. export price elasticity is lower than the U.S. import price
elasticity;
− U.S. exports seem to respond to a larger extent to income changes in
partner countries than to price changes.
4. TRADE AND DEINDUSTRIALIZATION
With respect to the sectoral composition of U.S. trade, it is important to consider whether
the increase in imports for some categories of goods implies despecialization for the
corresponding U.S. industry. According to the classical theory of comparative advantage,
as trade barriers are lifted, countries should specialize in the production of those goods or
services in which they have a comparative advantage. This theory seems to correspond to
the idea that, for instance, once China has entered international markets, it should
specialize in the production of goods and services with high labor intensities, in order to
capture its relative advantage given by low labor costs. However, the literature on trade
has never found sound empirical support for this theory, while the evidence seems to
support the idea that both imports and exports in a given class of commodities grow
together, perhaps because of demand for a variety of commodities in a given class or
because many industries that produce traded goods are vertically integrated.
Our analysis so far has confirmed the idea that, for broad categories of goods,
U.S. exports and imports grow together. A notable exception is consumer goods; U.S.

14
exports of these commodities have been stable while imports have increased
dramatically. Inspection of the last two input-output matrices for the United States
confirms the fact that some despecialization is taking place in the United States,
especially for “apparel and leather and allied products” and “textile mills and textile
product mills”: the ratio of imports to output for these two groups was 76.7 percent and
26.3 percent, respectively, in 2005, compared with 64.3 percent and 17.5 percent in 2001.
Other commodities with a large increase in the ratio of imports to output were computers
(an 8 percent increase to 39.5 percent), electrical equipment (a 7 percent increase), and
furniture (a 6 percent increase). A more detailed analysis of the source of such changes,
and their relation to relative price movements, however, would take us away from the
main topic of this paper.
5. THE BALANCE OF PAYMENTS DEFICIT AND THE MACROECONOMIC
CONTEXT
In order to evaluate the impact of the Buffett plan on the U.S. trade deficit, we will use
simulations of the Levy Institute macroeconometric model, which the Institute has
employed repeatedly in recent years to stress the macroeconomic implications of a large
U.S. external deficit, and to propose policies to address this and related issues affecting
U.S. growth (e.g., Godley 1999; Godley et al. 2007).
By definition, the current account deficit always equals the sum of the deficits of
the private and public sectors of the U.S. economy. The latter two deficits can have
positive effects on the macroeconomy, at least in the short term. For example, the U.S.
household sector has recently maintained a deficit (spent in excess of its income) for a
sustained period, as it accumulated consumer and mortgage debt. By spending more than
its income, the household sector, and the private sector as a whole, were able to help
sustain U.S. economic growth after 2003 and support export growth in the rest of the
world. This is an example of how the deficits can act as “drivers” of the domestic and
world economies. On the other hand, the deficit on the current account reduces the
growth rate of the domestic economy, since an excess of imports over exports is a
“leakage” of demand to businesses in the rest of the world.

15
The relationship among the three balances is complex, with no single balance
dictating the movement of the other two (Godley et al. 2007). Forces that move any of the
three balances are capable of forcing changes in the other two. For example, if the
government were to undertake a large cut in personal income taxes without an offsetting
reduction in spending, citizens would have more disposable income and might be able to
reduce their own borrowing or pay off existing loans. As another example, if domestic
firms became pessimistic about the economy and began to curtail their investment
spending, U.S. workers’ incomes would fall, possibly reducing government income tax
revenues and increasing the public-sector deficit. Hence, no major economic variables
affect any one of the balances without potentially affecting the other two. In addition,
forces that move the balances are also capable of causing periods of prosperity, as well as
recessions.
The balances have important implications other than acting as driving forces
behind the business cycle. These effects act in the medium term, over the course of more
than just one business cycle. The medium term effects of the three balances exist because
each balance is like a flow of water into a bathtub; each year’s deficit adds to a stock of
debt held by either the private or public sectors. There are both normative and positive
implications of a gradually rising stock. The normative implication arises from the
proposition that excessive debt/income ratios are usually imprudent, especially if they
grow larger over time. (Governments are often better able to pay off debt than private
firms and individuals, because they have the ability to levy taxes and, in the U.S. case, to
repay creditors by sending new dollars to their bank accounts. In the case of the U.S.
government, the main limit to borrowing is an inflationary barrier, which would
eventually be reached if extremely large deficits were maintained over a long period.)
The positive implication of large stocks of debt is the empirical proposition that, in the
face of a rising level of debt, public or private borrowers, recognizing the danger of being
overextended, reduce their demand for loans, and lenders to these sectors will eventually
become less willing to put their money at risk. Hence, while large public- or private-
sector deficits can stimulate economic growth in the short run, they add to stocks of debt
in the medium term, a process that can eventually put the brakes on a boom led by
borrowing. And just as an upswing in borrowing can lead an economic boom, the ensuing

16
retrenchment can exert restraint on the expansion of the economy, or even cause a
recession. This cyclical financial impetus was studied in detail by the late Levy Institute
scholar Hyman P. Minsky (1975, 1986). The current crisis in home mortgage lending is
one example of a Minskyan scenario of unsustainable levels of borrowing first
stimulating a boom and then running out of steam as many borrowers found that their
debts were too large to service (Papadimitriou, Hannsgen, and Zezza 2007; Whalen
2007).
In viewing the macroeconomic impact of events such as the recent run-up in
household debt or the almost continuous increase in government debt over the past thirty
years, it is important to neglect neither the short-term stimulus they provide nor the effect
of adding to stocks of debt that have effects over the medium term. We believe that the
latter concern is now important in the United States, especially for the private sector. As
borrowing reaches its limits, the effects are being felt both by banks and other financial
institutions, as well as homeowners and other borrowers who find themselves unable to
pay off their loans. Banks and investors around the world have lost many billions of
dollars, and will extend fewer new loans; employment and output will fall in industries
such as construction, finance, realty, furniture, appliances, and home improvement.
There is already strong evidence of a sharp contraction of subprime mortgage
lending and of the commercial paper and “junk” bond markets. Overall, the spread of
corporate bond interest rates over Treasury rates in November was at its highest level
since January 2003—a reminder that the federal funds rate alone does not call the tune
for the financial sector—and bond issuance by European and U.S. companies was at its
lowest level since 2001 (Oakley 2007). Some of the more complex, opaque, and risky
financial markets have simply dried up. Banks, which have already announced $70
billion in write-downs of mortgage-related assets (Reuters 2007), are generally adept and
creative at obtaining funds, but have found it more difficult lately to do so by packaging
loans and selling them. They too have seen their costs of funds rise, as longer-term
interbank lending rates have, at times, soared above the federal funds rate. Things are
likely to get worse in the financial markets before they get better.

17
Hypothetically, if the private sector borrows less funds, and the public-sector
deficit stays constant, the current account deficit falls.5 Hence, the recent credit
retrenchment, however painful it may be to many Americans and foreigners, may lead to
a partial reversal of the enormous current account deficits of recent years. Some
economists welcome the retrenchment as the “silver lining” of a dark cloud for this very
reason (Schultz and Taylor 2007), but the consequences may be grave. Current data
indeed show that a current account deficit reversal has indeed begun, but the current
account deficit, as a percentage of GDP, remains at near-record levels. We believe that
the medium-term effects of U.S. debt will be felt strongly across a broad swath of the
economy over the next five years. Adjustments will be less wrenching in the United
States and abroad if imbalances are corrected without abrupt sell-offs of dollar-
denominated assets.
The home mortgage crisis illustrates the nature of the adjustments that can occur
when excessive stocks of debt have piled up, giving an indication of what might lie ahead
if similar crises touch other financial and credit markets, such as commercial real estate,
“junk” corporate bonds, and subprime car loans. First, when the debt of a sector is
excessive, not all agents in the sector are affected, and they can be affected in many
different ways. Many households in the United States have not borrowed more than they
can repay and will retain the ability to borrow in the future (though interest rates may be
higher). Other agents will simply lose their homes and their credit and have to start over
in a very weak financial position. Still others will barely manage to keep their homes and
will struggle under the burden of high mortgage payments for years to come. Second, not
only are borrowers affected, but also the financial intermediaries that have lent them
money obtained from investors or depositors. Scores of mortgage lenders have gone
bankrupt in the past year, and many individual banks have seen a marked effect on their
bottom lines and balance sheets. The investors who stand to lose range from public- and
private-sector pension funds, and hedge funds, to banks that create, hold, and trade
mortgage-backed securities.
5 Private-sector borrowing and the private-sector deficit are distinct, since the private sector can spend more than its income by using up stocks of assets. Recent years have seen both large amounts of private-sector borrowing and large private-sector deficits.

18
Hence, the U.S. debt crisis involves millions of individuals and firms and their
communities. Nonetheless, the total private- and public-sector debts, relative to measures
of the overall size of the economy (such as GDP), are extremely important aggregate
indicators of economy-wide problems that are felt at the individual, family, and
community levels.
It is important to emphasize that the Godley stock-flow-consistent analysis does
not claim that all balances are inevitably reduced to zero or that the best policy is always
to try to move all balances to zero. It does not purport to show that current account
imbalances serve no economic or social purpose; we believe, for example, that the
Chinese economy would be far smaller, and poverty levels in that still-poor country far
higher than they are, were it not for China’s ability to run trade surpluses with the United
States and some other nations. The imbalance with China has also had long-term impacts
in this country, most adversely on some export-competing segments of the U.S.
manufacturing sector and their workers. Our analysis emphasizes how negative balances
in the government or private sector can improve growth over the short run, but the
Chinese case clearly shows that “short-run” effects do not simply “wash out” or
disappear over the medium and long terms. But, speaking loosely, we believe that the
point has been reached where the nation’s marginal benefits of additional borrowing from
abroad are not as large as the marginal costs. And, for the very reason that the three
balances have important economic effects, policymakers cannot afford to adopt a passive
stance toward these variables.
6. A BASELINE PROJECTION: THE CONSEQUENCES OF A CONTINUATION
OF CURRENT POLICIES
In what follows, the current U.S. economic situation has been used as the basis of a
baseline projection from our model. This projection will function as a benchmark in our
evaluation of the effects of the Buffett plan on the three macroeconomic balances and
GDP growth.

19
The baseline projection has recently been presented in some detail in Godley et al.
(2007), but has been updated here to include recently released data affecting
macroeconomic variables. In Godley et al. (2007), we presented two plausible scenarios,
calling them the “soft landing” and the “credit crunch,” respectively. In the former, we
assumed that the private sector would gradually reduce its borrowing, generating a
moderate slowdown in economic growth, while in the latter we assumed a more severe
drop in borrowing, which would generate a recession in 2008. Many prominent
economists now believe that the economy is already in a recession or soon will be (e.g.,
Feldstein 2007; Summers 2007) and others see a risk of stagflation (Stiglitz 2008). As
mentioned already, some data show a sharp contraction in lending since the summer,
when the subprime sector began to collapse. Hence, the credit-crunch scenario may prove
to be the more accurate. However, as the newly available Federal Reserve data for
household borrowing in the third quarter show that no credit crunch has occurred so far,
we will base the current analysis on a revised version of the soft landing scenario. 6,7
In this projection we assume no further devaluation of the U.S. dollar and a
moderate decline in household and business borrowing, which imply a slowdown in
growth in the next two years and a rebound to potential growth in 2010.
Regarding the U.S. balance of payments, the baseline projection assumes that the
real U.S. dollar exchange rate remains low for the simulation period, and that the
feedback from the slowdown in the United States to the rest of the world is minimal, so
that the United States will be growing more slowly than its trading partners for about two
years. Both assumptions imply a large improvement in the balance of payments, which
falls to about 1.7 percent of GDP by the end of the simulation period in 2012. Most of the
reduction in the deficit is achieved through the slower growth in imports implied by slow
U.S. growth and the low exchange rate, as well as an acceleration in exports. An
6 Although the data available for the third quarter of 2007 from the Flow of Funds published by the Federal Reserve show a moderate decline in borrowing, this does not imply that a larger drop may not already have taken place in the last quarter of 2007. Our model has not been constructed to obtain short-term forecasts and, therefore, it is not the proper tool to estimate the timing of a recession, but it shows that given current and recent trends in stock-flow ratios, a drop in private expenditure is more and more likely with the increase in the private debt-to-income ratio. 7 A notable difference between the current scenario and that presented in Godley et al. (2007) is that, in the latter, we made an optimistic assumption about some residual items and statistical errors in the balance of payments. In the current projection we adopt a more conservative view.
20
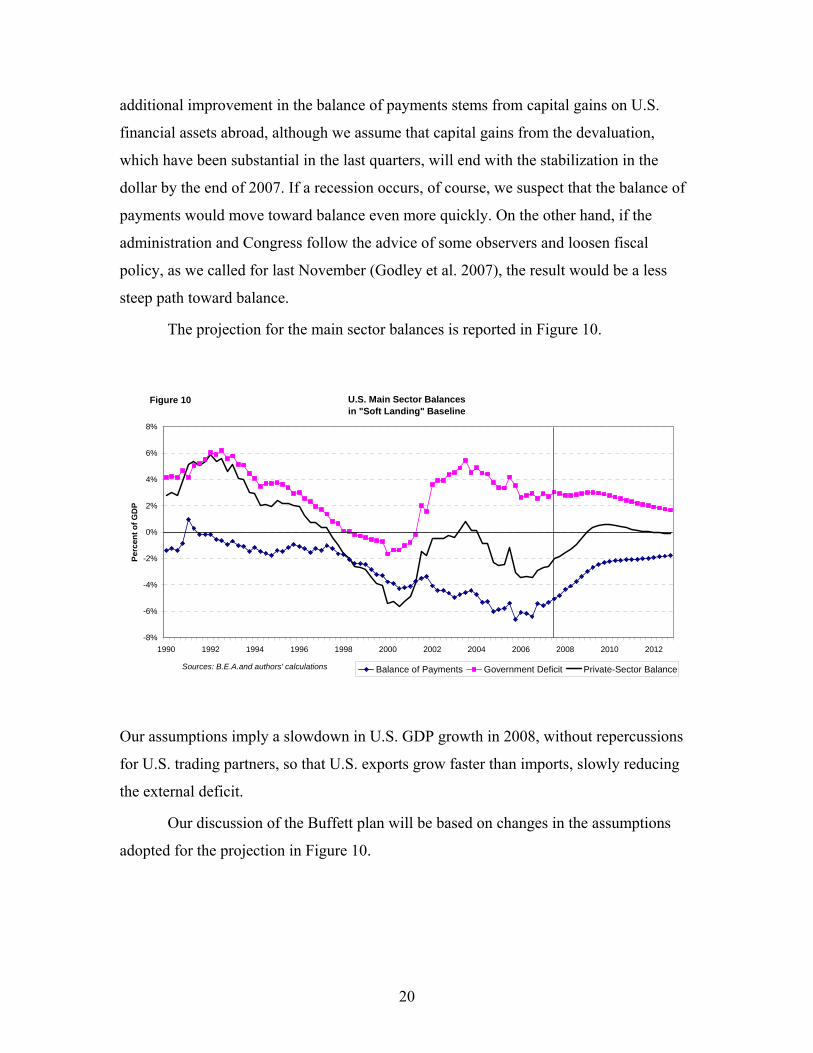
additional improvement in the balance of payments stems from capital gains on U.S.
financial assets abroad, although we assume that capital gains from the devaluation,
which have been substantial in the last quarters, will end with the stabilization in the
dollar by the end of 2007. If a recession occurs, of course, we suspect that the balance of
payments would move toward balance even more quickly. On the other hand, if the
administration and Congress follow the advice of some observers and loosen fiscal
policy, as we called for last November (Godley et al. 2007), the result would be a less
steep path toward balance.
The projection for the main sector balances is reported in Figure 10.
U.S. Main Sector Balancesin "Soft Landing" Baseline
-8%
-6%
-4%
-2%
0%
2%
4%
6%
8%
1990 1992 1994 1996 1998 2000 2002 2004 2006 2008 2010 2012
Perc
ent o
f GD
P
Balance of Payments Government Deficit Private-Sector Balance
Figure 10
Sources: B.E.A.and authors' calculations
Our assumptions imply a slowdown in U.S. GDP growth in 2008, without repercussions
for U.S. trading partners, so that U.S. exports grow faster than imports, slowly reducing
the external deficit.
Our discussion of the Buffett plan will be based on changes in the assumptions
adopted for the projection in Figure 10.
21
7. THE BUFFETT PLAN
The plan suggested by Warren Buffett would use an incentive-based intervention to
achieve a narrowing of the trade deficit, which, along with certain net cross-border
income payments, makes up the balance on the current account. Firms that exported $100
in goods to any other nation would be entitled to an “import certificate” (IC) in the same
amount. This certificate would be granted to the exporting firm by the federal
government. The certificate would entitle any firm to import $100 worth of goods by
submitting the certificate back to the government.8 The exporting firm could import these
goods itself or sell the certificates to another firm that planned to import goods. The
importing firm would be required to submit the certificate to the government when it
imported the $100 worth of goods. Certificates would be sold by exporters to importers in
organized markets, most likely organized along the lines of existing markets for carbon-
emissions credits in the European Union. This plan would thus cap the trade deficit in
goods at a fixed percentage of exports in goods.
We believe that the plan addresses a critical problem and may work, but, as we
will show later, the plan presents some challenges that may be difficult to overcome. The
Buffett plan would achieve a narrowing of the trade gap by two types of incentive effects.
These would arise from the fact that the certificates would be both a necessary “input” in
the business of importing goods, and a “joint output,” created when exports were
produced and sold. As a costly input into imported goods, the certificates would work by
encouraging firms to buy fewer imported raw materials and intermediate goods, and
consumers to buy fewer imported goods, by either reducing their spending or buying
more domestically produced goods. The resulting increase in the demand for U.S. goods
would raise U.S. output for the domestic market and possibly raise the prices of goods
produced in the United States. The substitution of American for foreign goods, and
possibly a reduction in overall spending—to which we return below—would be the first
way the Buffett plan narrowed the deficit. In light of our analysis of the composition of
8 The Dorgan-Feingold legislation introduced in the Senate would actually phase the certificates in over time. Thus, a $100 certificate like the one mentioned in the text could be used for $140 worth of imports in the first year of the plan, then $130 worth of imports the following year, and so on, until parity was reached.

22
trade, however, it should be noted that this “substitution effect” will operate in different
ways across industries, with the largest impact on price-elastic commodities.
At the same time, ICs would be a new joint output for exporting firms, which
would have a value in the market for certificates. This would encourage exporting firms
to increase their output of goods and possibly reduce their prices to foreign buyers.
Employment in the export sector might rise at the expense of employment in industries
that used imported machinery and inputs or that sold imported merchandise.
The Buffett plan would offer a number of advantages over other proposed
remedies for the current account deficit. A fall in the value of the dollar would provide
somewhat similar incentives, by increasing the dollar prices of imports and reducing the
foreign-currency prices of exports. But while the dollar has fallen in value by about 22.8
percent against a broad basket of currencies since its peak in 2002, the devaluation has
not been dramatic enough to cut the deficit greatly, at least up until now. The devaluation
that occurred in the wake of the Plaza Accord of the mid-1980s had a marked, albeit
delayed, effect on the trade deficit, and the recent devaluation should be welcomed by
U.S. policymakers for similar reasons. We have argued on a number of occasions that a
devaluation would enable a narrowing of the current account deficit at a relatively small
cost in lost consumption and output. However, Congress and the president have little
control over the value of the dollar, and meddling in foreign currency markets by the U.S.
monetary authorities and Treasury Department would be a risky endeavor from the
standpoints of financial stability and diplomacy.9 Moreover, even if a significant
devaluation were achieved, it would not ensure the achievement of a numerical trade-
deficit target, partly because the effect of devaluations on imports and exports is usually
very gradual and uncertain. 10
9 Of course, the monetary authorities routinely target the federal funds rate, but considerations other than the current account deficit dominate the deliberations of the Open Market Committee. We refer here to direct sales or purchases of foreign currency—a power that exists, but is little used. 10 One advantage of a devaluation over the Buffett plan is that the former would increase the total value of U.S. foreign financial assets relative to the value of foreigners’ financial assets in the United States, because the former are mostly denominated in foreign currency, while the latter are mostly denominated in dollars. As a result, the net income stream associated with international financial assets would shift somewhat toward the United States, further reducing the current account deficit.

23
The advantages of the Buffett plan over efforts to limit imports on a piecemeal
basis by imposing quotas or tariffs on specific goods and services or on the goods and
services of specific nations would be even greater. Much like a government pension
scheme with no clearly understandable or impartially enforced rules, such policies would
inevitably generate charges of favoritism and would be vulnerable to the demands of the
most politically powerful industries and friendly governments. They would put the
government in the position of making decisions that could make or break certain
industries, and in all but an ideal world amount to micromanagement of individual
markets, inviting comparisons to the communist systems of yore. While the government
sometimes finds itself in a position in which it must respond to problems in individual
industries on pragmatic grounds (for example through antidumping rules), expanding
such efforts on the scale necessary to significantly reduce the trade gap would be another
matter altogether, creating an interventionist state worthy of its critics.
8. MACROECONOMIC CONSEQUENCES OF THE BUFFETT PLAN
To evaluate the impact of the Buffett Plan on the U.S. economy, we have simulated our
model under a number of assumptions. We assume that the plan is implemented in the
first quarter of 2008. First of all, to calculate the market value of ICs we solve the model
to find a price at which non-oil imports equal the dollar value of exports in the preceding
quarter. (The inclusion of service imports is somewhat problematic from an enforcement
point of view, as we discuss later, and policymakers may wish to exempt them from
certificate requirements. We include them here, on the assumption that enforcement
could somehow be achieved.) We assume that the introduction of the ICs does not affect
the trajectory of the U.S. dollar, with respect to our baseline. The ICs will thus be
reflected in higher import prices on U.S. markets. We assume that only 50 percent of the
additional cost to importers is passed through in higher prices in U.S. dollars for imported
goods and that the increase in import prices is reflected in domestic inflation according to
the share of imports in domestic output.
It is quite difficult to assess the probability of retaliation from U.S. trading
partners to the introduction of the ICs. The largest part of U.S. exports is directed toward
24
Europe (23 percent in 2006), Canada (22 percent), and Mexico (13 percent), and these
economies, with the possible exception of Europe, rely on the United States as a market
for their goods. Their respective share in U.S. imports are 20 percent for Europe, 16
percent for Canada, and 11 percent for Mexico. Any retaliatory policy that reduces U.S.
exports to these countries will also reduce the value of available ICs, and the costs in
terms of reduced access to the U.S market may outweigh the benefits. We thus assume,
adopting a cautious view, that retaliatory policies initiated by U.S. trading partners will
increase the unit cost of U.S. exports by 50 percent of the increase in the cost of U.S.
imports related to the introduction of ICs. Below, we also briefly consider how our results
would be changed in a scenario with no retaliation.
It is not clear how exporters would modify their pricing decisions after the
introduction of the plan. Assume that a firm sells 100 units of its product at $1, and it
now receives an IC—which entitles the owner to import goods into the United States for
a value of $100. Assume that the IC can be sold at a market price of $10. Total revenues
for the exporting firm therefore rise to $110, or $1.10 per unit of output. The exporting
firm may leave the market price for its good at $1 and have an increase in profits of $10
from the sale of the IC. An alternative pricing policy would be to reduce the dollar price
of its goods to about 90.91 cents and keep a total revenue of $100 ($90.91 worth of
exports, plus $9.09 from the sale of the corresponding IC). The latter pricing policy
would be adopted in industries that exhibit a high price elasticity, where firms would
expect a large increase in sales from lowering their prices.
Given our discussion about the price elasticity of U.S. export demand, we assume
here, rather arbitrarily, that exporters would cut their prices on foreign markets by a
fraction of the increase in their revenues from the sales of ICs, so as to eliminate
completely the effects of retaliation from U.S. trading partners. (In the absence of
retaliation, we estimate that exporting firms would cut their prices on foreign markets
only moderately, as the demand they face is price inelastic. They would therefore reap a
windfall in profits almost equal to the full value of the certificates they sold, minus any
increase in the costs of the imported intermediate goods they use to produce exports.) We
assume that extra profits from the sales of ICs would be spent on additional investment,
25
and the model captures the effects of the increase in investment on employment—and
therefore disposable income—without any need for other arbitrary assumptions.
Our simulation is based on econometric estimates of the components of trade and
domestic demand. Substitution effects between domestic and foreign goods are captured
in the model through relative price effects. However, if the introduction of ICs generates
a significant change in private-sector behavior with respect to the willingness to
substitute foreign for domestic goods, econometric estimates will fail, since they are
based on the hypothesis of stable price and income elasticities (a problem—known as a
“structural break” in technical terms—that can be addressed only if similar events
occurred in the past). In our experiment, such a failure would result in an overestimate of
U.S. imports, which will be greater, the larger the substitution effect not accounted for by
movements in relative prices.
U.S. Main Sector Balancesunder the Buffett Plan
-8%
-6%
-4%
-2%
0%
2%
4%
6%
8%
1990 1992 1994 1996 1998 2000 2002 2004 2006 2008 2010 2012
Perc
ent o
f GD
P
Balance of Payments Government Deficit Private-Sector Balance
% of GDP
Figure 11
Sources: B.E.A.and authors' calculations
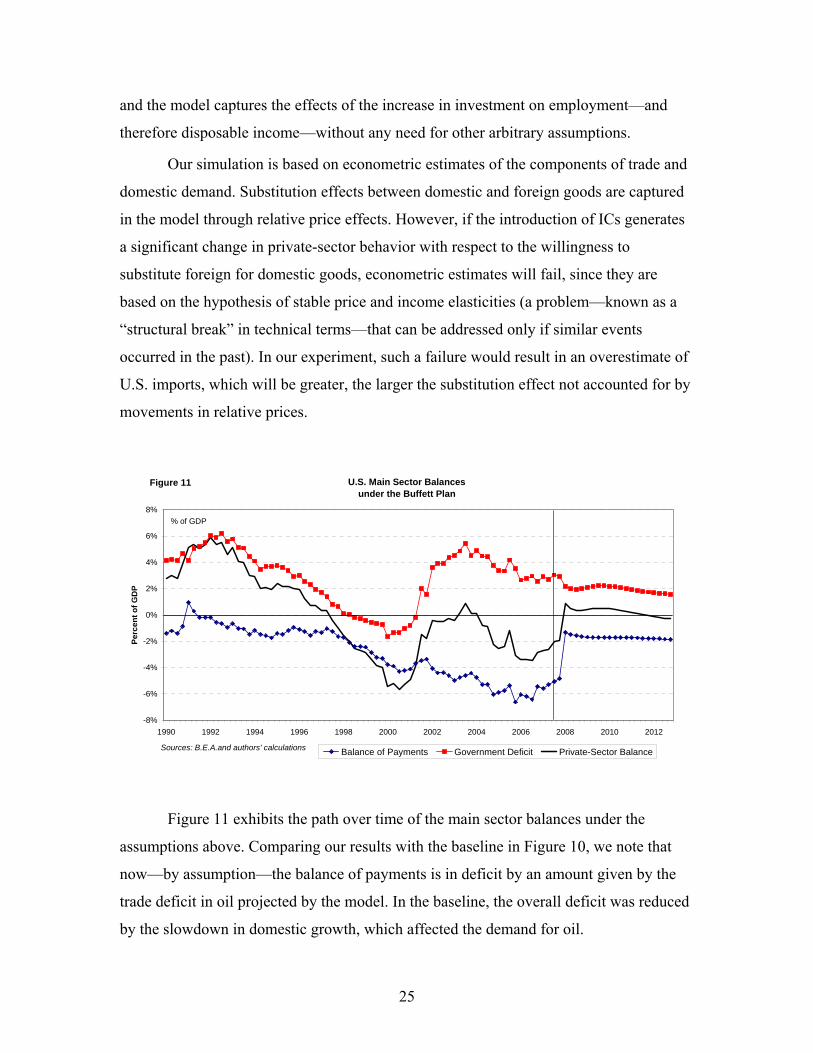
Figure 11 exhibits the path over time of the main sector balances under the
assumptions above. Comparing our results with the baseline in Figure 10, we note that
now—by assumption—the balance of payments is in deficit by an amount given by the
trade deficit in oil projected by the model. In the baseline, the overall deficit was reduced
by the slowdown in domestic growth, which affected the demand for oil.

26
The Buffett plan will have an impact on domestic demand in the United States, as
well as on inflation. We estimate that non-oil import prices will rise by about 9 percent
with the introduction of the ICs, but the effect of the ICs is modeled as a one-time
increase in prices, rather than as a one-time increase in inflation. Such an increase should
make inflation rise to slightly above 4 percent in the year it occurred. We assume that
wages will absorb the drop in purchasing power without a further increase in labor costs.
If this assumption does not hold, the one-time increase in prices would lead to a
permanent increase in the inflation rate. This, in turn, would bring an increase in interest
rates, which would depress aggregate demand—a circumstance that we do not take into
account.
In our simulation, the overall market value of ICs will be about 3 percent of GDP,
which translates into additional value-added for the export sector. (In the absence of
retaliation, which, in this scenario, is assumed to decrease unit revenues for exporters, the
positive impact on exporters’ profits would be larger by about 1.2 percent of projected
GDP.) This will boost aggregate demand in the United States, increasing GDP by an
amount equal to the rise in profits over the course of a year and increasing imports of oil.
The overall balance of payments will thus be slightly worse than in our baseline. The
government deficit will be lower, as the increase in domestic income raises tax revenues.
Summing up, our scenario should be looked at as optimistic with respect to
inflation, which will have asymmetric effects: consumers will bear the cost of the large
increase in the price of imported consumer goods which, as we noted earlier, may not
have close substitutes among domestically produced goods, at least in the short run.
Exporting industries will benefit the most.
9. RESERVATIONS ABOUT THE BUFFETT PLAN: POSSIBLE MARKET
FAILURES
We have several serious reservations about the Buffett plan, despite its clear benefits and
advantages over other achievable changes aimed at reducing the trade deficit.

27
First, we believe that problems could arise due to instability and uncertainty
regarding the prices of certificates. It is well-known that most firms greatly value stability
of the prices of their inputs and outputs, assuring them that investment in new plants,
worker training, and other forms of capital will pay off in future profits (Galbraith 1985
[1967]). If the government implements the Buffett plan, it would have to be prepared to
follow through on its trade deficit targets. Just as with a devaluation, the incentive effects
of the certificate plan would be slow to take effect, since it takes time for industry to
switch from imported inputs to domestically produced ones and for consumers to change
their purchasing habits. Hence, achieving a sharply reduced deficit in short order might
require very strong incentives—in other words, a very high price of the certificates (an
increase of 9 percent in import prices, by our estimate). This would, of course, raise the
prices of many imported goods and domestically produced goods containing imported
inputs, but it also might lead to an instability of costs that would generate additional
difficulties for U.S. business: when a firm or consumer has difficulty adjusting to changes
in costs and prices by switching from one product to another, the result is that their
demands are inelastic—insensitive—to such changes. The demand curve for certificates,
in other words, would be closer to vertical than horizontal. Moreover, all demand curves
are not frozen in place, but are subject to random shocks due to changes in aggregate
demand, weather, consumer tastes, the costs of oil and other commodities, the emergence
of competing firms, and so on. The combination of inelastic demand with shocks that
move the demand curve randomly about is a recipe for instability in the price of
certificates, a case of what economists call “instrument instability” (Holbrook 1972).
Unstable input and output prices are a disincentive to investment, new employment, and
production, since they make future profits more uncertain. Moreover, when firms cannot
be sure in advance of their costs, they may find it risky to sign contracts to buy inputs and
sell outputs at preset prices, a strategy that helps both buyers and sellers in a capitalist
system (Davidson 1978). An unstable price for certificates would be just as much of a
drawback as a high price.
One way of preventing such problems would, of course, be to reduce the
inelasticity of demand for certificates by exempting certain items that have inelastic
demand curves. These would be goods, such as fuel, that have few good substitutes

28
available at reasonable prices. (We have in fact assumed oil would be exempted from
certificate requirements in our simulation.) Leaving aside the important issue of the
environmental impacts and efficiency losses of exemptions, it is clear that they might
open the door to the problems associated with a piecemeal approach, with one industry
after another demanding exemptions on the very compelling and reasonable grounds that
they might otherwise face layoffs and deep drops in profits.
One way of looking at the certificate price–instability problem is to compare the
certificates idea to a more traditional plan that imposed a tariff on all imported goods. A
tariff would have similar effects on the prices of imports and import substitutes to those
of the Buffett plan; as we have seen, tariffs have certain disadvantages, such as an
inability to mandate a numerical target for the deficit. But a tariff program would
essentially be a certificate plan in which an unlimited amount of certificates would be
available at a fixed price. Hence, while tariffs would not ensure a fixed, stable trade
deficit, they would offer a stable price, enabling firms to better forecast their expenses
and revenues.
This instability problem is closely related to additional problems that arise in
connection with specific types of markets for certificates and related markets for futures,
loans, and options. To work effectively, markets of this sort must be liquid, allowing the
quick sale and purchase of certificates with minimal transactions costs. This property of
liquidity is common to most financial markets in advanced economies. Liquid markets
increase the value of financial assets because firms and investors are more willing to buy
investments that they know they can sell later, if they need cash for some reason (Keynes
1936: 150–51). They also assure firms that they will never find it impossible to buy these
investments when they are needed. The availability of a market on which certificates
could be quickly bought and sold would thus be important in a dynamic economy in
which plans sometimes change quickly and time is money.
Not only would it be necessary to create liquid markets, but certain other complex
financial arrangements would probably have to be introduced along with certificates. The
price of certificates may rise over time, as the government gradually reduces its target for
the current account deficit. (Certificates would be good for, say, $110 worth of imports
one year, $105 the following year, etc.) Because importers may anticipate such a rise in
29
cost, they may wish to “bank” certificates that they earn or buy for use in a later year. A
similar need may also arise for the simple reason that a firm that holds certificates may
not need to import goods immediately. A banking option would also make the planning
process more certain, because firms with sufficient cash on hand could be sure of their
costs by purchasing certificates ahead of actual import purchases. So, some form of
banking of certificates with the authorities would probably be needed. However, many
firms will not want to sacrifice cash by holding ICs for long periods of time. Hence, they
may wish to buy futures or options that guarantee the right to purchase certificates at
some future date, just as many companies now hedge against fuel cost increases by
purchasing oil futures or against devaluations by purchasing currency in the forward
market.
Markets for certificates, certificate futures, and options will almost surely be quite
volatile. Liquid markets are subject to abrupt changes in price when investors quickly buy
or sell large amounts, perhaps due to adverse news of some form. Speculators in such
markets buy certificates in order to profit by anticipating short-run movements in their
prices, a process that tends to generate, rather than tame, instability. This is an affliction
common to stock and currency markets. One precedent that is perhaps more apt is the
market for emissions credits in the Emissions Trading System of the European Union.
These markets, and the corresponding markets for derivatives related to emissions
certificates, have shown a great deal of price volatility (Coleman 2007: 6); the use of a
sophisticated trading system has not succeeded in giving investors and firms the ability to
plan based on a stable cost of carbon or emissions. Hence, there is a conundrum of
market stability: it will be necessary to set up liquid certificate markets and certificate-
derivative markets in order to maintain the smooth operation of the certificate system, but
these markets will then inevitably bring problems of their own. (Keynes famously made a
similar argument regarding stock markets [1936: ch. 12].) In the wake of recent financial
difficulties related to the U.S. subprime mortgage industry, the public may have little
appetite for another potentially fragile financial sector.
Perhaps the most serious weakness of the Buffett proposal, or any robust
governmental effort to close the trade gap, is the likely reaction of the World Trade
Organization and our trading partners. Since China and other exporters have benefited in
30
some ways from large U.S. deficits and even encouraged these deficits as part of their
development strategies, they have already shown great reluctance to accept a devaluation
of the dollar or any similar measures. Several European leaders and economic officials
have already been reacting with alarm to the depreciation of the dollar vis-à-vis the euro,
because of its effect on the prices of Europe’s exports to the United States. It is hard to
imagine that foreign governments would not respond to any strong unilateral effort to
close the U.S. trade gap by disputing the action of the World Trade Organization (WTO)
and even unilaterally imposing trade barriers. However, Article 12 of the General
Agreement on Trade and Tariffs (GATT), which was adopted with some revisions by the
WTO, permits the use of controls on imports under certain conditions, which seem to be
met in this case. (For further discussion, see Godley et al. [2005: 10].) Other aspects of
international relations could also be harmed. As with any issue of international
dimensions, diplomacy and cooperation are the preferable approaches. While these
appear to have failed at the moment, the dollar has, as noted earlier, already depreciated
by more than 20 percent against U.S. trading partners. Proposals such as the Buffett plan
would affect all countries and currency blocs, including those that have already seen their
currencies appreciate substantially against the dollar.
10. OTHER POTENTIAL DIFFICULTIES WITH THE BUFFETT PLAN
One key question in regard to any major economic policy change is its effect on the
distribution of income and wealth. Clearly, certain individuals will benefit and others
would be worse off with the implementation of the Buffett plan. Exporting firms and
their workers, along with firms and workers in import-competing U.S. industries, would
probably benefit from increased demand and/or increased prices. Our quantitative
analysis has indicated that the plan would not cause a significant reduction in foreign
prices of U.S. exports, but rather a large increase in exporters’ profits. This windfall
would be smaller in the event of retaliation. On the other hand, workers and firms in
industries that rely on imported inputs or that sell imported goods would probably be
hurt. Moreover, all U.S. consumers might be faced with higher costs for imported goods,
and also higher prices for goods that are substitutes for imports, as demand for them rose.

31
The costs to consumers are unknown, because often firms that export to the
United States do not pass on increases in their costs or changes in the exchange rate to
their U.S. customers. (Most U.S. imports are invoiced in dollars.) If importers in the
United States must buy certificates when they import merchandise, they may simply keep
dollar prices constant and pay for the certificates out of their profits or by “squeezing”
their costs. In fact, the recent devaluation of the dollar has not had a proportional effect
on non-oil import prices in the United States, blunting its effect on import demand. (For a
recent discussion of this issue, see Vigfusson, Sheets, and Gagnon [2007].)
Nonetheless, it must be assumed that import prices would rise significantly under
the Buffett plan or almost any plan to reduce the trade deficit. We have two responses.
First, the United States has been consuming more than it has been producing for many
years by purchasing imports with borrowed money. A rebalancing of trade will, by
definition, end this relationship. Hence, in the absence of enhanced growth, U.S.
consumption will have to fall relative to income, as Americans purchase fewer goods
from abroad and spend more of their workdays producing goods for world consumption.
This will probably require some type of rise in the price of imports. Otherwise, the
country might have to wait for a severe recession and reduced employment to accomplish
the task of forcing U.S. residents to purchase fewer imports. This is one reason that the
Levy Institute has argued for some time that a devaluation or, as a last resort, an across-
the-board tariff might be a part of the solution to unsustainable balances: in the absence
of such measures, any adjustment of the balances would have grave macroeconomic
consequences (Godley et al. 2005). Higher import prices may be bitter medicine, but
easier to swallow than any other medicines for the current-account malady. To the extent
that some rebalancing is inevitable—hardly a controversial proposition—it will not come
without cost to U.S. consumption, whether through reduced household income, higher
import prices, or import rationing. (This would be avoided to the extent that export
demand rose due to increased aggregate demand in our trading partners; even if the
relative price of U.S. exports remains the same in foreign countries, demand for them will
increase as foreign income increases. However, U.S. policymakers have only limited
influence on macroeconomic policies abroad and there is only so much such policies can
achieve.)

32
A second reason why it may be best to accept the costs to some U.S. residents that
will come with the Buffett plan is that policymakers have the means at hand to make sure
these costs are not borne by those least able to handle them. Many industries and workers
would benefit significantly from the plan. (We have not discussed certain political-
economic benefits emphasized by Buffett [2003] and others, which are very much worth
considering, but beyond the scope of this paper.) Furthermore, the nation would benefit in
the long run from reducing the current account imbalance rather than waiting for some
crisis, such as a loss of confidence in the dollar and a plunge in its value, to abruptly
“solve” the problem. In light of the benefits that many people would enjoy, it seems
reasonable to use the tax system to distribute some of the benefits to lower- and middle-
income U.S. taxpayers. This brings us to our alternative proposal.
11. AN ALTERNATIVE APPROACH TO THE BUFFETT PLAN: WORKERS
TRADE IMPORTS FOR LOWER PAYROLL TAXES
We believe that a fair way of distributing the benefits of balancing the current account
deficit would be to auction certificates directly to importers, rather than granting them
without charge to exporters; the government would then use the auction proceeds to
offset reductions in payroll taxes, capturing revenues that would otherwise add to the
profits of exporters. In this way, some of the financial complexities introduced by the
certificates might be lessened, as importers could simply buy certificates at an auction—
much like today’s Treasury bond auctions—rather than going to a market akin to a stock
exchange.
This alternative plan would by no means be perfect, but it would nonetheless offer
the following additional advantages over the original Buffett plan. First, workers
themselves would be better rewarded for their efforts. We believe that workers would not
be able to increase their work effort very much, even with this additional reward, but they
will feel more fairly compensated. This seems appropriate at a time when the wealthy
have enjoyed significant tax cuts and the gap between the rich and those of modest means
has widened dramatically. Many workers who earn so little that they pay no federal
income tax must nevertheless sacrifice a sizeable chunk of their wages and salaries to

33
payroll taxes. A payroll tax cut would ease the effects of higher prices for imported
goods, especially for such workers.
Second, while granting certificates as credit for exports would provide an
incentive for exporters, lower payroll taxes might help the export industry, too (Minsky
1986); in addition to exporters, producers of nontraded goods might benefit from reduced
labor costs. Both of these incentive effects would accentuate the trade deficit–reducing
impact of the certificate plan. Most neoclassical theories of tax incidence assert that
workers bear the full cost of payroll taxes whether they are deducted from pay or charged
to the employer, but to the extent that this theory is incorrect or only an approximation of
reality, firms would enjoy a supply-side stimulus.
Third, an auction to allocate certificates might be less subject to certain forms of
fraud than Buffett’s original plan. If certificates were granted by the government to
companies that exported goods, as in the original Buffett proposal, dishonest companies
might be tempted to falsify or inflate foreign transactions, say, by “selling” nonexistent
goods to a friendly overseas company. (This problem would be even more likely to occur
if certificates were also given to firms that exported services, which are more difficult to
verify and now account for a very large percentage of foreign trade.) The use of
government auctions of certificates would prevent this form of fraud, which could
otherwise undermine the effectiveness of the program. Also, auctions would have lower
administrative costs than a system to collect information on exports and distribute
certificates.
12. EVALUATING THE ALTERNATIVE VERSION OF THE BUFFETT PLAN:
ESTIMATES OF THE IMPACT
To evaluate this alternative version of the Buffett plan, we modify our previous exercise,
now assuming that all receipts from ICs accrue to the government, which uses these
funds to decrease employers’ and employees’ contributions for Social Security, so that
the policy combination leaves the government deficit roughly in line with our baseline
(not taking into account tax receipts related to the business cycle) (Figure 12).

34
In this exercise, we estimate the market value of the ICs to be lower than in the
previous exercise, at around 2 percent of GDP (4.9 perccent of “taxable payroll,” or
earned income up to $102,000 for each earner), and we assume that the ratio of
employers’ and employees’ contributions to GDP fall by about 1 percent each (and
recover subsequently, as the balance of payments improves and the market value of ICs is
reduced), generating a drop in production costs which we assume will be reflected in
inflation, offsetting the higher price of imports, and increasing competitiveness for U.S.
exporters.
Our model shows that―under these assumptions―the gains for exporters from
the slower dynamics of domestic costs generates a benefit for exporters that is equivalent
to what we obtained in the previous exercise, in which revenues from the sales of ICs
went entirely to the exporting sector.
As in our previous exercise, the reduction in contributions gives a strong stimulus
to domestic demand, with real GDP gaining more than 2 percent with respect to our
baseline projection.
U.S. Main Sector Balancesunder a "Revised Buffett Plan"
-8%
-6%
-4%
-2%
0%
2%
4%
6%
8%
1990 1992 1994 1996 1998 2000 2002 2004 2006 2008 2010 2012
Perc
ent o
f GD
P
Balance of Payments Government Deficit Private-Sector Balance
Figure 12
Sources: B.E.A.and authors' calculations
Our simulation shows that the effect of the revised Buffett Plan on the main sector
balances is very similar to that in the previous experiment (Figure 12). The impact on

35
inflation should be the same as discussed above for the previous experiment, but the
impact on growth should be slightly larger (Figure 13). The cost-of-living impact of the
plan would be ameliorated in our alternative by a payroll tax cut of approximately 2.4
percentage points each for employers and employees.
Real GDP Growthunder Alternative Assumptions
-2%
0%
2%
4%
6%
8%
10%
12%
2000 2001 2002 2003 2004 2005 2006 2007 2008 2009 2010 2011 2012
Perc
ent o
f GD
P
Baseline Projection Buffett Plan Alternative Buffett Plan
Figure 13
Sources: B.E.A.and authors' calculations
13. CONCLUSIONS The nation’s three balances—for the private and public sectors, and the current account—
are important drivers of the economy. Most economists have underestimated the short-
and medium-term impacts of large-scale macroeconomic imbalances. In our view,
policymakers must take a more strategic view toward the three balances, while
recognizing that it is difficult to “manage” or tightly regulate them. Hence, we do not
reject out of hand any effort to bring the U.S. current account balance deficit down to
more sustainable proportions. Such a measure would probably involve some change in
import and/or export prices; in this paper, we have shown that the link between these
prices and the current account deficit is complex, but reliable enough to form the basis for
a stronger trade policy. Moreover, as discussed above, the Buffett plan has a number of
advantages over other protectionist responses to the current account deficit, in particular

36
that it would not selectively target countries and industries and would work toward deficit
targets without goals or quotas for individual products. Simulations using the Levy
Institute macroeconometric model show that the Buffett plan would result in higher
growth and it would reduce the balance of payments deficit to about 2 percent of GDP
(mainly oil imports, which would not be covered by the plan under our assumptions)
more quickly than a continuation of current policies.
These results do not take into account certain sorts of problems the government
might face when it implemented the new policy, which cannot easily be incorporated into
a mathematical model. We have a number of serious reservations and believe that the
Buffett plan might not work well in practice. First of all, a plan like Buffett’s that sets a
target for the trade deficit (as a percentage of non-oil exports) might lead to very high
import prices for American consumers. Once a deficit target was selected, the market for
certificates would set a price that might be very high and could not be controlled by the
government. We have estimated the cost to be a 9 percent increase in import prices.
Moreover, since the market would be very liquid, the price of certificates might vary
erratically from day to day and season to season. Second, the plan would bring a strong
international reaction, with economic and diplomatic repercussions.
Despite these and other problems detailed above, policymakers may feel that
immediate action to reduce the trade deficit is necessary. In this case, we would prefer
our version of Buffett’s plan to the original. Our plan would leave the proceeds of
certificate sales in the pockets of workers. Instead of granting certificates without charge
to exporters, the government would auction them directly to importers. Certificate
auction revenues would be used to fund reductions in the FICA payroll tax. This
alternative would be fairer to workers of modest means, less vulnerable to fraud, and less
costly to administer. According to our simulations, the alternative plan would, on
balance, perform at least as well as the original Buffett plan. Economic growth would be
even higher over the short term than under current policy or the original certificate plan.
The projected growth recession would be shallower than under status quo policies or the
original Buffett plan, falling to a low of about 1.5 percent in the third quarter of 2009
instead bottoming out at an estimated 1.2 percent in the second quarter of that year, as it
would under the original Buffett proposal. However, growth would be slower for the
37
remainder of the projection period. The alternative plan would effect a return to a more
sustainable current account deficit, with the external balance following similar paths in
both certificate-plan scenarios. Moreover, the alternative plan would soften the impact of
the expected increase in import prices with a cut in social insurance payroll taxes of 4.9
percentage points (2.4 percentage points each for employers’ and employees’
contributions) in the first quarter of 2008.

38
REFERENCES Buffett, Warren E. 2003. “America’s Deficit is Selling the Nation Out from under Us.
Here’s a Way to Fix the Problem—And We Need to Do It Now.” Fortune, October 26.
Coleman, Les. 2007. “Carbon Trading: Solution or Chimera?” Working Paper. Parkville,
Victoria, Australia: The University of Melbourne. Davidson, Paul. 1978. Money and the Real World. New York: Macmillan. Dos Santos, Claudio, Anwar Shaikh, and Gennaro Zezza. 2003. “Measures of the Real
GDP of U.S. Trading Partners: Methodology and Results.” Working Paper No. 387. Annandale-on-Hudson, New York: The Levy Economics Institute of Bard College.
Feldstein, Martin. 2007. “How To Avert a Recession.” Wall Street Journal, December 5. Galbraith, John Kenneth. 1985 [1967]. The New Industrial State. New York: New
American Library. Godley, Wynne. 1999. Seven Unsustainable Processes: Medium-Term Prospects and
Policies for the United States and the World. Strategic Analysis. Annandale-on-Hudson, New York: The Levy Economics Institute of Bard College.
Godley, Wynne, Dimitri B. Papadimitriou, Claudio H. Dos Santos, and Gennaro Zezza.
2005. The United States and her Creditors: Can the Symbiosis Last? Strategic Analysis. Annandale-on-Hudson, New York: The Levy Economics Institute of Bard College.
Godley, Wynne, Dimitri B. Papadimitriou, Greg Hannsgen, and Gennaro Zezza. 2007.
The U.S. Economy: Is There a Way Out of the Woods? Strategic Analysis. Annandale-on-Hudson, New York: The Levy Economics Institute of Bard College.
Hobrook, Robert S. 1972. “Optimal Economic Policy and the Problem of Instrument
Instability.” American Economic Review 62(1): 57–65. Houthakker, H.S., and Stephen P. Magee. 1969. “Income and Price Elasticities in World
Trade.” Review of Economics and Statistics 51(2): 111–125. Keynes, John Maynard. 1936. The General Theory of Employment, Interest, and Money.
New York: Harcourt Brace. Loretan, Mirco. 2005. “Indexes of the Foreign Exchange Value of the Dollar.” Federal
Reserve Bulletin, Winter. Minsky, Hyman P. 1975. John Maynard Keynes. New York: Columbia University Press.
39
————. 1986. Stabilizing an Unstable Economy. New Haven, Connecticut: Yale University Press.
Oakley, David. 2007. “Corporate Bond Costs Climb to Five-year High.” Financial Times,
November 29. Papadimitriou, Dimitri B., Greg Hannsgen, and Gennaro Zezza. 2007. “The Effects of a
Decline in Housing Market on the U.S. Economy.” Working Paper No. 506. Annandale-on-Hudson, NY: The Levy Economics Institute of Bard College.
Reuters. 2007. “Citigroup May Write Down up to $18.7B.” USA Today, December 27. Schultz, George, and John Taylor. 2007. “The Silver Lining in America’s Subprime
Cloud.” Financial Times, November 6. Stiglitz, Joseph. 2008. “Stagflation Cometh.” January 2. Available at:
commentisfree.guardian.co.uk/joseph_stiglitz/2008/01/stagflation_cometh.html Summers, Lawrence H. 2007. “The State of the U.S. Economy.” Speech at the Brookings
Institution, Washington, D.C., December 19. Tett, Gillian. 2007. “Banks’ Mortgage Writeoffs to Hit $60 Billion.” Financial Times,
November 8. Vigfusson, Robert J., Nathan Sheets, and Joseph Gagnon. 2007. “Exchange Rate Pass-
Through to Export Prices: Assessing Some Cross-Country Evidence.” International Finance Discussion Papers. Washington, D.C.: Board of Governors of the Federal Reserve System.
Whalen, Charles J. 2007. The U.S. Credit Crunch of 2007: A Minsky Moment. Public
Policy Brief No. 92. Annandale-on-Hudson, New York: The Levy Economics Institute of Bard College.