the brighton and hove black and minority ethnic needs assessment
TRANSCRIPT

The Brighton and Hove Black and Minority Ethnic Needs Assessment
What is a Needs Assessment?

- Local Black and Minority Ethnic communities felt that the council and other public agencies in the city didn’t fully understand who the community were and what some of the problems they were facing might be.
- The council and other agencies listened to this and identified some funding to undertake some research.
- BMECP (the Black and Minority Ethnic Community Partnership) worked with the community to set up a steering group to over-see the project.
- The Steering Group includes representatives of BME community groups in the city as well as the council, police and NHS.
Why has this project happened?

BME Data ‘Snapshot’ – Key Findings

23,494
10,408
11,278
4,188
2,184 1,799
Non UK/British WhiteMixed / multiple ethnic groupAsian / Asian BritishBlack/African/Caribbean/Black BritishArabAny other ethnic group
220,018
53,351
English / Welsh / Scottish / Northern Irish / British
Black & Minority Ethnic (BME)
20% or 53,351 B&H residents are BME….
44% of BME residents are Non UK/British White
Our BME population is increasing…

BME residents’ age profile is younger
0%
2%
4%
6%
8%
10%
12%
14%
16%
18%
20%
White UK/British (n=220,018) White Irish (n=3,772)
Other White (n=19,524) Mixed/multiple ethnic group (n=10,408)
Asian/Asian British (n=11,278) Black/Black British (n=4,188)
Arab (n=2,184) other ethnic group (n=1,799)
91.8%
8.1%
English / Welsh / Scottish / Northern Irish / British
Black & Minority Ethnic (BME)
…just 8.1 per cent of over 65 year olds are from BME back-grounds
…One fifth of our children and young people are from a BME background.
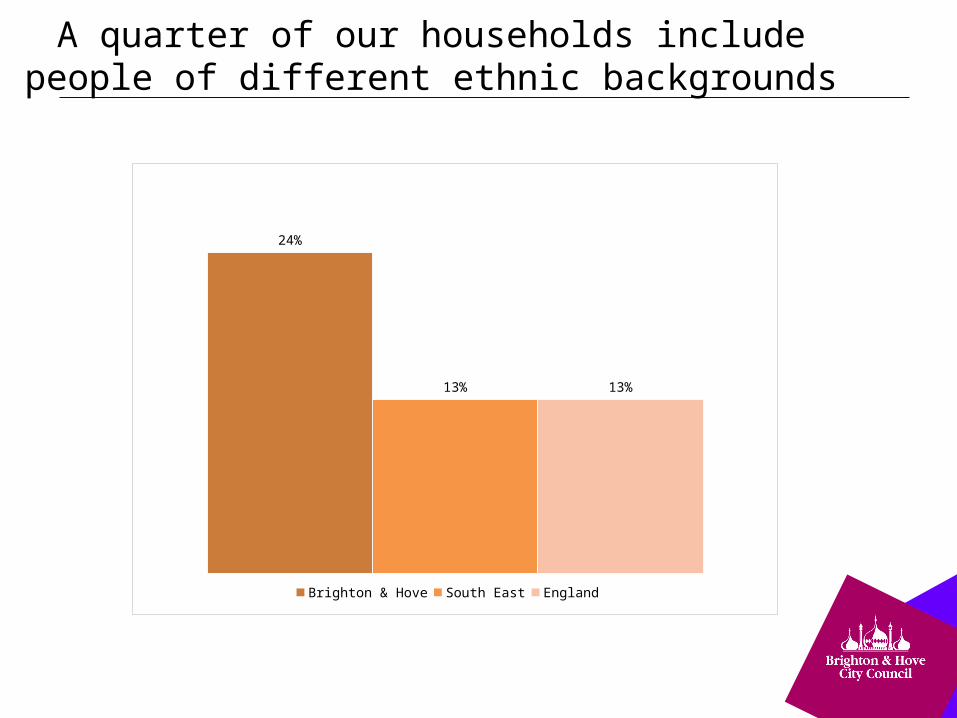
A quarter of our households include people of different ethnic backgrounds
24%
13% 13%
Brighton & Hove South East England

BME Children and Young People tend not to reach their full potential, compared to White British
EAL attainment gaps 2012 at EYFS, Key Stages 1 and 2
% achieving good level of development
EYFS Brighton & Hove 16%
England 9%
% achieving expected Level 2
Reading Writing Maths
Key Stage 1 Brighton & Hove 11% 12% 4%
England 4% 4% 3%
% achieving expected Level 4
Key Stage 2 Brighton & Hove 6%
England 2%

This is particularly true for Black or Black British pupils eligible for free school meals
All Brighton & Hove pupils not eligible for FSMAll Brighton & Hove pupils eligible for FSMBlack or Black British pupils not eligible for FSMBlack or Black British pupils eligible for FSM 16.7%
52.8%
Key Stage 4 attainment by eligibility for FSM and by ethnicity% achieving 5 GCSEs (A*-C) incl Eng and Maths
61.2%26.9%

Housing issues highlighted in snapshot report
Comparator Notable differences in outcomes
40% BME
-46% Bangladeshi
12% BME
-33% Bangladeshi
-32% Gypsy & Irish Traveller
-5% Indian
45% BME
-56% Other White
-48% Black/Black British
-17% Bangladeshi
Private rented homes - % living in private rented accommodation
24% White UK/British
Home ownership-% living in owned or part-owned accommodation
59% White UK/ British
Social rented homes- % living in social housing
15% White UK/British
BME residents are much more likely to rent from a private landlord and less likely to own a home

All non-white ethnic groups had higher than average unemployment rates; four groups had rates at least
twice the city average
7.3%
18.7%
16.9%15.9% 15.3%
Average Black African White & Black African White & Black Caribbean Gypsy or Irish Traveller

What we have done and will do in the future.
• The Steering Group has prioritised working on issues related to Housing, Employment and Education
• It has held events to ensure the views of BME people are fed into the Council’s new Housing Strategy.
• Our Chair is now a member of the Council’s ‘Closing the Gap’ working group. This group is working on a number of projects to reduce the gap between attainment levels of BME pupils and their White British peers.
• It has presented the findings to the City Employment and Skills Steering Group and they have agreed to have a focus on skills and employment support for BME communities in their next action plans.
• We are now organising community events to feed into the schools work and look at what services the BME community would like to use and improve.

To help us with our work we would like to ask you some questions.

7%
9%
11%
2%
7%
27%
9%
29%
Q1 - Where do you (find it easiest) to get information from ?
A. Word of mouthB. LeafletsC. WebsiteD. Social mediaE. SchoolsF. Community/voluntary groupsG. BMECP centreH. Other community centres

13%
28%
11%
13%
24%
4%
7%
Q2. How would you like (prefer) to be involved in /kept in touch/contribute to the work of the BMENAG?
A. Survey – paper / onlineB. NewsletterC. EventsD. Regular meetingsE. Drop inF. Direct contact with community groupsG. Internet / social media