the brazilian journal of infectious diseases quantitative pcr assays (semi-quantitative,...
TRANSCRIPT

O
Dhp
MVa
Cb
V
a
A
R
A
A
K
E
r
v
P
1h
b r a z j i n f e c t d i s . 2 0 1 4;1 8(3):271–280
The Brazilian Journal of
INFECTIOUS DISEASESwww.elsev ier .com/ locate /b j id
riginal article
uplex realtime PCR method for Epstein–Barr virus anduman DNA quantification: its application forost-transplant lymphoproliferative disorders detection
aría Dolores Fellnera,∗, Karina Duranda, Marcelo Rodriguezb, Lucía Irazub,irginia Alonioa, María Alejandra Picconia
Oncogenic Viruses Service, Virology Department, National Institute of Infectious Diseases “Carlos G. Malbrán”, Av. Vélez Sársfield 563,1282AFF Buenos Aires, ArgentinaOperational Team Quality Management, Parasitology Department, National Institute of Infectious Diseases “Carlos G. Malbrán”, Av.élez Sársfield 563, C1282AFF Buenos Aires, Argentina
r t i c l e i n f o
rticle history:
eceived 10 June 2013
ccepted 16 July 2013
vailable online 2 January 2014
eywords:
BV
eal-time PCR
iral load
TLD
a b s t r a c t
Introduction: The quantification of circulating Epstein–Barr virus (EBV) DNA is used to moni-
tor transplant patients as an early marker of Post-Transplant Lymphoproliferative Disorders
(PTLD). So far no standardized methodology exists for such determination.
Objective: Our purpose was to develop and validate a real-time PCR assay to quantify EBV
DNA in clinical samples from transplant recipients.
Methods: A duplex real-time PCR method was developed to amplify DNA from EBV and
from a human gene. The EBV load was determined in peripheral blood mononuclear
cells (PBMC), plasma and oropharyngeal tissue from 64 non-transplanted patients with
lymphoid-hypertrophy (Non-Tx), 47 transplant recipients without PTLD (Tx), 54 recipients
with PTLD (Tx-PTLD), and 66 blood donors (BD). WinPEPI, version 11.14 software was used
for statistical analysis.
Results: Analytical validation: the intra and inter-assays variation coefficients were less than
4.5% (EBV-reaction) and 3% (glyceraldehyde 3-phosphate dehydrogenase – GAPDH reaction).
Linear ranges comprised 107–10 EBV genome equivalents (gEq) (EBV-reaction) and 500,000–32
human gEq (GAPDH-reaction). The detection limit was 2.9 EBV gEq (EBV-reaction). Both reac-
tions showed specificity. Application to clinical samples: higher levels of EBV were found in
oropharyngeal tissue from transplanted groups with and without PTLD, compared to Non-
Tx (p < 0.05). The EBV load in PBMC from the groups of BD, Non-Tx, Tx and Tx-PTLD exhibited
increasing levels (p < 0.05). In BD, PBMC and plasma, EBV loads were undetectable.
Conclusions: The performance of the assay was suitable for the required clinical application.
The assay may be useful
laboratories from low-inc
© 2013 E
∗ Corresponding author.E-mail addresses: [email protected], [email protected] (M.D
413-8670 © 2013 Elsevier Editora Ltda.
ttp://dx.doi.org/10.1016/j.bjid.2013.07.011Este é um artigo Open Access sob a licença
to monitor EBV infection in transplant patients, in particular in
ome regions that cannot afford to use commercial assays.
lsevier Editora Ltda.
. Fellner).
de CC BY-NC-ND
Este é um artigo Open Access sob a licença de CC BY-NC-ND

i s . 2 0
(
272 b r a z j i n f e c t d
Introduction
The quantification of Epstein–Barr virus (EBV) peripheral DNAis used to monitor transplant patients as an early markerof Post-Transplant Lymphoproliferative Disorders (PTLD).1–3
It has been proven that EBV load in peripheral blood sam-ples from transplant patients with PTLD is higher than intransplant recipients without this disorder.4–6 Along the lastdecade, different quantitative PCR assays (semi-quantitative,competitive, real-time) have been used for surveillance, diag-nosis, monitoring response to treatment, and determinationof the degree of immunosupression to be applied. So far, thereis no reference strategy to determine EBV load, including forinstance the calibrator, the EBV region to be amplified, or thebest sample type for identifying PTLD risk.7,8
No international standards were available until 2012, whenthe World Health Organization introduced the first WHOInternational Standard for Epstein–Barr virus, intended to beused for nucleic acid amplification techniques.9 Thus, the lit-erature describes a variety of controls used to analyticallyvalidate EBV quantification assays, including cell lines,10–12
plasmids with EBV-genome fragments inserted,13,14 and com-mercially available controls containing viral particles.15,16 Asno international standard or consensus-accepted control havebeen developed,17–19 each laboratory decided what calibra-tor to use to validate its own EBV quantification method.Different fragments of EBV genes were chosen for amplifica-tion in a variety of quantification assays, including repeated(BamHI-W region) or single (EBERs, EBNA-1, LMP-2, etc) viralgenome regions20,21 with different degrees of sensitivity oraccuracy, as previously described.22,23 Moreover, several bloodsample types (peripheral blood mononuclear cells, plasma,and whole blood) were analyzed to identify PTLD. Moststudies described and/or recommended using cell-associatedblood samples over plasma/serum, but both specimen typesappear to be informative and each laboratory determines itspreference.24,25 Also, the extraction methods, the amount ofsample to be analysed, the report format and the charac-teristics of the study populations vary between publisheddata.7,20,21 Thus, all these factors have affected the compar-ison between methods.
Several years ago, our laboratory developed a semiquan-titative PCR strategy to measure EBV load26 and sincethen it has been used to monitor this viral infection intransplanted population from most of the institutions thatperform organ transplantation in Argentina. The methodis quite cumbersome and time-consuming; results demandat least 48 hours. Currently, real-time PCR quantificationmethods are widely applied to assess EBV load due totheir advantages over conventional PCR assays.3,7,21 More-over, the simultaneous amplification of an internal controlalong with the target DNA is widely used to detect the pres-ence of inhibitors; it also allows to quantify the amountof sample present in the reaction, which permits viral loadnormalization.10,27
Despite the current availability of commercial assays, many
laboratories from low income regions are unable to affordthem; thus, less-costly in-house methods may be the onlyoption to monitor EBV load in transplant patients. Their1 4;1 8(3):271–280
development and validation could be extremely useful for theprevention of PTLD in these settings.
Therefore, the aim of the present study was to develop andanalytically validate a duplex real-time PCR assay to quantifyEBV and human DNA in different types of clinical samples,in order to determine the EBV load in transplant patientsregarding the risk of PTLD.
Materials and methods
Patients and samples
Children treated in “Prof. Dr Juan P. Garrahan” PediatricHospital, Austral University Hospital, “Sor María Ludovica”Children’s Hospital” and Favaloro Foundation, and blooddonors of the “J. F. Muniz” Infectious Diseases Hospital wereincluded as follows:
A) 64 non-transplanted patients with lymphoid hypertrophyin the oropharyngeal tissue.
(B) 101 solid organ transplant patients (75 liver, 24 kidney,2 heart), 54 of them with histological diagnosis of PTLD(including categories 1, 2, 3 and 4), according to the WorldHealth Organization: IARC, 2008.28
(C) 66 blood donors, with negative results for all infectionsscreened in routine blood bank protocol (hepatitis Cvirus, hepatitis B virus, human T lymphotropic virus I/II,human immunodeficiency virus, syphilis, brucellosis, andChagas′ infection).
All patients were infected with EBV according to the pres-ence of IgG antibodies against viral capsid antigen (VCA)and/or viral DNA in peripheral blood.
Patients in the transplant group were on an immuno-suppressive regimen consisting of cyclosporine, tacrolimusor sirolimus, azathioprine or mycophenolate mofetil andsteroids.
Peripheral blood and oropharyngeal lymphoid tissue sam-ples were taken due to oropharyngeal lymphoid hypertrophy,following the treatment protocol for transplant and non-transplanted patients. An informed consent was obtained inall cases as per the Helsinki declaration and other nationaland international regulations.
Peripheral blood mononuclear cells (PBMC) and plasmawere separated from 2.5 to 5 mL of EDTA-anticoagulatedwhole blood samples by centrifugation on a density gradi-ent (Histopaque-1077, Sigma–Aldrich) and stored at −20 ◦C.Oropharyngeal lymphoid tissue samples obtained throughsurgical removal from patients with lymphoid hypertrophywere stored at −80 ◦C.
Controls and Calibrators
- EBV-specific reaction (EBNA-1 reaction)
A plasmid containing a deleted fragment of the EBNA-1coding gene from the EBV genome was used as calibrator ofthe real-time PCR quantification method. It had been previ-ously developed in our laboratory to be used as competitor in
2 0 1
ap
it
A
B
ac
--
c(qs
o5Aoe
P
PTtButpA
D
De
(ae
R
Afia3
b r a z j i n f e c t d i s .
quantitative competitive PCR. It was quantified by spectro-hotometry at 260 nm and stored at −80◦ C.
Calibrators were generated to exhibit the same character-stics as the clinical samples. Thus, for the EBNA-1 reaction,wo types of calibrators were prepared:
Calibrators representative of cell-associated samples(peripheral blood mononuclear cells, tissues): serial dilu-tions of the PEBNA-1 were performed and placed on abackground of 366 ng of commercially available humanDNA (equivalent to 105 human cells).26
Calibrators representative of cell-free samples(plasma/serum): serial dilutions of the PEBNA-1 wereperformed without the human DNA background.
This allowed studying seven levels of EBV genome equiv-lents: 107, 106, 105, 104, 103, 102 and 10 for each type ofalibrator.
Human-specific reaction (GAPDH-reaction)
Commercially available human DNA was used as a positiveontrol for the glyceraldehyde 3-phosphate dehydrogenaseGAPDH) reaction (Human Genomic DNA, Roche); which wasuantified by spectrophotometry at 260 nm, aliquoted andtored at −80◦ C.
Thus, seven calibrators were generated by 1/5 dilutionf the commercially available human control, representing:
× 105, 105, 2 × 10⁴, 4 × 10³, 8 × 10², 160 and 32 human cells.ll these DNA concentrations were analyzed in the presencef high (106 EBV genome equivalents) or low (10 EBV genomequivalents) amounts, or in absence of the control PEBNA-1.
EBNA-1 sequencing
EBNA-1 was characterized by sequencing with the BigDyeerminator Sequencing kit v3.1, according to manufac-urer’s recommendations in the Genetic Analyzer 3500 (Appliediosystems-Hitachi). The sequence analysis was performedsing the Sequencing Analysis Software v5.2 (Applied Biosys-ems). The PEBNA-1 sequence was compared with that of therototypic EBV strain, B95-8, applying the BioEdit Sequencelignment editor v7.0.9.
NA extraction
NA from PBMC and oropharyngeal tissue samples wasxtracted as previously described.26
Plasma DNA was extracted using the QIAmp DNA mini kitQIAgen) according to manufacturer’s instructions, taking intoccount the suggested recommendations for free viral DNAxtraction.
eal-time PCR method for EBV DNA quantification
duplex real-time PCR strategy that simultaneously ampli-es portions of the EBV and of the human genome waspplied, encoding the EBNA-1 protein and the glyceraldehyde-phosphate dehydrogenase (GAPDH) enzyme respectively.
4;1 8(3):271–280 273
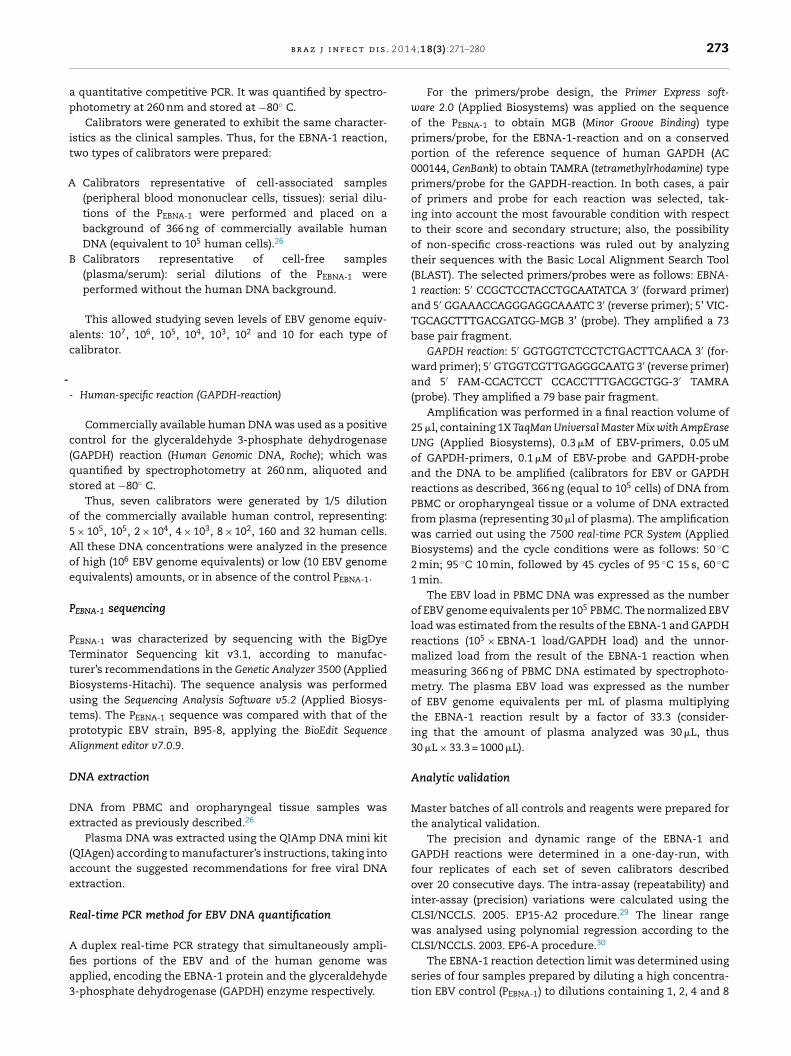
For the primers/probe design, the Primer Express soft-ware 2.0 (Applied Biosystems) was applied on the sequenceof the PEBNA-1 to obtain MGB (Minor Groove Binding) typeprimers/probe, for the EBNA-1-reaction and on a conservedportion of the reference sequence of human GAPDH (AC000144, GenBank) to obtain TAMRA (tetramethylrhodamine) typeprimers/probe for the GAPDH-reaction. In both cases, a pairof primers and probe for each reaction was selected, tak-ing into account the most favourable condition with respectto their score and secondary structure; also, the possibilityof non-specific cross-reactions was ruled out by analyzingtheir sequences with the Basic Local Alignment Search Tool(BLAST). The selected primers/probes were as follows: EBNA-1 reaction: 5′ CCGCTCCTACCTGCAATATCA 3′ (forward primer)and 5′ GGAAACCAGGGAGGCAAATC 3′ (reverse primer); 5’ VIC-TGCAGCTTTGACGATGG-MGB 3’ (probe). They amplified a 73base pair fragment.
GAPDH reaction: 5′ GGTGGTCTCCTCTGACTTCAACA 3′ (for-ward primer); 5′ GTGGTCGTTGAGGGCAATG 3′ (reverse primer)and 5′ FAM-CCACTCCT CCACCTTTGACGCTGG-3′ TAMRA(probe). They amplified a 79 base pair fragment.
Amplification was performed in a final reaction volume of25 �l, containing 1X TaqMan Universal Master Mix with AmpEraseUNG (Applied Biosystems), 0.3 �M of EBV-primers, 0.05 uMof GAPDH-primers, 0.1 �M of EBV-probe and GAPDH-probeand the DNA to be amplified (calibrators for EBV or GAPDHreactions as described, 366 ng (equal to 105 cells) of DNA fromPBMC or oropharyngeal tissue or a volume of DNA extractedfrom plasma (representing 30 �l of plasma). The amplificationwas carried out using the 7500 real-time PCR System (AppliedBiosystems) and the cycle conditions were as follows: 50 ◦C2 min; 95 ◦C 10 min, followed by 45 cycles of 95 ◦C 15 s, 60 ◦C1 min.
The EBV load in PBMC DNA was expressed as the numberof EBV genome equivalents per 105 PBMC. The normalized EBVload was estimated from the results of the EBNA-1 and GAPDHreactions (105 × EBNA-1 load/GAPDH load) and the unnor-malized load from the result of the EBNA-1 reaction whenmeasuring 366 ng of PBMC DNA estimated by spectrophoto-metry. The plasma EBV load was expressed as the numberof EBV genome equivalents per mL of plasma multiplyingthe EBNA-1 reaction result by a factor of 33.3 (consider-ing that the amount of plasma analyzed was 30 �L, thus30 �L × 33.3 = 1000 �L).
Analytic validation
Master batches of all controls and reagents were prepared forthe analytical validation.
The precision and dynamic range of the EBNA-1 andGAPDH reactions were determined in a one-day-run, withfour replicates of each set of seven calibrators describedover 20 consecutive days. The intra-assay (repeatability) andinter-assay (precision) variations were calculated using theCLSI/NCCLS. 2005. EP15-A2 procedure.29 The linear rangewas analysed using polynomial regression according to the
30
CLSI/NCCLS. 2003. EP6-A procedure.The EBNA-1 reaction detection limit was determined usingseries of four samples prepared by diluting a high concentra-tion EBV control (PEBNA-1) to dilutions containing 1, 2, 4 and 8

274 b r a z j i n f e c t d i s . 2 0 1 4;1 8(3):271–280
Table 1 – Description of the patients.
Patients N Sex M/F Agea Organtransplanted
Agea attransplant
Cause oftransplant
Transplantpatients
Non-PTLD 47 0.9 9.7(0.5–19)
Liver (42)Kidney (5)
2.8(0.5–12)
Liver: FHF, BAEC, GLKidney: CRF
PTLD 54 1.5 8.0(1–18)
Liver (35)Kidney (19)Heart (2)
4.7(0.5–10)
Liver: FHF, BA,EC, GLKidney: CRFHeart: UC
Non-transplantedpatients
64 1.8 7.0(0.5–19)
– – –
Blood donors 66 2.3 36(18–61)
– –
biliary atresia; EC: sclerosing cholangitis; GL: glycogenosis type 1B and 3.
B
B
95-810
60
110
160
210
260 280270
220 230 240 250
170 180 190
EBV-MGB Probe
200
120 130 140 150
70 80 90 100
35 bp deletion
CATTGAGTCG TCTCCCCTTT GGAATGGCCC
GGCCCACTAA GGGAGTCCAT TGTCTGTTAT TTCATTGTCT TTTTACAAAC
TCATATATTT
CAAAGCCCGC
GATGGAGTAG ATTTGCCTCC
Reverse EBV-primer
CGCGGAGGGT GATGACGGAG ATGACGGAGA TGAAGGAG
CTGGTTTCCA CCTATGGTGG AAGGGGCTGC
Forward EBV-Primer
TCCTACCTGC AATATCAAGG TGACTGTGTG CAGCTTTGAC
GCTGAGGGTT TGAAGGATGC GATTAAGGAC CTTGTTTTGC
CTGGACCCGG CCCACAACCT
20 30 40 50
95-8
B 95-8
B 95-8
B 95-8
B 95-8
PEBNA-1
PEBNA-1
PEBNA-1
PEBNA-1
PEBNA-1
PEBNA-1
Fig. 1 – Characterization of the EBV-fragment sequenceinserted in the PEBNA-1. The 35 bp deletion in the EBVfragment of PEBNA-1 and the forward/reverse primers. (– – –)and probe (—) used in the EBV-specific real-time PCR
a Age in years, mean and range. FHF: fulminant hepatic failure; BA:
CRF: Chronic renal failure. UC: unknown cause
copies of EBV genome equivalents, either in a background ofhuman DNA representing 105 cells (366 ng) or without the DNAbackground. Twenty replicates of each sample were tested inthree different runs. The detection limit was calculated usingthe probit regression function.
The amplification efficiency of each run was calculatedusing the following formula: E = (10−1/m − 1) × 100.31
To analyze EBNA-1 reaction specificity, DNA from theEpstein–Barr virus (PEBNA-1 and RAJI cell line), from the humanmembers of the Herpesviridae family (herpes simplex virus,cytomegalovirus, varicella-zoster virus, human herpesvirus6 and human herpesvirus 8), from different origin humancells (fibroblast, human embryonic kidney (HEK-293) celllines) and commercial source human DNA (Human GenomicDNA, Roche) were analysed. To analyze GAPDH reactionspecificity, DNA from human cell lines (HEK-293 and humanfibroblast), commercial source human DNA and plasmidscontaining different herpesvirus sequences (herpes simplex,varicella-zoster, cytomegalovirus, and human herpesvirus 6)were studied.
Statistical analysis
The precision box-plot, dose response curve and regres-sion analysis were performed with Microsoft Excel 2003.WinPEPI version 11.14 software was used for statistical anal-yses. Medians and confidence intervals were obtained withDescribes, version 2.33. Differences between medians of con-tinuous variables were analyzed using the Mann–Whitney orKruskal–Wallis test for two groups (program Compare 2, version2.57) or more than two groups (Etcetera, version 2.56). p-Valuesbelow 0.05 were considered significant.
Results
Description of the study population
The population characteristics are described in Table 1.
Characterization of PEBNA.-1 control
Fig. 1 shows the result of the analysis of the EBV frag-ment sequence inserted in PEBNA-1 compared with that of the
reaction are indicated.
B95-8 prototype strain, according to which both fragmentswere identical except for the 35 bp deletion.
Analytic validation of the real-time PCR EBVquantification assay
- Precision
Fig. 2 shows the precision of the EBNA-1 reaction for cell-associated samples at the different EBV levels studied duringthe analytical validation.
No differences were observed in the cycles’ thresholdresults obtained by the EBNA-1 reaction between the calibra-tors representing cell-associated samples or cell-free samples
(data not shown). For the GAPDH reaction, the intra- andinter-run variation coefficients were less than 3%, at all con-centrations studied (data not shown).
b r a z j i n f e c t d i s . 2 0 1 4;1 8(3):271–280 275
45
40
35
30
25
20
10
15
5
01 2 3 4 5 6 7
Log of the number of EBV genome equivalents
Cyc
le th
resh
old
Fig. 2 – Precision box plot according to the EBV calibratorsrepresentative of cell-associated samples. The box plotshows the median, first and third quartiles of the cyclethresholds obtained for the EBV calibrators representativeof cell-associated samples during the analytical validation;t
-
adrnitaac
rsaln
-
Fq
1,05
Pro
bit
10,950,9
0,850,8
0,750,7
0,650,6
0,550,5
0,450,4
0,350,3
0,250,2
0,15
0,050,1
00 1 2 3 4 5
Number of EBV gEq EBV genome equivalents
he minimum and maximum values are indicated (–).
Linear range
For the EBNA-1 reaction, the cycles thresholds’ regressionnalysis, obtained from the EBV calibrators, was applied toetermine the linear range (Fig. 3). The standard error of theegression (taken as a measure of the model adjustment) wasot higher than those for the second and third order models;
t was concluded that the best match for this data set washe linear order model. Thereby, the reaction showed linearitycross the whole range of concentrations studied (between 107
nd 10 EBV genome equivalents), both for cell-associated andell-free calibrators.
A similar analysis for the GAPDH reaction showed a linearange between 500,000 and 32 human genome copies (data nothown). No differences were noted in the reaction results atll human DNA levels studied either in absence or presence of
ow or high concentrations of EBV genome equivalents (dataot shown).Detection limit
40,00 Observed data
Linear model
Quadratic model35,00
30,00
25,00
20,00
15,00
1 2 3
Log of the number of EBV genome equivalents
Cyc
le th
resh
old
4 5 6 7
ig. 3 – Dose response curve adjustment to linear anduadratic models.
Fig. 4 – Detection limit of the EBV-specific reaction.
Fig. 4 shows the minimum concentration of EBV genomeequivalents of the calibrator representing the cell-associatedsamples that could be readily detected.
The probit regression analysis showed that the detectionlimit is about three EBV genome equivalents per 105 cells. Asimilar detection limit was obtained for calibrators represent-ing cell-free samples.
The GAPDH-reaction detection limit was not studied sincethe determination of the EBV load requires analysing close to105 cells DNA (equivalent to 366 ng) from each sample. A verylow amount of initial DNA may result from errors in loadingthe sample, DNA quality, or the presence of inhibitors; in allsuch cases the assay must be repeated.
- Efficiency
Both in the analytical validation and when studying theclinical samples, an amplification efficiency of 90–110% forboth reactions was required in order to consider that an assaywas acceptable.
- Specificity
When analysing the EBNA-1 reaction, a positive signalwas only seen with the EBV controls’ DNA; no amplifica-tion was detected when analysing DNA from other humanmembers of the Herpesviridae family (herpes simplex virus,cytomegalovirus, varicella-zoster virus, human herpesvirus6 and human herpesvirus 8) or from human origin. More-over, the GAPDH reaction gave a positive signal with differenthuman DNAs but no signal with plasmid or various Herpesvirus(herpes simplex virus, cytomegalovirus, varicella-zoster virusand human herpesvirus 6) DNAs.
Correlation of normalized and unnormalized EBV loadsmeasured in PBMC DNA
The results of the EBV load measured in PBMC DNA repre-senting 105 cells estimated by spectrophotometry (equal to
366 ng) (unnormalized load) and the GAPDH-reaction (nor-malized load) showed a linear correlation (data not shown).In some cases, when the amount of DNA was measured by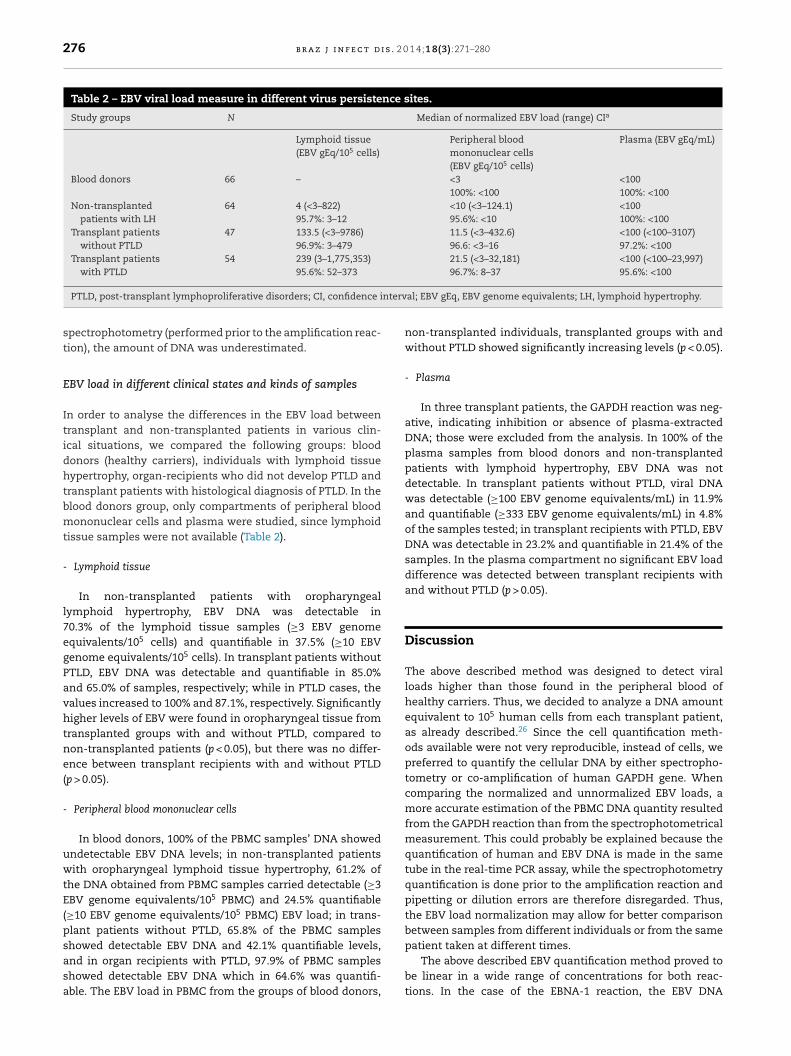
276 b r a z j i n f e c t d i s . 2 0 1 4;1 8(3):271–280
Table 2 – EBV viral load measure in different virus persistence sites.
Study groups N Median of normalized EBV load (range) CIa
Lymphoid tissue(EBV gEq/105 cells)
Peripheral bloodmononuclear cells(EBV gEq/105 cells)
Plasma (EBV gEq/mL)
Blood donors 66 – <3100%: <100
<100100%: <100
Non-transplantedpatients with LH
64 4 (<3–822)95.7%: 3–12
<10 (<3–124.1)95.6%: <10
<100100%: <100
Transplant patientswithout PTLD
47 133.5 (<3–9786)96.9%: 3–479
11.5 (<3–432.6)96.6: <3–16
<100 (<100–3107)97.2%: <100
Transplant patientswith PTLD
54 239 (3–1,775,353)95.6%: 52–373
21.5 (<3–32,181)96.7%: 8–37
<100 (<100–23,997)95.6%: <100
nterv
PTLD, post-transplant lymphoproliferative disorders; CI, confidence ispectrophotometry (performed prior to the amplification reac-tion), the amount of DNA was underestimated.
EBV load in different clinical states and kinds of samples
In order to analyse the differences in the EBV load betweentransplant and non-transplanted patients in various clin-ical situations, we compared the following groups: blooddonors (healthy carriers), individuals with lymphoid tissuehypertrophy, organ-recipients who did not develop PTLD andtransplant patients with histological diagnosis of PTLD. In theblood donors group, only compartments of peripheral bloodmononuclear cells and plasma were studied, since lymphoidtissue samples were not available (Table 2).
- Lymphoid tissue
In non-transplanted patients with oropharyngeallymphoid hypertrophy, EBV DNA was detectable in70.3% of the lymphoid tissue samples (≥3 EBV genomeequivalents/105 cells) and quantifiable in 37.5% (≥10 EBVgenome equivalents/105 cells). In transplant patients withoutPTLD, EBV DNA was detectable and quantifiable in 85.0%and 65.0% of samples, respectively; while in PTLD cases, thevalues increased to 100% and 87.1%, respectively. Significantlyhigher levels of EBV were found in oropharyngeal tissue fromtransplanted groups with and without PTLD, compared tonon-transplanted patients (p < 0.05), but there was no differ-ence between transplant recipients with and without PTLD(p > 0.05).
- Peripheral blood mononuclear cells
In blood donors, 100% of the PBMC samples’ DNA showedundetectable EBV DNA levels; in non-transplanted patientswith oropharyngeal lymphoid tissue hypertrophy, 61.2% ofthe DNA obtained from PBMC samples carried detectable (≥3EBV genome equivalents/105 PBMC) and 24.5% quantifiable(≥10 EBV genome equivalents/105 PBMC) EBV load; in trans-plant patients without PTLD, 65.8% of the PBMC samples
showed detectable EBV DNA and 42.1% quantifiable levels,and in organ recipients with PTLD, 97.9% of PBMC samplesshowed detectable EBV DNA which in 64.6% was quantifi-able. The EBV load in PBMC from the groups of blood donors,al; EBV gEq, EBV genome equivalents; LH, lymphoid hypertrophy.
non-transplanted individuals, transplanted groups with andwithout PTLD showed significantly increasing levels (p < 0.05).
- Plasma
In three transplant patients, the GAPDH reaction was neg-ative, indicating inhibition or absence of plasma-extractedDNA; those were excluded from the analysis. In 100% of theplasma samples from blood donors and non-transplantedpatients with lymphoid hypertrophy, EBV DNA was notdetectable. In transplant patients without PTLD, viral DNAwas detectable (≥100 EBV genome equivalents/mL) in 11.9%and quantifiable (≥333 EBV genome equivalents/mL) in 4.8%of the samples tested; in transplant recipients with PTLD, EBVDNA was detectable in 23.2% and quantifiable in 21.4% of thesamples. In the plasma compartment no significant EBV loaddifference was detected between transplant recipients withand without PTLD (p > 0.05).
Discussion
The above described method was designed to detect viralloads higher than those found in the peripheral blood ofhealthy carriers. Thus, we decided to analyze a DNA amountequivalent to 105 human cells from each transplant patient,as already described.26 Since the cell quantification meth-ods available were not very reproducible, instead of cells, wepreferred to quantify the cellular DNA by either spectropho-tometry or co-amplification of human GAPDH gene. Whencomparing the normalized and unnormalized EBV loads, amore accurate estimation of the PBMC DNA quantity resultedfrom the GAPDH reaction than from the spectrophotometricalmeasurement. This could probably be explained because thequantification of human and EBV DNA is made in the sametube in the real-time PCR assay, while the spectrophotometryquantification is done prior to the amplification reaction andpipetting or dilution errors are therefore disregarded. Thus,the EBV load normalization may allow for better comparisonbetween samples from different individuals or from the same
patient taken at different times.The above described EBV quantification method proved tobe linear in a wide range of concentrations for both reac-tions. In the case of the EBNA-1 reaction, the EBV DNA

2 0 1
ccttrpaavsuvot(ara
maamamecis
epEndEfemfrtwilw–omAfip
taitawc
b r a z j i n f e c t d i s .
oncentrations expected in clinical samples may vary fromoncentrations similar to those seen in healthy carriers (unde-ectable with this methodology) to very high levels as those ofransplant patients with neoplastic PTLD.3,20 Therefore, thiseaction’s linear range is appropriate for the required clinicalurposes. On the other hand, the GAPDH-reaction also showed
broad dynamic range; however, in this case, the expectedmount of DNA to be analyzed in each clinical sample mayary less since the DNA quantity is previously determined bypectrophotometry. Besides, it should be mentioned that bysing DNA from PBMC obtained from a fixed blood volume,ariations between different sample amounts will dependn the differences in PBMC concentration. Since solid organransplant patients usually exhibit normal leukocyte countsbetween 5000 and 11,000 cells per �l), the expected vari-tion between samples may be small. Thus, the GAPDHeaction dynamic range is also suitable for the purpose of thessay.
The obtained intra- and inter-assay variation coefficientsatched the criteria established for this method and were
lso consistent with published data.22,23,27 Moreover, theccuracy levels were adequate for clinical applications, i.e.onitoring EBV DNA levels in transplant patients, in which
small variation may be informative.32,33 Also, since theethod was developed for patients infected with EBV, with
mphasis on those carrying high amounts of circulating viralopies, the detection limit obtained was appropriate for clin-cal purposes and coincided with that described in othertudies.22,23,34
In this context, the present study analyzed EBV DNA lev-ls in different types of clinical specimens representing viralersistence sites35 and various clinical situations. Thus, theBV load obtained in oropharyngeal tissue from the group ofon-transplanted patients was similar to previously describedata.36,37 Moreover, among the limited literature describingBV levels in tonsils, slightly higher load values than thoseound in this study have been reported.38,39 These differ-nces could be explained by the way of expressing the result:ean38 vs. median (present study), or may be due to the dif-
erent amplified genomic fragments: the repeated BamHI-Wegion39 vs. the single EBNA-1 region (present study). Also,he median EBV load obtained from the transplanted groupithout PTLD exhibits a wide range, which could be divided
nto two subgroups of patients: one with viral loads simi-ar to those seen in non-transplanted patients and the otherith higher loads. It should be mentioned that two subgroups
“low-load carriers” and “high-load carriers” – had been previ-usly differentiated by measuring EBV in DNA from peripheralononuclear cells of transplant recipients without PTLD.40,41
ccording to our results, those descriptions coincide withndings in the oropharyngeal lymphoid tissue of transplantatients.
Otherwise, the EBV load measured in PBMC was unde-ectable in all blood donors, i.e. lower than that described in
similar control group.27 This difference could be due to thenitial DNA quantity that was amplified (around 3-fold larger
han in this study). In addition, in this report both in plasmand PBMC from blood donors and in plasma from childrenith oropharyngeal lymphoid hypertrophy, EBV loads wereonsistent with previously described viral levels.15,16,42,43
4;1 8(3):271–280 277
In transplant patients, the increased EBV load reportedin the literature in comparison with healthy carriers is vari-able. In this study, the ranges of EBV DNA load in PBMCfrom transplant patients without PTLD were similar to pre-viously informed data,12,35,44,45 albeit more limited than inother reports.27 The difference could be explained by thecharacteristics of the study groups: adults receiving hearttransplantation,27 while in this work the transplanted groupwithout PTLD were children, mainly liver and kidney trans-plantation recipients. The degree of immunosuppression usedafter heart transplantation is more pronounced than afterkidney and liver transplantation.2,46 Furthermore, the higherthe dose of immunosupressive drugs applied, the more likelythe occurrence of viral activation which results in larger EBVloads.
In transplant patients with EBV-associated PTLD, high lev-els of EBV DNA have often been reported, measured in thecellular fraction and plasma of peripheral blood. However, thenumber of EBV copies reported by different authors varies.3,7,8
In this work, the median EBV loads and their range in PBMCfrom transplant patients with PTLD showed the highest lev-els of EBV DNA. Nevertheless, the EBV load ranges were verywide and included almost 35% of the EBV loads below 10EBV genome equivalents, which correspond to patients withearly PTLD stages (data not shown). Thus, some PTLD caseshave shown EBV levels in PBMC lower than those describedin the literature. The disagreements could be explained bydifferences in the methodological strategies applied and alsobecause a larger number of cases with early PTLD stages wereanalyzed in this report.
The EBV load ranges in plasma samples from the trans-planted group without PTLD were similar to the alreadydescribed data,15,44,47 whereas in transplant patients withPTLD, the higher EBV levels resembled previously obtainedinformation,44 but were lower, or the ranges narrower thanthose described by other authors.15,22,47,48 It has been notedthat most of the PTLD patients had undetectable viral DNAlevels in plasma; this is consistent with reports of trans-plant patients with EBV-associated pathology.49 Nevertheless,the differences in the levels of EBV plasma loads betweenthis study and others can be explained by the differentmethodologies and also by the PTLD category analyzed. Mostreports studied only patients diagnosed with neoplastic-PTLD.15,22,47,48
An EBV International Standard has recently been madeavailable9; the present results agree with previous reportson the convenience of its use to validate quantification EBVassays, and emphasize the need for a reference methodologi-cal strategy to measure EBV loads (calibrator, method, type ofclinical sample, and cut-off values).
Finally, while commercial assays may improve standard-ization, they are more expensive than in-house assays. On theother hand, in-house assays may lack validation and requireadditional efforts to standardize. These last attempts maybe especially suitable for low-resource settings, where an in-house assay could mean the only affordable alternative for
some laboratories to monitor PTLD risk in transplant recipi-ents. Thus, an assay with a detailed analytical validation thatfollows the International Organization for Standardization(ISO) guidelines may represent a very attractive alternative for
i s . 2 0
r
1
278 b r a z j i n f e c t d
low resource laboratories when assessing its possible imple-mentation
Conclusions
This real-time PCR quantification assay could be used to followEBV infection in transplant patients. Its performance matchedthe required clinical applications. In addition, it was proven todetect EBV DNA levels higher than those found in the periph-eral blood compartment (PBMC and plasma) of blood donors,as those described in the transplanted population. It may beuseful to differentiate transplant patients with and withoutPTLD in different clinical samples. Furthermore, it could beused for the clinical management of other EBV-associateddiseases. This in-house methodology translate into a lessexpensive and more accessible alternative than commercialEBV load assays, especially valuable for laboratories in lowincome regions.
Also, taking into account the results obtained in the trans-planted population and the data reported, the analysis of EBVloads in transplant patients with different PTLD stages couldbe useful in identifying the best way to detect PTLD risk.
Authors’ contributions
All authors read and approved the final manuscript. M.D.F. andM.A.P. designed the study field, M.D.F. designed, conductedand supervised the molecular biology studies, interpreted dataand drafted the manuscript, K.D. conducted molecular biol-ogy studies, M.R. and L.I designed the analytical validationand conducted statistical analyses, V.A. and M.A.P. revised themanuscript.
Authors’ information
All authors are part of the National Institute of Infectious Dis-eases – ANLIS “Carlos G. Malbrán”. V.A. (Ph.D) is the Chiefof the Virology Department. M.A.P. (Ph.D) is the Chief of theOncogenic Viruses Service. M.D.F. (Ph.D) coordinates EBV stud-ies in the Oncogenic Viruses Service. M.R. and L.I work inthe institutional Operational Team Quality Management. M.R(Biochemist) coordinates the Operational Team Quality Man-agement and has broad experience in laboratory methodsvalidation. L.I. (B.A. in Statistics) is a statistical analysis expert.
The National Institute of Infectious Diseases – ANLIS“Carlos G. Malbrán” is the microbiology technical branchof the Health Ministry of Argentina, and is in permanentcontact with regional countries through the Pan AmericanHealth Organization (PAHO) interaction. Among other roles, itperforms laboratory reference diagnoses, including the devel-opment and validation of assays to ensure, via methodologicaltransfer, their availability to any local/regional laboratory thatso requires; all these activities are carried out in the frameworkof the institutional quality assurance programme.
Conflicts of interest
The authors declare no conflicts of interests.
1
1 4;1 8(3):271–280
Financial support
This project was partially supported by grants from ANLISCarlos G. Malbrán (FOCANLIS/2009) (Buenos Aires, Argentina).
Acknowledgements
The authors are indebted to J. Campos and S. Nunez fortheir technical assistance, Drs. C. Gonzalez Cambaceres, P.Bernáldez, M.T. García de Dávila, J. Ibanez and A. Turconi (“Prof.Dr Juan P. Garrahan” Pediatric Hospital); J. Gregoresky andM. V. Ávila (Austral University Hospital); T. Gonzalez and S.Besga (“Sor María Ludovica” Children’s Hospital), J. Trentadue(Favaloro Foundation) and N. Zala and S. Camino (“J. F. Muniz”Infectious Diseases Hospital) for their generous help duringsampling and their commitment to the prevention of PTLD intransplant patients.
e f e r e n c e s
1. Rowe DT, Webber S, Schauer EM, Reyes J, Green M.Epstein–Barr virus load monitoring: its role in the preventionand management of posttrasnplant lymphoprolipherativedisease. Transp Inf Dis. 2001;3:79–87.
2. Preiksaitis JK. New developments in the diagnosis andmanagement of posttransplantation lymphoproliferativedisorders in solid organ transplant recipients. Clin Infect Dis.2004;39:1016–23.
3. Kimura H, Ito Y, Suzuki R, Nishiyama YH. MeasuringEpstein–Barr virus (EBV) load: the significance andapplication for each EBV-associated disease. Rev Med Virol.2008;18:305–19.
4. Kenagy DN, Schlesinger Y, Weck K, Ritter JH,Gaudreault-Keener MM, Storch GA. Epstein–Barr virus DNA inperipheral blood leukocytes of patients with posttransplantlymphoproliferative disease. Transplantation. 1995;60:547–54.
5. Rowe DT, Qu L, Reyes J, et al. Use of quantitative competitivePCR to measure Epstein–Barr virus genome load in theperipheral blood of paediatric transplant patients withlymphoproliferative disorders. J Clin Microbiol.1997;35:1612–5.
6. Baldanti F, Grossi P, Furione MET-AL>. High levels ofEpstein–Barr Virus DNA in blood of solid organ transplantrecipients and their value in predicting posttransplantlymphoprolipherative disorders. J Clin Microbiol.2000;38:613–9.
7. Gärtner B, Preiksaitis JK. EBV viral load detection in clinicalvirology. 2010;48:82–90.
8. Gulley ML, Tang W. Using Epstein–Barr viral load assays todiagnose, monitor, and prevent posttransplantlymphoproliferative disorder. Clin Microb Rev. 2010;23:350–66.
9. First WHO International Standard for Epstein–Barr Virus forNucleic Acid Amplification Techniques,http://www.nibsc.ac.uk/documents/ifu/09-260.pdf
0. Xu S, Green M, Kingsley L, Webber S, Rowe D. A comparison ofquantitative-competitive and realtime PCR assays using anidentical target sequence to detect Epstein–Barr virus viralload in the peripheral blood. J Virol Methods. 2006;137:205–12.
1. Krumbholz A, Meerbach A, Zell R, et al. Comparison of aLightCycler-based real-time PCR for quantitation ofEpstein–Barr viral load in different clinical specimens withsemiquantitative. PCR J Med Virol. 2006;78:598–607.

2 0 1
1
1
1
1
1
1
1
1
2
2
2
2
2
2
2
2
2
2
3
3
3
3
3
3
3
3
3
3
4
4
4
4
4
b r a z j i n f e c t d i s .
2. Baiocchi OC, Colleoni GW, Caballero OL, Vettore AL, AndradeAL, Pestana JO. Quantification of Epstein–Barr viral load anddetermination of a cut-off value to predict the risk ofpost-transplant lymphoproliferative disease in a renaltransplant cohort. Haematology. 2004;89:366–8.
3. Baldanti F, Gatti M, Furione M, et al. Kinetics of Epstein–Barrvirus DNA load in different blood compartments of pediatricrecipients of T-cell-depleted HLA-haploidentical stem celltransplantation. J Clin Microb. 2008;46:3672–7.
4. Stevens SJ, Verkuijlen SA, Brule AJ, Middeldorp JM.Comparison of quantitative competitive PCR withLightCycler-based PCR for measuring Epstein–Barr virus DNAload in clinical specimens. J Clin Microb. 2002;40:3986–92.
5. Niesters HG, van Esser J, Fries E, Wolthers KC, Cornelissen J,Osterhaus AD. Development of a real-time quantitative assayfor detection of Epstein–Barr virus. J Clin Microb.2000;38:712–5.
6. Luderer R, Kok M, Niesters HG, Schuurman R, de Weerdt O,Thijsen SF. Real-time Epstein–Barr virus PCR for the diagnosisof primary EBV infections and EBV reactivation. Mol Diagn.2005;9:195–200.
7. Hayden RT, Hokanson KM, Pounds SB, et al. Multicentercomparison of different real-time PCR assays for quantitativedetection of Epstein–Barr virus. J Clin Microbiol.2008;46:157–63.
8. Preiksaitis JK, Pang XL, Fox JD, Fenton JM, Caliendo AM, MillerGG. American Society of Transplantation Infectious DiseasesCommunity of Practice Interlaboratory Comparison ofEpstein–Barr. Virus viral load assays. Am J Transplant.2009;9:269–79.
9. Abbate I, Zanchetta M, Gatti M, et al. Multicenter comparativestudy of Epstein–Barr virus DNA quantification for virologicalmonitoring in transplanted patients. J Clin Virol.2011;50:224–9.
0. Stevens SJ, Verschuuren EA, Verkuujlen SA, Van Den Brule AJ,Meijer CJ, Middeldorp JM. Role of Epstein–Barr virus DNA loadmonitoring in prevention and early detection ofpost-transplant lymphoproliferative disease. Leukemia andLymphoma. 2002;B43:831–40.
1. Gulley ML, Tang W. Using Epstein–Barr viral load assays todiagnose: monitor, and prevent posttransplantlymphoproliferative disorder. Clin Microb Rev. 2010;23:350–66.
2. Ryan JL, Fan H, Glaser SL, Schichman SA, Raab-Traub N,Gulley ML. Epstein–Barr virus quantitation by real-time PCRtargeting multiple gene segments: a novel approach to screenfor the virus in paraffin-embedded tissue and plasma. J MolDiagn. 2004;6:378–85.
3. Hill CE, Harris SB, Culler EE, Zimring JC, Nolte FS, CaliendoAM. Performance characteristics of two real-time PCR assaysfor the quantification of Epstein–Barr virus DNA. Am J ClinPathol. 2006;125:665–71.
4. Clave E, Agbalika F, Bajzik V, et al. Epstein–Barr virus (EBV)reactivation in allogeneic stem-cell transplantation:relationship between viral load, EBV-specific T-cellreconstitution and rituximab therapy. Transplantation.2004;77:76–84.
5. Tsai DE, Douglas L, Andreadis C, et al. EBV PCR in thediagnosis and monitoring of posttransplantlymphoproliferative disorder: results of a two-armprospective trial. Am J Transplant. 2008;8:1016–24.
6. Fellner MD, Durand K, Correa M, et al. A semiquantitative PCRmethod (SQ-PCR) to measure Epstein–Barr virus load: itsapplication in transplant patients. J Clin Virol. 2003;28:323–30.
7. Jabs WJ, Hennig H, Kittel M, et al. Normalized quantification
by real-time PCR of Epstein–Barr virus load in patients at riskfor posttransplant lymphoproliferative disorders. J ClinMicrob. 2001;39:564–9.4;1 8(3):271–280 279
8. Swerdlow SH, Webber SA, Chadburn A. Post-transplantlymphoproliferative disorders. In: Thiele J, Vardiman JW,editors. WHO classification of tumours of haematopoietic andlymphoid tissues. Swerdlow SH, Campo E, Lee Harris N, JaffeES, Pileri SA, Stein H et al. International Agency for Researchon Cancer (IARC), 2008. Lyon, France: WHO Publisher; 2008. p.343–51.
9. CLSI/NCCLS. User verification of performance for precisionand trueness. Approved guideline. CLSI document EP15-A2.2nd edn Wayne, PA: Clinical and Laboratory StandardsInstitute; 2005.
0. CLSI/NCCLS. Evaluation of the linearity of quantitativemeasurement procedures: a statistical approach. Approvedguideline. CLSI document EP6-A. Wayne, PA: Clinical andLaboratory Standards Institute; 2003.
1. Pfaffl MW. Determination of real-time PCR amplificationefficiency. In: Quantification strategies in real-time PCR.California, USA: Bustin International University Line S.A.;2004 [chapter 3].
2. Funk GA, Gosert R, Hirsch HH. Viral dynamics in transplantpatients: implications for disease. Lancet Inf Dis.2007;7:460–72.
3. Kasiske BL, Zeier MG, Chapman JR, et al. Kidney diseaseimproving global outcomes. KDIGO clinical practice guidelinefor the care of kidney transplant recipients: a summary.Kidney Int. 2010;77:299–311.
4. Maurmann S, Fricke L, Wagner HJ, et al. Molecular parametersfor precise diagnosis of asymptomatic Epstein–Barr virusreactivation in healthy carriers. J Clin Microb. 2003;41:5419–28.
5. Rickinson A.B., Kieff E. Epstein–Barr virus. In: Fields BN, KnipeDM, Howley PM, editors. Fields virology, Vol. 2, 5ta.Philadelphia: Lippincott: Williams and Wilkins; 2007. p.2656–700.
6. Hislop AD, Kuo M, Drake-Lee AB, et al. Tonsillar homing ofEpstein–Barr virus-specific CD8+ T cells and the virus–hostbalance. J Clin Invest. 2005;115:2546–55.
7. Chaganti S, Heath EM, Bergler W, et al. Epstein–Barr viruscolonization of tonsillar and peripheral blood B-cell subsetsin primary infection and persistence. Blood. 2009;113:6372–81.
8. Maeda N, Yamashita Y, Kimura H, Hara S, Mori N.Quantitative analysis of herpesvirus load in the lymph nodesof patients with histiocytic necrotizing lymphadenitis using areal-time PCR assay. Diagn Mol Pathol. 2006;15:49–55.
9. Hug M, Dorner M, Fröhlich FZ, et al. Pediatric Epstein–Barrvirus carriers with or without tonsillar enlargement maysubstantially contribute to spreading of the virus. J Infect Dis.2010;202:1192–9.
0. Babcock GJ, Decker LL, Freeman RB, Thorley-Lawson DA.Epstein–Barr virus-infected resting memory B cells, notproliferating lymphoblasts, accumulate in the peripheralblood of immunosuppressed patients. J Exp Med.1999;190:567–76.
1. Qu L, Green M, Webber S, Reyes J, Ellis D, Rowe D. Epstein–Barrvirus gene expression in the peripheral blood of transplantrecipients with persistent circulating virus loads. J Infect Dis.2000;182:1013–21.
2. Kimura H, Morita M, Yabuta Y, et al. Quantitative analysis ofEpstein–Barr virus load by using a real-time PCR assay. J ClinMicrobiol. 1999;37:132–6.
3. Gulley ML, Fan H, Elmore SH. Validation of Roche LightCyclerEpstein–Barr virus quantification reagents in a clinicallaboratory setting. J Mol Diagn. 2006;8:589–97.
4. Wagner HJ, Wessel M, Jabs W, et al. Patients at risk fordevelopment of posttransplant lymphoproliferative disorder:plasma versus peripheral blood mononuclear cells as
material for quantification of Epstein–Barr viral load by usingreal-time quantitative polymerase chain reaction.Transplantation. 2001;72:1012–9.
i s . 2 0
4
4
4
4
280 b r a z j i n f e c t d
5. Kasztelewicz B, Jankowska I, Pawłowska JET-AL>.Epstein–Barr virus DNA load in peripheral blood mononuclearcells and whole blood from pediatric transplant recipients.Transpl Infect Dis. 2011;13:471–9.
6. Chinen J, Buckley RH. Transplantation immunology: solidorgan and bone marrow. J Allergy Clin Immunol.2010;125:S324–35.
7. Kinch A, Oberg G, Arvidson J, Falk KI, Linde A, Pauksens K.Post-transplant lymphoproliferative disease and otherEpstein–Barr virus diseases in allogeneic haematopoieticstem cell transplantation after introduction of monitoring of
4
1 4;1 8(3):271–280
viral load by polymerase chain reaction. Scand J Infect Dis.2007;39:235–44.
8. Meerbach A, Wutzler P, Häfer R, Zintl F, Gruhn B. Monitoringof Epstein–Barr virus load after hematopoietic stem celltransplantation for early intervention in post-transplantlymphoproliferative disease. J Med Virol. 2008;80:441–54.
9. Wada K, Kubota N, Ito Y, et al. Simultaneous quantification ofEpstein–Barr virus, cytomegalovirus, and human herpesvirus6 DNA in samples from transplant recipients by multiplexreal-time PCR assay. J Clin Microb. 2007;45:1426–32.