the botswana recycling guidelines - waste · the materials recovery facility ... the inception...
TRANSCRIPT

The Botswana Recycling Guidelines
Advice on Valorisation for Middle-Income Countries
Volume 1 plus Annexes 1 & 2
WASTE: Anne Scheinberg Sophie van den Berg Lilliana Abarca
Riverine Associates: Rueben Lifuka
October 2012
Funder: UNDP Botswana


The Botswana Recycling Guidelines 2012 Advice on Valorisation for Middle-Income Countries
1
Table of Contents
Introduction ...................................................................................................................................................................... 3
Chapter 1. Guidelines for Modernising the Enabling Environment ................................................ 11
1 Guideline 1: Reforming the enabling environment ...................................................................................... 11
2 Guideline 2: Benchmarking, Reporting, Monitoring .................................................................................... 14
3 Guideline 3: Development of a Communication Plan ................................................................................. 19
4 Guideline 4: Public Private Partnerships (PPP) ............................................................................................. 24
5 Guideline 5: Capacity Development and Capacity Strengthening ............................................................. 30
Chapter 2. Guidelines for Planning and Organising Valorisation................................................... 35
6 Guideline 6: Fast Improvements to Landfill Based Valorisation ............................................................... 35
7 Guideline 7: Little Planning Manual for Recycling ....................................................................................... 41
8 Guideline 8: Planning for Valorisation............................................................................................................ 51
9 Guideline 9. Market study for recyclables and organics ............................................................................... 62
10 Guideline 10: Demonstration and Leading Edge Projects .......................................................................... 67
Chapter 3. Technical and Operational Guidelines .......................................................................... 74
11 Guideline 11: Buy-back and drop off centres ................................................................................................ 74
12 Guideline 12: Source Separation and Separate Collection ........................................................................... 77
13 Guideline 13. The Materials Recovery Facility (MRF) ................................................................................. 84
14 Guideline 14: Recycling of Type 1 Materials: metals and high-grade paper ............................................. 90
15 Guideline 15: Recycling of plastics and other type 2 materials ................................................................... 95
16 Guideline 16: Type 3 Materials: Composting, organics valorisation ....................................................... 101
Chapter 4. Guidelines Relating to Finances and Fees ................................................................... 112
17 Guideline 17: Willingness to Pay for Waste Collection Services .............................................................. 112
18 Guideline 18: Analysing Costs and Setting Tariffs ..................................................................................... 118
19 Guideline 19: Financial Incentives, Tools, and Policies ............................................................................. 127
20 Guideline 20: Extended Producer Responsibility (EPR) and Corporate Social Responsibility (CSR) ................................................................................................................................................................... 133
Volume 1 Annexes ....................................................................................................................................................... 138
Cover image: Compilation of waste management situation in Botswana. Source: WASTE, 2012

2 The Botswana Recycling Guidelines 2012 Advice on Valorisation for Middle-Income Countries
The Botswana Recycling Guidelines 2012 Advice on Valorisation for Middle-Income Countries
3
Introduction
Overview of the Recycling Guidelines Project
In 2011, UNDP Botswana announced a project to develop a recycling framework and municipal recycling guidelines for Botswana, the UNDP funded project “Municipal Recycling Guidelines for Botswana Municipalities.” The document at hand is the result of that project, and a five-month process to explore the capacities and needs of Botswana stakeholders, to understand the markets for recyclable materials, and to produce a document containing sound advice to Botswana local and district councils, national authorities, private companies, and civil society. The current document consists of 20 “Guidelines,” each of which presents a set of specific activities and results in relation to re-use, recycling, composting, and other forms of valorisation.
In 1999, Dr. Heino Vest produced the first “Guidelines for the promotion of recycling projects in Botswana”. In this, Dr. Vest proposed various activities to develop markets and to improve recycling in Botswana, through projects. Although this document was presented 13 years ago, some parts of it contain very useful information which comes back in a slightly different form in these 2012 Guidelines.
Still, the international team that produced the 2012 Guidelines has departed from the “project-based” focus of Dr. Vest‟s paper, as well as the approach of the South African Guidelines and other materials. The inception report results suggest that the project-based and rather fragmented approach promoted in these documents has largely failed to raise the performance and sustainability of recycling in Botswana, and many pilot projects have been announced but not implemented.
So the team that has created these Guidelines has listened to stakeholders, and has incorporated their ambitions. The result is: Guidelines whose goal is to shift the fundamental purpose of waste management in Botswana, from controlling disposal to maximising the use and re-use of resources in the waste stream. The words for that re-organisation are that we advise Botswana to put in place a recycling framework.
The idea of a framework is that it re-organises institutional structures, transactions, and economic relations between institutions and stakeholders, to facilitate structural improvement that goes beyond individual projects. This is possible now – as opposed to 1998 -- because Botswana now has 14 controlled landfills, a Department of Waste Management and Pollution Control, and the foundation for institutional consolidation of waste management and valorisation functions. The changes needed now are primarily institutional and financial, and these types of interventions don‟t come from projects.
Structure of Each Guideline
To facilitate sustainable improvement and move away from a project-based approach, these Guidelines have been structured around goals, activities, and results, rather than around step-by-step instructions. Botswana government institutions and businesses have their own way of doing things, and are quite capable of figuring out how to do something, once the results have been specified. However, in the stakeholder consultation it became clear that what is missing is a clear roadmap for the kinds of results that can lead to an overall change in the system. So the approach to the guidelines is as follows.
Each guideline has goals, a short explanation of the idea or the problem to be solved, and a series of sections entitled “activity” or “topic”. Activities are written like a small part of the logical framework for a project or programme, so that instead of instructions, they have results. How the results are to be reached is up to the Councils or the Department staff or consultants or other stakeholders such as NGOs or the private sector to decide. Some guidelines also have short case examples to illustrate the impact of that guideline. When there are specific references for that guideline, or additional information, they are included at the end of the guideline.
A guideline therefore consists of:

4 The Botswana Recycling Guidelines 2012 Advice on Valorisation for Middle-Income Countries
One or more goals A short explanation: what is it about, what problem does it address Activities with results, or topics with explanations. These are major subdivisions in the
guideline Activities and their results represent a kind of roadmap to get to the goals Topics are explanatory, in cases where it is important to understand a particular subject in
order to move forward Cases answer the question: Where has this been done before? Results: small achievements that could be moved into a logical framework, that are in
principle measurable, verifiable, and tangible1 Specific references which are only applicable to this particular guideline. General
references are included in the Annexes
Structure of this Guidelines Document
This guidelines document is divided into two volumes. Volume 1 includes this Introduction, the 20 guidelines, and the first two shorter annexes.
This Introduction is followed by the Executive Summaries of the inception report, Framework Options Paper, and key results and conclusions from Market Study for Recyclables. Chapters 1-3 contain the 20 municipal guidelines, grouped into chapters by phasing and focus. Each guideline focuses on one major subject, or in some cases a cluster of subjects. At the end there are two short annexes, the expanded Glossary of Terms and the References.
Volume 2, provided on a DVD and not in hard copy, provides additional resource and supporting documents:
The full Framework Options Paper The ISWM Baseline Data Collection Tool, adapted from the version used to produce the
UN-Habitat Third Global Report, Solid Waste Management in the World‟s Cities The full text of the market study for recyclables Various additional documents, including the presentations given at the stakeholder
meetings, and some of the more general comments on the process.
Timeline
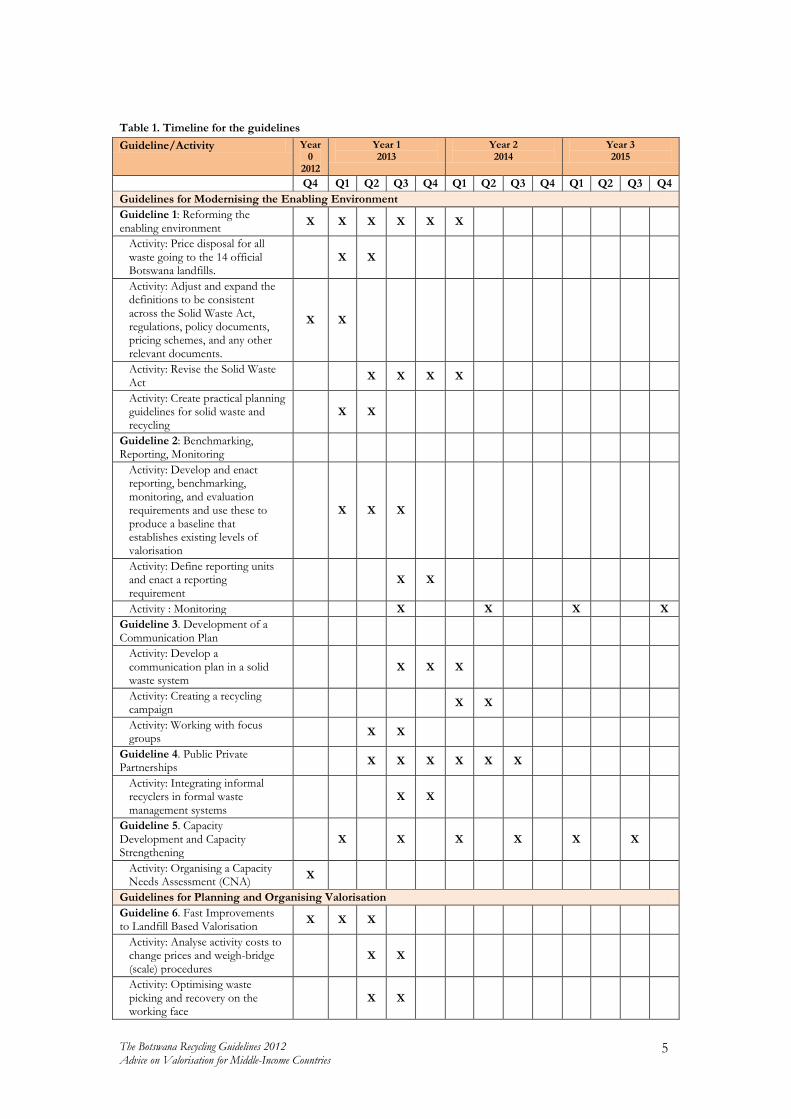
The guidelines as presented in this publication here are not exactly in chronological order. Table 1 shows the approximate suggested implementation timeline.
1 The results replace the more traditional instructions that would be expected to be found in a Guidelines document. The choice to present detailed results rather than detailed instructions is unusual, and comes from the impression that the consultants received during the project that Botswana governmental institutions have been busy with recycling for many years, and have taken lots of steps, but have achieved few results. So we have created a kind of checklist, and if the stakeholders go for the results, we have more confidence that they will manage to make progress.
The Botswana Recycling Guidelines 2012 Advice on Valorisation for Middle-Income Countries
5
Table 1. Timeline for the guidelines
Guideline/Activity Year 0
2012
Year 1 2013
Year 2 2014
Year 3 2015
Q4 Q1 Q2 Q3 Q4 Q1 Q2 Q3 Q4 Q1 Q2 Q3 Q4
Guidelines for Modernising the Enabling Environment
Guideline 1: Reforming the enabling environment
X X X X X X
Activity: Price disposal for all waste going to the 14 official Botswana landfills.
X X
Activity: Adjust and expand the definitions to be consistent across the Solid Waste Act, regulations, policy documents, pricing schemes, and any other relevant documents.
X X
Activity: Revise the Solid Waste Act
X X X X
Activity: Create practical planning guidelines for solid waste and recycling
X X
Guideline 2: Benchmarking, Reporting, Monitoring
Activity: Develop and enact reporting, benchmarking, monitoring, and evaluation requirements and use these to produce a baseline that establishes existing levels of valorisation
X X X
Activity: Define reporting units and enact a reporting requirement
X X
Activity : Monitoring X X X X
Guideline 3. Development of a Communication Plan
Activity: Develop a communication plan in a solid waste system
X X X
Activity: Creating a recycling campaign
X X
Activity: Working with focus groups
X X
Guideline 4. Public Private Partnerships
X X X X X X
Activity: Integrating informal recyclers in formal waste management systems
X X
Guideline 5. Capacity Development and Capacity Strengthening
X X X X X X
Activity: Organising a Capacity Needs Assessment (CNA)
X
Guidelines for Planning and Organising Valorisation
Guideline 6. Fast Improvements to Landfill Based Valorisation
X X X
Activity: Analyse activity costs to change prices and weigh-bridge (scale) procedures
X X
Activity: Optimising waste picking and recovery on the working face
X X

6 The Botswana Recycling Guidelines 2012 Advice on Valorisation for Middle-Income Countries
Guideline/Activity Year 0
2012
Year 1 2013
Year 2 2014
Year 3 2015
Q4 Q1 Q2 Q3 Q4 Q1 Q2 Q3 Q4 Q1 Q2 Q3 Q4
Guideline 7. Little Planning Manual for Recycling
X X X
Guideline 8. Planning for Valorisation
X X X
Activity: Setting valorisation goals, targets, and ambitions
X X
Activity: The 100 Household Composition Exercise
X
Activity: Benchmarking existing levels of recovery
X
Activity: Projecting total waste and recovery for the planning horizon
X X
Activity: Creating the Botswana National Recycling Platform (BNRP)
X
Guideline 9. Market study for recyclables and organics
X X
Activity: Analysing demand X X
Guideline 10. Demonstration and Leading Edge Projects
X X X X X X X
Activity: For each demonstration project, formulate a SMART hypothesis, consistent with the framework decision: “slow road to municipal recycling.”
X
Activity : Produce a project plan in a participatory way
X X X X X X
Activity : Start up and operate the demonstration project
X X X X
Activity : Evaluate the demonstration project
X X X
Technical and Operational Guidelines
Guideline 11. Buy-back and drop off centres
X X X X X X X X X
Activity: Setting up a drop off centre or buy-back centre
X X
Guideline 12. Source Separation and Separate Collection
X X X X X X X X X X
Activity: Provide clear instructions in the period of start-up
X
Guideline 13. The Materials Recovery Facility (MRF)
X X X X X
Activity: Set up of Materials Recovery Facility
X X X
Guideline 14. Recycling of Type 1 Materials: metals and high-grade paper
X X X
Activity: Facilitate storage sites X X
Guideline 15. Recycling of plastics and other type 2 materials
X X X
Guideline 16: Type 3 Materials: Composting, organics valorisation
X X X X X X
Activity: Master Composter: pyramid marketing of on-site management in rural areas
X X
Activity: Combining rural organics management with empowerment opportunities
X X X X X X

The Botswana Recycling Guidelines 2012 Advice on Valorisation for Middle-Income Countries
7
Guideline/Activity Year 0
2012
Year 1 2013
Year 2 2014
Year 3 2015
Q4 Q1 Q2 Q3 Q4 Q1 Q2 Q3 Q4 Q1 Q2 Q3 Q4
Guidelines Relating to Finances and Fees
Guideline 17: Willingness to Pay for Waste Collection Services
X X X
Activity: Community payment consultation: what do people want to pay for?
X
Activity: Contracting and implementing a willingness to pay study to produce a plan for introducing new fees and tariffs
X X
Guideline 18. Analysing Costs and Setting Tariffs
X X
Guideline 19: Financial Incentives, Tools, and Policies
X X X X
Guideline 20. Extended Producer Responsibility (EPR) and Corporate Social Responsibility (CSR)
X X X X X X
Activity: Developing an EPR system
X X X X X X
Executive Summary of the Inception Report
The first inception mission of the project “Botswana Municipal Recycling Guidelines” took place in the Gaborone area between June 5 and 16, 2012. Three consultants from the WASTE consulting team visited recycling facilities and landfills, met with policymakers, key experts, and a variety of other stakeholders, and conducted a two-day stakeholder consultation. The idea of a framework was extensively discussed. The main conclusions are:
1. The market for recyclables in Botswana is robust, due to proximity of end-users in neighbouring countries and a variety of well-functioning recycling businesses in Botswana.
2. Recycling initiatives involving the public sector and NGOs have had meagre results, in part because of a lack of understanding between government and the private sector.
3. Organic waste initiatives are underdeveloped, and valorisation of organic waste does not appear to be occurring. This represents a key opportunity for development.
4. Both public and private sector suffer from the absence of a recycling or valorisation framework, a set of organised relationships, roles, and responsibilities that connects the Councils and national government with the value chain.
5. There is pressure to increase recycling and organic waste valorisation because landfills are filling up too quickly. These conflict with ideas and regulations for controlling waste picking at landfills.
6. Even though disposal is priced, the financial part of the waste system is not working to provide incentives for both public and private entities to invest in valorisation.
7. There is a need for improving consistency between laws, regulations, institutions, and practical day to day solid waste management.
8. The legal basis for waste management in Botswana, the Act, is in need of an update that would anchor the chosen recycling framework into law.
9. There is a high willingness of key stakeholders to co-operate to improve the performance of valorisation in the Botswana waste management system.
Executive Summary of the Framework Options Paper
Botswana has a policy commitment to recycling and valorisation, and is seeking to maximise the diversion of materials from disposal and to optimise and improve recovery by valorising more materials. The country has an undocumented amount of recycling that occurs via the private sector industrial value chain. Taking this together with the 1,5% documented as recycled from

8 The Botswana Recycling Guidelines 2012 Advice on Valorisation for Middle-Income Countries
landfills, the total per cent of waste valorised is probably between 2% and 20% of municipal solid waste. Organics valorisation hardly exists, and is not a regular part of either policy or practice at the Council level. In Botswana private value chain activities include waste picking, small and medium-sized recycling junk shops and scrap dealers, intermediate processors, and businesses that pack and transport processed materials to end-user industries in South Africa or overseas. The re-use sector is not considered part of the solid waste management system and is also undocumented, although some re-use activities certainly take place.
This policy commitment can best be achieved once Botswana chooses to put in place a framework for recycling that is a decision about how to organise the relationships between households, municipal councils, and value chain businesses.
Based on global experience, research, and analysis, Botswana has the choice of two potential frameworks. Option 1 is to develop a Municipal Inclusive Recycling Framework. Municipal recycling is the approach invented by high-income countries in the 1980s, when they modernised their waste systems, regionalised disposal, and “integrated” valorisation into solid waste management. The driver for municipal recycling, which delivers high performance diversion from disposal, is environmental protection, internalised in the system as pricing of disposal. When disposal is priced, the incentive structure for high-performance recycling works, and creates a virtuous circle, based on internalising negative externalities of waste and disposal. Within municipal recycling, innovations such as “mandatory source separation,” and a Materials Recovery Facility (MRF) are financed and operated by local authorities or their agents.
Over time an increasing percentage of materials flow through these systems, lowering the volume of waste requiring disposal, and stimulating new uses for recyclable and organic materials. Without pricing of disposal, municipal recycling is not feasible, as there is too little money in the system to invest in new valorisation infrastructure and capacity, and the result is a vicious circle of competition for resources.
In case there is resistance to full-cost pricing of disposal, Option 2 for Botswana is Value Chain Inclusive Recycling. Value chain recycling is characterised valorisation of materials by private sector formal and informal micro, small- and medium-sized enterprises. Private recyclers recycle to earn livelihoods and/or create profit. Working conditions are not always good, and not all environmental laws are observed, but value chain recycling pays more than minimum wage to most persons working in it, keeps thousands of tonnes of material out of disposal, and creates positive environmental externalities for households and local authorities. An inclusive value chain model benchmarks, documents and captures these positive externalities as the basis for municipal support, recognition, and co-financing of social protection for workers in recycling.
A third variant, a recycling framework driven by Extended Producer Responsibility (EPR), is theoretically also available, but is not judged to be feasible because of Botswana‟s relatively small and dispersed population. The only EPR option would appear to depend on a willingness to intensify the trade relationship with South Africa, as the producers are there, not in Botswana.
This options paper is designed to inform the choice of recycling framework that will take Botswana forward. The paper first introduces the idea of a framework, and relates it to the concept of policy drivers.
Visual representations of frameworks as stylised and simplified process flow diagrams are then used to supplement the analysis of recycling of 20 cities profiled in Solid Waste Management in the World’s Cities, looking in detail at the frameworks behind high performance, and what they tell us about how to raise recycling system performance. A combination decision tree and flow chart shows relationships between the choice of frameworks and the content of the municipal recycling guidelines under the two possible frameworks.
In its decision to deliberately make this choice, Botswana not only takes an important step in the direction of sustainable development, but can also serve as a regional leader and example.
The Botswana Recycling Guidelines 2012 Advice on Valorisation for Middle-Income Countries
9
Results and Conclusions of the Market Study
The basis for the market study is an investigation of the demand for recyclables within Botswana, and in the neighbouring countries, mainly South Africa. The approach is to trace the flow of these recyclables from the commercial waste generators and/or the landfill sites, via professional waste pickers, to the small junk shops and medium- and large scrap dealers that process these materials. The final transaction is to sell the processed secondary feedstocks to end-user industries manufacturing new products in Botswana or abroad.
The study showed that the market for recyclables in Botswana is robust, due to proximity of end-users in neighbouring countries and a variety of well-functioning recycling businesses in Botswana. This demand is reported by the Botswana value chain businesses to be sufficient to absorb all of the recyclables in the Botswana waste stream.
Based on the results of this market study the following conclusions can be given for the different waste streams:
Metals are a low priority waste stream as metal value chains are working well and to not need interference from the Councils.
Plastics, paper, cardboard and glass can be categorized as a medium priority waste stream, some processing infrastructure is present and markets are robust. A variety of activities could stimulate collection such as development of infrastructure to improve segregation of recyclables.
Food residuals and yard waste represent a large fraction of the total amount of waste, yet recovery hardly exists in Botswana. High priority exists with developing markets for the organic waste streams such as providing infrastructure for composting.
The recycling industry in South Africa is one of the main markets for recyclables from Botswana and is very active in investing in recycling equipment and developing markets. Therefore sufficient interest exists in purchasing recyclables from Botswana. However prices paid for recyclables fluctuate widely in South Africa due to variations in supply and demand for different recyclables in the local and overseas markets, and a lack of subsidy which would cushion the market from the effects of these fluctuations. These variations make it challenging to build stable and reliable relationships between scrap dealers in Botswana and the recycling industry in South Africa.
Selected Framework: the Slow Road to Municipal Recycling
The Framework Options Paper delineates a fundamental choice to be made by Botswana Stakeholders as to their choice of whether to “go for” the Municipal Recycling Framework, or to stay with Value Chain Recycling. Municipal Recycling is a framework with its centre of gravity in the public sector. Municipal Recycling is driven by the need to internalise negative environmental externalities of waste disposal and littering, and is based upon full cost and universal pricing of disposal and public investment in processing and transport capacity.
Value Chain Recycling is a framework with its centre of gravity in the private value industrial and agricultural value chains. Value Chain Recycling operates in Botswana at the moment, and is driven by the commodities value of the recyclables, and the nutrient and soil properties of products that can be made from organic wastes.
The decision made by the Reference Group was to go for a combination. Some members of the reference group described this as a “hybrid,” others as “municipal recycling but not too fast.” There is actually no possibility for a true hybrid, as there is a clear distinction between how recycling works under these frameworks. So the consulting team interprets this decision as “the slow road to municipal recycling.” This means that we now enter a transition period in solid waste management, that gradually brings recycling and valorisation under the hegemony of the Councils. The speed with which each Council takes on the goals and responsibilities for policies and practices can vary, and the willingness to price and pay for disposal determines the speed of

10 The Botswana Recycling Guidelines 2012 Advice on Valorisation for Middle-Income Countries
the transition. Some of the hard-working recycling businesses in Botswana would actually like to go much faster, and this represents a great and exciting potential.
The Botswana Recycling Guidelines 2012 Advice on Valorisation for Middle-Income Countries
11
Chapter 1. Guidelines for Modernising the Enabling Environment
1 Guideline 1: Reforming the enabling environment
1.1 Goals
The goals to be achieved with this guideline are:
1. Address legislative gaps and introduce improvements 2. Achieve high-performance recycling, at the rate of 50% diversion or above 3. Create a functioning incentive structure for all Councils and private and public
stakeholders to improve the performance of the waste management system2 4. Improve governance and make it fairer and more transparent 5. Create the boundary conditions for banks, government agencies, donors, and other
forms of credit and debt financing to invest in valorisation 6. Reduce the amount of materials going to disposal of all types 7. Increase diversion or recoverable materials from waste to the agricultural and industrial
value chains
1.2 What is this Guideline about?
This guideline presents a number of related but discrete institutional, policy, legal and financial reforms which work towards a high-performance recycling system. Please refer to the Framework Options Paper and the Inception Report for more information.
1.3 Activity: Price disposal for all waste going to the 14 official Botswana landfills
Explanation: Landfills in Botswana charge a gate fee based on weight of the incoming waste. But the fees represent only fraction of the real cost of operation. The price list hangs in the office of the landfill manager, and is based on what the Council feels is fair to charge for a specific list of materials. There is no calculation available to determine whether these fees are cost reflective and economical. Also the Councils do not charge themselves, nor their outsourced contractors, nor institutions with a public mission. The amount of waste which is charged for is just a fraction of the total waste arriving. This means that there are a lot of revenue leaks at the disposal sites and Councils have to subsidize landfill operations from other sources of funding, simply because the landfill operations are not fully identified as cost and revenue centres.
As a result, the landfills are continually under-resourced, maintenance is meagre, and breakdowns are not repaired in a timely way. The weighbridge in Francistown hasn‟t worked for months, the compactor is also broken down, and even the bulldozer borrowed to replace the compactor has ceased to function. A third problem is that Botswana institutions do not use activity-based costing, so, for example, the vehicles used to deliver waste are on the budget of the DWMPC or the Council, but it is not clear whether they are included in the analysis to produce the prices for disposal. For these landfills to deliver the environmental and health benefit for which they have been designed, the costs of specific activities need to be known, per activity; the pricing of disposal needs to be reformed and rationalised, and everyone needs to pay.
Results: Councils and the DWMPC have agreed on a method for activities-based costing for all their solid waste and recycling activities.
a. The national definition of “waste” has been refined to exclude recyclables, and to mention the key types of waste for which disposal fees will be charged.
2 “Incentive” refers to the system of rewards and sanctions and not to market prices for recyclables.
12 The Botswana Recycling Guidelines 2012 Advice on Valorisation for Middle-Income Countries
b. Councils have assigned staff or consultants the task of analysing the costs of operating their landfills, which include overhead, depreciation, fuel and electricity, staffing, building, equipment and grounds maintenance, cover materials, supervision, administration, and the like.
c. Councils have consulted with stakeholders including special interest groups involved in the waste management sector on activity-based costing for all solid waste and recycling activities.
d. A schedule of costs allocated per material, per landfill, per tonne or per kg, has been produced and validated.
e. The price schedule per material has been revised to be consistent with the costs. f. The rules for who pays have been broadened to include all institutions, companies, and
individuals bringing waste to the landfill, including the council‟s own and outsourced vehicles.
g. Councils and the DWMPC have conducted an impact assessment of priced disposal on the entire waste management system and thus ensure that an improvement in one area does not impact negatively on aspects like waste collection rates.
h. There is a tracking system in place for all waste reaching the landfill, which is linked to the weighbridge and the record-keeping system for the waste crossing the scale.
i. A process has been defined for yearly review and updating of the prices for disposal, and for publishing those prices one month prior to the beginning of each fiscal year.
j. A “enterprise fund” has been set up for the revenues produced at the landfill, and 95% (or some other percentage) of the landfill revenues goes into a separate bank account, from where it can only be used to pay the costs of operating the landfill. 2% of the revenues (or some other percentage) is transferred to the DWMPC for inspection and benchmarking costs.
k. A “recycling fund” has been set up for the development of recycling activities, and 5% (or some other percentage) of the landfill revenues goes into this separate bank account.
1.4 Activity: Adjust and expand the definitions to be consistent across the Solid Waste
Act, regulations, policy documents, pricing schemes, and any other relevant
documents
Explanation: Definitions are not consistent within Botswana, and although they appear to be copied from South African policy documents, they are not correct. For example, the Act states that materials destined for recycling are “waste”. Also many things are required which are not defined.
Results: a. A provisional list of definitions has been compiled, based on the definitions in the
Recycling Guidelines. b. A stakeholder consultation has produced a committee to finalise the definitions. c. Final definitions have been elevated to the status of a regulation and apply to the Act and
all strategies, policies, and the like. d. All relevant documents and the Act have been lightly edited to take the new definitions
into account.
1.5 Activity: Revise the Solid Waste Act
Explanation: The Act is dated 1998, and both the circumstances and the ambitions of Botswana have changed; the value chain is different than at that time, and there are many developments in the world and in neighbouring countries that should influence the Act. No solid waste plans have been produced. Also there is room for much more specific information about valorisation and how the recycling guidelines are to be used.
The Botswana Recycling Guidelines 2012 Advice on Valorisation for Middle-Income Countries
13
Results: a. An institutional analysis has been conducted to determine how to streamline institutional
mandates for solid waste management in general and recycling in the proposed amended Solid Waste Management Act.
b. The improvements proposed by Mr. Kentlafetse in his 2008 Policy Paper have been transformed into a formal legislative proposal.
c. Proposed legislative improvements to the Botswana Solid Waste Management Act have been benchmarked against key regional and international best practices on modernisation of solid waste management practices.
d. The DWMPC has held broad consultations on the draft amendment bill with relevant Government departments including the Attorney General‟s chamber
e. The planning requirement has been sharpened and capacity has been strengthened for planning for solid waste management.
1.6 Activity: Create practical planning guidelines for solid waste and recycling
Explanation: There is a well-developed global tradition of solid waste planning which is broadly accepted. The earlier tradition of engineering planning for facilities – of which JICA remains one of the strongest global proponents – has been replaced in most countries by the method developed in the 1990s and presented in the World Bank-ERM Strategic Planning Guide for Solid Waste Management in Low- and Middle-income Countries. This guide, available on CD-Rom, sketches seven primary steps to planning, and is supplied on a CD-Rom to the Department as part of this Guidelines Document.
The approach to planning for valorisation in the ERM-World Bank Strategic Planning Guide is limited, and requires some strengtheing. For this reason a short recycling planning manual developed by Anne Scheinberg in 1998 is included here as Guideline 7.
Results: a. Councils have been provided with the short planning manual. b. The Department and UNDP have developed a programme of capacity development and
support for strategic solid waste planning and valorisation planning. c. The Department and key Council staff have participated in short term capacity
development and training activities on solid waste and recycling planning, with a focus on the practicalities. Support of UNDP or any other cooperating partners has been assured to facilitate support for the process of planning.
d. As part of the programme of capacity development, the Department, with donor support, has supported Council staff and together they have produced a solid waste and valorisation plan document for one Council.
e. All Councils have developed a solid waste plan with a strong sub-component of valorisation planning.

14 The Botswana Recycling Guidelines 2012 Advice on Valorisation for Middle-Income Countries
2 Guideline 2: Benchmarking, Reporting, Monitoring
2.1 Goals
The goals to be achieved with this guideline are:
1. Frame the data and analysis needs for the Department of Waste Management and Pollution Control (DWMPC, Department)
2. De-mystify reporting and monitoring 3. Support all stakeholders in improving their information management.
2.2 What is this Guideline about?
This guideline takes on the issue of information management, including the benchmarking to be done in relation to planning.
Effective planning for solid waste management in general, and recycling in particular, is dependent on the availability of high quality data. One of the common challenges that authorities and stakeholders in the waste management sector face is the absence of consistently available data that is appropriate for different purposes, including planning and governance. Botswana shares this limitation and in the current situation there is no way to know how much is currently being recycled or otherwise valorised in Botswana. This makes it difficult, if not impossible, to evaluate the impacts of new activities and of the recycling guidelines themselves.
Explanation: A well designed monitoring system for valorisation in Botswana should achieve two main purposes:
Collect relevant data which is required for assessing progress made in meeting the recycling and valorisation goals and targets
Consistently analyse and report key waste data obtained from different sources
It is important for the DWMPC, Councils, and all other stakeholders, to agree on the purpose and necessity for monitoring. Not every aspect of solid waste management and/or recycling needs to be measured: but only those aspects which are necessary for assessing the attainment of targets and goals as outlined in the Waste Management plans. Among the likely parameters are targets for diversion of waste from disposal to recycling. The choice of indicators for the targets is a critical exercise because indicators provide information on progress made in achieving targets and these indicators must be specific and measurable. The indicators for each of the targets set by either DWMPC or Councils must be specified at the time each target is set, to enable a baseline zero-measurement, as well as to make comparative monitoring over time possible and credible. Indicator selection should reflect the monitoring purpose and how information obtained will be used.
Some of the key data necessary for monitoring recycling activities in Botswana will include the following:
Waste composition data Waste collection and transportation data Recovery and recycling data Waste disposal data.
The Botswana Recycling Guidelines 2012 Advice on Valorisation for Middle-Income Countries
15
2.3 Activity: Develop and enact reporting, benchmarking, monitoring, and evaluation
requirements and use these to produce a baseline that establishes existing levels of
valorisation
Explanation: In order to establish a good monitoring system, it is necessary for an inventory of existing data to be conducted. This can be done in the context of the Process Flow Diagrams which presumably, each Council will develop. The Process Flow Diagram will enable councils and DWMPC to collect baseline information covering the whole waste management hierarchy. At this stage, an assessment of existing data on waste generation, waste collection, recycling, and waste disposal should be conducted. Further, an assessment should be made on the quality and reliability of the data for the purpose of the monitoring system to be developed. In conducting the baseline surveys, it is also necessary to assess the existence of environmental and socio-economic indicators collected by other institutions which may be relevant to the purpose of monitoring the system that you are developing. You do not have to collect the same information if it is already being collected by other institutions, what you have to do is establish links with these institutions to regularly access their data for your purposes. GDP and demographic data is an example of information likely collected elsewhere.
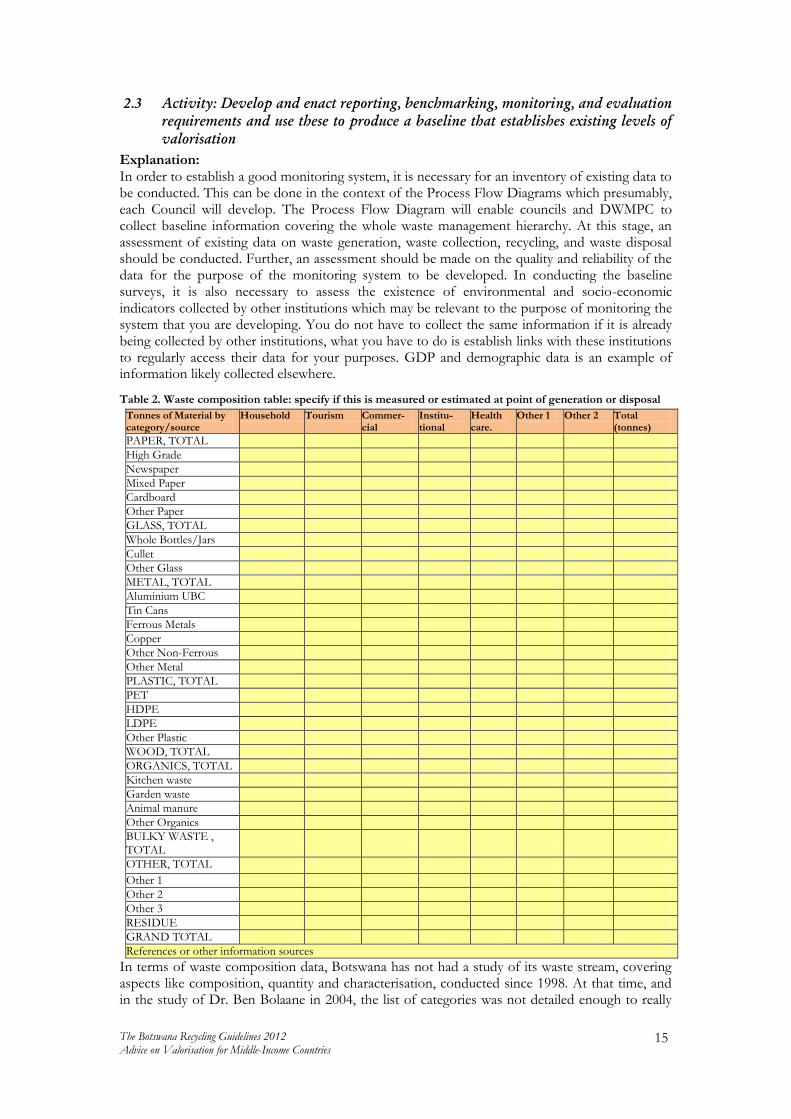
Table 2. Waste composition table: specify if this is measured or estimated at point of generation or disposal
Tonnes of Material by category/source
Household Tourism Commer-cial
Institu-tional
Health care.
Other 1 Other 2 Total (tonnes)
PAPER, TOTAL
High Grade
Newspaper
Mixed Paper
Cardboard
Other Paper
GLASS, TOTAL
Whole Bottles/Jars
Cullet
Other Glass
METAL, TOTAL
Aluminium UBC
Tin Cans
Ferrous Metals
Copper
Other Non-Ferrous
Other Metal
PLASTIC, TOTAL
PET
HDPE
LDPE
Other Plastic
WOOD, TOTAL
ORGANICS, TOTAL
Kitchen waste
Garden waste
Animal manure
Other Organics
BULKY WASTE , TOTAL
OTHER, TOTAL
Other 1
Other 2
Other 3
RESIDUE
GRAND TOTAL
References or other information sources
In terms of waste composition data, Botswana has not had a study of its waste stream, covering aspects like composition, quantity and characterisation, conducted since 1998. At that time, and in the study of Dr. Ben Bolaane in 2004, the list of categories was not detailed enough to really
16 The Botswana Recycling Guidelines 2012 Advice on Valorisation for Middle-Income Countries
understand the waste composition. The 2004 study at least provides a point of departure, and that is more than most of Botswana‟s neighbours can claim.
To start with, it is necessary to define the materials that will be tracked. Table 2 is drawn from the data collection tool used in the UN-Habitat 2010 publication Solid Waste Management in the World‟s Cities. This table includes a large number of categories of materials. Not all of these materials are traded or even generated in Botswana, so this list needs to be refined and cut down so that only relevant materials are included.
Results: a. The Department has designated a Senior Engineer or other staff person to oversee the
Monitoring and Evaluation function. b. A Monitoring System for waste management has been developed by the Department, in
consultation with Councils and other key stakeholders. Monitoring system clearly states the purpose for monitoring, targets, indicators, sources of information and frequency of collection of key data.
c. A “zero-measurement” baseline has been created for each District and Town/ City, also to test feasibility and practicality of the benchmarks, targets and indicators.
d. A baseline composition study or estimation and modelling process for these materials has taken place, so that Table 2, above, can be filled in for the baseline year.
e. Data Management protocols have been developed to cover the different types of indicators identified in the Monitoring System. This is necessary to ensure that data is consistent, of high quality, easy to collect and record, and that it is suitable for the analysis that it is intended for.
f. The Department and UNDP have developed a programme of capacity development and support for the benchmarking and monitoring programme.
g. The benchmarks, targets and indicators have been refined based on the experience of collecting them.
h. A benchmarking manual or instruction booklet with excel template has been prepared. i. A training has been developed and conducted on how to benchmark. j. The benchmarks have been integrated into a system of Activity-based Costing and Fee-
setting.
2.4 Activity: Define reporting units and enact a reporting requirement
Explanation: Monitoring activities conducted over time will bring out key information which needs to be effectively communicated in order to stimulate necessary action. In the case of valorisation activities in Botswana, monitoring activities should help highlight whether the new approaches introduced are working well and Botswana is on track in achieving its set targets, including diversion percentage goals for recycling. Monitoring, like other activities, consumes vital resources and it is important that there is an efficient way of collecting data from the different sources of information. Standard reporting units and formats are desirable in order to maintain a consistent approach and allow for national aggregation where necessary. For instance, it is important for stakeholders to agree whether waste will be measured by weight or by volume; and if it is by volume, a common formula for converting volume to weight measurements in a consistent way.
Once the materials list is defined, the Department needs to create a process for collecting the data; given the limited resources and the low density of population and industry, the best approach to this is to introduce a reporting requirement as part of all permitting processes, and introducing a very brief capacity development step – a 5-minute video should be sufficient -- in the permitting process, explaining to applicants how they have to report their activities in terms of waste management.
The basic way of organising reporting is to create simple, transparent, and easy-to-use monthly reporting forms for all facilities and businesses which have asked for a permit for handling or processing waste, for recycling or related activities, or organics valorisation. To this should be
The Botswana Recycling Guidelines 2012 Advice on Valorisation for Middle-Income Countries
17
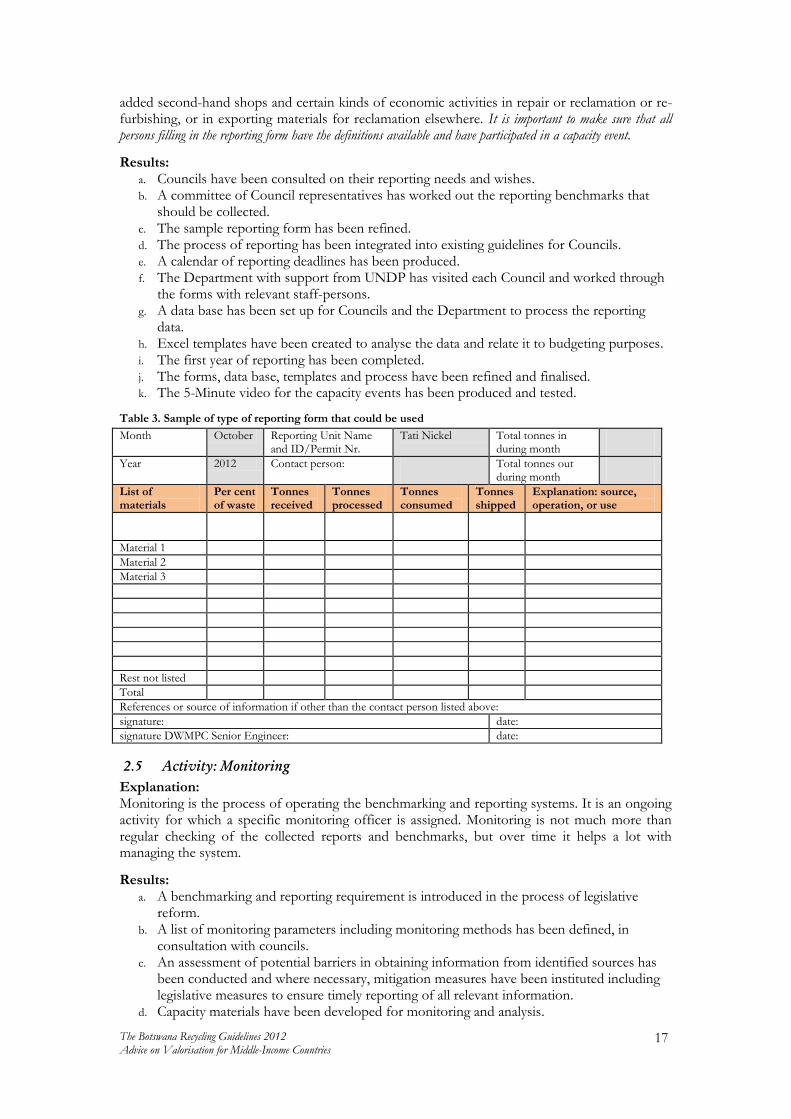
added second-hand shops and certain kinds of economic activities in repair or reclamation or re-furbishing, or in exporting materials for reclamation elsewhere. It is important to make sure that all persons filling in the reporting form have the definitions available and have participated in a capacity event.
Results: a. Councils have been consulted on their reporting needs and wishes. b. A committee of Council representatives has worked out the reporting benchmarks that
should be collected. c. The sample reporting form has been refined. d. The process of reporting has been integrated into existing guidelines for Councils. e. A calendar of reporting deadlines has been produced. f. The Department with support from UNDP has visited each Council and worked through
the forms with relevant staff-persons. g. A data base has been set up for Councils and the Department to process the reporting
data. h. Excel templates have been created to analyse the data and relate it to budgeting purposes. i. The first year of reporting has been completed. j. The forms, data base, templates and process have been refined and finalised. k. The 5-Minute video for the capacity events has been produced and tested.
Table 3. Sample of type of reporting form that could be used
Month October Reporting Unit Name and ID/Permit Nr.
Tati Nickel Total tonnes in during month
Year 2012 Contact person: Total tonnes out during month
List of materials
Per cent of waste
Tonnes received
Tonnes processed
Tonnes consumed
Tonnes shipped
Explanation: source, operation, or use
Material 1
Material 2
Material 3
Rest not listed
Total
References or source of information if other than the contact person listed above:
signature: date:
signature DWMPC Senior Engineer: date:
2.5 Activity: Monitoring
Explanation: Monitoring is the process of operating the benchmarking and reporting systems. It is an ongoing activity for which a specific monitoring officer is assigned. Monitoring is not much more than regular checking of the collected reports and benchmarks, but over time it helps a lot with managing the system.
Results: a. A benchmarking and reporting requirement is introduced in the process of legislative
reform. b. A list of monitoring parameters including monitoring methods has been defined, in
consultation with councils. c. An assessment of potential barriers in obtaining information from identified sources has
been conducted and where necessary, mitigation measures have been instituted including legislative measures to ensure timely reporting of all relevant information.
d. Capacity materials have been developed for monitoring and analysis.

18 The Botswana Recycling Guidelines 2012 Advice on Valorisation for Middle-Income Countries
e. The current cohort of permit-holders has been informed of their new obligations for benchmarking, reporting, and monitoring.
f. Plans, baselines, and monitoring reports begin to arrive. g. Department produces and widely disseminates annual reports on valorisation activities in
Botswana.
The Botswana Recycling Guidelines 2012 Advice on Valorisation for Middle-Income Countries
19
3 Guideline 3: Development of a Communication Plan
3.1 Goals
The goals to be achieved with this guideline are:
1. To meet the information needs of the public, as well as of the various social and professional groups, including what is required from them.
2. To promote collective consciousness, awareness, understanding of the reasons and principles of stakeholder mobilisation and participation in the waste management system of the country, in particular in recycling activities.
3. To disseminate information and materials to target groups relevant to solid waste management system with emphasis on recycling.
4. To enhance recycling awareness and visibility through media relations, branding, network building and community participation activities.
3.2 What is this Guideline about?
This guideline aims to assist any person or group of people, with little or no knowledge about communication, in developing a Communication Plan that also includes community mobilisation, campaign ideas and focus groups activities.
3.3 Activity: Develop a communication plan in a solid waste system
Explanation: Communication is an essential vehicle to achieve core goals in any recycling plan. There is a need for a two way dialogue between service waste system users and service providers. The success in implementing an integrated recycling plan in a city depends to a great extent on the awareness of the target groups and the public participation and co-operation in the new system.
People‟s willingness and diligence in segregating their waste and in keeping it or taking it to different waste fractions to depots, recycling centres or waste collection points will depend on the attitudes and behaviour of the population, public servants and members of various groups. The success in changing behaviour, attitudes and habits will depend on the high degree of cooperation, two-way communication and trust between target groups and providers of the service, and a lack of affordability will jeopardise the success of the entire plan.
Communication does not "just happen." Effective communication requires an effective strategy - a coherent plan of action which creates trust and invites the population to participate; and thus enhances the sustainability of the intervention. It also reduces the likelihood of conflict and resistance, and avoids the costs associated with conflict. In technical terms good communication translates to better costs recovery, high collection rates for recyclables, and better performance by providers.
The current situation in Botswana is that the local authorities and the Department of Waste Management and Pollution Control are the leaders in communicating with the general public on matters of solid waste management including recycling. While some educational and promotional materials such as posters have been made, there is no formal Communication Plan.
It is not difficult to write a Communication Plan and the following section explains the most important steps in terms of results that must be fulfilled in order to have a good result.
Results: a. Councils have developed Communication Plans (CPs) and provide budgets for the
implementation of these Plans. b. Councils have identified existing structures/platforms available in the community that
could support the development of CPs. c. Councils have agreed on the composition of the committee that has the responsibility to
develop the CP.

20 The Botswana Recycling Guidelines 2012 Advice on Valorisation for Middle-Income Countries
d. A multi-stakeholder Communication Plan Committee (CPC) has been established including members of the community (e.g. representative of a youth group, Chamber of Commerce, university, Ministry of Education or alike).
e. The CPC has identified and engaged target groups, including waste pickers, recyclers, collectors, local authorities, local and national government institutions NGOs, CBOs, service users, educational centres, health care centres, associations (e.g. Chamber of Commerce or Industry), women‟s associations, big waste producers (e.g. slaughter houses, hotels), women‟s clubs, teachers, students, religious leaders and alike; to inform them of the recycling project and to identify stakeholders‟ perceptions and their information needs.
f. CPC together with other stakeholders have collected information related to motivators and barriers that might hinder the effectiveness of valorisation.
g. CPC has developed a monitoring and evaluation procedure focused on communications, which is followed on a regular basis. This process has been defined to take place at least every 6 months; it is open and flexible to receive feedback in order to improve communication.
h. CPC and the Councils have defined a set of indicators to follow the performance of the communication strategy.
i. These indicators have been co-ordinated with the PME indicators in Guideline 2.
3.4 Activity: Institutionalising participation in planning, implementation, monitoring
and evaluation
Explanation: People‟s participation during the planning, implementation, monitoring and evaluation of the valorisation is essential because it increases the effectiveness and efficiency of the investment. At the same time it is seen as a means to a more fundamental end: to strengthen the civil society and democracy. The mobilisation of the community is an essential component for making recycling feasible and viable. Implementers are aware of community resistance and behaviours which run counter to the objectives. A Mobilisation Plan and recycling campaigns could help to induce behavioural change. The local authorities in Botswana, on an ad hoc basis, do engage the communities on matters of solid waste management. However, the weakness of this approach is that there is no systematic analysis of the inputs and how this relates to communication approaches.
Photo 1. Planning process of the Community Mobilisation Plan Committee
Source: WASTE
Results: a. CPC has included a Community Mobilisation Plan (CMP) as part of the Communication
Plan. b. The Councils have provided budget for the development of the activities. c. CPC implements Community Mobilisation Plan by engaging with the identified target
groups on the roles that they can play in the recycling project.

The Botswana Recycling Guidelines 2012 Advice on Valorisation for Middle-Income Countries
21
d. CPC has developed a capacity development plan to train the community in order to accelerate the changes in recycling habits and attitudes.
e. CPC has set up indicators to monitor and evaluate the implementation of the plan. Based on the results the plan can be continued as planned or rectified.
3.5 Activity: Creating a recycling campaign
Explanation: Establishing the objective of the campaign is a key component in the preparation and planning of a recycling campaign. The objectives must be SMART:
Specific: objectives that clear and outline what you are hoping to achieve Measurable: objectives with indicators that can determine the success of the campaign Achievable: campaign objectives that are achievable for the target groups Realistic: objectives that can be achieved with the available resources and knowledge Time-sensitive: objectives can be realised under the time specified
As already mentioned as part of the Communication Plan, it is critical during planning and preparation of the recycling campaigns to determine how you will monitor and measure the campaign performance and establish processes to meaningfully evaluate your communication objectives.
Results: a. CPC has analysed current means of communication used in other projects, programmes or
marketing (e.g. brochures, radio, TV, telephone messages, billboards and alike). The analysis considers successes and failures of the used means. Based on the lessons learnt of this analysis there is a list of the most important means of communication in the project area.
b. CPC has analysed the barriers and motivators and have defined key messages to be delivered to the public. Those messages include information that helps to overcome the barriers and strengthens the motivators. The messages can have rational, emotional or moral content that helps to produce the desire response.
c. CPC has evaluated different promotional instruments: radio, TV, poster and billboard campaigns, shopping bags, magnets, press releases, newsletters, information kits and stands, special calendars, website, social media, stickers, leaflet and help desk at the municipality. The choice on the promotional instruments has been based on the available budget and the existing means of communication. Optional is to find the support from a graphic designer or alike that helps to propose the lay out of the messages and communication means.
Some examples of messages used in recycling campaigns are:
o Recycling one tonne of paper: saves 17 trees , avoids 2 telephone booths full of waste, requires 1/3 less water than virgin product and requires 1/10 the amount of bleaching agents
o Stop treating your recyclables like waste o Success!! We did it! We reached our goal of 50% diversion of waste from landfill o Worm your way into vermi-composting. Collect your food waste and feed a worm o Wait a minute, are you sure that's not recyclable? o The plastic of today is the habitat of tomorrow o Recycling plastic feels fantastic
d. CPC has held planning meetings with stakeholders in order to develop the recycling campaign based on agreed messages, medium of communication and messenger.
e. CPC conducts regular monitoring and periodic evaluation of the recycling campaign, based on pre determined indicators.

22 The Botswana Recycling Guidelines 2012 Advice on Valorisation for Middle-Income Countries
Photo 2. Promotional poster for promotion of recycling
Source: CSIR, South Africa
3.6 Activity: Working with focus groups
Explanation: Focus group discussions are seen as an important tool for acquiring feedback regarding to a change of attitude or behaviour. They allow determining, analysing and discussing the challenges in the implementation of a recycling project. In Botswana, focus group discussions can be organised in cities and rural districts. Existing community and district level authorities, including traditional leaders, can play a role in mobilising the people and stakeholders to participate in such focus group discussions.
Photo 3. Billboard promoting source separation
Source: CSIR, South Africa Photo 4. Promoting recycling in a municipality
Source: CSIR, South Africa
Results: a. CPC has collected information about waste related stakeholders present in the city or
districts and it has organised them by focus groups. As an example: waste pickers, recyclers, itinerant waste buyers, women, students, political leaders, traditional leaders,

The Botswana Recycling Guidelines 2012 Advice on Valorisation for Middle-Income Countries
23
village and ward committee leaders, religious leaders, commercial, industrial, health care, slaughter houses, gas stations, construction, unions, police and the like.
b. CPC has developed a plan for group discussions in order to inform and to analyse the efficiency of the activities, constraints, bottlenecks, information gaps, participation of the citizens and target groups.
c. CPC together with the different groups have validated the steps that were being followed and they have incorporated them in the project implementation.
d. CPC has developed a follow-up plan.
3.7 List of references specific to this Guideline
Designing a communication strategy. www.research matters.net Chapter 6. Available at: http://www.idrc.ca/uploads/user-/1226604865112265957811Chapter_6%5B1%5D.pdf
Hershey, R. C., 2005. Communication tools. A guide to navigating communications for the non-profit world. Available at: http://www.hersheycause.com/pdf/cc_toolkit.pdf
Srinivasan L., 1990 Tools for Community Participation. A manual for training trainers in participatory techniques, Prowwess/UNDP, New York, USA
Plummer, J., 1999. Municipalities and Community Participation, A sourcebook for capacity building, Earthscan Publications Ltd, London, UK.
Catchy messages for recycling at: http://www.cleanriver.com/recycling_programs_and_education/recycling_slogans_catch_phrases_and_facts/recycling_messages.aspx http://greenliving.lovetoknow.com/image/143847~recycle.jpg

24 The Botswana Recycling Guidelines 2012 Advice on Valorisation for Middle-Income Countries
4 Guideline 4: Public Private Partnerships (PPP)
4.1 Goals
The goals to be achieved with this guideline are:
1. To describe some of the problems that arise in waste management systems including recycling services
2. To introduce ideas on how Public Private Partnerships can help address some of the problems found by municipalities while delivering waste management services
3. To define the different roles private parties can have in a Public Private Partnership 4. To introduce the private finance structures used for Public Private Partnerships 5. To describe some conditions for successful inclusion of the informal sector into formal
waste management systems
4.2 What is this Guideline about?
This guideline aims to provide an understanding of basic concepts, methods and types of Public Private Partnerships for recycling services. It also includes some ideas of the operations by which recyclable materials turn into useful products.
4.3 Topic: Service partnership in municipal recycling
Botswana has an outstanding system of public landfills in the districts, but the fee system is weak and creates a resource crisis in operating. Private recycling infrastructure is not well-mobilised due to restrictions on waste picking at landfills. In general, there is a lack of experience and an underdeveloped instrumentarium for public private partnerships in waste management and valorisation.
Recycling systems in the councils can start with a combination of an agreement between the municipality and a proficient value chain partner that can bring financial stability, knowledge, technologies and market relationships to deliver an adequate service. This agreement can be done through a Public Private Partnership (PPP).
According to the Reference Guide on PPP of the World Bank (2012) a Public Private Partnership is a long term contract between a private party and a government agency (Municipality, City Corporation or alike), for providing a public service, in which the private party bears significant risk and management responsibility. PPPs can help increase the funding available for infrastructure, which means, bringing more revenue to pay for infrastructure services over time, as well as improving asset utilisation at landfill sites, with recyclable sorting and composting.
PPPs also provide an alternative approach to financing infrastructure, which means that the capital costs can be spread over time. Governments often face a borrowing constraint due to financial management policies that means that even commercially viable infrastructure projects cannot be implemented in the public sector. PPPs provide an alternative way to finance infrastructure that can overcome this constraint.
PPPs have some limitations and pitfalls. PPPs can create fiscal commitments which in general are long-term, and payments depend on risks such as demand, or prices for recyclable materials, exchange rates, costs, revenues, etc.
PPPs can be expected to generate additional resources, e.g. by charging users fees. If the demand is lower than forecasted, usually the government is the one that bears the risks to make big payments to the private operator. PPPs can also fail when limited resources are spent on poorly selected projects. Under the right circumstances, PPPs can help improve infrastructure project selection, by the careful analysis of private sector investors, whose financial returns depend on getting cost and revenue forecasts right.
A common rationale for involving the private sector in the provision of waste management and recycling infrastructure provision is that the private sector is more efficient and effective at

The Botswana Recycling Guidelines 2012 Advice on Valorisation for Middle-Income Countries
25
managing infrastructure construction and service delivery. It has been found that the efficiency of the staff improved, the collection coverage increased and the quality of the service satisfies service users when the services have been given to a private party. Still these benefits depend on the capacity of the government to monitor the projects, to re-negotiate, and to manage PPPs well.
In solid waste management and particular in recycling, the private party can have functions related to:
Design or developing the project from the initial concept to construction specifications. E.g. design the systems in which the recyclable materials are going to be stored, collected, transported and sold.
Build or rehabilitate when the private party bears the responsibility to construct the required infrastructure and install all equipment for the recyclable goods, Where PPPs involve existing assets, the private party may be responsible for rehabilitating or extending the life of the asset.
Finance refers to a PPP in which the private party is typically also required to finance all or part of the necessary capital expenditure
Operating responsibilities to the private party for to a PPP can vary widely, depending on the nature of the underlying asset and associated service. For example, the private party could be responsible for the technical operation of: composting plant, waste sorting and bailing facility, landfill, transfer station, waste collection and transportation system, among others.
The PPP payment mechanism can be done by: collecting fees from service users by the private partner, or by the government, or by a combination of the two. The options for a payment mechanism can depend on the functions of the private party.
Under “user pays” PPPs, such as collection of waste, the private party provides a service to users, and generates revenues by charging users for that service. These fees can be supplemented by subsidies paid by government, which may be performance-based (e.g. conditioned on the availability of the service of a particular quality), or output-based (e.g. the number of households served, streets swept ets.).
In “government pays” PPPs, the government is the sole source of revenue for the private party. Government payments can depend on the service being available at the contractually-defined quality (“availability” payments). All Botswana PPPs, referred to as outsourcing, are currently of this type.
4.4 Topic: Trading relationships in value chain recycling
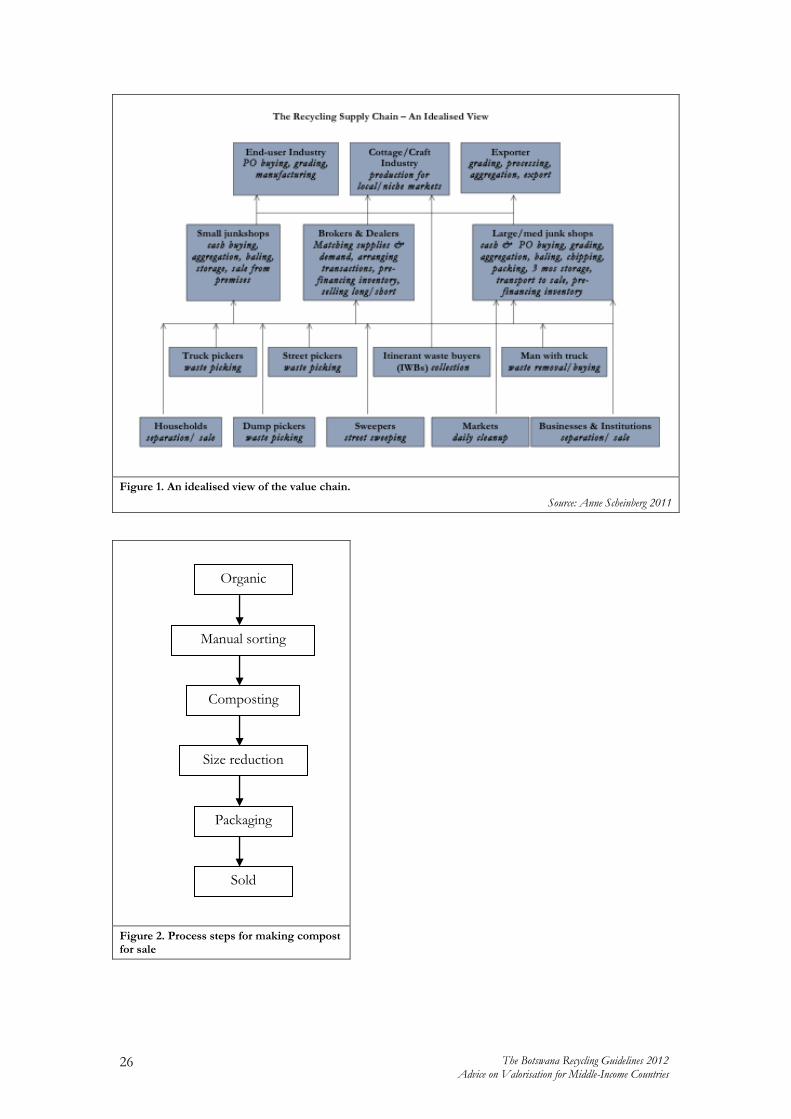
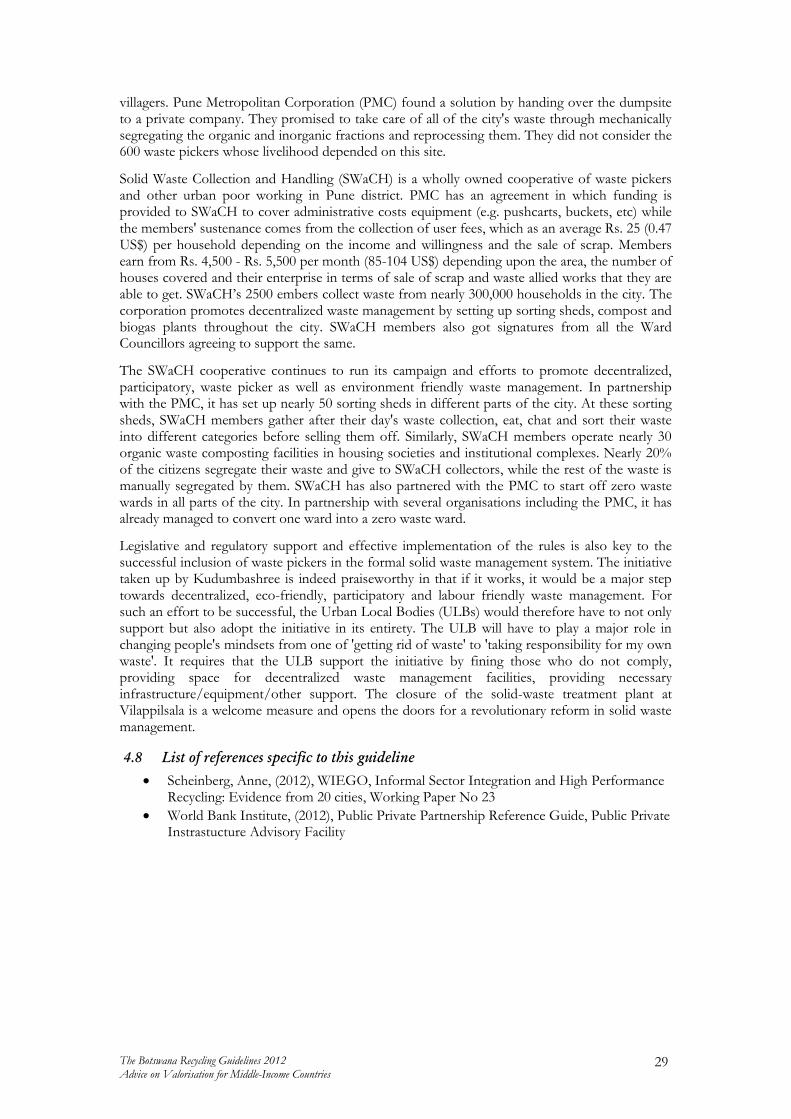
The valorisable materials can be divided in recyclables and the organic fraction. The recyclable fraction includes: paper and cardboard, plastic, metal, glass. It enters the recycling or industrial value chain, as shown in Figure 1. The organic fraction of the waste consists mainly of garden, kitchen, yard, and food processing waste. The operations needed to process the organic fraction to become compost are presented in Figure 2.
26 The Botswana Recycling Guidelines 2012 Advice on Valorisation for Middle-Income Countries
Figure 1. An idealised view of the value chain.
Source: Anne Scheinberg 2011
Figure 2. Process steps for making compost for sale
Organic
Manual sorting
Composting
Size reduction
Packaging
Sold

The Botswana Recycling Guidelines 2012 Advice on Valorisation for Middle-Income Countries
27
4.5 Activity: Integrating informal recyclers in formal waste management systems
Explanation: Waste pickers play an important but unrecognised role in waste management systems, where they represent the foundation of most recycling activities and the bottom layer of the so-called secondary materials pyramid. They recover materials from households, commercial or industrial locations, street bins, containers, communal collection points, vacant lots, and disposal sites. The materials are sold to dealers (“junk shops”) who aggregate and sell them to intermediaries who process and pack them in industrial quantities for export or domestic use.
Waste pickers are often criminalised but in some countries they have achieved legitimacy and status as important stakeholders in the solid waste system. This has created a high profile recycling system that save the city considerable amounts of money.
Waste pickers can be seen as economic and highly skilled actors of the socio-technical solid waste and recycling system. But they usually have social or political problems and a low social status. These, together with low self-image and experience of harassment, make integration sometimes a complex process. So in order to facilitate sustainable involvement of this sector in formal, modernised waste management, certain actions and conditions are recommended.
Results:
a. Waste pickers and other informal recyclers and re-users have been designated as the leaders or subjects of the process of integration, not as objects of some other stakeholder‟s intervention.
b. Informal recyclers have had the opportunity to participate in capacity strengthening to understand their own economic relationship to the recycling system, their business models, their profits and losses, and to be able to make a SWOT analysis of their own situation.
c. The local authority and its recognised and designated private partners have accepted the idea that integration is a win-win situation.
d. The institutional and economic niches available to informal recyclers have been modified to make space for them.
e. Informal recyclers‟ rights, access to materials and right to continue their professions has been assured in laws and regulations, publicised, and been the subject of articles in the press and media.
f. Police, inspectors, landfill operators, Council staff, and recycling companies have had access to capacity and sensitisation training and materials.
g. Informal recyclers from neighbouring countries and/or marginalised groups have been given the same rights and privileges as native Batswana, and a process to legalise themselves in Botswana.
h. Waste pickers have been organised as associations, cooperatives, or alike and engaged with the municipality on an agreement in which they provide different services: collection in unserved areas, transportation to transfer stations, collection of recyclables, compost of organic waste, and alike.
4.6 Topic: Three different models to integrate the informal sector3
In WIEGO Working Paper No. 23 it is discussed how the informal sector can be integrated in a municipal waste management system. Three different models are described briefly in this paragraph. :
The first inclusive recycling model can be labelled a service model, as informal recyclers are paid for a service and as such become part of the provisioning system of solid waste management.
3 Text in this section is used without quotations from Anne Scheinberg, 2012

28 The Botswana Recycling Guidelines 2012 Advice on Valorisation for Middle-Income Countries
To implement the service model, the recommendation is to add service elements to value chain activities and to document their economic and operational (and CO2) benefits. This was the approach taken in the GTZ informal sector study (Scheinberg, Simpson and Gupt 2007). Service models create a basis for some types of support and funds transfers from the solid waste system to support valorisation. By expanding value chain recycling beyond extracting value from commodities, it should be possible to claim that the local authority is benefiting by diversion of waste from disposal, and on this basis to claim that the local authority should cover some of the costs. An example is the insuring of waste pickers by the city of Pune, India.
Inclusive recycling in a service model can also be seen in Cairo, where the Zabbaleen are paid for collecting waste and, incidentally, valorizing it so it never enters disposal. Community-based organisations in Lusaka and Lima come close to a service model because they are paid for both the service of collecting and the effect of recycling (Ibid.; Gunsilius, Chaturvedi and Scheinberg 2010).
The second inclusive recycling model can be labelled a commodities model. Here value chain actors collect materials and valorize them, and keep the revenues. Commodities models leave the value chain in charge of valorisation, and encourage local authorities to share the risks and claim both credit and key benefits.
To implement the commodities model, the main recommendation is to require that informal valorisation be included in the calculation of recycling rates, and that its impacts on total waste requiring disposal be taken into account in all consulting studies, waste planning, and technical feasibility studies for waste infrastructure. In the Netherlands and in other wealthy countries, a strategy that looks very much like commodities model inclusive recycling is used to increase and reward private valorisation that falls outside of the range of recognized municipal recycling, for example, by paying diversion credits to private clothing collection charities in Rotterdam, the Netherlands or subsidizing the activities of re-use and repair businesses in Ithaca, New York or San Francisco, California, USA (Scheinberg, Wilson and Rodic 2010; Scheinberg and IJgosse 2005).
Thirdly there are hybrid models, where the municipality and collectors share responsibilities and also share benefits and revenues in recycling and solid waste management. The local authority goes beyond recognition and tolerance of value chain activities, towards active support of these activities.
For hybrid models, in addition to the recommendations above, the main recommendation is to change the boundary conditions and definitions of ownership and rights in the waste system itself. This includes protecting access to recyclables in law, defining ownership clearly, and changing or eliminating legal definitions of informal or value chain recycling as theft. For example, the Austrian waste law that defines “waste” as anything the owners might intend to give to the solid waste system, should be changed to say that waste is any item which has entered the waste system or is placed in the infrastructure of the waste system. Promoting or requiring source separation as a part of primary collection is also a key intervention in this area, because it creates economic niches for itinerant waste buyers in the modern system (Wilson, Velis and Cheeseman 2006).
A related recommendation is to pro-actively authorize legal and physical spaces for informal activities in valorisation, and to improve valorisation infrastructure (Chintan-Environmental 2005). The improvement of infrastructure means that working conditions improve, the quality of materials improves, and value chain actors improve their status. Specific examples in a pro-active authorization are the granting of concessions or franchises or district monopolies, facilitating value chain access to credit and government assistance programmes, or providing city land, buildings, or equipment to value chain actors to reduce their costs and increase their efficiency.
4.7 Case Example: Integration of waste pickers in Pune, India
Pune's (India) waste was collected and transported to the city's dumpsite in the villages of Devachi Uruli and Phursungi. The foul smell of the waste and leachate made life difficult for the
The Botswana Recycling Guidelines 2012 Advice on Valorisation for Middle-Income Countries
29
villagers. Pune Metropolitan Corporation (PMC) found a solution by handing over the dumpsite to a private company. They promised to take care of all of the city's waste through mechanically segregating the organic and inorganic fractions and reprocessing them. They did not consider the 600 waste pickers whose livelihood depended on this site.
Solid Waste Collection and Handling (SWaCH) is a wholly owned cooperative of waste pickers and other urban poor working in Pune district. PMC has an agreement in which funding is provided to SWaCH to cover administrative costs equipment (e.g. pushcarts, buckets, etc) while the members' sustenance comes from the collection of user fees, which as an average Rs. 25 (0.47 US$) per household depending on the income and willingness and the sale of scrap. Members earn from Rs. 4,500 - Rs. 5,500 per month (85-104 US$) depending upon the area, the number of houses covered and their enterprise in terms of sale of scrap and waste allied works that they are able to get. SWaCH‟s 2500 embers collect waste from nearly 300,000 households in the city. The corporation promotes decentralized waste management by setting up sorting sheds, compost and biogas plants throughout the city. SWaCH members also got signatures from all the Ward Councillors agreeing to support the same.
The SWaCH cooperative continues to run its campaign and efforts to promote decentralized, participatory, waste picker as well as environment friendly waste management. In partnership with the PMC, it has set up nearly 50 sorting sheds in different parts of the city. At these sorting sheds, SWaCH members gather after their day's waste collection, eat, chat and sort their waste into different categories before selling them off. Similarly, SWaCH members operate nearly 30 organic waste composting facilities in housing societies and institutional complexes. Nearly 20% of the citizens segregate their waste and give to SWaCH collectors, while the rest of the waste is manually segregated by them. SWaCH has also partnered with the PMC to start off zero waste wards in all parts of the city. In partnership with several organisations including the PMC, it has already managed to convert one ward into a zero waste ward.
Legislative and regulatory support and effective implementation of the rules is also key to the successful inclusion of waste pickers in the formal solid waste management system. The initiative taken up by Kudumbashree is indeed praiseworthy in that if it works, it would be a major step towards decentralized, eco-friendly, participatory and labour friendly waste management. For such an effort to be successful, the Urban Local Bodies (ULBs) would therefore have to not only support but also adopt the initiative in its entirety. The ULB will have to play a major role in changing people's mindsets from one of 'getting rid of waste' to 'taking responsibility for my own waste'. It requires that the ULB support the initiative by fining those who do not comply, providing space for decentralized waste management facilities, providing necessary infrastructure/equipment/other support. The closure of the solid-waste treatment plant at Vilappilsala is a welcome measure and opens the doors for a revolutionary reform in solid waste management.
4.8 List of references specific to this guideline
Scheinberg, Anne, (2012), WIEGO, Informal Sector Integration and High Performance Recycling: Evidence from 20 cities, Working Paper No 23
World Bank Institute, (2012), Public Private Partnership Reference Guide, Public Private Instrastucture Advisory Facility
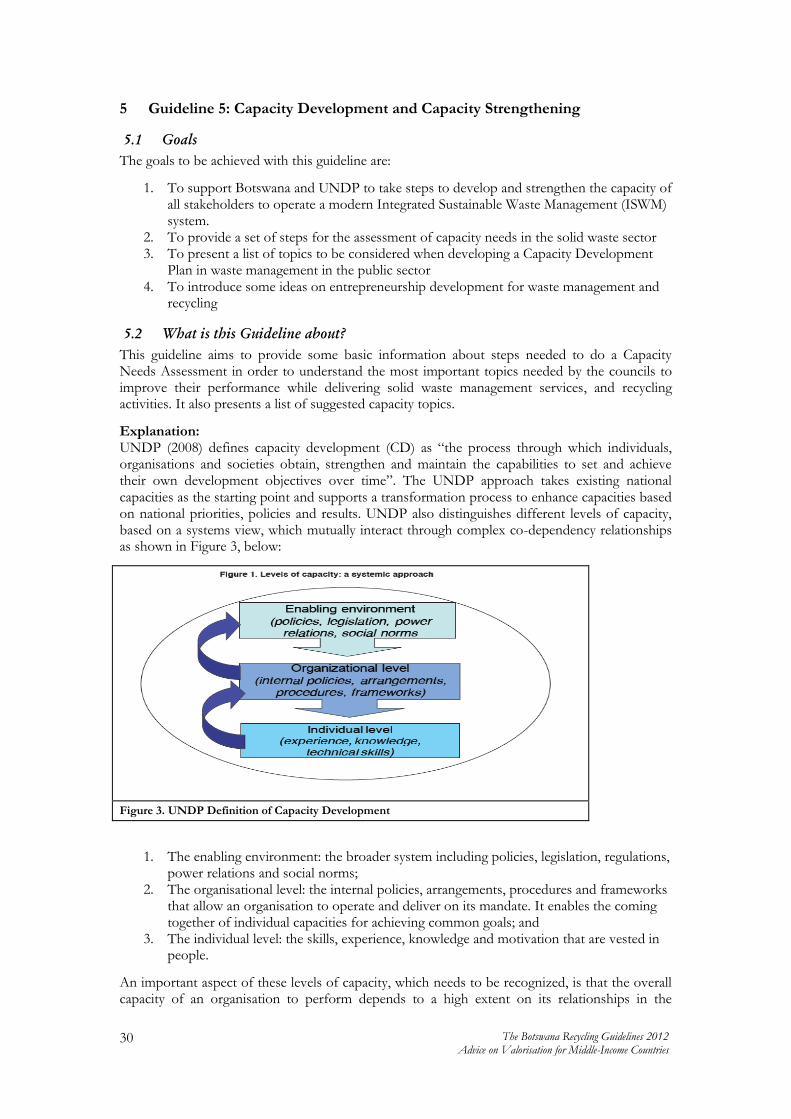
30 The Botswana Recycling Guidelines 2012 Advice on Valorisation for Middle-Income Countries
5 Guideline 5: Capacity Development and Capacity Strengthening
5.1 Goals
The goals to be achieved with this guideline are:
1. To support Botswana and UNDP to take steps to develop and strengthen the capacity of all stakeholders to operate a modern Integrated Sustainable Waste Management (ISWM) system.
2. To provide a set of steps for the assessment of capacity needs in the solid waste sector 3. To present a list of topics to be considered when developing a Capacity Development
Plan in waste management in the public sector 4. To introduce some ideas on entrepreneurship development for waste management and
recycling
5.2 What is this Guideline about?
This guideline aims to provide some basic information about steps needed to do a Capacity Needs Assessment in order to understand the most important topics needed by the councils to improve their performance while delivering solid waste management services, and recycling activities. It also presents a list of suggested capacity topics.
Explanation: UNDP (2008) defines capacity development (CD) as “the process through which individuals, organisations and societies obtain, strengthen and maintain the capabilities to set and achieve their own development objectives over time”. The UNDP approach takes existing national capacities as the starting point and supports a transformation process to enhance capacities based on national priorities, policies and results. UNDP also distinguishes different levels of capacity, based on a systems view, which mutually interact through complex co-dependency relationships as shown in Figure 3, below:
Figure 3. UNDP Definition of Capacity Development
1. The enabling environment: the broader system including policies, legislation, regulations, power relations and social norms;
2. The organisational level: the internal policies, arrangements, procedures and frameworks that allow an organisation to operate and deliver on its mandate. It enables the coming together of individual capacities for achieving common goals; and
3. The individual level: the skills, experience, knowledge and motivation that are vested in people.
An important aspect of these levels of capacity, which needs to be recognized, is that the overall capacity of an organisation to perform depends to a high extent on its relationships in the
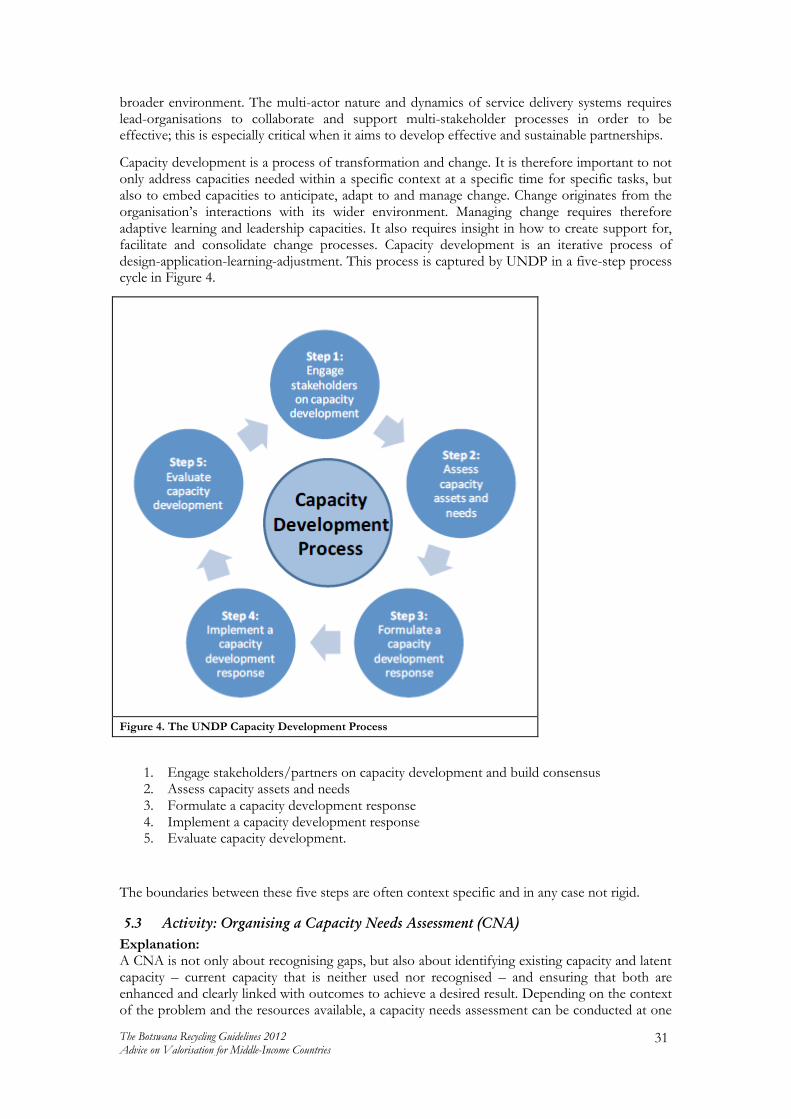
The Botswana Recycling Guidelines 2012 Advice on Valorisation for Middle-Income Countries
31
broader environment. The multi-actor nature and dynamics of service delivery systems requires lead-organisations to collaborate and support multi-stakeholder processes in order to be effective; this is especially critical when it aims to develop effective and sustainable partnerships.
Capacity development is a process of transformation and change. It is therefore important to not only address capacities needed within a specific context at a specific time for specific tasks, but also to embed capacities to anticipate, adapt to and manage change. Change originates from the organisation‟s interactions with its wider environment. Managing change requires therefore adaptive learning and leadership capacities. It also requires insight in how to create support for, facilitate and consolidate change processes. Capacity development is an iterative process of design-application-learning-adjustment. This process is captured by UNDP in a five-step process cycle in Figure 4.
Figure 4. The UNDP Capacity Development Process
1. Engage stakeholders/partners on capacity development and build consensus 2. Assess capacity assets and needs 3. Formulate a capacity development response 4. Implement a capacity development response 5. Evaluate capacity development.
The boundaries between these five steps are often context specific and in any case not rigid.
5.3 Activity: Organising a Capacity Needs Assessment (CNA)
Explanation: A CNA is not only about recognising gaps, but also about identifying existing capacity and latent capacity – current capacity that is neither used nor recognised – and ensuring that both are enhanced and clearly linked with outcomes to achieve a desired result. Depending on the context of the problem and the resources available, a capacity needs assessment can be conducted at one
32 The Botswana Recycling Guidelines 2012 Advice on Valorisation for Middle-Income Countries
or more levels: individual, organisation or sector. But regardless of the entry point, a CNA must take account of the interconnectedness of capacity issues between the targeted level(s) and the enabling environment. This assessment will focus on the individual and organisational levels.
It is also important to remember that a CNA is a capacity-strengthening process in its own right, and that the process is as important as the outcomes.
Results: a. Present situation has been analysed related to solid waste management and recycling
practices b. Capacity gaps have been identified influencing current results. c. Desired results have been identified d. The gaps have been analysed and prioritised e. The most important ones have been selected and an action plan has been prepared
5.4 Topic: Capacity development in the public sector
The municipalities are in most of the cases responsible for delivering effective, efficient and sustainable waste management services. In order to perform the given tasks, the public sector must have skilled personnel. Therefore the target groups for a capacity development programme should include politicians and all levels of public servants from executive managers to street sweepers. Some of the important issues that can be part of a Capacity Development Plan are the following:
1. Institutionalization and legislation: conceptualization service delivery ISWM, internal organisation and waste management legislation
2. Strategic planning in solid waste management: waste management planning and strategy formulation
3. Database & IT management: Database development and information technology and management information systems
4. Solid waste management collection, transfer and transport: operations SWM systems plan, implementation and operationalisation SWM systems, operations bring bank systems plan and operations health care waste collection plan
5. Accounting information systems: accounting systems, financial management and budgets 6. Tariff setting and impacts: tariffs and fees of SWM services and impacts 7. Financial analysis tariffs and pricing: cost recovery, billing, sanctions, budgets and multi
year projections 8. Communication strategy: public participation, publicity, visibility and awareness 9. Landfill management & operations: landfill management & planning; landfill operations 10. Permitting & operational licensing ISWM 11. Recycling, composting & special waste: recycling, marketing and re-processing,
composting technicalities, separate collection and commercialization, special waste collection, processing and commercialization
12. Contract procurement: types of contracts including public private partnerships
5.5 Topic: Entrepreneurship support and capacity development
Waste management and recycling activities have many entrepreneurs: organised waste pickers, small scale dealers of recovered material, door-to-door waste collectors, small scale enterprises and the like. They are innovators who develop a business to support themselves and their families. They see the economic opportunity in the waste streams such as paper and cardboard, plastic, glass, metal and others. These entrepreneurs sometimes have been struggling to survive, but when they are organised, recognised and supported with capacity development programmes they can contribute to a good waste system.
In different parts of the world small business entrepreneurs have benefited from the government‟s move towards a green economy. It is a strategy aimed at creating environmental sustainability, social equity, and economic growth creating new jobs in this sector. Governments and local authorities for example have incorporated public policies for the inclusion of these
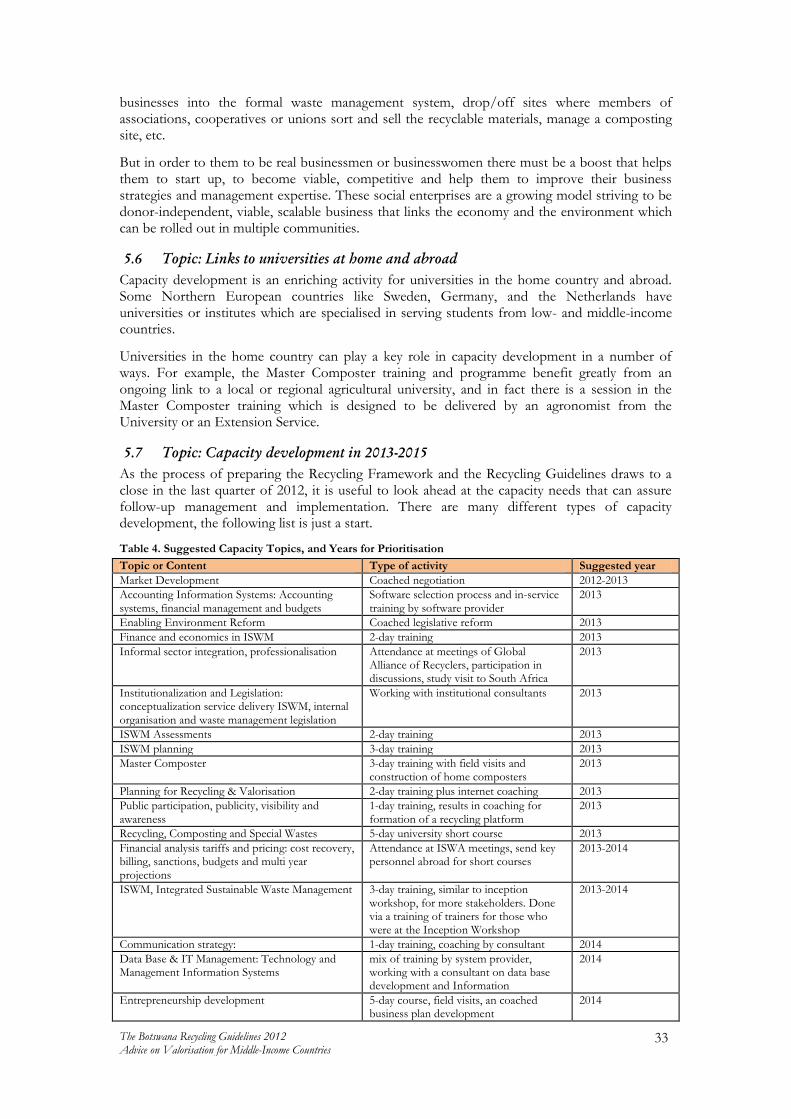
The Botswana Recycling Guidelines 2012 Advice on Valorisation for Middle-Income Countries
33
businesses into the formal waste management system, drop/off sites where members of associations, cooperatives or unions sort and sell the recyclable materials, manage a composting site, etc.
But in order to them to be real businessmen or businesswomen there must be a boost that helps them to start up, to become viable, competitive and help them to improve their business strategies and management expertise. These social enterprises are a growing model striving to be donor-independent, viable, scalable business that links the economy and the environment which can be rolled out in multiple communities.
5.6 Topic: Links to universities at home and abroad
Capacity development is an enriching activity for universities in the home country and abroad. Some Northern European countries like Sweden, Germany, and the Netherlands have universities or institutes which are specialised in serving students from low- and middle-income countries.
Universities in the home country can play a key role in capacity development in a number of ways. For example, the Master Composter training and programme benefit greatly from an ongoing link to a local or regional agricultural university, and in fact there is a session in the Master Composter training which is designed to be delivered by an agronomist from the University or an Extension Service.
5.7 Topic: Capacity development in 2013-2015
As the process of preparing the Recycling Framework and the Recycling Guidelines draws to a close in the last quarter of 2012, it is useful to look ahead at the capacity needs that can assure follow-up management and implementation. There are many different types of capacity development, the following list is just a start.
Table 4. Suggested Capacity Topics, and Years for Prioritisation
Topic or Content Type of activity Suggested year
Market Development Coached negotiation 2012-2013
Accounting Information Systems: Accounting systems, financial management and budgets
Software selection process and in-service training by software provider
2013
Enabling Environment Reform Coached legislative reform 2013
Finance and economics in ISWM 2-day training 2013
Informal sector integration, professionalisation Attendance at meetings of Global Alliance of Recyclers, participation in discussions, study visit to South Africa
2013
Institutionalization and Legislation: conceptualization service delivery ISWM, internal organisation and waste management legislation
Working with institutional consultants 2013
ISWM Assessments 2-day training 2013
ISWM planning 3-day training 2013
Master Composter 3-day training with field visits and construction of home composters
2013
Planning for Recycling & Valorisation 2-day training plus internet coaching 2013
Public participation, publicity, visibility and awareness
1-day training, results in coaching for formation of a recycling platform
2013
Recycling, Composting and Special Wastes 5-day university short course 2013
Financial analysis tariffs and pricing: cost recovery, billing, sanctions, budgets and multi year projections
Attendance at ISWA meetings, send key personnel abroad for short courses
2013-2014
ISWM, Integrated Sustainable Waste Management 3-day training, similar to inception workshop, for more stakeholders. Done via a training of trainers for those who were at the Inception Workshop
2013-2014
Communication strategy: 1-day training, coaching by consultant 2014
Data Base & IT Management: Technology and Management Information Systems
mix of training by system provider, working with a consultant on data base development and Information
2014
Entrepreneurship development 5-day course, field visits, an coached business plan development
2014

34 The Botswana Recycling Guidelines 2012 Advice on Valorisation for Middle-Income Countries
Topic or Content Type of activity Suggested year
Extended Producer Responsibility Study visit to Europe 2014
Recycling, composting & special waste: recycling, marketing and re-processing, composting technicalities, separate collection and commercialization, special waste collection, processing and commercialization
Send key staff abroad for apprenticeship to Europe or North America, bring in a medium- or long-term expert to work in the planning and implementation phase
2014
Solid waste management collection, transfer and transport:
Attendance at trade fairs, working with vendors
2014
Tariff- and fee-setting Coached activity for Councils 2014
Contract Procurement: types of contracts including Public Private Partnerships
Attend events of Institute of Waste Management of Southern Africa
2015
Operations SWM systems plan, implementation and operationalisation
Study visits to African neigbbour countries and Europe
2015
Plan and operations health care waste collection Working with consultants, study visit to India to Maleshwaram Health Care Management Cell, or closer example
2015
Strategic Planning in solid waste management Coached E-learning 2015
Landfill management & operations: landfill management & planning; landfill operations
Attend events of Institute of Waste Management of Southern Africa
when topic is the focus
Permitting & operational licensing ISWM Attend events of Institute of Waste Management of Southern Africa
when topic is the focus
5.8 List of references specific to this guideline
Palitza, K., 2012. Recycling entrepreneurs thrive in South Africa. Available at: http://www.entrepreneurshipafrica.com/business-resources/entrepnews/recycling-entrepreneurs-thrive-in-south-africa.html
Samson, Melanie: Refusing to be cast aside, Waste Pickers Organising Around the World. WIEGO, 2010.
Stephen, P. and Triraganon, R., 2009. Strengthening Voices for Better Choices: A capacity needs assessment process. Gland, Switzerland: IUCN.
Visser, H. and Brandes-van Dorresteijn, D., 2011. Public-Private Partnerships in Service Delivery Capacity Assessment Methodology. UNDP Bureau for Development Policy (BDP), Capacity Development Group (CDG), Public-Private Partnership for Service Delivery (PPPSD) Programme, Asia & the Pacific.

The Botswana Recycling Guidelines 2012 Advice on Valorisation for Middle-Income Countries
35
Chapter 2. Guidelines for Planning and Organising Valorisation
6 Guideline 6: Fast Improvements to Landfill Based Valorisation
6.1 Goals
The goals of this guideline are:
1. To improve the functioning of valorisation activities at Botswana landfills 2. To increase the volume, quality, and economic value of the materials recovered 3. To stimulate the effective recovery of brush and organic wastes
6.2 What is this Guideline about?
This guideline is designed to be the basis for Botswana regulators to write a valorisation supplement to the formal operational standards for Botswana landfills. It is based on observations at five of the 14 official Botswana landfills. At these landfills the team observed the following landfill practices:
1. Councils, public organisations, and council contractors go over the scale, but do not pay for disposal.
2. Prices for disposal are “round numbers” and are not derived from any cost analysis. 3. Separation areas are provided both near the working face for separation and storage of
“recyclables”, and in some cases elsewhere on the site. 4. Parts of structures at the working face have been rented to private recycling companies
for processing recyclables. 5. Both registered and unregistered waste pickers can be seen working at the edge of the
landfill working face, picking cans, PET, other kinds of plastic, high-grade paper, cardboard, and glass.
6. “Rubble piles” contain at least six different components of construction waste, brush, agricultural wastes, PVC pipe, bulky waste, commercial waste, etc.
7. Separately “managed” piles – 5-10 metres high – of tires, brush, and (generally ferrous) scrap metal are maintained but not always processed.
8. Separate areas out of site for drop-off of organic wastes, brush, and rubble are sometimes provided.
9. Tanks for used crankcase oil are at most landfills. 10. Incinerators for burning health care waste do not recover energy. 11. There is no clear policy about use of the weighbridge for weighing loads with recyclables. 12. Trucks are picking up 1 m3 “big-bags” of post-dumping recyclables picked from the
working face by waste pickers. 13. Botswana landfills have no sites for composting and only a tiny bit of brush processing.
6.3 Topic: Who should pay for disposal
Landfills represent the diffuse or public benefit in the solid waste system. Botswana‟s landfills anchor the solid waste system by providing a “right place” to dispose of waste. They provide protection of the environment by concentrating waste and keeping the resulting pollution controlled in one place rather than spreading it over the landscape. With liners and leachate control they prevent or minimise pollution of groundwater. By concentrating waste and minimising litter they protect wildlife and livestock from eating plastic or contaminated foods, or drinking polluted water. In sustainable development terms, a landfill provides an ecosystem service and a public service by serving as a safe sink for waste. In economic terms, ecosystem and public services and safe sinks provide a technical basis for internalising the negative externalities of production, consumption, and disposal. But for this to work, and to produce incentives for “right behaviour”, the users of the landfill need to pay for this ecosystem service.

36 The Botswana Recycling Guidelines 2012 Advice on Valorisation for Middle-Income Countries
Photo 5. Rubble Pile at Maun Landfill, 2012
Source: Anne Scheinberg
All users of Botswana landfills need to pay for disposal, whether it is “their waste” or not. Even the Councils need to charge themselves and all other public institutions for the waste that they bring, or that their contractors bring. This creates important incentives that drive the whole waste management system.
First, it creates an incentive to the Councils and other waste haulers to charge the generators of the waste, that is, their clients, the real cost of transporting and disposing of the waste. Paying for disposal provides an incentive to make collection efficient and also it forces the collectors and the councils to charge their clients, which in turn provide the means to maintain vehicles, pay for fuel and staffing, operate the landfill, repair the bulldozer, and the like. By charging everyone who brings waste to the landfill, you make it clear that there is a real ecosystem and financial cost to disposing of waste and keeping the city and neighbourhoods clean.
Secondly, charging for disposal delivers the negative externalities directly to the people who are in a position to consume less, replace their automobile or wash machine less frequently, recycle better, valorise their organic waste, or make a home compost. It is a much more powerful driver for individual and household behaviour change than even the best communication plan.

The Botswana Recycling Guidelines 2012 Advice on Valorisation for Middle-Income Countries
37
Photo 6. Price list for disposal photo at Maun Landfill
Source: Anne Scheinberg
Down the line, introducing tipping fees at the landfill creates deeper change in the waste system, because now the Councils and the DWMPC see directly the benefits of investing in alternatives, like materials recovery facilities (MRFs) or separate collection. And when they do that, landfills fill up more slowly and become more manageable, and the quality of the environmental service actually improves.
6.4 Activity: Analyse activity costs to change prices and weigh-bridge (scale)
procedures
Explanation: There are several problems with how disposal is priced and how it is charged at Botswana landfills:
1. The prices are set by material, but not charged for all waste arriving. For example, neither Councils nor their outsourced contractors pay these prices. So in fact the system is set up by material but operated by generator.
2. There are unclear and not transparent rules about what kinds of trucks and what kinds of materials go over the scale.
3. Materials weighed out for recycling do not result in any financial transaction at the landfill.
4. The scale records are not complete and they are not analysed.
This guideline is about changing the system, to eliminate the above-mentioned problems.

38 The Botswana Recycling Guidelines 2012 Advice on Valorisation for Middle-Income Countries
Result: All waste going into and out of the landfill goes over the scale, is registered by license plate, type of waste, weight, and degree of mixing, and is paid for based on weight, condition, and type of waste.
a. The DWMPC has prepared a guideline for full cost pricing at Botswana landfills and budgeted the process of introducing it
b. The DWMPC or a consultant has prepared an instruction on how to analyse costs and price disposal
c. Software and hardware to track landfill weighbridge activity has been adapted to produce full records and to support full-cost pricing
d. The DWMPC and the Councils have negotiated a schedule for introducing full cost pricing and monitoring the process. The suggestion is to do the work in the first half of 2013 and introduce the new process in mid-2013.
e. Scale operators and landfill managers have been to a training on how to register waste at the landfill.
f. Councils have informed their citizens and collectors that the charges for waste disposal will increase, and have produced guidelines for setting collection and disposal tariffs (see also Guideline 18-19)
g. A price adjustment for recyclables taken out of the landfill has been negotiated with the recycling companies.
6.5 Activity: Optimising waste picking and recovery on the working face
Result: a. The rules are changed for waste picking of recyclables at landfills. b. The DWMPC has prepared a guideline for waste picking, separation, and processing at
landfills. c. The process for companies to register pickers has been changed. Instead of a limit of 10
or 5 pickers per company, a new standard has been set that for each group of up to 25 pickers, the recycling company must have a supervisor at the landfill site with a hand phone number that is listed on the registration form, and a portable toilet that is close to the separation area.
d. The supervisor certifies the loads going out of the landfill. e. All loads going out of the landfill are weighed, and registered by company and (reported)
type of materials. f. The DWMPC and the Councils have agreed on a deadline for introducing a pre-sorting
and separation area at each landfill to get the activity of picking off of the working face. g. At each landfill, the companies registering pickers and the individually registered pickers
have to attend training once per year.
Result: Separate areas at Botswana landfills are more clearly separated in space, rules, and function.
a. New definitions for specific waste streams are introduced following or anticipating the changes in the Act. Recyclables are no longer defined as waste, but are given specific names that relate to their marketability status, such as OCC, old corrugated containers, PET, polyester terephthalate, or other names, and these are removed from the definition of waste.
b. Terms like “rubble” are replaced by specific descriptive words, such as:
o paving materials o dirt, topsoil o sand, gravel o roofing o asbestos o bricks
o straw, hay, agricultural wastes
o brush o painted, treated, and
coated wood o unpainted uncoated
wood, branches, trees
o cement, cement block o furniture o irrigation pipes
The Botswana Recycling Guidelines 2012 Advice on Valorisation for Middle-Income Countries
39
c. The loads are evaluated at the scale, and the different materials are discharged in separate places, close to the working face and under supervision.
d. All discharging of separated streams is supervised. For certain streams for which there is a valorisation option at that particular landfill, such as brush and yard waste, the driver has the option to discharge the load and return to the scale before dumping the waste to be landfilled, and pay less for the landfilled waste.
e. Each Council is encouraged to seek – via tender or negotiated agreement – one or more private partners or IPELEGENG or Empowerment project partners who will take on the management and valorisation of separated streams. Some examples are:
o IPELEGENG participants can cut unpainted wood for firewood. o In areas like Francistown where there are mines nearby, empowerment funds
can support initiatives to set up composting operations at the landfill, or on land nearby. The mines can be asked for a corporate social responsibility commitment to buy all of the compost produced for a fixed price, to fulfil their reclamation obligations.
o Supermarkets can use their plastic bag profits to support the collection of plastic bags at the landfill and the transport of these to markets.
o A private partner can be sought for filtration of used motor oil, so that it can be used for heating or in the medical waste incinerators.
Result: The management of compostables and brush and woody waste at Botswana landfills is improved.
a. Both a drop-off system and a composting and brush and woody waste processing area is designated at each landfill.
b. The drop-off area is close to the entry and within site of the scale operator. c. Wood dropped at the drop-off area is cut into smaller pieces and processed for sale as
firewood by Empowerment /IPELEGENG entrepreneurs/workers. They can keep the revenues but have to report them.
d. Vehicles dropping off yard waste pass the scale two times, and get a high portion of the tipping fee refunded.
e. The processing area is close to the working face but separated from it. f. In the processing area, different types of compostable or woody waste are piled
separately. g. The largest area is for windrow composting, a nearly flat area. h. A mobile brush grinder is purchased and travels between Botswana landfills. It grinds all
brush and leaves a pile of grindings for bulking agent for the composting. i. Each council opens a tender for a local farmer or entrepreneur with tractor to operate
the composting facility, which means turning the compost once per week. j. The compost is monitored and tested so that the quality is uniform. k. The compost operators go to a training once or twice per year, together with the landfill
managers and their staff. l. The DWMPC regularly monitors the improvements made at each landfill in Botswana in
the management of compostables.
6.6 Topic: Landfill bans as a policy tool
Over the longer term, as council experience with valorisation and the involvement of the value chains grows and stabilises, the DWMPC can think about introducing landfill bans for certain materials, together with enforcement. There are two kinds of landfill bans:
1. Bans on anything that can be valorised entering the landfill, that is, in effect a requirement to valorise or recycle all materials for which there is a market or even a non-paying “beneficial use.” These kinds of bans stimulate more investment in recycling, and helped the Netherlands achieve its current rate of 83% diversion from disposal and only 8% landfilling.
40 The Botswana Recycling Guidelines 2012 Advice on Valorisation for Middle-Income Countries
2. Bans on materials that trouble the process of landfilling or create environmental hazards. These kinds of bans protect the integrity of the landfill, but banning them does have some risks.

The Botswana Recycling Guidelines 2012 Advice on Valorisation for Middle-Income Countries
41
7 Guideline 7: Little Planning Manual for Recycling4
7.1 Introduction
This document is designed to do two things at the same time:
1. To give an overview of a planning process 2. To offer a sample outline of the planning document, or "plan", which results from such
a planning process
Therefore the table of contents of this document is also a kind of parallel to the table of contents of a solid waste plan, or in the larger sense, any environmental management plan.
7.2 Section 1: Background
Background This is a “catch-all” section that explains to the reader why there is a plan now, what influences have resulted in a planning initiative, and what the goals of the exercise are. It refers to preceding initiatives, documents, and plans, and it also gives basic parameters about the neighbourhood, city, region, or country for which the plan is being developed.
Definition of Terms There are a number of terms which are used here in their general usage, including "plan", "process", and the like. Some special terms are:
Stakeholders: a term referring to the variety of individuals, businesses, organisations, officials, governmental bodies, community groups, and the like, which have some interest in the outcome of the process: that is, those having a stake.
Abutters: households or businesses located adjacent to the current or proposed site of a facility, such as a landfill or incinerator.
Constituency: the community of the "represented": that is, those whom a public official is elected or appointed to serve; the membership of an NGO, the residents of a community; the members of a union; the employees who work under a manager.
Resources: in the narrow sense, natural and synthetic materials which are used in a process. In the wider sense: advantages and potential contributions to an outcome, both tangible and intangible.
Recyclables: materials or items in the waste stream which have some residual economic value, or value added, and which, therefore, can be sold into the industrial marketplace.
Market: for recyclables or compost: the combination of industrial, agricultural, and household economic demand for recycled materials or compost. A market may also be a use which has value but cannot be quantified.
Value added: a term from economics referring to the accumulated addition in value that occurs when a raw material such as ore from a mine is (1) extracted, (2) refined; (3) smelted and prepared for moulding; (4) moulded; (5) inserted as a component of a manufactured product; (6) sold as a part of that product. Each of these steps (or parallel ones in other industrial processes) adds value, and if the item can be redirected to use without destroying its effect, the value added is conserved.
Activist: an individual or group from within the constituency, or in certain cases from outside, who has taken an interest in the outcome of the process; who has substantive opinions and preferences about the outcome; and who chooses to participate in order to steer the outcome in the direction of his, her, or their preferences.
4 This document was developed in 2000 as part of a course in Environmental Management given by the author at the American University in Bulgaria. It is an open copyright resource but the author must always be acknowledged.

42 The Botswana Recycling Guidelines 2012 Advice on Valorisation for Middle-Income Countries
7.3 Section 2: Baseline Analysis
This is the first part of a planning process, and consists of a broad exploration, characterization, analysis and documentation of the existing situation in the area or institution for which a plan is being prepared.
Planning Team The baseline analysis usually works best as a close collaboration between three sub-parts of the planning team:
1. a relatively high-level representative of the "client", usually a municipality, institution, or business, who knows the overall strategy and can mobilize others to provide information;
2. two members of the consulting or technical assistance team, who will do most of the field work on their own. Ideally, this is one "outside" consultant with a lot of experience in the substantive and technical areas of the topic, and one local consultant who knows many of the stakeholders; who speaks the local language; who is recognized as being from the locality; etc. In the case where interpretation is needed, there should be a third person to interpret in official instances, and the local consultant can serve as an informal interpreter in field interviews.
3. for institutions and businesses visited in the course of the field work, the "host" for each one should be the highest or second-highest executive officer, the one who is directly responsible for operations, accompanied by the floor manager, supervisor, or foreman (forewoman).
4. for discussions with community groups or activists: a recognized leader, together with a lower-profile participant who will be the liaison for further contact with the groups.
Status Quo, or State of the Art This is the first and in some cases the most neglected part of the planning process. The goal is to describe, in full and rich detail, the existing situation which is the base from which the plan will start. The difficulty with the status quo is that many of the stakeholders will attempt to present the situation as they wish it were, or will be embarrassed about aspects of it, and it is difficult to disentangle the judgments from the information.
One of the most important tools for a planner is the ability to separate information from judgments. Most people who participate in the planning process will have strong ideas about the subjects, and will want to give their opinions, critiques, wishes and judgments, along with the information. BOTH of these parts, the information and the judgments, are essential to the baseline analysis, but they need to be kept separate and written up separately.
Formal Elements of the Status Quo The basic elements of the status quo are:
1. the legislative and policy context: what is the legal and policy framework pertaining to solid waste management and valorisation;
2. an institutional and organisational analysis: what institutions and organisations are directly involved, who are the stakeholders; what is their relationship to each other and the subject matter;
3. a social and cultural analysis: what are the deeply held ideas and beliefs about the topic: what are people's ideas about "dirty" or "clean", what is the attitude towards public spaces; who is "allowed" to work on these issues, who is "forbidden' is the topic considered one which is for men or for women; etc.
4. an economic and financial analysis: what do things cost exactly as they are done now; who pays; how are the costs and benefits shared; what are the financial tensions and problems; what monies are available or can be mobilized; etc. One of the outputs of this is average cost of disposal per tonne, or per unit of volume: this is an important figure and seldom calculated correctly. It means that all of the costs from collection, to fee administration, to amortization, to debt service, enforcement and policing, environmental permits, etc. are combined together, and spread over the total number of

The Botswana Recycling Guidelines 2012 Advice on Valorisation for Middle-Income Countries
43
tonnes or cubic meters in the system. This is a very useful number to have when trying to decide whether it is financially (as opposed to socially or environmentally) worthwhile to subsidize composting or recycling, since this average cost would be, in those cases, avoided.
5. an environmental analysis: how does the current situation affect the environment, negatively or positively; what are the points of intersection between system and environment; where are the points of leverage; what are the potential sources of improved environmental performance.
6. a performance analysis: what is the physical system itself? How does it function on a daily basis. What happens reliably; where are the leaks; where are things consistently going right or wrong. Also, what are the physical components of the system: equipment, supplies, people, land, etc.
Interactions between the aspects There will be interactions between these aspects, and so keeping them separate may not always be completely possible, but it is important to bear in mind that the six aspects all need to be analyzed for the plan to be complete.
Data on the Status Quo Baseline data is facts: how many tonnes of waste; how many hectares of land; population; economic status; which party is in power and what their priorities are in the relevant areas; history; other plans that intersect with the current planning process; factors that are likely to affect the outcomes; who the stakeholders are.
Points of View about the Status Quo Baseline points of view are opinions, wishes, judgments, critiques -- which are treated as data, but data about the stakeholders, not about the system itself. For example: 'members of the chamber of commerce, while they are satisfied with the level of waste collection service, miss no opportunity to complain about the billing system'. Or observations that imply opinions: 'the residents in general greet the garbage truck workers in person when they bring their waste to the curb; exchange a few words, and in general appear to have a pleasant and cooperative relationship with the waste collection service.'
Stakeholders The second part of the Baseline, after a description of the status quo, is a description and preliminary analysis of the stakeholders. The most effective way of identifying key stakeholders is through classical "snowball research": asking each interviewee who else should be contacted; cross-checking lists of organisations with different officials or lists of attendance at meetings, etc.
Ideally, each stakeholder or representative of a group of stakeholders, should be interviewed and should have the opportunity to present the following:
Their version of the status quo, both organisational and personal
1. their opinions and judgments about the status quo 2. their organisation's or institution's vision of the future and preferences for outcomes of
the planning process 3. their personal vision of the future and preferences for outcomes 4. the part they want to play in the process 5. the resources and assistance they offer to the process 6. their fears and hopes about the outcomes 7. other people or organisations who should be contacted or visited
The interview should not necessarily proceed in this order, but these listed points should be used as a checklist.

44 The Botswana Recycling Guidelines 2012 Advice on Valorisation for Middle-Income Countries
Resources The third part of the baseline is a resource analysis: what resources can be drawn upon in the implementation process that will result from the plan. The term resources is first of all physical, to inventory the available:
Vehicles, Buildings, Land or land access rights, Human resources.
Secondly, this inventory considers resources which are less tangible and more conceptual:
what resources can be found in policy guidelines, priorities, or a political or crisis narrative that raises the public perception of waste management;
what are the resources in the political situation, for example, a newly elected mayor with strong opinions about cleaning up the city, a former NGO or waste management company staff-person just elected to City Council;
what are the pressures that are exerted from (or could be exerted based on) legislative or policy initiatives;
what kinds of financial resources are available; what kinds of resources in the system are not being mobilised where is there latent demand for services or products, such as compost or second-hand
furniture where does the money flow in the system; etc.
SWOT Analysis, Barrier Analysis, Gap Analysis Depending on the planning task; it may be useful to close the baseline with three analyses. First is a SWOT Analysis, which simply means using the following four criteria as a lens to understand what is happening:
Strengths Weaknesses Opportunities Threats
It is important to note that in this analysis, Strengths and Weaknesses focus on the existing and internal factors relating to operations of the solid waste management system, while Opportunities and Threats are future conditions or external factors affecting the system. After the SWOT analysis is made, you can go a step further by doing a barrier analysis. This begins with formulating or referring back to the goal the objectives for the planning process, and then analysing the context.
Looking at the weaknesses and threats, what barriers are there to achieving goals and objectives?
How can you solve problems to move the process beyond the barriers? What resources do you need to do that?
Finally, you can look at what is missing in the picture, and this is a gap analysis.
Looking at weaknesses, barriers, and threats, what appears to be missing from the picture that is needed. For example, it could be political will, available land, human resource capacity, a private sector involvement capacity, or, as in the Botswana inception report, good channels of communication between public and private sector.
What other gaps are related to this primary gap? How can the planning process come up with proposals to fill the gap?
The Botswana Recycling Guidelines 2012 Advice on Valorisation for Middle-Income Countries
45
7.4 Section 3: Planning parameters and criteria for decision-making
This third chapter is short in pages, but it may take several months to produce, since its output is the result of the first major consultative activity in the planning process. The goal of this activity is to get agreement among the major stakeholders as to what the results should accomplish and look like. Note that these planning parameters and criteria are abstract, and general, rather than practical and specific.
what laws have to be complied with; what are the common goals; what will a solution accomplish; what is the planning horizon (five, ten, 20 or 50 years); who will pay the costs and who will get the benefits; what kind of process is acceptable for rule-making and fee-setting; what kind of access will the stakeholders have after the plan is complete; what indicators will be used to see if the system that results from the plan is functioning
properly; how will the results be monitored; how often will the plan be updated; what is the process for changing it; and the like.
The results of this process are a set of planning parameters and criteria, with indicators and monitoring protocol, against which the plan can be evaluated and accepted. Strategically, the purpose of this part of the planning process is to invite and contain conflict: that is, to transform old enmities and hardened positions into a constructive dialogue about goals and objectives, while making sure that all parties feel heard, included, and listened to, without haggling about
details. The more carefully this part of the process is performed, the more likely that there
will ultimately be some kind of consensus outcome which all stakeholders, even if they
don't love it, will still be able to accept and support. In this sense, there is no such thing as too much investment in this part of the planning process., since it will immensely strengthen the decision-making process at the end.
7.5 Section 4: Technology assessment, performance options and construction of
scenarios
This part of the plan is the most easy for most managers and consultants to understand, in fact, many plans consist of only this part, but if that is the case, they are unlikely to be successfully implemented. There are also three parts to this chapter: (1) identifying the relevant technologies or technical options; (2) analyzing various performance options and service levels; and (3) constructing workable scenarios.
In this chapter, the outside consultants, one of whose functions is to bring new technical information into the process, take the lead. This section is not, ideally, a full-blown technology assessment, which is exhaustive and presents all the technical data that is usually known. Rather, it is an applied technical analysis, in which the consultants are serving as a filter to make sure that the technical options presented fit the local circumstances. As an absurd example: one would not present technical options for water-intensive systems in a desert location, nor discuss technologies which depend on freezing temperatures in winter in the tropics.
Technology Assessment This works best as an illustrated section that divides the technologies into categories, shows the range of options in each category; provides criteria for decision making, and identifies several technologies which could reasonably be part of a plan.
For example, in medical waste management, there are small and large incinerators with or without energy generation; land disposal in combination with chemical and thermal disinfection technologies (acid disinfection, bleach disinfection, autoclaving); disposal without disinfection;

46 The Botswana Recycling Guidelines 2012 Advice on Valorisation for Middle-Income Countries
export; source separation and recycling combined with disinfection and land disposal, and the like.
Each of these is briefly described, and technical parameters are given. Illustrations are extremely helpful -- almost essential, in fact -- and as part of the technology assessment, it is extremely useful, if the budget will permit it, to take a representative group of stakeholders on some field visits. If relevant, a list of technology providers ranked as to their cost and reliability can be a useful appendix to this section.
Along with the technologies, indicative costs should be presented for each technology, but these numbers should be presented with extreme care, since they will usually not apply to the local circumstances very precisely. They are most useful as a relative indicator of the cost of each technical approach. For this, some unit or units should be used for all technologies. In solid waste, there are several candidates:
1. activity-based cost per tonne (for disposal or processing) 2. activity-based cost per household (for collection, processing, and disposal) 3. activity-focused capital cost per design capacity tonne within specific economies of scale
(for incineration), meaning, if a facility is designed for 200 tonnes per day, there is a cost per design tonne times 200, and if the facility is for 400 tonnes per day, that same cost per design tonne is multiplied by 400. There is usually BOTH a lower and upper limit on this parameter, so, for example, there are systems which are consistent from 100 to 1000 tonnes per day, but below or above this the economies of scale do not function.
4. cost per truck per route-day (for collection), meaning, the cost to run a truck for a full working day with the driver and labourers. This needs to take into account the expected live of the vehicle, whether trucks run five or six days per week (or in some cases seven), etc.
Assessment of Performance Options and Service Levels This analysis is parallel to the technology assessment but focuses on the non-hardware aspects of performance. Such things as frequency of collection for waste, types of storage containers, relation between primary and secondary collection; fee structures; regulatory approaches; incentives and sanctions; and the like are part of this section. The outside consultants have an important role here too, in bringing in relevant information from other locations and giving reference contacts and data. It is useful for discussion purposes to give the different organisational options helpful names, like "customer pays all"; "shared responsibility", "polluter pays"; to help discussants keep the complexities from becoming too confusing.
Construction of Scenarios Next comes the construction of scenarios. That is, if we are talking about a solid waste plan, the consultants, working with the client and the stakeholders, construct between two and five alternate scenarios for achieving the goals of the process and satisfying the criteria set out in section 3.
Stakeholder and client Preferences The first stage of constructing scenarios is to present the results of the technology and performance options to the client -- municipality, board of directors, and the like -- and to see what their preferences are. This can usually be done in a formal meeting, with a slide or other visual presentation, followed by a discussion. If the discussion is lively, it is useful to divide up into topic groups and let each one come with its own recommendation. The output of this process is a short list of technologies and organisational principles.
Formulation of Preliminary Scenarios The consultants, usually working with their client liaison, then use the short list to construct scenarios, which combine technologies in such a say that all the criteria and planning parameters are satisfied. This is usually a maximum of five scenarios, and a minimum of two. It is good to use this process to sharpen differences, so that people who are not in agreement know which scenario is "theirs".
The Botswana Recycling Guidelines 2012 Advice on Valorisation for Middle-Income Countries
47
At this level, there is also a necessity for some cost modelling, using applied generic cost information, to give comparative costs of the different scenarios.
Client Check-In After the scenarios are formulated, and before they are presented to the stakeholders, they should be presented to the client as a check that they represent correctly the client's understandings of the acceptable range of options.
7.6 Section 5: Plan Formulation
In this chapter, the process results in an increasingly narrow set of choices, so that at the end, there is a framework for a plan, combining technical and organisational system elements.
Presentation of Scenarios to Stakeholders Once the scenarios have been formulated and a preliminary cost comparison has been performed, there should be a large, visual, highly explanatory presentation to as broad a platform of stakeholders as possible. The goal here is absolutely that everyone understand exactly what is being offered, and to this end a long period of time should be allocated, especially for questions. After the presentation, stakeholders can form small discussion groups and analyze the various scenarios.
The goal here is to eliminate scenarios, so that at the end, one or two remain that will be the focus of a much more detailed analysis. There are several possible intermediate outcomes to this process:
1. The stakeholders can have clear preferences. These can be shared, or they can be conflicting, or some combination of these. In this case the preferred scenarios are "carried forward" and the others are dropped from consideration.
2. The stakeholders can have different ideas. That is, they might dislike ALL of the scenarios, or feel that something important has been left out. In this case at least one of the scenarios has to be modified to include the missing element, BUT the stakeholders have to agree to drop one or more of the existing scenarios from consideration.
3. The stakeholders can show a preference for a "hybrid" scenario which is not yet formulated, but which combines elements of one or more scenarios presented. In this case, the new hybrid needs to be formulated, and at least one and preferably all of its "parents" dropped from consideration.
Recovery Projections These are a set of spread sheets in which you model the current waste stream and composition, and the impact that the policies and new technologies can be expected to have. The plan document usually includes a set of summary tables in the text, with the full excel workbooks provided on CD-Rom or DVD.
Comparing Scenarios with the Agreed-Upon Criteria After the narrowing-down process, the planning team will be left with, ideally, not more than two scenarios. The next step is to let the stakeholders analyze these as to their compliance with the criteria established in Chapter 3.
The goal here, as opposed to above, is NOT to eliminate the scenarios, but to refine them so that they meet the criteria in a significant way. The result of this can be one or two scenarios which most (ideally all) stakeholders and the client agree meet the criteria, and would be acceptable as a result of the planning process.
Cost Modelling and Sensitivity Analysis At this point, the planning team and the client liaison, together with the CFO, chief accountant, comptroller, or other financial representative, have to work closely together to develop realistic cost models for both or the only remaining scenario. The client is the one that knows what its own wage structure is, how it chooses to calculate debt service and amortization, and the like. The consultants bring to this process two important elements: the knowledge and framework for modelling; and the costs of the new system elements which are envisaged. In some instances, it
48 The Botswana Recycling Guidelines 2012 Advice on Valorisation for Middle-Income Countries
will only be possible to identify costs within a range, and some kinds of sensitivity analysis will be necessary to see how sensitive the entire system is to specific factors, in order to determine whether it is worth while to try to "pin them down" more precisely.
The output of the cost modelling and sensitivity analysis is an estimate -- not a promise -- of what the capital and operating costs of the system will be, together with an identification of additional information needed; factors which are especially sensitive and should be managed carefully, and the like.
Final Elimination At this point, if there are two scenarios, the consultants provide professional input into a decision, with the client's management and key stakeholders, and one of the scenarios is eliminated. At this point it may be that some of the features or aspects of the eliminated scenario are added to the remaining choice, in order to satisfy the greatest number of actors.
System Presentation At this point, there is another round of presentations. First, the client has to agree that the results of the cost modelling are acceptable, and to accept the system as a blueprint for future developments. The client may place certain conditions or refine the scenario somewhat.
A second presentation is made to the stakeholders, who by this time should be thoroughly familiar with the topic. If the process has been managed correctly, many of them will actually be too bored to show up, which is an indicator that they trust the process and will accept the outcome. Like the client meeting, the stakeholder presentation should be expected to deliver some additional refinements, some small adjustments to make the outcome more equitable, and the like. These should be incorporated into the final design to the greatest extent possible.
Political or Management Acceptance At this point, it is useful to ask the political decision-making body (for municipal governments) or the managing directors (for a corporation) or other decision-makers (the relevant ministry, in the case of state-owned entities, and the like) to make a formal endorsement of the selected system, and to direct the planning team to prepare a preliminary plan of action, schedule, and budget, and where relevant, requests for outside financing, to prepare the way for implementation.
Part of the reason for this is that preparation of these parts of the plan, particularly the budget and financing applications, is expensive, and if there is no official acceptance at this point, it is not worth spending the additional money to prepare them. If the planning process budget is not sufficient to cover these activities, the political or management acceptance process also needs to include allocation of the additional resources needed.
7.7 Section 6: The Formal Plan Document
This chapter converts the scenario into a formal plan, by translating the ideas into concrete actions and results. The formal plan has the following parts:
Description of the Future System This section describes the future system, and it is organized in the same way as the formal elements of the status quo, described in section 2,
1. A logistical and technical plan: what is the physical system itself? How will it function on a daily basis: which division will operate it; what equipment needs to be mobilized, repaired, purchased, renovated; what are the routes or service units; who will operate it; how will the parts fit together; how will supplies be reliably made available; what will happen to materials that are collected or stored; what could go wrong; what are the contingency plans; what are the indicators for successful operations and what happens if the system does not function properly; what are the differences between winter and summer operation; etc.
2. The enabling environment with a governance, legislative and policy plan: what principles govern the plan (for example, the “hierarchy”, the “polluter pays principle,” or principles

The Botswana Recycling Guidelines 2012 Advice on Valorisation for Middle-Income Countries
49
of fairness, sustainability, local economic development. And, following the principles, what are the specific ambition levels in terms of recovery and diversion, laws are to be passed; with what rules, regulations, incentives, fines, etc.
3. The institutional and organisational plan: which institutions and organisations will be in charge; which others will be directly or peripherally involved, what will be the role of each.
4. Recovery projections linked to the logistical and technical plan: what will be the results in terms of materials flow, and amounts diverted, and how are they linked to the technical, financial, and institutional elements.
5. An adapted process flow diagram showing how the process flow and materials balance will look once the plan is implemented
6. A communications, public involvement, and capacity development plan: what will be the involvement of the public, the communities, the stakeholders, the government departments, and the private sector in the implementation; how will they be invited to participate; what their rights and responsibilities will be; and what capacities they will need to develop in order to participate fully.
7. An economic and financial plan and budget: what will be the principles for financing the system; where will the money come from; what will be the relationship between debt and equity financing; what will be the roles of public, private, donor financial institutions; what will be the role of local small and micro-enterprises; what will be the budget; is there a "bare bones" budget and a "normal operations" budget; who will collect the fees and how will they be transferred to the operations budget; etc.
8. An environmental impact and improvement plan: how will the new situation affect the local and regional (and global) environment; what permits and permissions are necessary, what documents have to be filed; who needs to approve what aspects; what are the environmental benefits and costs; what steps will be taken to maximize the positive environmental effects and minimize the negative impacts, and the like.
The Action Plan and Timeline for Implementation This is also critical, and it should include not only a list of activities, actors, and realistic dates, but which persons or institutions are responsible for each step which is listed.
The Budget for Implementation This budget will include capital and operating costs, and a plan for revenue or income generation to produce the necessary monies. The budget will be prepared for a longer period of two- to five years more generally, with a detailed one-year budget for the next fiscal year.
7.8 Section 7: Annexes
The final section of the plan consists of the annexes, which include all background documents and information, especially:
1. A glossary of terms, definitions, and concepts 2. A list of contact persons with phone numbers, email, etc., including name and
coordinates of every member of the planning team, and all of the stakeholder individuals and organisations; regulatory agencies, and the like
3. A reference of important technical or other references, whether these are published or in the "grey literature," and where they can be procured from, if necessary
4. A market study for the materials to be valorised, including addresses and contact information
5. Vendor or equipment supplier addresses and contact information 6. A map or floor plan of the client's premises, municipality, campus, buildings, or a map of
the city showing the location of all of the locations which are implicated by the plan 7. A citation or summary of relevant legislation or policies 8. An appendix showing the assumptions and parameters used in financial modelling 9. A list of the planning parameters and criteria developed by the stakeholders 10. Consultant reports or papers which the plan draws heavily upon (in this case the
Framework Options Paper)
50 The Botswana Recycling Guidelines 2012 Advice on Valorisation for Middle-Income Countries
11. Other relevant intermediate products or documents

The Botswana Recycling Guidelines 2012 Advice on Valorisation for Middle-Income Countries
51
8 Guideline 8: Planning for Valorisation
8.1 Goals
The goals to be achieved with this guideline are to:
1. Understand the meaning of valorisation goals and ambitions, and how to set them 2. Conduct your own small-scale study of household waste composition, household waste
and valorisation habits, and willingness to participate 3. Use results of the household survey to refine national or regional composition and
quantity estimates 4. Know the potential elements of a valorisation programme 5. Produce projections of the tonnages your programmes can divert 6. Establish the Botswana National Valorisation Platform (BNVP)
8.2 What is this Guideline about?
At the heart of valorisation planning is working with numbers that represent estimates of what is in the waste stream. While most engineering firms or donor organisations include composition estimates in solid waste documents, you need to read the fine print to figure out how reliable and recent these numbers are. A traditional engineering composition study can cost up to half a million USD, so most consultants just borrow numbers from a report done in the neighbouring country, an investment plan from the World Bank, a UNDP programme document, or plans produced by regional organisations like SADC.
This would be a reasonable way of estimating the waste composition, except for the fact that the numbers in these reports were borrowed from someone else‟s earlier report. The whole process of desktop studies thus resembles a house of cards, if you can even find the original study, it‟s 10 + years old. Botswana is a bit better off but the recent studies have too few categories to be really useful for valorisation. The 100-household Exercise, described below, is designed as an inexpensive way to improve composition estimates, and it also has beneficial educational effects for the population.
This guideline covers an introduction to very specific activities which are related to planning for and implementing valorisation infrastructure, policies, plans, and activities in Botswana. To do this, the following activities are absolutely necessary:
1. Setting valorisation goals, ambitions and policies 2. Making estimates of waste quantity and composition, including estimating the latent
supply of materials currently being disposed, that could be captured for recycling or organics valorisation
3. Deriving composition and quantity estimates for the baseline year, and using these as the basis for recovery projections
4. Establishing the Botswana National Recycling Platform
8.3 Topic: Recycling and valorisation planning and projections
Countries and cities began in the 1980s to conceive of valorisation, in particular “recycling,” as something that should be organised at national level. Both North American and European countries, regions, and cities began to build landfills, and they needed a way to figure out how much of the materials being disposed could be diverted from disposal through activities in recycling, composting, re-use, repair, and prevention. Prior to that, planners planned for solid waste disposal, through dumping or incineration, for 100% of the waste that they could identify as being generated. This worked because disposal was mostly in uncontrolled dumpsites, which took whatever waste came, and they did not charge for it. No-one knew precisely how much waste there was. The private value chains made their own arrangements with rag pickers or charitable organisations or generators of valuable materials and no-one tracked that – except in wartime when metals were collected via those routes.
52 The Botswana Recycling Guidelines 2012 Advice on Valorisation for Middle-Income Countries
Sanitary landfills introduced a need for planning for tonnages or volumes, but only for 100% of the waste. A clearer understanding of how much waste became necessary when new landfills had to be built, and then engineers needed to know the size. It took a long time to figure out that knowing the size was not enough. Also seasonal variation in amount and composition of waste turned out to matter in the management of sanitary landfills. This need became greater when waste-to-energy incinerators became popular in the 1980s, because incinerators require a continuous feed and cannot shut down, whereas a landfill can receive a lot of waste one day and then none for three weeks, and this does not create a problem. So there was a need to know how much waste at any given time, and this is when detailed, expensive, four-season composition studies started to be used, but the classifications were gross: burnable or non-burnable, dry or wet, organic or not, per cent of moisture. Also in connection with incineration, it became standard practice to plan for the 20-year life of the incinerator, and to project the growth of the waste stream for the so-called 20-year planning horizon. Even in places where no incinerator was planned, this became standard practice.
When municipal recycling was developed in the 1970s and 1980s, there was, first of all, a need to understand its effect on landfilling, which was becoming increasingly expensive. And as growing understanding about resource conservation resulted in successful recycling experiments, the interest in municipal recycling began to grow.
But there was no public recycling infrastructure, and this meant that there were about 15 years of rapid innovation in recycling to invent processing, collection, and MRF technical approaches. In the process it became necessary to know in a much more detailed way how much of the waste is recyclable and how much was organic waste, to be able to size trucks and depots, to calculate the capacity of a MRF to be built, or to be able to determine logistics and transport costs and calculate how much could be earned from going to different markets. And because these investments also depreciate, the interest grew in understanding not only what is in the waste stream now, but how that is likely to change over that same 20-year planning horizon. For this a market study, showing which waste materials are actually recyclable, was necessary.
Once it was clear what could be sold, the next part was figuring out – through interviews, communication, and experiments – what households and businesses would be willing to separate at source, and then modelling or estimating participation, capture, and recovery. A complete valorisation plan does this modelling separately for different materials, and can even be detailed enough to project not only diversion from landfill, but also to project costs and revenues.
A modern recycling or solid waste plan replicates this historical process through composition and quantity analysis, baseline benchmarking of recovery, market studies, and recovery projections. This guideline gives basic information, but it is not realistic to expect that all Botswana councils will be able to do this on their own. Capacity development, training, and probably the services of an experienced recycling or valorisation consultant will make it happen more quickly and more accurately, although it remains estimation, modelling, and a certain amount of guesswork. The rest of this guideline tells as much of the “how” as possible.
8.4 Activity: Setting valorisation goals, targets, and ambitions
Explanation: Botswana has had a Solid Waste Management Act that prioritises recycling and recovery since 1998, and in the same year the Waste Management Strategy adopted the international “hierarchy” and the “polluter pays principle” as the basis for modernising the solid waste management system. The private recycling activities in Botswana are alive and well, but they are not really part of the waste management system or policy. And other than the NGO activities of Somareleng Tikologo and some partially implemented but undocumented recycling pilot projects, neither document has contributed to practical action at Council level, in terms of planning for and implementing valorisation. That is because several pre-conditions for good recycling or valorisation planning and implementation are missing. These include priced disposal (covered in Guideline 6) and making goals and targets for valorisation, covered in Guideline 8, here below.

The Botswana Recycling Guidelines 2012 Advice on Valorisation for Middle-Income Countries
53
Result: A national diversion goal of 50% diversion from disposal has been set and all Councils, laws, documents, strategies and plans have accepted this.
a. The 50% includes current levels of diversion, even though these are undocumented. b. Such a goal means that all solid waste and recycling plans, all business operating permits,
all land use plans, construction contracts, and the like have to show how much waste they will generate and how they will keep 50% from being buried in the landfill.
c. 50% is generally the level that is needed to stimulate a “transition” or turnaround from a disposal-oriented solid waste system to a valorisation-focused materials management system.
d. As experience and success with diversion grows, and markets are developed and stabilised, valorisation goals should be increased.
e. With 50% diversion Botswana‟s landfills would last longer and investment in new landfills would be avoided.
Result: A detailed regional market study has been completed for key recyclables in the industrial value chain, and, brush, wood, compost, blended soil products, and topsoil for mine land reclamation and erosion control in the agricultural value chain.
a. Increased diversion of recyclables over the longer term will almost certainly depend on South African markets and also on export to Asia, so these should be included in the market study.
b. Diversion and valorisation of food, yard, and commercial organic wastes will require a market study for related materials, fertiliser and blended soil markets, and the potential use of Botswana mines in closure and reclamation plans. Mines appear to represent the largest in-country market potential, at least in the short term. Over the longer term, upgrading of dry land through systematic application of compost could also be an interesting potential.
Result: Based on the composition and market studies, priority materials and streams for recovery have been identified, and modelled to show how the goals can be achieved. Metal value chains are already working well and there is probably not too much to be gained here. Seen through the eyes of the consultants, the likely materials to work on, to achieve 50% recycling, appear to include:
a. Garden waste, leaves,/brush/branches, clean wood, because of its high incidence in the waste stream. But the problem with products made with material is not yet recognised, have no clear value chain, and thus a market also needs to be developed.
b. Commercial-industrial food, food processing, juice production, brewery, and slaughterhouse wastes
c. Paper and cardboard d. Polyolefin plastics, including PET, HDPE, LDPE, and PP e. Other packaging materials, including Tetrapaks, glass, cellophane, styrofoam, composite
materials like mylar, distribution packaging (pallets and crates), banding and tape
In addition, there are likely to be substantial opportunities for reduction and recovery of mine and construction wastes.
Nota Bene: These hypotheses about materials from the recycling guidelines project in 2012 need to be verified.
8.5 Activity: The 100 Household Composition Exercise
Result: Volunteers have been recruited in all major Botswana cities and districts.
a. Volunteers have an engagement of 2-3 weeks twice per year, once in dry season and once in wet season, to work with 5-10 households to track their waste materials and explore and understand their waste behaviour.

54 The Botswana Recycling Guidelines 2012 Advice on Valorisation for Middle-Income Countries
b. Students, retired persons, IPELEGENG recruits, or interested others are appropriate volunteers.
c. An NGO may be hired or engaged to manage the exercise – either nationally or one NGO per city.
Result: Training has been done for all the volunteers.
a. Volunteers have attended a training of 1 day. b. The training includes a visit to the supermarket and photographing key product and
package types, for compiling a visual key to waste types. c. The visual key has been produced. d. A master schedule has been made. e. Materials have been printed and templates have been created. f. In each District, a letter from the relevant Councillor has been printed which requests
households to co-operate and appreciates their willingness.
Result: Each volunteer has recruited their own and 5-10 other households to participate in the exercise.
a. The households have received an information packet and a visit from the volunteers. b. The households have created their internal set-up. c. Data has been collected for the first week.
Result: The first week‟s data has been entered and the approach evaluated.
a. Each volunteer has entered the first week‟s data into the spreadsheet. b. The co-ordinator has collected all the data sheets and combined them in the excel data
base. c. The co-ordinator has given feedback to the volunteers on what to change, if anything.
Result: The 100-household exercise has been completed for the first season.
a. Each volunteer has entered the data for all their households into the spreadsheet b. The co-ordinator has collected all the data sheets and combined them in the excel data
base c. The co-ordinator has analysed the data and passed the data base on to the Department
for further analysis d. The second season has been scheduled e. The volunteers have received a certificate and stipend, and signed up to continue f. New volunteers have been recruited.

The Botswana Recycling Guidelines 2012 Advice on Valorisation for Middle-Income Countries
55
Figure 5. Training material for researchers: brochure explaining what type of waste fraction should go in which bag

56 The Botswana Recycling Guidelines 2012 Advice on Valorisation for Middle-Income Countries
8.6 Activity: Benchmarking existing levels of recovery
Benchmarking sounds complicated, but the truth is that it requires a lot of work, and people to do it who are good at calculating and using spread sheets, but is not difficult to do, it just requires determination, patience, and a lot of legwork and triangulation.
Result: Using results of the Recycling Guidelines project in 2012, a master data base in excel has been created to benchmark existing levels recovery, which is organised by recycling companies and years.
a. All buyers of recyclables have been entered, cross-referenced to the materials they buy and trade to the value chain.
b. 14-16 key materials are listed, with attention to grade and type. NB: the classification is by material, NOT by type of source.
c. Department staff have collected annual tonnages from each buyer of recyclables, including the tonnes from landfills and the tonnes from direct purchase.
d. Council weigh-bridge data and export data from the Customs Department has been used to triangulate the data from buyers.
e. A meeting has been held with Councils and the recycling industry to validate the base year actuals, and/or correct the approximations.
f. The total tonnage diverted has been entered as “Base year actuals” in the projections spreadsheets.
8.7 Activity: Projecting total waste and recovery for the planning horizon
Result: The NYS DEC planning and recovery materials, have been studied and adapted to the Botswana situation, with (or without) the help of an experienced recycling consultant.
Result: Composition has been estimated using local studies and regional documents, and refined using the 100-household composition exercise. The DWMPC has access to the GIZ and JICA studies, and their own records.
a. The quantities of total waste have been compiled using Council records and other materials.
b. The list of categories of materials in the waste stream and currently recovered has been compiled and agreed-upon, that is as least as detailed as the benchmarking categories. This means that, if necessary, JICA or other composition categories have to be split or spread across the categories benchmarked.
c. The NYS DEC materials or another projection system have been used as the basis for entering this information in an excel workbook that projects for 10 or 20 years.
d. The key materials for programmatic diversion activities have been identified and flagged in the projections workbook.
e. The programme for getting to diversion has been designed, probably with the help of a consultant.
8.8 Topic: The Botswana National Recycling Platform (BNRP)
The goal of creating a platform is to create a vital and safe institutional space for stakeholders to meet each other and innovate around issues of recycling and waste management. The main activities to form and launch a platform include:
1. Ask the reference group to serve as the basis for a platform. 2. Establish a secretariat and a yearly schedule of meetings in different locations. 3. Hold the first three meetings in different cities.

The Botswana Recycling Guidelines 2012 Advice on Valorisation for Middle-Income Countries
57
Explanation: A platform is a collectivity with permeable borders and a shifting membership, sometimes but not normally registered as an NGO or Association. A platform membership consists of a diverse group of individuals, businesses, organisations, government officials, and institutions with a shared focus but diverging interests and influences on an inter-related set of issues, problems, and activities, such as solid waste planning, recycling, composting, and the disposal of sludge. Platforms connect stakeholders with a shared commitment to provide a “safe social space” for airing of differences and arriving at innovative solutions; and with the intention to maintain permanent open channels of communication between actors who are normally isolated from or actively antagonistic to each other.
A platform consists of a core group of committed organisations and individuals who call and chair meetings and keep minutes, one of whom may be designated as the Secretariat.
A platform usually comes together at regular or irregular intervals to:
Participate in a planning process Maintain contact and dialogue between the members Provide representatives for planning or evaluation teams or meetings Sponsor, promote, organise and attend events, ranging from promotional days to study
tours to training events to working meetings Organise themselves into working groups for specific purposes Mobilise technical expertise to complement or counterweight the expertise offered by the
formal authorities Share information among the members and also with other platforms Prepare or commission key knowledge products, such as handbooks, brochures
The reason that a platform is proposed and included in the guidelines is that the communication channels between stakeholders are not working very well in Botswana, with the result that valorisation is hardly happening. Three examples of the types of communication and relationships that need strengthening:
Different levels of government in different regions don‟t communicate or co-ordinate well with each other (Francistown stakeholder consultation).
Councils don‟t understand how the industrial value chain works, and how to market to it (meetings leading up to the Gaborone stakeholder consultation, and the consultation itself).
Value chain businesses don‟t know how to work with government, or to organise co-operation with government (second day, Gaborone stakeholder consultation, and visits to recycling processors in Gaborone).
8.9 Activity: Creating the Botswana National Recycling Platform (BNRP)
Result: The formation of a programme has started.
a. A session about the platform has been included in the agenda for the final stakeholder meeting of the recycling guidelines project.
b. The Department has announced that the first action in relation to implementation of the chosen framework is to call the platform into being.
c. Stakeholders agree that there needs to be a platform which has a secretariat and a yearly schedule of meetings in different locations.
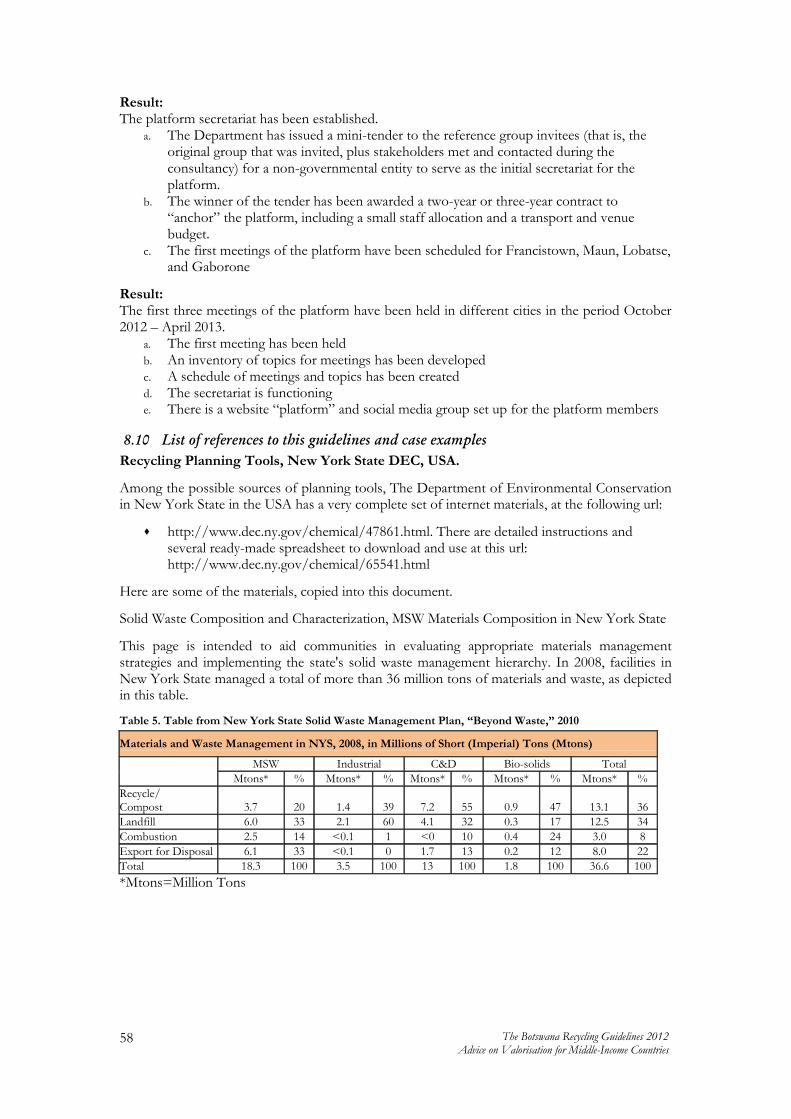
58 The Botswana Recycling Guidelines 2012 Advice on Valorisation for Middle-Income Countries
Result: The platform secretariat has been established.
a. The Department has issued a mini-tender to the reference group invitees (that is, the original group that was invited, plus stakeholders met and contacted during the consultancy) for a non-governmental entity to serve as the initial secretariat for the platform.
b. The winner of the tender has been awarded a two-year or three-year contract to “anchor” the platform, including a small staff allocation and a transport and venue budget.
c. The first meetings of the platform have been scheduled for Francistown, Maun, Lobatse, and Gaborone
Result: The first three meetings of the platform have been held in different cities in the period October 2012 – April 2013.
a. The first meeting has been held b. An inventory of topics for meetings has been developed c. A schedule of meetings and topics has been created d. The secretariat is functioning e. There is a website “platform” and social media group set up for the platform members
8.10 List of references to this guidelines and case examples
Recycling Planning Tools, New York State DEC, USA.
Among the possible sources of planning tools, The Department of Environmental Conservation in New York State in the USA has a very complete set of internet materials, at the following url:
http://www.dec.ny.gov/chemical/47861.html. There are detailed instructions and several ready-made spreadsheet to download and use at this url: http://www.dec.ny.gov/chemical/65541.html
Here are some of the materials, copied into this document.
Solid Waste Composition and Characterization, MSW Materials Composition in New York State
This page is intended to aid communities in evaluating appropriate materials management strategies and implementing the state's solid waste management hierarchy. In 2008, facilities in New York State managed a total of more than 36 million tons of materials and waste, as depicted in this table.
Table 5. Table from New York State Solid Waste Management Plan, “Beyond Waste,” 2010
Materials and Waste Management in NYS, 2008, in Millions of Short (Imperial) Tons (Mtons)
MSW Industrial C&D Bio-solids Total
Mtons* % Mtons* % Mtons* % Mtons* % Mtons* %
Recycle/ Compost 3.7 20 1.4 39 7.2 55 0.9 47 13.1 36
Landfill 6.0 33 2.1 60 4.1 32 0.3 17 12.5 34
Combustion 2.5 14 <0.1 1 <0 10 0.4 24 3.0 8
Export for Disposal 6.1 33 <0.1 0 1.7 13 0.2 12 8.0 22
Total 18.3 100 3.5 100 13 100 1.8 100 36.6 100
*Mtons=Million Tons

The Botswana Recycling Guidelines 2012 Advice on Valorisation for Middle-Income Countries
59
Explanation Because no one study is directly transferable, data from multiple sources were compiled and aggregated to create the DEC composition estimate. After a careful review of dozens of composition analyses, the data from the following sources were used:
Municipalities within New York State: New York City and Onondaga Co. Resource Recovery Agency (OCRRA)
Municipalities in other states: Seattle, WA and San Francisco, CA
Other States: Vermont, Wisconsin, Missouri, Georgia, Oregon, Ohio, Delaware, Pennsylvania, and California
Figure 6. Estimated MSW Generated
The estimated composition of materials generated by the residential and commercial/institutional sector is presented in Figure 6. Estimated MSW Generated. They are:
a. Paper - 33 % b. Glass - 4 % c. Plastics - 14 % d. Metals - 7 % e. Organics - 23 % f. Textiles - 5 % g. Wood - 3 % h. Other - 11 %
MSW composition estimate includes data on tires and scrap metal that are generated as part of the MSW stream. MSW composition estimate does not include:
a. Separately managed C&D debris, b. Several organics streams (bio-solids, septage, agricultural materials, etc.), c. Industrial waste, d. Medical and bio-hazardous materials e. Tires and scrap metal managed outside of the MSW management structures.
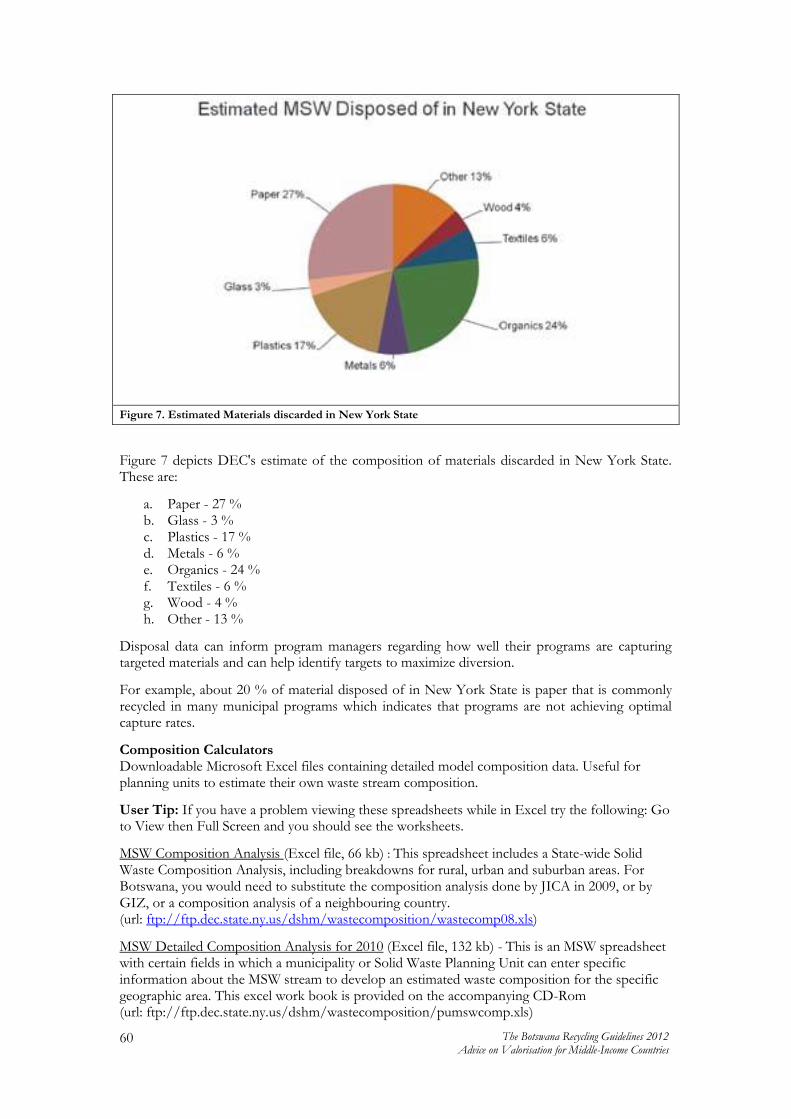
60 The Botswana Recycling Guidelines 2012 Advice on Valorisation for Middle-Income Countries
Figure 7. Estimated Materials discarded in New York State
Figure 7 depicts DEC's estimate of the composition of materials discarded in New York State. These are:
a. Paper - 27 % b. Glass - 3 % c. Plastics - 17 % d. Metals - 6 % e. Organics - 24 % f. Textiles - 6 % g. Wood - 4 % h. Other - 13 %
Disposal data can inform program managers regarding how well their programs are capturing targeted materials and can help identify targets to maximize diversion.
For example, about 20 % of material disposed of in New York State is paper that is commonly recycled in many municipal programs which indicates that programs are not achieving optimal capture rates.
Composition Calculators Downloadable Microsoft Excel files containing detailed model composition data. Useful for planning units to estimate their own waste stream composition.
User Tip: If you have a problem viewing these spreadsheets while in Excel try the following: Go to View then Full Screen and you should see the worksheets.
MSW Composition Analysis (Excel file, 66 kb) : This spreadsheet includes a State-wide Solid Waste Composition Analysis, including breakdowns for rural, urban and suburban areas. For Botswana, you would need to substitute the composition analysis done by JICA in 2009, or by GIZ, or a composition analysis of a neighbouring country. (url: ftp://ftp.dec.state.ny.us/dshm/wastecomposition/wastecomp08.xls)
MSW Detailed Composition Analysis for 2010 (Excel file, 132 kb) - This is an MSW spreadsheet with certain fields in which a municipality or Solid Waste Planning Unit can enter specific information about the MSW stream to develop an estimated waste composition for the specific geographic area. This excel work book is provided on the accompanying CD-Rom (url: ftp://ftp.dec.state.ny.us/dshm/wastecomposition/pumswcomp.xls)

The Botswana Recycling Guidelines 2012 Advice on Valorisation for Middle-Income Countries
61
Construction and Demolition (C&D) Debris Detailed Composition Analysis for 2010 (Excel file, 65 kb) - This is a C&D debris spreadsheet with certain fields in which a municipality or Solid Waste Planning Unit can enter specific information about the C&D debris stream to develop an estimated waste composition for the specific geographic area. This should be useful for Botswana as well, and the entire excel work book is provided on the accompanying CD-Rom. (Url: ftp://ftp.dec.state.ny.us/dshm/wastecomposition/cddebriscomp.xls)
PDF Help:
For help with PDFs on this page, please call +1 518-402-8678. Contact for this Page/ Credit for authorship of these materials: NYSDEC, Division of Materials Management
Bureau of Permitting and Planning 625 Broadway, Albany, NY 12233-7260 USA +1 518-402-8678 This Page Covers
a.
http://www.dec.ny.gov/about/27720.html
WASTE websites: www.wasteportal.net and www.waste.nl The Swabhimana Platform in India, as reported in the UWEP and UWEP Plus case
study reports, the ISWM Case Study of the Costa Rica WEEE project, and the Serbian National Recycling Platform.
Netherlands: the history of the Waste Consultation Council (Afval Overleg Orgaan, the AOO)

62 The Botswana Recycling Guidelines 2012 Advice on Valorisation for Middle-Income Countries
9 Guideline 9. Market study for recyclables and organics
9.1 Goals
The goals to be achieved with this guideline are:
1. To provide councils with guidelines on how to conduct market studies for recyclables and organics
2. To identify markets for recyclables and organics 3. To identify priority materials to be able to draw relevant policy measures 4. To provide reliable data for setting up separation at source programs or the
establishment of buy-back centres, drop off centres and MRFs.
9.2 What is this Guideline about?
Planning and designing recycling activities require a close understanding of the market of recyclables. A market study will give more information about the value of recyclable materials, the demand for the materials and fluctuations over the years. Furthermore it is important to know whether the market will be saturated easily with the large quantity of materials, which will be generated through separation at source programs.
The market study for Botswana showed that the market for recyclables such as certain types of plastics, metal, glass, paper and cardboard is quite robust due to the demand from South Africa and Zimbabwe. Markets for organics however are non-existent and should be developed.
Despite this information from the general market study, it will be of the utmost importance for each Council to analyse and negotiate with the market in their own region/city in detail. Costs are very dependent on the transport distances to the markets, and prices can fluctuate due to variations in global demand.
9.3 Activity: Analysing demand
Explanation: Market research studies will be performed by DUMPE and in some cases Canals to gain insight into the recycling situation in each region. The value chain of plastics, metals, paper and cardboard, glass and textile will be analysed by executing interviews with all actors in the chain: waste pickers at the landfill, scrap dealers, processing facilities and recycling industries. The questionnaire presented in section 0 can be used for this purpose. Some essential questions are:
Who are the buyers of the materials? Where are the buyers located? What is the market price of the product? What is the transport distance and what are the transport costs? What will be the monthly amount to be shipped and sold? What means of transport are needed? In case of international trade: What are the international prices registered over several
years? What are the possible trends?
There is no clear demand for compost, which is not really recognised as a product for the agricultural value chain in Botswana. The more probable demand for animal feed from organic may already be met within households or with informal arrangements. If organic waste is to be valorised, then it is usually necessary to actually develop a market and create a product.
Results: a. A ToR for the market study has been written and funding has been secured. b. The research study has been executed by government personal or externally by a
consultancy firm. c. Reports with detailed data about the markets have been delivered to the districts. d. Districts have selected priority materials in need of market development instruments or
other relevant instruments to increase the amount of recyclables captured from landfill.

The Botswana Recycling Guidelines 2012 Advice on Valorisation for Middle-Income Countries
63
Photo 7. Visit of Total Recycling in Gabarone for an interview
Source: Sophie van den Berg
9.4 Topic: FoB, risk and ceiling prices
International prices are often given in FoB prices. Free on board (freight on board) price means a price which includes goods plus the services of loading those goods onto some vehicle or vessel at a named location, sometimes put in parentheses after the FoB.
Table 6. Plastic bottle prices: £ per tonne in 2012* (source: www.letsrecycle.com)
Jan Feb Mar Apr May Jun
Clear and light blue PET 270 - 330 280 - 330 270 - 330 280 - 340 265 - 320 230 - 290
Coloured PET 60 - 75 60 - 80 60 - 80 60 - 80 50 - 70 40 - 60
HDPE natural 330 - 350 330 - 350 330 - 360 330 - 360 320 - 350 300 - 335
HDPE mixed colour 180 - 220 190 - 225 190 - 225 190 - 225 180 - 215 165 - 200
Mixed 110 - 200 110 - 200 110 - 190 110 - 190 80 - 170 50 - 140
Jul Aug Sep Oct Nov Dec
Clear and light blue PET 220 - 280 220 - 270 220 - 270
Coloured PET 35 - 60 35 - 60 35 - 60
HDPE natural 270 - 300 270 - 300 270 - 300
HDPE mixed colour 155 - 190 155 - 190 155 - 190
Mixed 30 - 120 30 - 130 30 - 130
* £ 1.00 is equivalent of 12.75 BWP (pula)
As the market of metals, paper, glass and plastics are influenced by global market prices, it is important to look into these international (FoB) prices and look into trends and fluctuations over the last years. This information can be found at www.letsrecycle.com and www.recycle.net.
Global trade information about volumes, quality requirements, offers and demands can be found on international market places such as: www.alibaba.com.

64 The Botswana Recycling Guidelines 2012 Advice on Valorisation for Middle-Income Countries
9.5 Topic: Development of markets within Botswana
By bringing large quantities of recyclables onto the market, the risk exists that markets will saturate and prices will go down. On the other hand no market exists in Botswana for certain materials. Without effective development of markets, recycling in its total cannot grow.
Markets for recyclables can be developed for different materials by introducing or improving processing techniques or increase awareness of the benefits of the use of recycled materials or compost. Some examples of possible market development are:
The demand for plastic waste can be increased by facilitating the establishment of plastic processing facilities to add value by sorting, shredding, baling, etc.
The demand for plastic waste can also by increased by strengthening the demand for the use of recycled products, for example the use of tiles and/or bricks with a certain percentage of recycled plastic.
As no glass recycling factory is present in Botswana, markets could be developed by facilitating small glass recycling companies to be set up or processing further in sorting by colour and grinding using small grinders.
9.6 Topic: Negotiating with markets
Fluctuations in market prices can influence the whole valorisation system and ways have to be found to cope with these risks. One way this can be done is negotiating with the processing factories and setting long term contracts with conditions about prices, volumes and other requirements.
9.7 Topic: Floor and ceiling prices
Most contracts with the processing factories set floor and ceiling prices for recyclables that insulate the system from market fluctuations. Depending on the value of what is being recycled, the floor price may be negative (the council pays the market to take recyclables) or positive (the market pays the council). This arrangement protects the council from having to pay large amounts to processors to accept low-value material during bad economic times. Conversely, the use of the ceiling means that in a boom market, the markets can reap the rewards and re-invest them. Both parties are insulated against market volatility.
9.8 South African value chain markets for recyclables
The following table gives an overview of the main recycling companies in South Africa.
Table 7. Recycling companies in South Africa in 2012, source: www.recycling.co.zasource
Steel Cans
Collect-a-Can www.collectacan.co.za Tel +27 11 466 2939 [email protected]
Glass
The Glass Recycling Company Tel. +27 861 2 GLASS (45277) www.theglassrecyclingcompany.co.za
Paper
Paper Recycling Association of South Africa Tel. +27 11 803 5063 www.prasa.co.za
Mondi Recycling www.paperpickup.co.za Jhb/Ekurhuleni/Midrand Tel. +27 11 5388600
Pretoria/Centurion Tel. +27 12 3861381 KZN: Tel. +27 31 2746600 W Cape: Tel. +27 21 931 5106

The Botswana Recycling Guidelines 2012 Advice on Valorisation for Middle-Income Countries
65
Nampak Recycling www.nampak.com Tel. +27 800 018 818 e-mail: [email protected]
Sappi ReFibre www.sappirefibre.com Gauteng: Tel. +27 82 876 7468 W.Cape: Tel. +27 83 227 1379 Mpumalanga & Limpopo Tel. +27 83 234 6217
Plastics
Plastics Federation of SA www.plasticsinfo.co.za Tel. +27 11 314 4021 e-mail:[email protected]
Buyisa-e-Bag www.buyisaebag.co.za Tel. +27 11 452 0414 e-mail: [email protected]
PETCO Tel. +27 860 147 738 www.petco.co.za e-mail: [email protected]
Polystyrene Packaging Council Tel. +27 12 259 0554 www.polystyrenepackaging.co.za e-mail: [email protected]

66 The Botswana Recycling Guidelines 2012 Advice on Valorisation for Middle-Income Countries
9.9 Questionnaire – Recycling guidelines Botswana
Table 8. Questionnaire for enterprises
General
Name of the enterprise:
Type of enterprise:
Location address: Phone number:
City: Email:
Contact person: Position in company:
Established since:
Registered as:
How many workers? … women ..…men
Buying
Which materials do you buy? Which quantities and for which price? Do you register?
Type of material Quantity Price
Who are your suppliers?
Requirements of the materials (minimum amount, grade, cleanliness)
Do you have vehicles or other means of transportation?
Do you want to buy more materials, if available?
Do you have problems in obtaining the materials? Which ones?
Processing
What are the end-products?
Description of process:
Level of technology (manually, semi-mechanized, mechanized):
Equipment: From which country did you buy the equipment:
Investment in equipment:
Installed capacity: Used capacity:
Environmental issues:
Selling
Which materials do you sell? Which quantities and for which price?
Type of material Quantity Price
Who are your buyers?
Requirements of the materials/products (minimum amount, grade, cleanliness):
Do you have sufficient market for your materials?
Regarding framework/guidelines
What is the main problem your business is facing?
Do you have plans to expand your business? In which way?
What would you recommend the government/the municipality?

The Botswana Recycling Guidelines 2012 Advice on Valorisation for Middle-Income Countries
67
10 Guideline 10: Demonstration and Leading Edge Projects
10.1 Goals
The goals to be achieved with this guideline are:
1. To understand how to design a valorisation demonstration project – sometimes refer to a pilot – so that it answers the relevant questions and confirms (or not) your hypotheses
2. To provide success factors for demonstration project success
3. To present ideas for demonstration projects which the project team “harvested” from the inception and review missions.
10.2 What is this Guideline about?
This guideline tells you about the following activities and topics:
Designing pilot and demonstration projects Planning and implementing demonstration projects Post-monitoring and evaluation of demonstration projects Transitioning a demonstration project to “normal” operations.
Explanation: The large number of public documents, the Act, and the Strategy suggest that Botswana “woke up” to the importance of valorisation in 1998, made some policies, and then did very little about implementing them. Little has actually happened to implement those policies and the Act in relation to planning or valorisation, in the nearly 15 years since they were formulated.
Why? The team looks for wisdom in the words of an anonymous philosopher, who said: There are only ever two reasons why something doesn‟t happen, after it is agreed, planned, even desired. These are: (1) Don‟t want to, and (2) Don‟t know how. As far as the Guidelines team could ascertain, the reason in Botswana is “don‟t know how,” and this is a good and honest reason, and it makes sense that you need guidelines. So this guideline is about the “how.”
10.3 Topic: A demonstration project is above all a project
Projects work differently than ordinary operations. When you “projectise” an experiment, you need to prepare in a special way. There are many global project management manuals, trainings, and the like, and please consult them. Some of the most relevant things to know about demonstration projects are:
1. A demonstration project is designed to change the way some part of the system works. You are formulating ideas about how to do things differently, and then testing those ideas in practice.
2. A pilot or demonstration process is based on a hypothesis, and the purpose of the project is to verify or disprove or in some cases nuance or change the hypothesis.
3. The hypothesis is based on someone‟s ideas or ambitions to change the system. Ideas and ambitions come from values, perceptions, and your analysis of reality. This is the “whether” part and it has to be clear before you start. What we mean by this is that a demonstration or pilot project cannot decide for you whether you want to do something, you have to know that beforehand, based on your values, ambitions, and earlier-formulated policies and political desires.
4. A demonstration project is therefore at its core closely related to politics and values: you can call this the “what” part. The hypothesis is also about practical issues, which are more like a “how”. The result of the demonstration project is to verify or disprove the hypothesis.

68 The Botswana Recycling Guidelines 2012 Advice on Valorisation for Middle-Income Countries
The following section shows how that looks for the case of valorisation projects,
10.4 Institutional home and ownership of project and related infrastructure
1. What institution is in charge of the demonstration project? a. Which institution “owns” the pilot or demonstration project? Is that the
Department, the host Council, an NGO, the consultants, a university, or a chicken farm?
b. Who or which institution will end up being the owner of the physical infrastructure that is purchased and distributed?
c. Is that the same institution that would be charged with implementation if the pilot is successful? What happens to that infrastructure after the project finishes?
d. If implementation has a different institutional home than the demonstration project, how is the destination institution involved in the project? Are the staff involved and what is their role?
2. How does the demonstration project relate to normal operations? What is the desired change? Are we talking about one part of the system, or more parts?
a. When will the decision be made about implementation? b. Who will make that decision? c. How will the demonstration project be concluded if it is successful? Will there
be a clear transition and expansion? d. What institution will become the owner of the results? e. How will the transition to the operational institution be made, and when? f. Will it be different if the project fails, than if it succeeds?
3. What materials are we trying to divert, and where are we diverting them to? a. Which materials are the focus and how do they have to be packaged? b. What are markets willing to buy c. What social practices are we proposing to users, and how will they adjust, so that it
will be possible to get materials on a consistent basis? d. What technical changes are we proposing to the system providers
4. How do we get the materials from generators to the markets? a. What is the point of extraction or separation? Is the hypothesis about separation at
source, about the cost, about the technology? b. What physical infrastructure at the household or community level will need to be
put into place? c. What do you have to explain or tell the generators, about the goals, but also about
the instructions, in order to get the materials in the form we want them? d. What technical or physical systems do we need to put into place to move the
materials from the waste system to the value chain? e. What kinds of training do drivers, crews, data collectors, and households need to
understand how to use the proposed system? f. What kinds of feedback do you need to give them?
5. How do we know whether our hypothesis has been verified or not? a. What do we define as success or failure in terms of participation, capture, and
recovery? b. What kind of information do we need to collect before, during, and after the
demonstration project? Who will collect this information, using what tools? c. How does the information need to be analysed?
6. When and how do we move from demonstration mode to implementation? a. What scale is needed to know whether this demonstration project tells us
something about implementing on full-scale? b. What indicators will tell us if we have verified or failed to verify our hypothesis? c. What kinds of feedback from participants do we want, and in what form?

The Botswana Recycling Guidelines 2012 Advice on Valorisation for Middle-Income Countries
69
10.5 Activity: For each demonstration project, formulate a SMART hypothesis,
consistent with the framework decision: “slow road to municipal recycling.”
Result: A hypothesis has been formulated about what you want to test in the demonstration project.
a. Based on the market study, the target materials have been identified. b. Based on interest and feedback, one or more host Councils and/or companies are
identified and recruited. c. The hypothesis has been used to formulate a project outline. d. A ToR (Terms of Reference) has been produced for the project manager (internal or
external) and potentially for consultants. e. A budget for the project has been estimated and the funds have been secured.
Result: A project host institution has been selected.
a. This could be UNDP, the Department, one or more Councils, a private company, a consultant, or a consortium of some or all of these parties.
b. A project manager is recruited in accordance with the ToR. This person can be from the host institution, a university, the Department, or other sources.
c. Especially if it is an internal recruitment, the project manager‟s daily responsibilities have been transferred so that she or he is available to run the demonstration project.
d. The hypothesis is discussed and validated as relevant to the project host institution.
Result: A host community of at least 10,000 households has been selected by negotiation, a competitive tender, or other transparent mechanism.
a. When choosing a host community, the political willingness of the elected and appointed officials is extremely important, actually more important than technical criteria.
b. When choosing an area or neighbourhood, or region, always pick an area where there are 10,000 households. If you can do it for 10,000 you can do it for any number million.
c. Choose an area with clear and communicable boundaries, that are already well-understood. Because pilot or demonstration projects usually involve routes and schedules, you need an area where it is easy to say what happens on Monday and Wednesday, what on Tuesday and Friday, buildings with more than six floors are the exception, etc.
d. When choosing a social dimension for your demonstration project are aim for a mix somewhere in the middle. You don‟t want to pick the most notoriously rich housing estate nor the worst slum. You don‟t want the Okovango Delta in a country where there is mostly very little water. You want an area where almost everyone will believe: “if it works there, it will work everywhere.”
10.6 Activity: Produce a project plan in a participatory way
Result: Roles, responsibilities, and resources of key stakeholders have been negotiated, and the results documented in contracts or memoranda of understanding.
a. Ownership of the demonstration project, physical infrastructure, and results have been discussed, agreed, and set down on paper in a contract or a Memorandum of Understanding (MoU).
b. Key stakeholders such as landfill workers, waste collection companies, producers‟ organisations, waste pickers, and recycling companies have had an opportunity to have input into the demonstration project plan and to create their own relationship to it.
Result: Equipment and supplies are ordered and distributed.
a. This can include pails, special bags, set-out containers. Be clear to the households and businesses!!! Do these things that you have given them belong to them, or to the

70 The Botswana Recycling Guidelines 2012 Advice on Valorisation for Middle-Income Countries
Council, or the department, etc? If they decide not to participate later, do they have to give them back?
b. Other types of supplies include logbooks, data collection forms, protocols, digital cameras, stopwatches, odometer settings, etc. And some simple old-fashioned things like clipboards with pens or pencils hanging on a cord so they don‟t get lost. Or erasers…
c. Route maps are important. But check whether all your drivers, data collectors, etc. can actually read maps. It is surprising how many people cannot, and even many truck drivers learn the route by heart but cannot read a map.
Result: Project participants have received training and/or instructions.
a. Training materials have been prepared. b. Trainings have been conducted. For separate collection, it is useful to use toy trucks,
loaders, mini-crates, etc. to model what will happen, and let the real truck drivers understand how it will differ from what they already do. But also, if you have data collectors following the truck, they may not know what they are seeing unless they have rehearsed it.
c. Schedules, shifts, phone numbers, contact info have been prepared and distributed. d. For really complex projects, a “dress rehearsal” is actually quite useful.
Result: Markets have given purchase orders or contracts for their commitment to purchase materials.
a. For each material, there is a clear understanding of the specifications necessary. b. The recycling industry or farmers or Council staff have committed to process and
market materials according to the purchase orders. c. For each material there are two “back-up markets” in case there are problems with the
main market.
Result: Timing and duration have been determined for the whole project, periods of intensive data collection, and for the communication plan.
a. The planning for the period of the demonstration project has been determined. Usually a demonstration project needs to operate for a full 18 months, for you to know if it will work sustainably. This puts the project cycle into a two-year window, three months planning and preparation, 18 months operations, and the last three months are either a transition to full-scale operations, or the closing of the operations.
b. The start date for the operations and for the educational campaign have been determined and announced. Years have cycles, and there are times when it is psychologically easier to start something. For example, around the starting time of the school year is a very good time to start the operations period of a demonstration project. Be sure that your period of public education does not fall at a time of year where everyone is planting maize or likely to be at their cattle posts.
c. The operations are to some extent phased, based on the scale of the equipment. So that after the first month a new group of households or businesses receives the service.
d. The planning for the intensive monitoring and data collection windows has been determined, and planned to avoid special calendar periods during the year.
e. A request has been made to IPELEGENG offices for short-term workers during the periods of intensive monitoring and data collection.
10.7 Activity: Start up and operate the demonstration project
Result: The start-up goes smoothly in each location and for each phase. Result: The operations are up and running.
a. After one or two weeks, small improvements are made in the operations. b. Intensive monitoring begins in week 2 for each phased start-up.

The Botswana Recycling Guidelines 2012 Advice on Valorisation for Middle-Income Countries
71
c. Data is analysed on a continuous basis. d. Changes are announced two weeks in advance and then immediately implemented. e. The project manager or assistant keeps a log of what has happened.
Result: More and different kinds of materials are valorised.
a. Materials are collected, semi-processed, stored, and marketed. b. There are frequent communications between the project and the markets. c. Problems are signalled early and rapidly corrected.
10.8 Activity:. Evaluate the demonstration project
Result: After three months, there is an evaluation of the way things are going.
a. Are the markets taking and paying for the materials? What problems are there? b. Are the households or businesses separating according to the design? What do they need
to do better? c. What is the participation and capture rate? d. Are the service providers operating well? Is there enough capacity to capture all the
materials that the generators are able to valorise?
Result: The operations are continuously improved.
a. There is continuous innovation and correction of problems. b. The changes and corrections and improvements are captured in the project log. c. New areas that are phased in, are organised with the improved operations.
Result: The demonstration period ends.
a. A decision is made by the host institution, the host community, and the Department whether to stop the pilot or (better) to transition to “normal operations.”
b. Stakeholders are consulted and participate in making the decision. c. The users in the demonstration area are informed of the decision. d. The transition is made, or the project is closed.
Result: A full report of the demonstration project is prepared, including photos, logbooks, data sheets, and excel data bases or workbooks as annexes on a CD-Rom or DVD.
10.9 Case Example: Costa Rica. Waste of Electric and Electronic Equipments in Costa
Rica
An example of the development of an Extended Producer Responsibility System and WEEE pilot project in Escazú (source: WASTE and ACEPESA)
Costa Rica is facing the same challenges that many countries have in relation to the waste produced at the end of life of electronic and electric equipments. In Costa Rica in 2000 a total of 131514 households had a computer. This meant that when they become obsolete 13500 Ton would enter the waste stream. The problem is not only the quantity but the composition since this type of equipments contain lead, cadmium, mercury, aluminium, cobalt, cooper, tin, iron, palladium, silver, platinum, nickel, zinc and many other substances.
Many developed and some developing countries have installed Extended Producer Responsibility (EPR) systems. It is a concept where manufacturers and importers of products should bear a significant degree of responsibility for the environmental impacts of their products throughout the product life-cycle, including upstream impacts inherent in the selection of materials for the products, impacts from manufacturers‟ production process itself, and downstream impacts from the use and disposal of the products.

72 The Botswana Recycling Guidelines 2012 Advice on Valorisation for Middle-Income Countries
Costa Rica wanted to follow the example of the well established system of the Netherlands. The implementation of a Costa Rican EPR system took 7 years. It was divided in two phases. The first one was oriented to design the national strategy for the minimisation and management of Waste of Electric and Electronic Equipments (WEEE) and the second one was to implement the strategy. During the gaps between phases, the platform kept
During Phase 1 the following activities took place:
Situation of WEEE management, including literature review, household survey, interview with important stakeholders and site observations
Creation of the National Technical Committee, a stakeholder platform including key representatives of industry
Design of the Costa Rican strategy Evaluation of WEEE management in the Netherland including visit to the most important
stakeholders
The second phase consisted of the following activities:
Development of legislation “Decree” for electric and electronic waste management Preparation of pilot plan Implementation of several pilot collections, including the one in Escazú Implementation of information and awareness plan Systematisation of the experience to be shared with other southern countries
The pilot collection in Escazú was used to create a number of elements of the system:
a. The method for dissasembly, working with students of the Technical University
b. The method for collection days, working at a school with volunteers
c. A local business that would transport the materials from the collection point to a disassembly point
d. The storage area at a local metal recycling company
e. The market relationship with Basel Convention certified markets for certain Basel Convention regulated components in Canada and Belgium
f. The market relationship with markets in the USA and Central America for non-hazardous recyclables
g. The logistics of storage, packing, and shipping
h. Some unit costs (at the scale of the pilot, it was possible to learn about direct costs but not much about the economies of scale)
Some unexpected things that were learned.
The pilot collection received more than 10 times as much material as was estimated. This was in part because of two factors which were not anticipated. First, although it is generally accepted that 65% of all electronica that has ever been sold is sitting in closets and attics, this was not expected for Costa Rica, a middle-income country. Secondly, the extremely urgent need of banks and businesses for WEEE recycling opportunities was not taken into account.
As a result of both of these factors, the volumes collected greatly exceeded the amounts estimated. In addition, the pilot confirmed the hypothesis that individuals and businesses are willing to pay a modest amount to know that their WEEE is being recycled or safely disposed.
Over the longer term, the pilot contributed to the success of the project which resulted in:
Decree and regulation for the management of electric and electronic equipment in place National Technical Committee organised and institutionalised Definitions of roles and responsibilities of the different stakeholders

The Botswana Recycling Guidelines 2012 Advice on Valorisation for Middle-Income Countries
73
Design of the strategy for the next 10 years. First, the focus will be on what is called the grey line (computers, printers and accessories, copying machines, scanners, digital cameras and telecommunication equipments. Second the so called with line (refrigerators, washing machines, freezers, stoves and clothe dryers). Finally the so called brown line (music installations, radios, digital video machines)

74 The Botswana Recycling Guidelines 2012 Advice on Valorisation for Middle-Income Countries
Chapter 3. Technical and Operational Guidelines
11 Guideline 11: Buy-back and drop off centres
11.1 Goals
The goals to be achieved with this guideline are:
1. To obtain a common understanding of buy-back and drop off centres 2. To establish drop off and buy-back centres in strategic locations 3. To create jobs in waste management
11.2 What is this Guideline about?
Repair, prevention, reuse, recycling and organics valorisation play an important role in the waste management cycle. Councils are the stakeholders best positioned to play an essential role in facilitating and promoting recycling through a wide range of programmes. These programmes can include investing in and establishing facilities, and creating an enabling environment in which the public sector can operate. This guideline is about of setting up buy-back and drop off centres.
Since 2005, Somarelang Tikologo in Botswana has operated a drop off recycling centre where anyone in Gabarone can drop off recyclable materials. Once sorted, the plastics and glass are transported by truck to recycling facilities in South Africa while paper products to Zimbabwe. The costs to transport all recyclable materials in this way are generously donated by Kgalagadi Beverages Trust. The experiences, both positive and negative, should be analysed before establishing new centres.
11.3 Topic: The difference between a drop off centre and a buy-back centre
A drop off centre, also called a depot, is a site were community members can go to deliver their recyclables. They do not receive payment but they also don‟t pay for the service. The site may have different containers for the different materials, or a centre with people working where the materials are cleaned, sorted and processed to be transported to the recycling industry. As this activity deals with voluntary return this requires more from the participants. Volumes are lower than from curbside collection, but costs are also more moderate..
Buy-back centres are generally thought to be more viable in low income areas, where participating community members are paid in cash for collecting and bringing in recyclables. The payment can be cash, bus tickets, coupons or the like.
In South Africa buy-back centres are in operation in many of the township areas in South Africa. The buy-back centres purchase separated waste from communities where there is either inadequate waste collection or where conventional household separation at source will not work, and resell this waste to recyclers. Thus, they perform some of the functions of a MRF. An informal study of these centres concluded the following:
Buyback centres are an effective instrument for the collection of recyclables in the poorer areas in SA. The centres studied were economically sustainable but could do much better with help from the municipalities and the private sector. Municipal support is vital, but the study found it to be either inconsistent or lacking altogether. Community participation is also essential, and communities can benefit from selling to buy-back centres.
The location of the buy-back centre is critical – it must be within walking distance of the community it serves, or in a shopping centre, transit or bus stop or other very convenient location. An appropriate site for this activity needs to be provided by the municipality.
In some countries or cities door-to-door buy-back is a livelihood activity performed by itinerant waste buyers (IWBs). If IWBs are active in your city, it is better to invest in their efficiency and integration with the system as buy-back will not work very reliably.

The Botswana Recycling Guidelines 2012 Advice on Valorisation for Middle-Income Countries
75
Some tips for good practice include the following
Either a good manager or a volunteer “champion” needs to run the centre. It is essential that this selection is transparent and that there is no nepotism.
Buyback centres, like private junk shops, need a large amount of working capital, as they can pay cash but the buyers only pay them 1 – 3 months later.
Training and education are needed – private sector partners have to be found who will mentor the management, guarantee the purchasing of waste collected and support management and training.
Buyback centres should be started with a small investment which will grow once the business is working effectively.
Buyback centres should pay only fro well-separated specified materials. Buyback centres need to add value to the collected waste by separating it further either
cleaning it or removing contaminated material, and baling or palletizing it for transport, or using gaylords or big bags.
11.4 Activity: Setting up a drop off centre or buy-back centre
Explanation: It will be important to establish the most appropriate form of recycling collection for each type of district in Botswana. The three variants to be considered are curbside collection, which works in urban or densely populated areas; some form of drop-off at locations like a supermarket or bus stop where people regularly pass; and buy-back, which is often used to attract children, youth, pensioners, and people living in low-income areas.
Results: a. Negotiations with the recycling industry have taken place.
b. Contracts for a specific period of time with the recycling industry have been established.
c. The location of the centre has been carefully considered and selected.
d. The type of centre has been decided: drop off or buy-back facility. The relative wealth of the community has been considered and based on these insights the type of centre has been selected.
e. A market study has been undertaken to establish the viability and associated costs of the centre.
f. The necessary financing of the centre has been allocated. Additional funding, for instance for equipment and containers, can be sought with the recycling industry.
g. A contractor has been appointed by tender to operate the centre.
h. Types of recyclables and markets have been identified and contracts for a specified period of time with the recycling industry have been established through negotiating.
Photo 8. Sorting centre
Source: CSIR, South Africa

76 The Botswana Recycling Guidelines 2012 Advice on Valorisation for Middle-Income Countries
11.5 Case example South Africa: “The RECYCLE SWOP (swap) SHOP Concept”
The original “Recycle Swop Shop” project is an empowerment initiative created for disadvantaged children. The aim of the program is three-fold:
Help provide basic needs of children To clean up the community Teach environmental awareness, value & trading skills, responsibility & ownership of the
process
The elaboration of the concept is open ended and simply provides a framework. The basic concept is simply: to use recyclable material is a means of exchange for the basic needs to those persons the project targets. The ways in which it can serve the community is limited only to the creativity of those with vision for it.
In essence, the project places a value on recyclable material which effectively removes it from the dead end garbage model. Any material which can be reworked, preventing it from entering a landfill site is good news for every municipality. This is of benefit to every individual, home, community, country and environment of the world at large. The growing number of buy-back centres in South Africa, trying to earn a living through redirecting recyclable material to companies who rework the material for industry are faced with the high cost of collecting. The Recycle Swop Shop fills this gap and empowers, educates and benefits children at the same time.
Assigning a clear, fixed value for recyclables via a point system that can be redeemed for known and desired items turns recycling into a tool of exchange in the hands of children. Experience shows that this gives a sense of self-confidence and empowerment to children who are economically marginalized due to poverty, illness or the social ills of addiction, crime, and irresponsibility.
But the collection of recyclable material cannot and does not equal the value of items made available in the shop by the redeeming of points earned in the program. In no way can the operation be a profitable venture in the normal sense of exchange. It cannot operate without the donation and goodwill of those who are willing to volunteer their time, energy, goodwill, resources and provision. This “giving” is not a handout, so the Recycle Swop Shop is NOT a charity in the common sense of the word. Neither is it in the broad sense, the concept and its operation is an educational tool that enable children to be empowered.
11.6 List of references specific to this guideline
PACSA (2011): Packaging and paper industry waste management plan, August 2011
The recycle swop (swap) shop concept. Available at: http://www.swop-shop.za.net/constant/RSS-how-to-guide.pdf
The Botswana Recycling Guidelines 2012 Advice on Valorisation for Middle-Income Countries
77
12 Guideline 12: Source Separation and Separate Collection
12.1 Goals
The goals to be achieved with this guideline are:
1. To establish a common understanding of source separation and separate collection as socio-technical provisioning systems and how they relate to solid waste removal
2. To guide Councils through the process of designing source separation and separate collection systems
3. To provide basic information on key technical features of set-out and separate collection
12.2 What is this Guideline about?
In order to get materials out of the trash can and into the recycling bin, the generators of waste need to change the way they manage waste at the source. Usually this is treated as “changing the household‟s consciousness” but that is not the primary focus of this guideline. Rather, borrowing from transition theory, we treat the institution of managing waste within a household, business, or farm as a social practice. That means that it is a complex mixture of a physical system, habits and rules (sometimes called the regime), and responses to outside influences, sometimes called the landscape. Introducing source separation is very specific but not well understood. It involves changing the regime in easy to understand ways. The landscape – by which we mean environmental problems, over-consumption, the impact on packaging waste on water supply, and the like – is the context. Most source separation programmes fail because the organisers think that horrifying information about the landscape will motivate households to separate at source. This never works by itself. Households and businesses change their behaviour and participate in source separation when the physical system to manage waste changes, and when the operating instructions for the new system are clear, simple, and respectful of the users‟ ideas about comfort, cleanliness, and convenience.
12.3 Topic: Aiming for 80% participation.
80% participation is the benchmark of successful introduction of source separation. Why 80%? Experience shows that 20% of people are “good guys,” 20% are “creeps” or “bad guys,” and 60% in the middle are “average”. This is important information for conceiving and designing source separation protocols. The 20% good guys are the ones who patronise Somareleng Tikologo‟s centres and are willing to take heroic measures to separate (for example) tetra-paks with aluminium foil liners from tetra-paks without. They see separating recyclables as an activity (maybe even a hobby) and not as a habit. You can ask them to do ridiculous things and they will comply. In relation to recycling, more of the good guys are “good girls,”: waste is a women‟s subject and women are usually the managers of waste in their households and know much more about waste than men. For purposes of source separation, the good guys and girls are the bedrock, no matter what the system is, you can count on their participation. Probably a few of you reading this guideline are good guys or girls. What do you think?
The 20% creeps include most teenagers and generally more men than women. These are people who don‟t want to think about waste at all, and prefer to throw it out the window of the car than to keep it until they find a trash can. No educational campaign will reach them, no matter how clever it is, and if you offer them a special recycling container, they are likely to refuse. In terms of participation, the 20% creeps are a zero: you can never expect them to participate, although over time, when teenagers grow up and have families, they may change their status. But in the meantime another 20% has taken their place.
This means that in order to get your 80%, your source separation protocol has to be designed for the 60% average Batswana in the middle. 60%-ers are poor, middle-class, or wealthy, rural or urban, and they just want to live their lives in reasonable comfort, send their children to good schools, have a working car, live in a safe house. Probably many of you reading this guideline are 60%-ers.
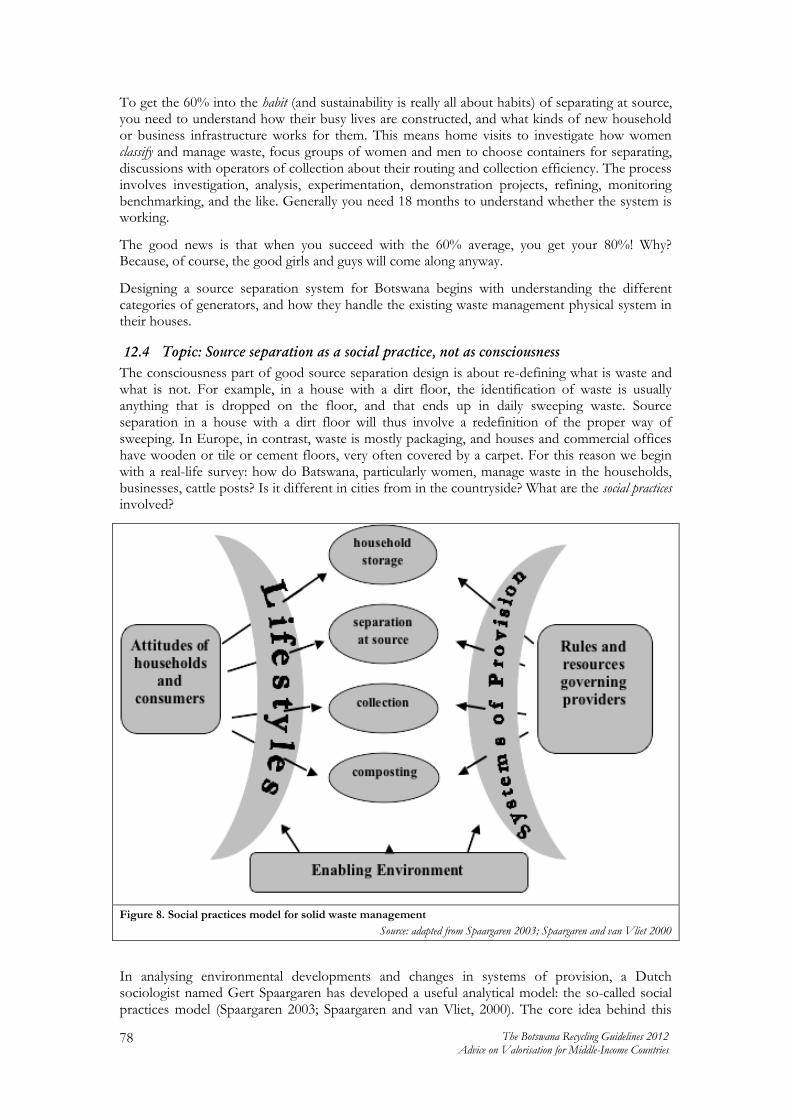
78 The Botswana Recycling Guidelines 2012 Advice on Valorisation for Middle-Income Countries
To get the 60% into the habit (and sustainability is really all about habits) of separating at source, you need to understand how their busy lives are constructed, and what kinds of new household or business infrastructure works for them. This means home visits to investigate how women classify and manage waste, focus groups of women and men to choose containers for separating, discussions with operators of collection about their routing and collection efficiency. The process involves investigation, analysis, experimentation, demonstration projects, refining, monitoring benchmarking, and the like. Generally you need 18 months to understand whether the system is working.
The good news is that when you succeed with the 60% average, you get your 80%! Why? Because, of course, the good girls and guys will come along anyway.
Designing a source separation system for Botswana begins with understanding the different categories of generators, and how they handle the existing waste management physical system in their houses.
12.4 Topic: Source separation as a social practice, not as consciousness
The consciousness part of good source separation design is about re-defining what is waste and what is not. For example, in a house with a dirt floor, the identification of waste is usually anything that is dropped on the floor, and that ends up in daily sweeping waste. Source separation in a house with a dirt floor will thus involve a redefinition of the proper way of sweeping. In Europe, in contrast, waste is mostly packaging, and houses and commercial offices have wooden or tile or cement floors, very often covered by a carpet. For this reason we begin with a real-life survey: how do Batswana, particularly women, manage waste in the households, businesses, cattle posts? Is it different in cities from in the countryside? What are the social practices involved?
Figure 8. Social practices model for solid waste management
Source: adapted from Spaargaren 2003; Spaargaren and van Vliet 2000
In analysing environmental developments and changes in systems of provision, a Dutch sociologist named Gert Spaargaren has developed a useful analytical model: the so-called social practices model (Spaargaren 2003; Spaargaren and van Vliet, 2000). The core idea behind this

The Botswana Recycling Guidelines 2012 Advice on Valorisation for Middle-Income Countries
79
model is that changes in social practices – and in this case waste management practices, as shown in Figure 8, can best be understood by analysing both the institutional system characteristics and the behaviour of actors. Social practices around solid waste – like other social practices – belong neither exclusively to the social structure and its provisioning system, nor solely to the social actors and their customs, perceptions and behavioural routines. Social practices should be placed – and thus understood – at the intersection between household (and commercial) users, and public and private-sector providers. Hence, to understand the logic of solid waste management, and especially to make the kinds of changes in solid waste management practices and routines that source separation requires, we have to put our focus on relations between the systems of provision on the one hand, and the users of the system on the other.
12.5 Topic: Separate collection protocols
Separation programs require a close understanding of the market of recyclables. There is no use in separating and collecting materials, for which there is no demand. A market study will give more information about the value of recyclable materials, fluctuations over the years and the demand for the materials. Buyers have standard for the quality of materials they buy. Prices are very much related to the quantity and cleanliness of the materials offered. For more information about executing a market study, see guideline 9.
It is also very important to know whether the market will be saturated easily with the large quantity of materials which will be generated through separation programs. Prices can collapse with the possible result that the revenues will be less than expected. On the other hand factories must be sure of a reliable supply for their production and will be willing to appreciate a regular source of raw materials and are usually willing to offer reasonable deals to regular suppliers.
Methods of separate collection There are various ways to set up a separate waste collection program of household recyclables or organics. Sometimes a combination of different systems is needed to give the best result. Most likely rural areas in Botswana will need different kind of systems than the larger cities and Gaborone. The main options for collecting waste for recycling are “Separate door-to-door collection,” “depot,” and “buy-back” schemes. Separate door-to-door collection is covered in this guideline, depot and buy-back centres are addressed in guideline 11.
The main forms of separate collection are discussed in the bullets, below:
Door to door selective collection/curbside collection. Participants set out the materials outside the house so they can be collected, usually in a specifically provided set-out container. This system requires separate collection routes and special hours/days for collecting the specific material. Separate collection normally has a different efficiency and frequency than waste collection, because the containers are smaller. A special recycling truck with multiple compartments can collect commingled recyclebles, which means that three or four kinds of materials may be mixed together after they have been separated from mixed waste. The set-out container can be a special blue box, or a rolling cart. In some countries there is a trend to mix all recyclables together in a single stream and put them out in clear plastic bags, so the collection crews are able to check that there is no mixed waste. The mixed recyclables are transported to a depot, transfer station or materials recovery facility (MRF). There the materials are sorted by hand or mechanically. Depending on the type of MRF or depot, some processing may also take place. See Guideline 13 for more information on MRFs
In certain countries in Africa or Asia, a variant of this is the “doorbell” collection. A member of the collection crew actually rings the bell, and someone from the household brings the separated organics or recyclables to the door or gate and hands them to the collector.
IWBs (itinerant waste buyers) represent a particular informal type of separate door-to-door collection. These informal reclaimers go door-to-door and buy recyclables or barter products for them.

80 The Botswana Recycling Guidelines 2012 Advice on Valorisation for Middle-Income Countries
This option is less expensive per tonne than depot or bring systems, because if done well, the tonnes recovered per household are much higher. For this reason, it is very important that participants know the collection schedule and the sorting and storage requirements of the collected materials.
12.6 Activity: Provide clear instructions in the period of start-up
Behaviour change requires a lot of communication in the beginning, but it will not be sustainable unless it can become a habit. So the essence of a good source separation programme is telling people in a clear way what they need to do, when, how, and what will happen to them if they do not do it. Consciousness is not relevant here, do not mix in “explanations” with the instructions in the period leading to the start-up of a recycling or organics separate collection. That will only misdirect the users to thinking too much, rather than doing.
The message has to be repeated over and over again, at least seven times in different media, but the instructions have to remain clear, and the same, for consistency.
Results:
a. The materials to be collected have been benchmarked and identified
b. The quantity of materials per week has been calculated
c. A set-out container or combination of containers has been selected
d. Pictures of the set-out containers have been made, and spread widely in the instructions
e. Each house in the district has received precisely the set-out container (s) that they need, each with its own sticker repeating the instructions
f. The date of the start-up for each district has been determined and publicised
g. There is a hotline and website that people can go to for questions. The website has an FAQ section (frequently asked questions).
h. The collection drivers and crews have had a training, which includes enough information that if they are approached on the route, they can give courteous and correct answers. Also each truck has a supply of pamphlets to give out.
i. The routes have been designed
j. A data collection crew has been recruited and trained to follow trucks or vehicles the first two weeks of the start-up in each district, and data collection materials have been prepared for them
k. The collection start-up has been massively publicised
l. The collection has started up
m. Data has been collected for the monitoring baseline in the first two weeks
n. Based on this, refinements have been introduced
o. The form and method for collecting and monitoring has been stabilised
p. After the first six months, small changes have been made to solve problems and optimise results
q. Recovery performance is recorded monthly

The Botswana Recycling Guidelines 2012 Advice on Valorisation for Middle-Income Countries
81
Photo 9 and Photo 10. Some set-out containers. Left: European style, as used in South Africa at the world football championship. Right: North American style, as used in Canada before introduction of single-stream.
Source: http://90by2030.wordpress.com/tag/waste-management.
12.7 Topic: frequency and collection efficiency
When we discuss collection efficiency and frequency, we mean:
Efficiency: the number of households served per route day or route week Frequency: how often the same household has a pickup
In this guideline, we refer to these in relation to separate collection of organic materials and/or recyclables from households in a door-step collection. Emptying skips or transporting from depots or buy-back centres are related, but we will not include them as collection frequency.
Collection efficiency In most cities, collection efficiency is measured in connections or households served per day by one vehicle. African collection efficiencies for waste collection vary widely, from about 250 households per day for a donkey cart in Bamako to as many as 1200 households per day for highly mechanised collection in cities like Johannesburg.
The efficiency is determined by a combination of the following factors:
Distance between households, that is, density of houses: how close each household or compound is to the next one
Number of people per household Volume, type, and specific density of waste to be collected Condition of the street or road and rules about which kinds of vehicles can use which
roads Size and loading height of the vehicle Number of crew and how fast they work Distance to the discharge point, What is included in the service, that is, is it purely for collection of specific materials, or is
there also a sweeping component; is collection from materials set out on a street or by handing over waste from a household member to the collection crew, and
Type of container or bag, and interactions between the container and the vehicle, and Length of working day and type of employment contract. For example, some contracts
specify that the crews must work eight hours, others that they must complete the route, and still others that they have to take breaks for meals, etc.
Separate collection differs from waste collection, and introducing separate collection also has an important impact on waste collection efficiency. Because separate collection is picking up pre-separated materials, it usually involves picking up only a part of what would have gone as waste. This results in separate collection having a higher efficiency than unsorted waste collection, because
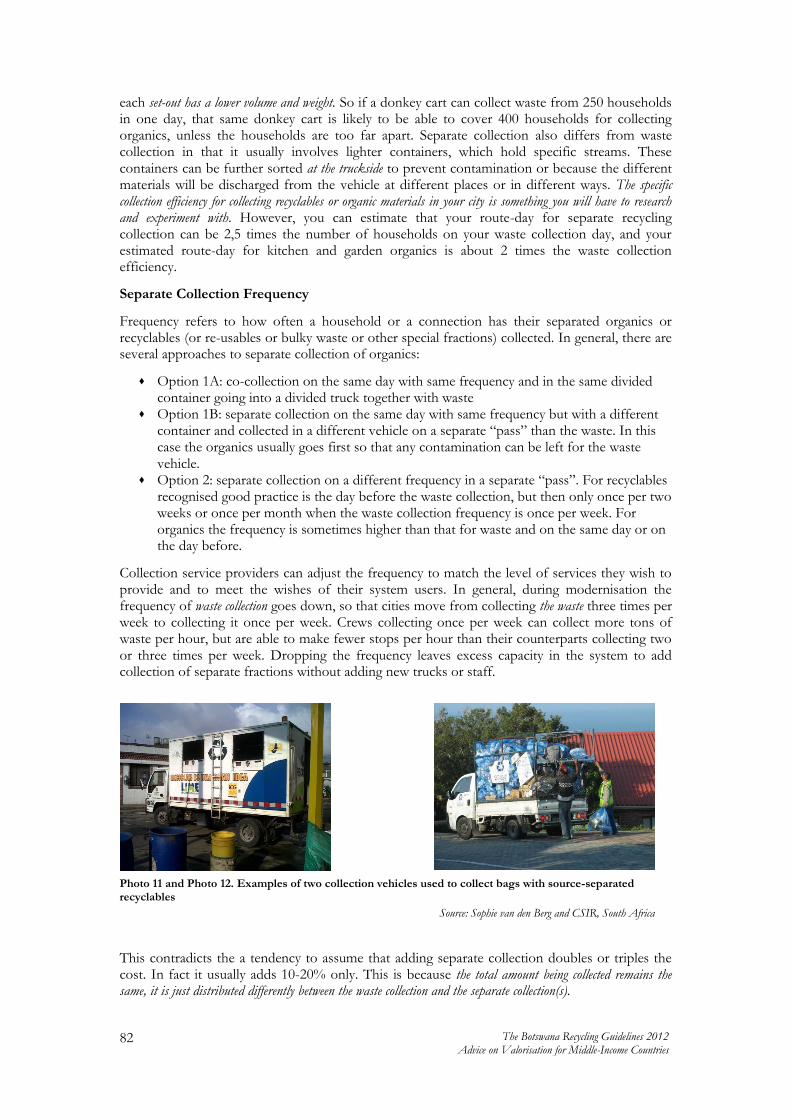
82 The Botswana Recycling Guidelines 2012 Advice on Valorisation for Middle-Income Countries
each set-out has a lower volume and weight. So if a donkey cart can collect waste from 250 households in one day, that same donkey cart is likely to be able to cover 400 households for collecting organics, unless the households are too far apart. Separate collection also differs from waste collection in that it usually involves lighter containers, which hold specific streams. These containers can be further sorted at the truckside to prevent contamination or because the different materials will be discharged from the vehicle at different places or in different ways. The specific collection efficiency for collecting recyclables or organic materials in your city is something you will have to research and experiment with. However, you can estimate that your route-day for separate recycling collection can be 2,5 times the number of households on your waste collection day, and your estimated route-day for kitchen and garden organics is about 2 times the waste collection efficiency.
Separate Collection Frequency
Frequency refers to how often a household or a connection has their separated organics or recyclables (or re-usables or bulky waste or other special fractions) collected. In general, there are several approaches to separate collection of organics:
Option 1A: co-collection on the same day with same frequency and in the same divided container going into a divided truck together with waste
Option 1B: separate collection on the same day with same frequency but with a different container and collected in a different vehicle on a separate “pass” than the waste. In this case the organics usually goes first so that any contamination can be left for the waste vehicle.
Option 2: separate collection on a different frequency in a separate “pass”. For recyclables recognised good practice is the day before the waste collection, but then only once per two weeks or once per month when the waste collection frequency is once per week. For organics the frequency is sometimes higher than that for waste and on the same day or on the day before.
Collection service providers can adjust the frequency to match the level of services they wish to provide and to meet the wishes of their system users. In general, during modernisation the frequency of waste collection goes down, so that cities move from collecting the waste three times per week to collecting it once per week. Crews collecting once per week can collect more tons of waste per hour, but are able to make fewer stops per hour than their counterparts collecting two or three times per week. Dropping the frequency leaves excess capacity in the system to add collection of separate fractions without adding new trucks or staff.
This contradicts the a tendency to assume that adding separate collection doubles or triples the cost. In fact it usually adds 10-20% only. This is because the total amount being collected remains the same, it is just distributed differently between the waste collection and the separate collection(s).
Photo 11 and Photo 12. Examples of two collection vehicles used to collect bags with source-separated recyclables
Source: Sophie van den Berg and CSIR, South Africa

The Botswana Recycling Guidelines 2012 Advice on Valorisation for Middle-Income Countries
83
12.8 Topic: separate collection equipment, trucks and trailers
Separate collection programs can use different equipment, trucks and trailers. Key criteria to be considered selecting the appropriate collection vehicle are:
Weight and capacity Type of set-out container to be loaded Loading height Accessibility of neighbourhoods Vehicle dimensions Flexibility Design features Cost Number of fractions to be collected separately

84 The Botswana Recycling Guidelines 2012 Advice on Valorisation for Middle-Income Countries
13 Guideline 13. The Materials Recovery Facility (MRF)
13.1 Goals
The goals to be achieved with this guideline are:
1. To establish a common understanding of MRFs 2. To provide some guidance to Councils setting up a MRF 3. To provide basic information on key technical features of MRFs
13.2 What is this Guideline about?
This guideline provides background on where MRFs came from, how they are different from private scrap dealers, intermediate processing facilities, and mixed waste sorting facilities, and what they are used for.
13.3 Topic: What is a Materials Recovery Facility (MRF)
A Materials Recovery Facility (MRF) is a publically financed intermediate processing centre (IPC) or scrap processing facility. The concept of an MRF was developed in the 1980s in the USA as a way to advance the goals of higher recycling rates. At that time early experiments in separate collection showed convincingly that the participation rate of households was higher when they only had to separate one or two fractions from their mixed waste, rather than separating every single fraction. But the markets required not only separated, but also graded fractions.
So two US entrepreneurs, Peter Karter in Connecticut and Murray Fox in Massachusetts, both with their roots in the glass industry, began to experiment with using conveyor belts and a combination of hand- and mechanical sorting, to get from a commingled, or mixed recyclable, fraction, to market specifications.
This USA innovation differed from the European experiments at the same time because the input was not mixed waste, but a designed mixed recyclable fraction to which the term “commingled” was assigned. A MRF sorting mixed recyclables is immensely less expensive to operate than a waste sorting facility, and the resulting materials are much more highly marketable than contaminated or wet materials from a compactor.
In North-western Europe, where the emphasis of source separation was on organics, composting facilities developed in a similar way, via an evolution from sorting compostables out of mixed waste, to sorting them out of a wet fraction, to finally focusing on source separated mixed kitchen and garden waste. With organics a key problem with sorting from mixed waste was that the metal levels in the resulting compost were too high to allow for use in growing food, which dramatically limited the marketability of the compost.
The principle for both the North American development of MRFs and the European development of source separated organics is generally the same: you can valorise materials that are separated at source much more completely, and sell them for a higher price, than those which have been separated from mixed waste. This principle is, nota bene, one of the main points to pay attention to in relation to waste picker and informal recycler integration: informal recyclers are some of the world‟s most active advocates for source separation, because they know that it improves the quality and increases the value of the materials.
In the 1980s, MRFs became a standard part of high-performance recycling in North America, usually with a two-stream system of mixed containers and mixed paper. In the period since 2005, certain operators are pushing the North American system towards a single recyclables stream, where all recyclables are mixed together and later sorted. One of the developments that makes this feasible is the progressive reduction of quantities of glass in the recycling stream, as more and more glass is replaced by plastic. In Europe, Dutch-style GFT, or mixed kitchen and garden waste, has also become a kind of standard, and is valorised as compost, which is then safe for land-spreading in food-grade agriculture.

The Botswana Recycling Guidelines 2012 Advice on Valorisation for Middle-Income Countries
85
13.4 Activity: Set up of Materials Recovery Facility
A Materials Recovery Facility (MRF) accepts only source separated materials, either dual or multiple streams or one single commingled fraction. It separates, processes and stores them for later use as raw materials for remanufacturing and reprocessing. MRFs which include composting usually, but not always, accept the organics in a separate sorting line to maintain quality. The main function of the MRF is to maximize the quantity of recyclables processed, while producing materials that will generate the highest possible revenues in the market. The councils can establish a municipal MRF or facilitate a tender for outsourcing the MRF to a private company.
Results: a. The need for a MRF has been identified in the solid waste and/or valorisation plans b. The councils have hired a consultant who has drafted a conceptual design for a MRF,
based on the materials identified as priorities for recovery, the markets, the projections for recovery, and logistical and socio-economic issues
c. The markets and economics of the operation have been evaluated d. Data necessary for the detailed design have been gathered e. A strategic site has been selected f. Contracts have been signed with buyers of the materials g. The equipment is procured, the construction has been established and the processing of
materials in the MRF has started
13.5 Topic: Market specifications
For a MRF to be successful, stable and reliable markets for the targeted recyclables must be identified and established since unsold materials will require temporary storage and may ultimately need to be landfilled. The market of a particular material depends on both the cost of recovering the raw materials and the quality of the recycled materials from the MRF in comparison to the costs and quality associated with extracting virgin raw materials from the natural environment. Without stable and dependable markets, materials should not be targeted for recycling. Once the targeted materials are selected, the market specifications for each of these materials must be identified to determine the properties of the separation operations. Examples of market specifications are shown in Table 9.
Table 9. Examples of Market Specifications
Material Market Specifications
Paper Separated by grade Baled (size and weight specified) Dry Clean or some degree of contamination
Plastic containers Baled, granulated or loose Separated by colour or type or mixed With or without caps
Glass Separated by colour or mixed Size of cullet (specified) Degree of contamination
13.6 Topic: Important considerations when designing a MRF
Text courtesy of Michael H. Simpson and drawn from the listed sources
Any facility design is based upon the specific feedstock and the volume. Ultimately, the market specifications of the value chain buyers set the requirements what must be done at the MRF.
The volume (not weight) is the most important parameter to consider in any design. It determines spatial dimensions and "throughput rate" in any processing line (although some equipment specifications are based on a weight throughput, where volume is calculated through materials density coefficients).
It is not just the volume but the rate of materials and the volume variations. Thus any MRF is designed with the time of year/season that the maximum volume is expected, and often a buffer

86 The Botswana Recycling Guidelines 2012 Advice on Valorisation for Middle-Income Countries
is put in the design capacity to take into account down time for any equipment repair or maintenance. This is less of a concern in a labour rich design, where extra work shifts can be added over the 24 hour period to deal with the high volume times or to catch up when operations have temporarily ceased due to an essential piece of equipment is down.
Equipment comes in two forms: mobile and fixed. The mobile equipment is primarily used to separate and move delivered loads to any separation and/or densification process line. If the MRF is small, and the inputs of recyclables are small and relatively easily to handle this can be done by directing the delivery person/ small vehicle to a very specific drop-off spot. If the loads are large then at a minimum you need a small skid steer or tractor with a front scoop to move material after it is delivered to a tipping/delivery floor.
In both cases, the delivery area ideally should be two levels. The area where the delivery is made and the area (lower level) where input to any processing line begins. Thus, if there are deliveries waiting to come into the space it minimizes waiting time and seperates people/equipment moving materials and preparing them for shipment from those delivering material.
Fixed equipment comes in two primary forms, conveyors and balers. Conveyors are rated on speed of movement, but the volume of waste moving and the number of sorts/grades desired will determine conveyor speed and conveyor length. If the load is very mixed, but you are trying to separate into different types/grades (termed high-grading), you will have pickers trained to identify a very specific type of material: for each type (or couple of types) there is a picker. The more types, the more specialization in pickers. The higher the volume and throughput rate, the more repetition of these designated pickers. This approach, called "positive sort", leaves at the end of the conveyor the unpicked or contaminant stream.
The size/type of the equipment is again driven by volume, through put rate, number of sorts required and excess capacity on the front end for temporary storage.
Densification (increasing density) is primarily to maximize storage space and minimize transport costs. Thus, storage apace needs to be based on the densification ratio of the equipment chosen and the market requirements for the densified materials. For example, water soaked OCC (cardboard) may not be acceptable to a market, so cardboard needs to be stored under cover. Balers are the most commonly used equipment for densification. Horizontal balers traditionally great higher density bales than vertical. If there is a single baler, but multiple types of materials being prepared for transport, then scheduling which materials go through the baler is driven by the storage capacity on site, the volume of material being delivered, the schedule of transportation, and the volume of the transporting vehicle. Other forms of densification could include shredding and granulation, depending on the material.
Photo 13. MRF for mixed paper
Source: Michael H. Simpson

The Botswana Recycling Guidelines 2012 Advice on Valorisation for Middle-Income Countries
87
It is best if sorting is done on an upper level of a MRF, so the sorted material can drop down to a lower level so it can be moved to densification. This allows for a much better sorting line in regards to both efficiency and cleanliness. Thus, there is often some form of inclined conveyor that moves materials up to a second level so that sorted materials can be dropped down to the original level, although is a separate part of the building.
Just like there may need to be a skid steer or small tractor on the delivery floor, there will need to be a similar (if not same) equipment to move materials piling up from the sorting to be moved to the densification area. And once densified through baling or granulation, this very heavy material needs to moved directly on to a transport vehicle or into a temporary storage area.
Even in the best source separated input stream, there will be contamination, How much contamination needs to be removed is dictated by the manufacturing specifications. The more mixed the incoming loads, the higher level of contamination. Contaminants, that is, material not allowed by the end-user manufacturer, are wastes, and need to be disposed.
Thus, the volume created over time of this material needs to be calculated, temporary storage of this waste must be part of the design. The length of time waste is stored on site is based also on availability/frequency of transportation.
13.7 Topic: Compacting and balers
Compaction is utilized to increase the density of the recovered materials so that the materials can be stored and transported with the highest cost efficiency through the maximization of volume in each load. The level and method of compaction will be determined by market specifications since different markets want to receive materials baled, shredded or loose.
Photo 14 and Photo 15. Horizontal baler for paper (Total Recycling, Botswana) and vertical baler for PET bottles (Belarus)
Source: Sophie van den Berg
13.8 Topic: Sorting lines and conveyer belts
Within a MRF, conveyor belts form sorting lines are used to transport materials to and from mechanical equipment. In addition, flat belt conveyors can be used at the sorting stations since they permit easy access to the materials on the belts.

88 The Botswana Recycling Guidelines 2012 Advice on Valorisation for Middle-Income Countries
Photo 16. Sorting line for manual waste picking
Source: WASTE
Photo 17: Sorting line in mixed waste sorting plant
Source: IMABE
13.9 Topic: Integrating MRF functions with transfer
A MRF requires a physical location in the city, and thus can be effectively combined with transfer. A MRF that is combined with transfer requires a different kind of tipping area, and in most countries a different kind of permit, than a MRF that only processes source separated comingled recyclables.
13.10 Topic: Integrating MRF functions with composting
Another activity which can be combined with a MRF is composting. This is done in Quezon City. The organic fraction can be seaved out of the mixed waste, and then transferred to a composting hall or composting site. Here different processes transform the organic material to compost. Compost originating from mixed waste is more contaminated than compost originating from source separated waste. Therefore a market study of different qualities of compost always needs to be the basis for this activity.
13.11 Case Example: Sorting plant for mixed waste with composting in Accra, Ghana
In September 2012 the first sorting plant for extracting recyclables from mixed waste (a type of facility which is referred to a “dirty MRF” in North America) was taken into production in Ghana. The waste management company Zoom Lion established this sorting and composting facility at Adjenkotoku, a suburb of Accra.
Photo 16 and Photo 17 MRF in Ghana, sorting line and composting hall
Source: Sophie van den Berg
The plant starts to process 300 tonnes of mixed household waste per day, and has a sorting and buy-back centre, where several people are engaged in the recovery of useful materials for recycling. The organic fraction of the waste will be recovered into saleable compost for agricultural, horticultural and landscaping activities. The capacity of the plant is 600 tons per day. About 20% is contaminated residue, to be dumped in the constructed landfill site (with clay liner

The Botswana Recycling Guidelines 2012 Advice on Valorisation for Middle-Income Countries
89
and leachate treatment). As the plant has just started, no data are available about the operations or economics of the sorting plant.
This is a summary of the various process steps at the Ghana facility.:
Receiving Area: This section reserved for holding materials before they are processed to recover specific streams. A pay-loader conveys solid waste material into a uniform feeder which allows pickers to pick out bulky material, glass, batteries, and possible hazardous waste material from the process stream.
Manual Sorting: Manual sorting is conducted by hand, by using hand tools to pick out large objects or materials mentioned above.
Bag breaker: Because the majority of the solid wastes are conveyed in plastic bags, a bag breaker opens up the waste to enable effective size reduction.
Crusher/Shredder: Size reductions occurs in a shredder, which is a rotary drum with cutting blades to reduce materials to sizes that can be separated or screened.
Pneumatic separator: The pneumatic separator is a suction process whereby light plastics or paper are separated to allow for infra-red separation or direct bailing or compaction in a bailer.
Baler/Compactor: The baler serves compacts plastics and paper to increase their density, and allow for their easy transportation
Magnetic Separator: The magnetic separator lifts ferrous metals that are recyclable materials off the line.
Screening: Screening with a vibrating separator separates compostable and non compostable material. The latter is sent to the landfill site for final disposal.
Composting: Composting is facilitated by a self propelled turning machine, which facilitates the decomposition and stabilization of the final compost product.
13.12 List of references specifics to this guideline.
CDM-PDD (2006): Clean development mechanism project design, July 2006
Dubanowitz, Alexander (2000): Design of a Materials Recovery Facility for processing the recyclable materials of New York City‟s Municipal Solid Waste, May
www.recycletompkins.org (2012): Check this site for information on their Recycling and Solid Waste Management Centre (RSWMC) which combines transfer with MRF functions.
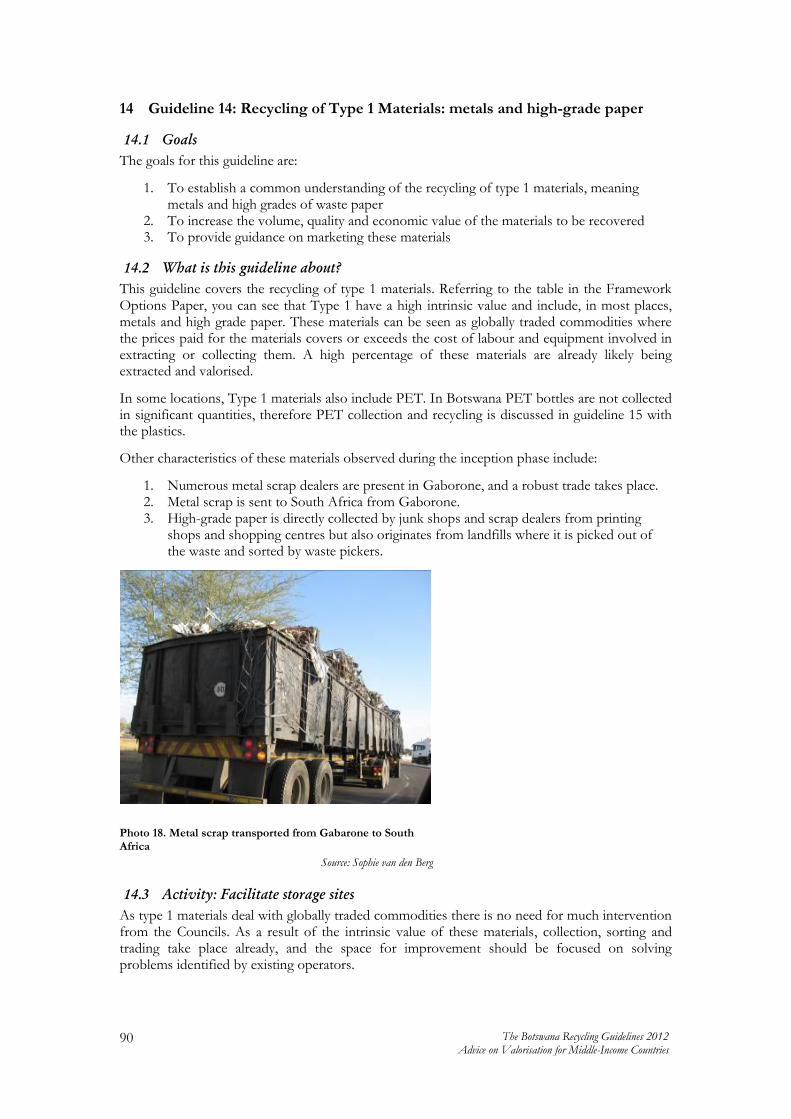
90 The Botswana Recycling Guidelines 2012 Advice on Valorisation for Middle-Income Countries
14 Guideline 14: Recycling of Type 1 Materials: metals and high-grade paper
14.1 Goals
The goals for this guideline are:
1. To establish a common understanding of the recycling of type 1 materials, meaning metals and high grades of waste paper
2. To increase the volume, quality and economic value of the materials to be recovered 3. To provide guidance on marketing these materials
14.2 What is this guideline about?
This guideline covers the recycling of type 1 materials. Referring to the table in the Framework Options Paper, you can see that Type 1 have a high intrinsic value and include, in most places, metals and high grade paper. These materials can be seen as globally traded commodities where the prices paid for the materials covers or exceeds the cost of labour and equipment involved in extracting or collecting them. A high percentage of these materials are already likely being extracted and valorised.
In some locations, Type 1 materials also include PET. In Botswana PET bottles are not collected in significant quantities, therefore PET collection and recycling is discussed in guideline 15 with the plastics.
Other characteristics of these materials observed during the inception phase include:
1. Numerous metal scrap dealers are present in Gaborone, and a robust trade takes place. 2. Metal scrap is sent to South Africa from Gaborone. 3. High-grade paper is directly collected by junk shops and scrap dealers from printing
shops and shopping centres but also originates from landfills where it is picked out of the waste and sorted by waste pickers.
Photo 18. Metal scrap transported from Gabarone to South Africa
Source: Sophie van den Berg
14.3 Activity: Facilitate storage sites
As type 1 materials deal with globally traded commodities there is no need for much intervention from the Councils. As a result of the intrinsic value of these materials, collection, sorting and trading take place already, and the space for improvement should be focused on solving problems identified by existing operators.

The Botswana Recycling Guidelines 2012 Advice on Valorisation for Middle-Income Countries
91
The inception mission and stakeholder consultations suggest that key problems that scrap dealers and junk shops are facing include:
1. limited supply of available materials
2. lack of sorting and storage space
There is too little information about the composition and supply of materials in Botswana to verify whether or not the reported limited supply relates to the way materials are being handled, or that there are really very few of these materials left to be captured. However the issue of sorting and storage space is clearly important, particularly in cities where freehold land is not readily available for expansion of existing businesses.
Result: Capture rates for type 1 materials are higher.
a. Councils have identified public or private sites which can serve for expansion of private scrap processers, or have designated private scrap processing sites as official MRFs.
b. Scrap processors in Botswana have increased their capacity to sort, process and store an increased volume of materials and to market them abroad.
c. There are more revenues from sale of recyclables to co-finance new investments in recycling infrastructure.
14.4 Topic: Ferrous and non-ferrous scrap metals
Scrap metals are divided into two major categories: ferrous (based on iron, magnetic) and non-ferrous. Scrap iron and steel are ferrous scrap metals. Ferrous scrap metals are the most commonly traded of all the recyclables. Sources include old automobiles, farm equipment, household appliances, steel beams, railroad rails, food packaging and industrial containers. Non-ferrous metals do not contain iron, are not magnetic, and are usually more resistant to corrosion than ferrous metals. Non-ferrous scrap metals include all other metals: aluminium, copper, lead, zinc, nickel, titanium, cobalt, chromium and precious metals. Non-ferrous scrap metals are sourced from copper pipes, electric and electronic equipment, aluminium building elements and window and door frames, automobile parts, furniture, bicycles, and other types of equipment.
Both ferrous and non-ferrous metals are collected quite efficiently in the main cities in Botswana through an extensive network of collectors and buyers covering major cities and villages, except in cases where the distances are too great for efficient transport. Individual collectors and small junk shops collect metal directly from businesses and in some case go door-to-door. Hand or mechanical processing includes sorting, cleaning, cutting, dismantling, and baling. Depending on the requirements of the market, after processing the metals are stored to be sent abroad in a truckload. In South Africa, for example, the ferrous and non-ferrous metal scrap industry has evolved in an industry consisting of many small to large sophisticated and well-equipped businesses5. The local scrap metal industry is represented by the MRA with more than 100 metal recyclers / dealers within South Africa, who collectively are responsible for 80% of the country‟s metal recycling.
Recycling of ferrous scrap The steel industry has been actively recycling for more than 150 years6, in large part because it is economically advantageous to do so. It is cheaper to recycle steel than to mine iron ore and manipulate it through the production process to form new steel. Steel does not lose any of its inherent physical properties during the recycling process, and has drastically reduced energy and material requirements compared with refinement from iron ore.
5 Source: www.mra.co.za
6 Source: wikipedia

92 The Botswana Recycling Guidelines 2012 Advice on Valorisation for Middle-Income Countries
Recycling of non-ferrous scrap The secondary materials in scrap are vital to the metallurgy industry. In the production of new products like ferrous metal, non-ferrous metals have almost no limits to the amount they can be recycled. Computer re-alloying makes it possible to smelt mixed non-ferrous metals and create new blends or alloys. Some recycling facilities re-smelt and recast non-ferrous materials. Due to its extensive use, non-ferrous scrap metal is usually recycled.
14.5 Topic: High-grade paper
Paper recycling is the process of recovering long fibres in waste paper, through selection, (re-) pulping, screening and elimination of short fibres, inks and sludges, and re-introducing the fibres into paper pulp for production of new paper products. Unlike metals or glass, paper cannot be perpetually recycled, as the fibres gradually break. The percentage that can be recovered from the pulping process (the mixing of waste paper with water) declines over time. Paper can be recycled up to 6 times before the fibres in the paper become too short and weak to be reused. In the paper recycling industry, waste paper is sorted in different types of paper and cardboard.
Globally, 38 grades of paper are recognised and traded, but in most countries the industrial recycling companies focus on a sub-selection of grades that can be sourced in the country. In Botswana, for example, there are five basic paper grade categories:
1. Old Corrugated Containers (OCC), also known as corrugated cardboard: Mills use old corrugated containers to make new recycled-content shipping boxes, as well as recycled paperboard for product packaging (cereal boxes, shoe boxes, etc.).
2. Mixed paper or mixed office paper: Mixed paper is a broad category that often includes items such as discarded mail, telephone books, paperboard, magazines, and catalogues. Mills use mixed paper to produce paperboard and tissue, as a secondary fibre in the production of new paper, or as a raw material in non-paper product such as gypsum wallboard, chipboard, roofing felt, cellulose insulation, and moulded pulp products such as egg cartons. A variant of mixed paper is mixed office paper, which focuses on the higher grades but still allows coloured and printed paper.
3. Old Newspapers (ONP): Mills primarily use old newspapers to make low-grade papers, which do not require bleaching. Typical uses included new newsprint, paperboard, corrugating medium (the rippled middle layer of cardboard boxes), pressboard, such as is used in egg cartons, tissue, and towelling.
4. High Grade De-inked Paper: This grade consists of fibres extracted from white, printed or unprinted high grade paper such as letterhead, copier paper, envelopes, and printer scrap that has gone through a printing and/or converting process. It must first be de-inked (the ink must be removed chemically or mechanically) before it can be reprocessed into high grade paper products such as printing and writing papers or tissue. Detergent or chemical de-inking was the standard method until the 1990s, when the CEO of Garden State Paper in the USA invented flotation de-inking, where the ink floats to the top of the pulp and can be skimmed off.
5. Pulp substitutes: A high grade paper, pulp substitutes are often shavings and clippings from converting operations at paper mills and print shops. Mills can use pulp substitutes in place of virgin materials to produce high grade paper products.

The Botswana Recycling Guidelines 2012 Advice on Valorisation for Middle-Income Countries
93
Table 10. Paper grades most commonly traded
Group No./quality Grade No.
Description
1. Ordinary grades
1.01 Mixed Paper & Board, unsorted
1.02 Mixed Paper & Board, sorted
1.03 Grey board
1.04 Supermarket Corrugated Paper & Board
1.05 Old Corrugated Containers
1.06 Unsold Magazines (with or without glue)
1.08 Mixed Newspapers and magazines I (minimum 50% newspaper content)
1.09 Mixed Newspapers and magazines II (minimum 60% newspaper content)
2. Medium grades
2.05 Sorted office paper
2.06 Coloured Letters
2.08 Coloured Wood Free Magazines
3. High grades
3.05 White Wood free Letters
3.10 Multi-printing
3.16 White wood free coated paper, without glue
3.18 White wood free uncoated shavings
4. Kraft grades 4.01 Unused corrugated kraft
4.02 Used corrugated kraft I
14.6 Topic: Tips for marketing waste paper
1. Prices fluctuate as high grade paper is a globally traded commodity, prices can shift rapidly following global market prices. Prices for the different waste paper grades on the global market can be found at: www.letsrecycle.com or www.recycle.net
2. Paper is perishable. Paper which has been stored outdoors can usually not be marketed. Specifically, wet paper loses its value rapidly and moisture content can be a legitimate reason for a market to reject an entire truckload. Mildews or moulds eat the fibres, and can also cause rejection. Paper co-collected with glass can become un-usable due to glass shards in the pulp.
3. High-grading is the main path to increasing value and revenues. Mixed paper is marketable, usually for about US$15 per tonne. But that mixed paper contains multiple grades, some of which are worth more than 10 times as much as others. So a good marketing strategy is to high-grade or sort all the high-value grades from mixed paper, and to make bales of different grades. If you do the math it is easy to see why. Assume that your mixed paper is 20% sorted office paper, 40% used corrugated, and 40% news. You can leave it mixed and it will be worth $15 per tonne approximately. So five tonnes will be worth $75. But if you take out the sorted office paper, you can get one tonne of sorted office which is worth about US$ 150, two tonnes of corrugated which is worth about $45 per tonne, and two tonnes of newspaper which is worth maybe $20 per tonne. Then your five tonnes gives you $150 + $90 + $40, or $280, nearly four times as much as if you marketed the mixed paper.
4. To recycle paper, it is necessary to have two important pieces of infrastructure: a baler and covered or dry storage. Baling is essential for storage purposes, as bales can be stacked for efficient use of space. Never bale mixed grades if you are able to sort or high-grade them first.
5. The more paper you have to sell, the higher the price per tonne. This appears to defy economic logic, but is related to transaction costs and due diligence. A buyer who can trust a seller does not have to check so many different loads for moisture, weather exposure, or contamination, as she or he would rather have more tonnes at one time.
6. The density of the bales contributes to economic viability of paper recycling. In Botswana, we saw mostly vertical balers, which are easy to use and maintain and which make reasonably dense bales. A horizontal (hydraulic) baler produces denser bales, but is more expensive and takes more electricity. However that extra density pays for itself when shipping paper over longer distances.

94 The Botswana Recycling Guidelines 2012 Advice on Valorisation for Middle-Income Countries
7. Demand for waste paper varies seasonally and in response to changes in economic or political conditions, and the prices fluctuate quite significantly. It is advisable to ship paper as soon as a truckload has been accumulated, especially in the rainy season.
14.7 Case example: Paper recycling plant in Addis Ababa
Within the research project 'IGNIS – Income Generation and Climate Protection by valorising municipal solid wastes in a sustainable way in emerging mega-cities, Addis Ababa, Ethiopia' several pilot projects have been analysed for their potential to contribute to global climate protection, local environmental improvement and sustainable development. One of these projects is a small scale paper recycling plant, which is utilising waste paper and other waste materials such as banana leaves and pineapple fibres to produce sheet paper, which is then converted into final products such as postcards, photo frames, and coffee bags. The plant has been analysed in terms of internal material flows, emissions, economics and social and socioeconomic aspects. This analysis was designed to determine the feasibility of replication or expansion, and to quantify the potential for positive impacts on climate change and environmental protection. The results suggest that paper waste and other fibres can reliably generate income in that particular context. At the present time, five people are employed in the factory, which is making a profit of 50,000 ETB per year.
Photo 19. Cutting of handmade paper in recycling plant in Addia Ababa
Source: IGNIS
14.8 List of references specific to this guideline
Speck, Mike (2010): Small Scale Paper Recycling in Addis Ababa, Ethiopia – a showcase for sustainable waste management and income generation in developing countries. Paper presented at The Twenty-fifth International Conference on Solid Waste Technology and Management held on Philadelphia, PA, USA, at March 14-17 2010
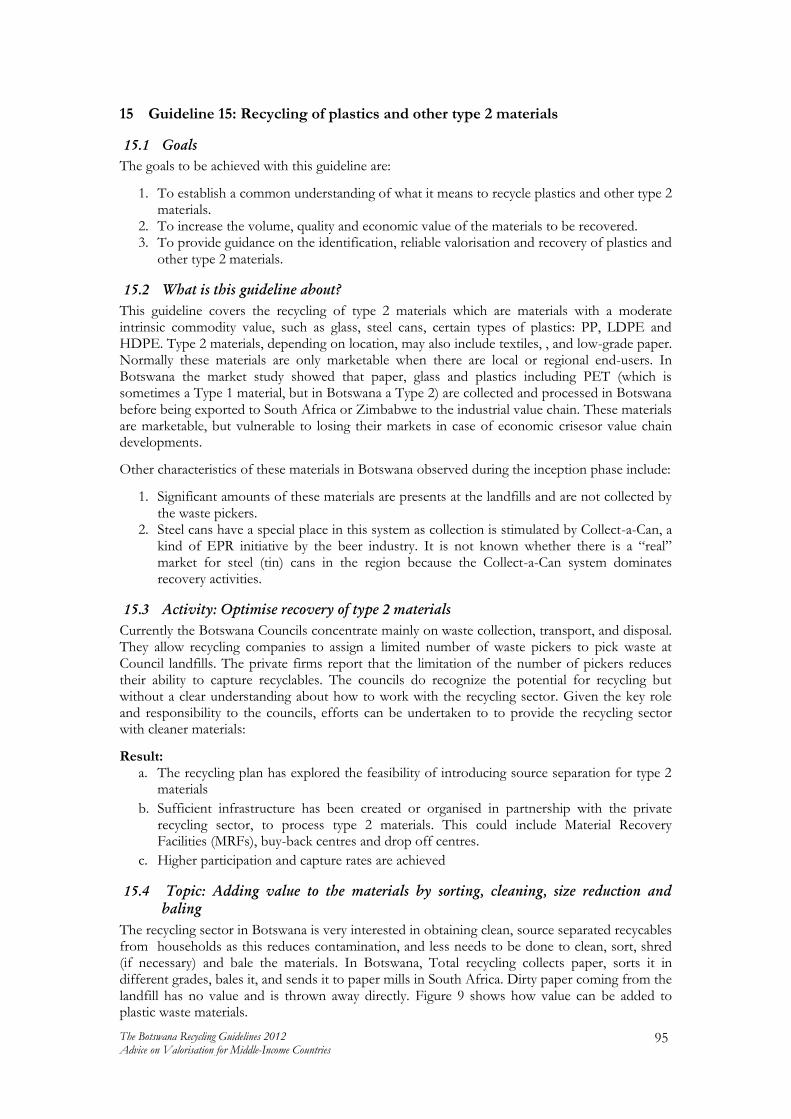
The Botswana Recycling Guidelines 2012 Advice on Valorisation for Middle-Income Countries
95
15 Guideline 15: Recycling of plastics and other type 2 materials
15.1 Goals
The goals to be achieved with this guideline are:
1. To establish a common understanding of what it means to recycle plastics and other type 2 materials.
2. To increase the volume, quality and economic value of the materials to be recovered. 3. To provide guidance on the identification, reliable valorisation and recovery of plastics and
other type 2 materials.
15.2 What is this guideline about?
This guideline covers the recycling of type 2 materials which are materials with a moderate intrinsic commodity value, such as glass, steel cans, certain types of plastics: PP, LDPE and HDPE. Type 2 materials, depending on location, may also include textiles, , and low-grade paper. Normally these materials are only marketable when there are local or regional end-users. In Botswana the market study showed that paper, glass and plastics including PET (which is sometimes a Type 1 material, but in Botswana a Type 2) are collected and processed in Botswana before being exported to South Africa or Zimbabwe to the industrial value chain. These materials are marketable, but vulnerable to losing their markets in case of economic crisesor value chain developments.
Other characteristics of these materials in Botswana observed during the inception phase include:
1. Significant amounts of these materials are presents at the landfills and are not collected by the waste pickers.
2. Steel cans have a special place in this system as collection is stimulated by Collect-a-Can, a kind of EPR initiative by the beer industry. It is not known whether there is a “real” market for steel (tin) cans in the region because the Collect-a-Can system dominates recovery activities.
15.3 Activity: Optimise recovery of type 2 materials
Currently the Botswana Councils concentrate mainly on waste collection, transport, and disposal. They allow recycling companies to assign a limited number of waste pickers to pick waste at Council landfills. The private firms report that the limitation of the number of pickers reduces their ability to capture recyclables. The councils do recognize the potential for recycling but without a clear understanding about how to work with the recycling sector. Given the key role and responsibility to the councils, efforts can be undertaken to to provide the recycling sector with cleaner materials:
Result: a. The recycling plan has explored the feasibility of introducing source separation for type 2
materials
b. Sufficient infrastructure has been created or organised in partnership with the private recycling sector, to process type 2 materials. This could include Material Recovery Facilities (MRFs), buy-back centres and drop off centres.
c. Higher participation and capture rates are achieved
15.4 Topic: Adding value to the materials by sorting, cleaning, size reduction and
baling
The recycling sector in Botswana is very interested in obtaining clean, source separated recycables from households as this reduces contamination, and less needs to be done to clean, sort, shred (if necessary) and bale the materials. In Botswana, Total recycling collects paper, sorts it in different grades, bales it, and sends it to paper mills in South Africa. Dirty paper coming from the landfill has no value and is thrown away directly. Figure 9 shows how value can be added to plastic waste materials.
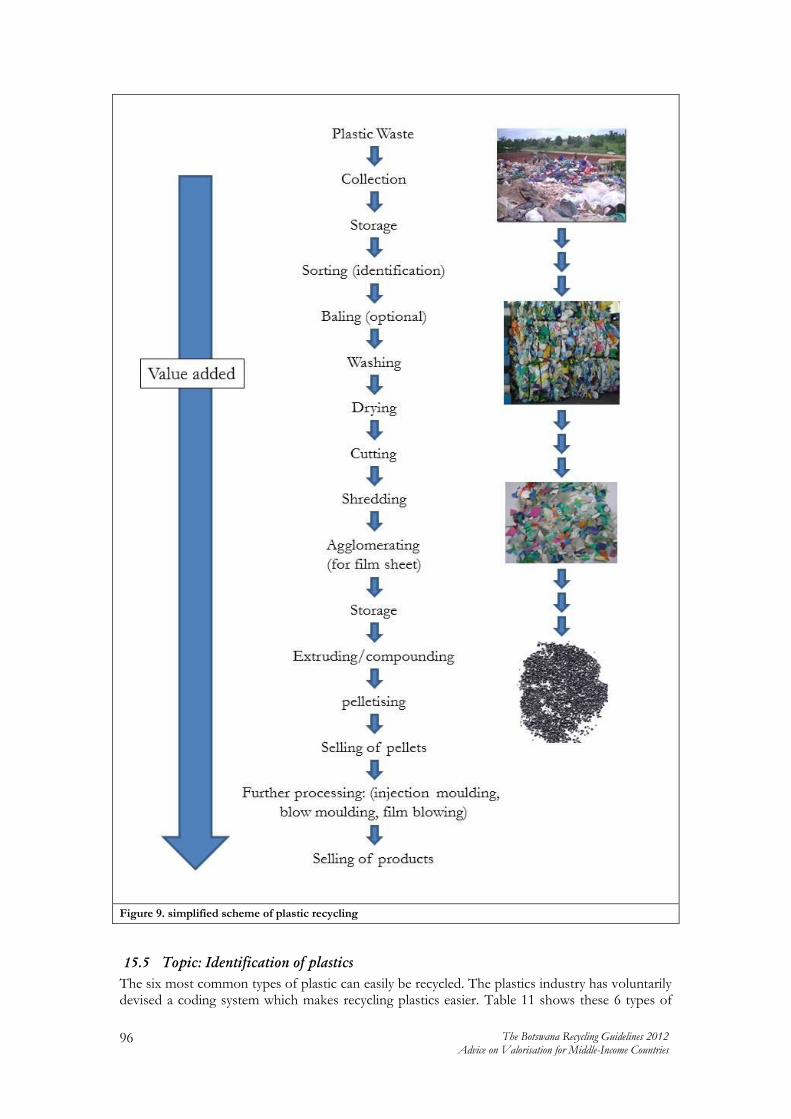
96 The Botswana Recycling Guidelines 2012 Advice on Valorisation for Middle-Income Countries
Figure 9. simplified scheme of plastic recycling
15.5 Topic: Identification of plastics
The six most common types of plastic can easily be recycled. The plastics industry has voluntarily devised a coding system which makes recycling plastics easier. Table 11 shows these 6 types of
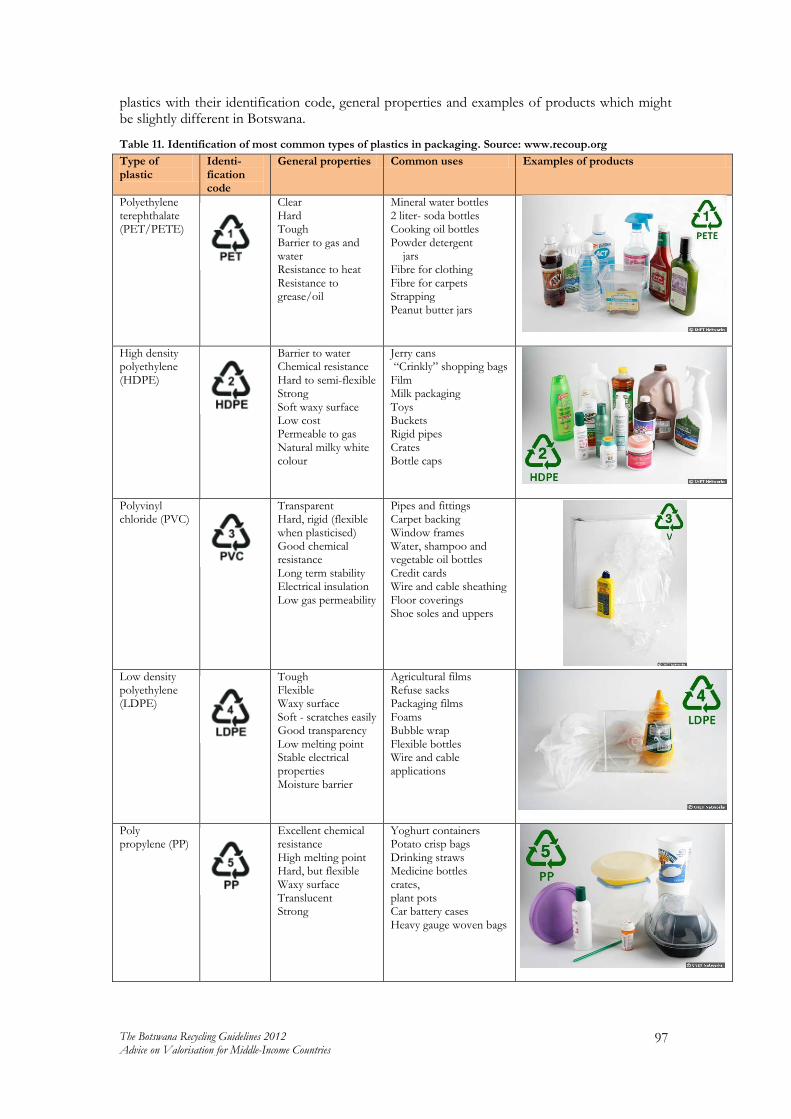
The Botswana Recycling Guidelines 2012 Advice on Valorisation for Middle-Income Countries
97
plastics with their identification code, general properties and examples of products which might be slightly different in Botswana.
Table 11. Identification of most common types of plastics in packaging. Source: www.recoup.org
Type of plastic
Identi- fication code
General properties Common uses Examples of products
Polyethylene terephthalate (PET/PETE)
Clear Hard Tough Barrier to gas and water Resistance to heat Resistance to grease/oil
Mineral water bottles 2 liter- soda bottles Cooking oil bottles Powder detergent jars Fibre for clothing Fibre for carpets Strapping Peanut butter jars
High density polyethylene (HDPE)
Barrier to water Chemical resistance Hard to semi-flexible Strong Soft waxy surface Low cost Permeable to gas Natural milky white colour
Jerry cans “Crinkly” shopping bags Film Milk packaging Toys Buckets Rigid pipes Crates Bottle caps
Polyvinyl chloride (PVC)
Transparent Hard, rigid (flexible when plasticised) Good chemical resistance Long term stability Electrical insulation Low gas permeability
Pipes and fittings Carpet backing Window frames Water, shampoo and vegetable oil bottles Credit cards Wire and cable sheathing Floor coverings Shoe soles and uppers
Low density polyethylene (LDPE)
Tough Flexible Waxy surface Soft - scratches easily Good transparency Low melting point Stable electrical properties Moisture barrier
Agricultural films Refuse sacks Packaging films Foams Bubble wrap Flexible bottles Wire and cable applications
Poly propylene (PP)
Excellent chemical resistance High melting point Hard, but flexible Waxy surface Translucent Strong
Yoghurt containers Potato crisp bags Drinking straws Medicine bottles crates, plant pots Car battery cases Heavy gauge woven bags

98 The Botswana Recycling Guidelines 2012 Advice on Valorisation for Middle-Income Countries
Polystyrene (PS)
Clear to opaque Glassy surface Rigid Hard Brittle High clarity Affected by fats and solvents
Packaging pellets Yoghurt containers Fast food trays disposable cutlery Coat hangers
Other plastics MOSTLY NOT AVAILABLE IN SUFFICIENT QUANTITIES FOR RECYCLING
15.6 Case example: Plastic Recycling Industries (PRI) Uganda.
Courtesy of Patrizia Sterenburg Salinas Consultancy.
Name of factory: Plastic Recycling Industries (PRI) Uganda Capacity: 550 ton in 2009
In December 2006 PRI installed a new production line for the shredding and washing of PE and PET. As a reliable input of raw material is of the utmost importance for the existence of the factory, at the same time PRI set up a very successful collection system for Kampala. Several activities were executed to achieve this:
1. A public information campaign using posters, spots on local radio and TV, articles and commercials in newspapers.
2. Training of NGO‟s and other organisations involved in the collection of plastic material.
3. Setting up several collection points in the city.
In this way a simple and reliable collection system exists now in Kampala. In this, communication is a key factor. The message you want to promote must be clear: What types of plastics is the factory buying? How clean and sorted must the plastic waste be to be accepted? How much does the factory pay? Etc.
As a result of this intensive marketing and promotional campaign, more than 100 contracts were established with suppliers of plastic waste materials like hotels, restaurants, schools, NGO‟s, garbage collectors, petrol stations, supermarkets, etc. Apart from these agreements, many small companies started collecting and selling plastic waste material to PRI.

The Botswana Recycling Guidelines 2012 Advice on Valorisation for Middle-Income Countries
99
Photo 20. Collection of PET bottles in Uganda.
Source: Patrizia Sterenburg Salinas Consultancy
The impact of these activities is enormous, next to the creation of hundreds of jobs in the collection and transportation of plastic waste, also a great impact on environment is noticeable. Plastic waste lying around in streets is less and it is also noticed that the burning of plastic has decreased in many areas of the city.
15.7 Recycled glass in art glass applications
Art glass, especially products produced at a studio scale by blowing or casting molten glass, represents one of the highest value uses for soda-lime glass. The retail value of these glass products is high. However, these applications are also among the most sensitive both to contaminants that might affect the clarity, and to chemistry that might affect the workability of the glass. This is a critical market barrier for the use of recycled glass but if appropriate procedures are followed, hot shops can be successful in using recycled glass to create recycled content products.
Photo 21 and Photo 22. Glass blowing furnace and African animals made out of recycled glass, Ngwenya, Swaziland.
Source: http://www.ngwenyaglass.co.sz
In Swaziland there is a recycled glass craft workshop called NGWENYA- (Siswati name for "crocodile"). Here a small group of Swazi craftsmen and women - with age old artistry - breathe life into enchanting interpretations of the animals and birds of Africa, imbuing each with its own irresistible personality. Each item is handmade from 100 % recycled. The products, which

100 The Botswana Recycling Guidelines 2012 Advice on Valorisation for Middle-Income Countries
include a range of tableware, drinking glasses, vases, jugs and ornamental African animals, are all handmade from recycled glass. Most of this is from soft drink bottles, gathered from all over Swaziland. Not only are the people of Swaziland encouraged to collect the bottles, but Ngwenya Glass works with the local schools to instil in the children a sense of environmental awareness. In exchange for building materials and the sponsorship of the soccer team, the students must participate in roadside clean-up campaigns (http://www.ngwenyaglass.co.sz/).
15.8 List of references specific to this guideline
CWC, Best practices in Glass Recycling, 1996

The Botswana Recycling Guidelines 2012 Advice on Valorisation for Middle-Income Countries
101
16 Guideline 16: Type 3 Materials: Composting, organics valorisation
16.1 Goals
The goals to be achieved with this guideline are:
1. To introduce composting to Councils and Botswana Stakeholders
2. To de-bunk some myths about composting
3. To briefly present some options for composting in Botswana
This guideline is not exhaustive. Organics valorisation is a huge topic and making it work will require that the Department and the Councils invest in expertise, sites, training, capacity development, infrastructure and equipment.
16.2 What is this guideline about?
This guideline is about valorisation of organics. The types of organics to be valorised include:
Kitchen wastes, with a focus on vegetables, fruits, cooked foods, limited dairy; should also include wastes generated by “the ladies” street lunch service, cafeterias, market kiosks
Yard and garden wastes, with a focus on leaves, weeds, limited branches, thorn trees, brush
Animal wastes: livestock manures, chicken manures, slaughterhouse and BMC solid and liquid wastes
Processing wastes: juice, beer, and fruit processing pressates and filtrates, diatomaceous earth, rice hulls, nut shells, coconut fibres, etc.
Construction and demolition wastes: soil, sods, peat, tree roots, with particle sizes under 2 cm
Open and public market wastes Commercial wastes: restaurant preparation and cooking wastes, separated plate wastes Latrine and dredge spoils and sludges where appropriate and necessary
Explanation: Organics are a type 3 material, which means that:
There is no existing market for the source material, kitchen waste or garden or bush organics.
The existing forms of valorisation are likely all informal and/or in some way irregular. The main financing for market development comes from the avoided cost of disposal. Commercial exploitation in the short term is unlikely. There are high synergies with landfill operation. Pricing of disposal is essential to a successful approach to involving the private sector or
the agricultural value chains.
The basic requirements for composting include:
A dry place, best with availability of a roof or covering A supply of organic material Green materials Grown materials Bulking agents Water Air Sufficient mass to retain heat: minimum pile size is about 1 m3
In contrast to many myths about composting, the following are generally not necessary, and may seriously hinder composting:
Additives, inoculants, lime Machines or high technology A cement or concrete floor

102 The Botswana Recycling Guidelines 2012 Advice on Valorisation for Middle-Income Countries
A compost vessel which is closed on the bottom or sealed Any kind of composting container at all
When considering composting in Botswana, it is useful to mention certain aspects of the management of organics observed during the inception phase:
1. Brush is piled high at landfills but nothing much is done with it
2. Organics appear as part of construction and demolition wastes, bulky wastes, and “debris”
3. There is confusion as to what is compost and whether it is a fertilizer
4. There is little appreciation of the value of processed organics – mulch or compost – for water retention and erosion control
5. Because Botswana is a country where most people are Christians, there is a high probability that market waste and institutional and commercial organics are going to feed pigs
6. In spite of this, there is no information on swine feeding, whether it occurs, if so where, to what extent, and whether (market) organics have a place in this activity
7. There is even less knowledge and understanding of composting or other forms of valorisation at the Councils than there is of recycling.
Photo 23. An NGO compost operation in Péru – model for Empowerment-based composting.
Source: WASTE
16.3 Topic: market development for compost in a desert and mining country like
Botswana
Compost is not a product in the same way number 2 newsprint or aluminium used beverage containers are products. It does not have a clear price, and there is not a trade in compost in most countries. In a country like Botswana, there is plenty of good that compost can do, but this is not easy to get paid for. So there are several options for building a market for or with compost, where the government is the prime mover. For example:
The government can agree to purchase compost for greening cities and public places.
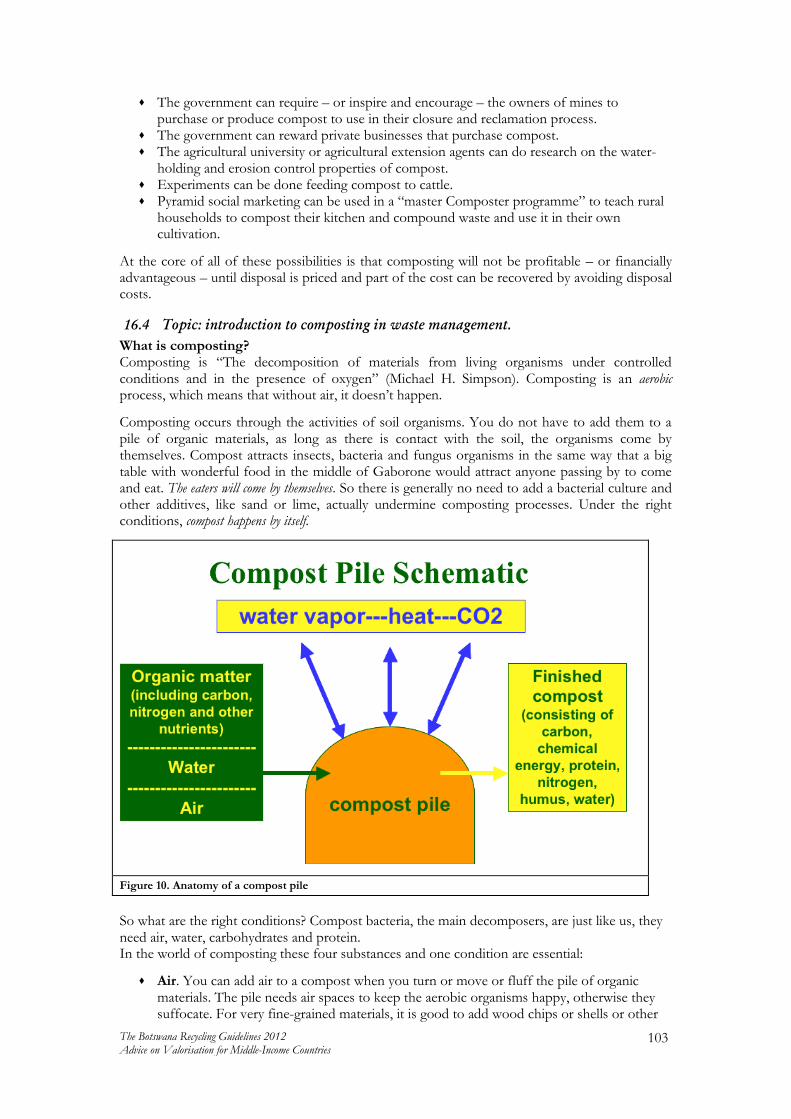
The Botswana Recycling Guidelines 2012 Advice on Valorisation for Middle-Income Countries
103
The government can require – or inspire and encourage – the owners of mines to purchase or produce compost to use in their closure and reclamation process.
The government can reward private businesses that purchase compost. The agricultural university or agricultural extension agents can do research on the water-
holding and erosion control properties of compost. Experiments can be done feeding compost to cattle. Pyramid social marketing can be used in a “master Composter programme” to teach rural
households to compost their kitchen and compound waste and use it in their own cultivation.
At the core of all of these possibilities is that composting will not be profitable – or financially advantageous – until disposal is priced and part of the cost can be recovered by avoiding disposal costs.
16.4 Topic: introduction to composting in waste management.
What is composting? Composting is “The decomposition of materials from living organisms under controlled conditions and in the presence of oxygen” (Michael H. Simpson). Composting is an aerobic process, which means that without air, it doesn‟t happen.
Composting occurs through the activities of soil organisms. You do not have to add them to a pile of organic materials, as long as there is contact with the soil, the organisms come by themselves. Compost attracts insects, bacteria and fungus organisms in the same way that a big table with wonderful food in the middle of Gaborone would attract anyone passing by to come and eat. The eaters will come by themselves. So there is generally no need to add a bacterial culture and other additives, like sand or lime, actually undermine composting processes. Under the right conditions, compost happens by itself.
Figure 10. Anatomy of a compost pile
So what are the right conditions? Compost bacteria, the main decomposers, are just like us, they need air, water, carbohydrates and protein. In the world of composting these four substances and one condition are essential:
Air. You can add air to a compost when you turn or move or fluff the pile of organic materials. The pile needs air spaces to keep the aerobic organisms happy, otherwise they suffocate. For very fine-grained materials, it is good to add wood chips or shells or other
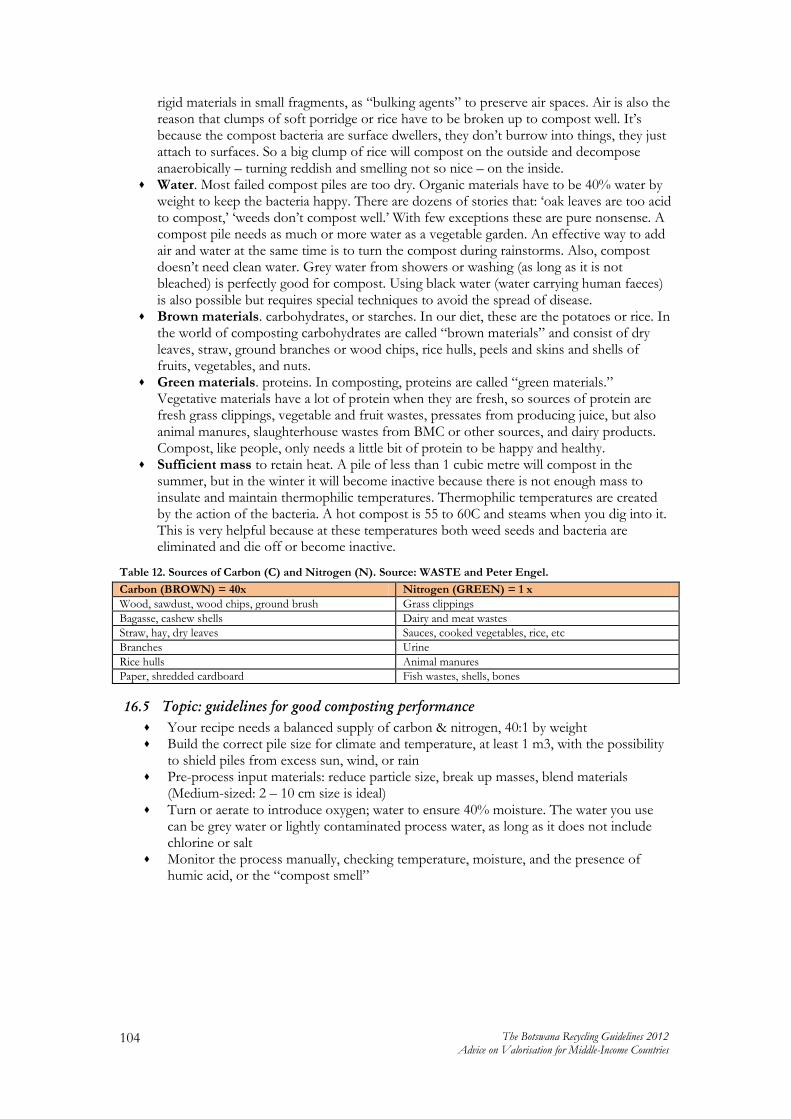
104 The Botswana Recycling Guidelines 2012 Advice on Valorisation for Middle-Income Countries
rigid materials in small fragments, as “bulking agents” to preserve air spaces. Air is also the reason that clumps of soft porridge or rice have to be broken up to compost well. It‟s because the compost bacteria are surface dwellers, they don‟t burrow into things, they just attach to surfaces. So a big clump of rice will compost on the outside and decompose anaerobically – turning reddish and smelling not so nice – on the inside.
Water. Most failed compost piles are too dry. Organic materials have to be 40% water by weight to keep the bacteria happy. There are dozens of stories that: „oak leaves are too acid to compost,‟ „weeds don‟t compost well.‟ With few exceptions these are pure nonsense. A compost pile needs as much or more water as a vegetable garden. An effective way to add air and water at the same time is to turn the compost during rainstorms. Also, compost doesn‟t need clean water. Grey water from showers or washing (as long as it is not bleached) is perfectly good for compost. Using black water (water carrying human faeces) is also possible but requires special techniques to avoid the spread of disease.
Brown materials. carbohydrates, or starches. In our diet, these are the potatoes or rice. In the world of composting carbohydrates are called “brown materials” and consist of dry leaves, straw, ground branches or wood chips, rice hulls, peels and skins and shells of fruits, vegetables, and nuts.
Green materials. proteins. In composting, proteins are called “green materials.” Vegetative materials have a lot of protein when they are fresh, so sources of protein are fresh grass clippings, vegetable and fruit wastes, pressates from producing juice, but also animal manures, slaughterhouse wastes from BMC or other sources, and dairy products. Compost, like people, only needs a little bit of protein to be happy and healthy.
Sufficient mass to retain heat. A pile of less than 1 cubic metre will compost in the summer, but in the winter it will become inactive because there is not enough mass to insulate and maintain thermophilic temperatures. Thermophilic temperatures are created by the action of the bacteria. A hot compost is 55 to 60C and steams when you dig into it. This is very helpful because at these temperatures both weed seeds and bacteria are eliminated and die off or become inactive.
Table 12. Sources of Carbon (C) and Nitrogen (N). Source: WASTE and Peter Engel.
Carbon (BROWN) = 40x Nitrogen (GREEN) = 1 x
Wood, sawdust, wood chips, ground brush Grass clippings
Bagasse, cashew shells Dairy and meat wastes
Straw, hay, dry leaves Sauces, cooked vegetables, rice, etc
Branches Urine
Rice hulls Animal manures
Paper, shredded cardboard Fish wastes, shells, bones
16.5 Topic: guidelines for good composting performance
Your recipe needs a balanced supply of carbon & nitrogen, 40:1 by weight Build the correct pile size for climate and temperature, at least 1 m3, with the possibility
to shield piles from excess sun, wind, or rain Pre-process input materials: reduce particle size, break up masses, blend materials
(Medium-sized: 2 – 10 cm size is ideal) Turn or aerate to introduce oxygen; water to ensure 40% moisture. The water you use
can be grey water or lightly contaminated process water, as long as it does not include chlorine or salt
Monitor the process manually, checking temperature, moisture, and the presence of humic acid, or the “compost smell”
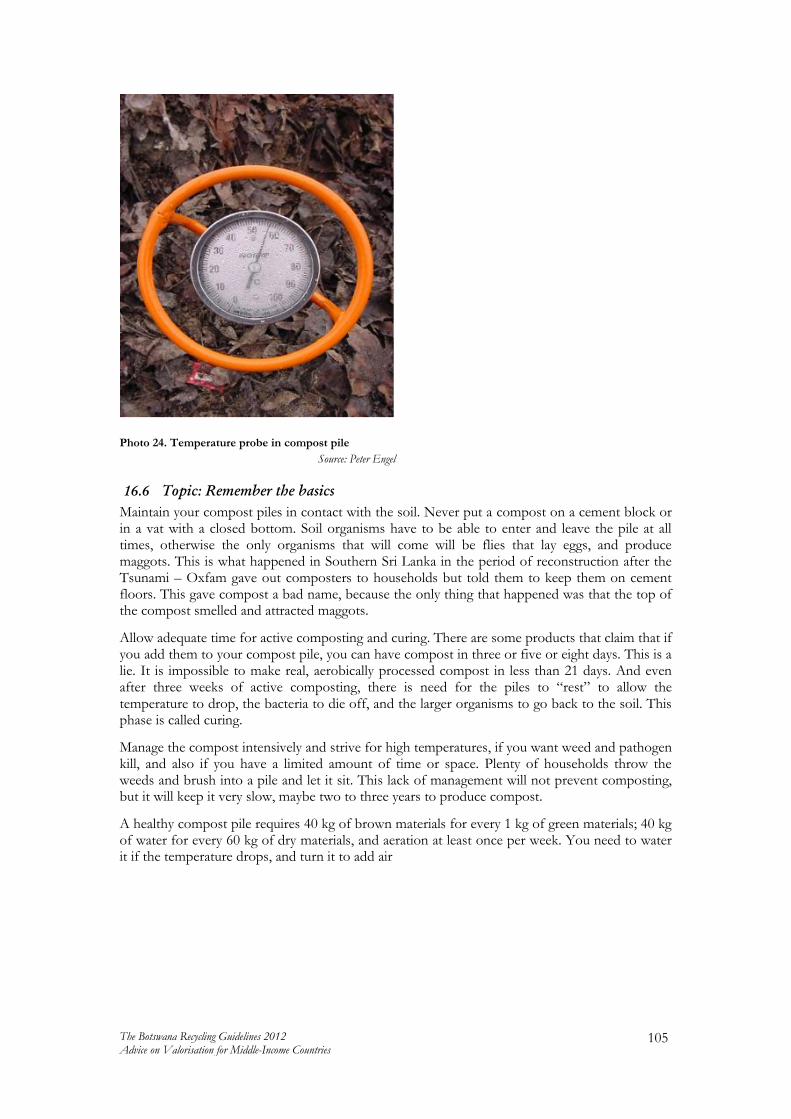
The Botswana Recycling Guidelines 2012 Advice on Valorisation for Middle-Income Countries
105
Photo 24. Temperature probe in compost pile
Source: Peter Engel
16.6 Topic: Remember the basics
Maintain your compost piles in contact with the soil. Never put a compost on a cement block or in a vat with a closed bottom. Soil organisms have to be able to enter and leave the pile at all times, otherwise the only organisms that will come will be flies that lay eggs, and produce maggots. This is what happened in Southern Sri Lanka in the period of reconstruction after the Tsunami – Oxfam gave out composters to households but told them to keep them on cement floors. This gave compost a bad name, because the only thing that happened was that the top of the compost smelled and attracted maggots.
Allow adequate time for active composting and curing. There are some products that claim that if you add them to your compost pile, you can have compost in three or five or eight days. This is a lie. It is impossible to make real, aerobically processed compost in less than 21 days. And even after three weeks of active composting, there is need for the piles to “rest” to allow the temperature to drop, the bacteria to die off, and the larger organisms to go back to the soil. This phase is called curing.
Manage the compost intensively and strive for high temperatures, if you want weed and pathogen kill, and also if you have a limited amount of time or space. Plenty of households throw the weeds and brush into a pile and let it sit. This lack of management will not prevent composting, but it will keep it very slow, maybe two to three years to produce compost.
A healthy compost pile requires 40 kg of brown materials for every 1 kg of green materials; 40 kg of water for every 60 kg of dry materials, and aeration at least once per week. You need to water it if the temperature drops, and turn it to add air
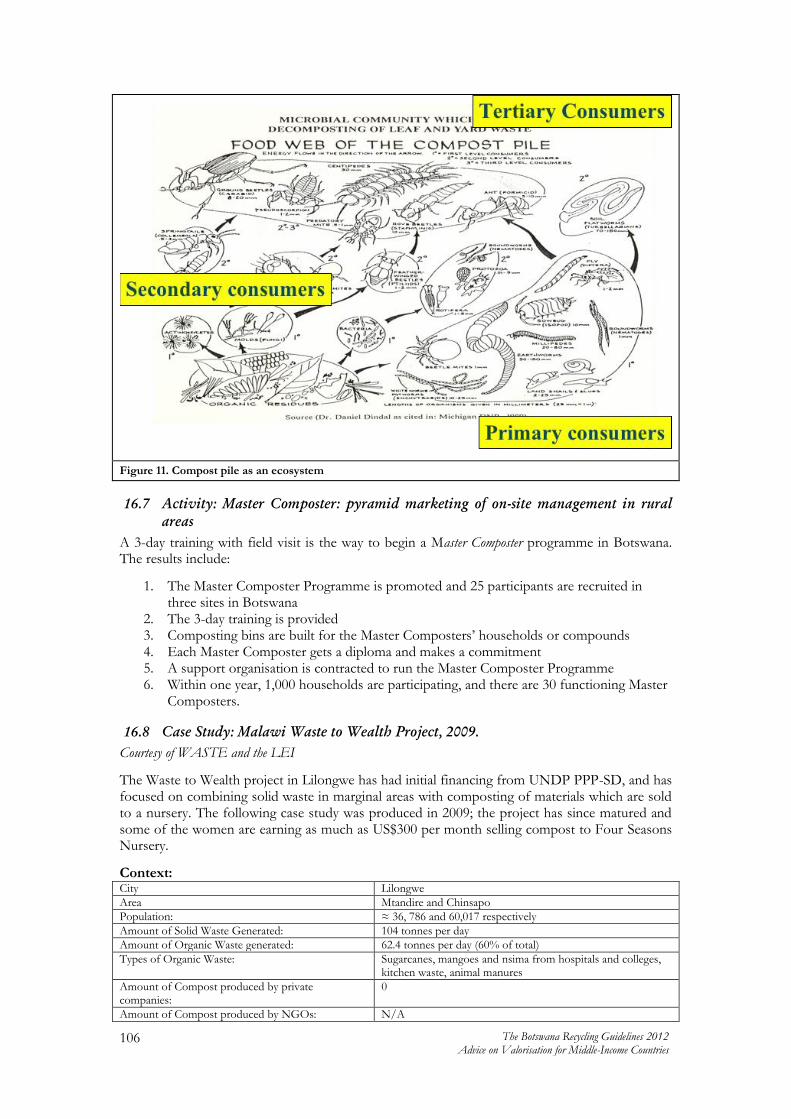
106 The Botswana Recycling Guidelines 2012 Advice on Valorisation for Middle-Income Countries
Figure 11. Compost pile as an ecosystem
16.7 Activity: Master Composter: pyramid marketing of on-site management in rural
areas
A 3-day training with field visit is the way to begin a Master Composter programme in Botswana. The results include:
1. The Master Composter Programme is promoted and 25 participants are recruited in three sites in Botswana
2. The 3-day training is provided 3. Composting bins are built for the Master Composters‟ households or compounds 4. Each Master Composter gets a diploma and makes a commitment 5. A support organisation is contracted to run the Master Composter Programme 6. Within one year, 1,000 households are participating, and there are 30 functioning Master
Composters.
16.8 Case Study: Malawi Waste to Wealth Project, 2009.
Courtesy of WASTE and the LEI
The Waste to Wealth project in Lilongwe has had initial financing from UNDP PPP-SD, and has focused on combining solid waste in marginal areas with composting of materials which are sold to a nursery. The following case study was produced in 2009; the project has since matured and some of the women are earning as much as US$300 per month selling compost to Four Seasons Nursery.
Context: City Lilongwe
Area Mtandire and Chinsapo
Population: ≈ 36, 786 and 60,017 respectively
Amount of Solid Waste Generated: 104 tonnes per day
Amount of Organic Waste generated: 62.4 tonnes per day (60% of total)
Types of Organic Waste: Sugarcanes, mangoes and nsima from hospitals and colleges, kitchen waste, animal manures
Amount of Compost produced by private companies:
0
Amount of Compost produced by NGOs: N/A

The Botswana Recycling Guidelines 2012 Advice on Valorisation for Middle-Income Countries
107
Amount of Compost produced by CBOs and SHG: ≈ 200tonnes per year
Established Municipal Waste Collection System: Existing but ineffective, under equipped, poorly maintained, inadequately funded and poorly staffed.
Introduction The conception and creation of forming a community based organisation that would treat communal organic waste and process it into compost for the area of Mtandire, evolved within a two-level Public-Private Partnership (PPP) between the Lilongwe City Assembly, the community groups, and private entrepreneurs. The purpose of the PPP was for the City Assembly to deliver a waste management service in the low-income community of Mtandire. On one hand the city assembly partnered with private entrepreneurs or women's groups for the collection, sorting and transportation of solid waste and on the other hand they partnered with Four Seasons Nursery, a large private horticultural company, to buy and use composted organics. Two local NGO's, Center for Community Organization and Development (CCODE) and SWAM were responsible for mobilizing the community and building the capacity of both sides of the partnership. Those were the enabling conditions for the Women's Composting Community Based Organization (CBO) to be created.
The group originally started with three women, who were members of the Malawi Homeless Federation. The group was progressively reduced, given the fact that significant support and knowledge on the technical aspects of composting were lacking, resulting in one woman organisation. The challenges were various but once the operability of the venture was demonstrated the other women joined again. Currently the CBO is consisting of thirty-seven women, operating basic level open air composting and is making make significant income to support all its members. The main business model is quite simple, women collect organic waste from their community and other neighbouring communities, either by transporting it themselves and then process it in an open air facility. The compost is sold communally but the resulting income goes to the women according to the volume each has produced
The Stakeholders A stakeholder is a person or organisation that has a stake, an interest in a specific system . Based on this definition, the groups that have a stake or interest on the Women's Community Composting in Lilongwe include the community (households, community leaders, farmers), the City Assembly, the Ministry of Local Government and the Four Seasons Nursery.
The main stakeholders identified in the case of the Women's Composting CBO are presented below.
The Initiators-Owners: As mentioned in the introduction, the initiator of the idea was a group of women from Mtandire, guided by the Center for Community Organization and Development (CCODE) and the City Assembly. The women saw the underlying financial and environmental benefits of composting the organic waste produced in their neighbourhood. Dealing with the uncertainty period until the compost matures, the majority of the original initiators abandoned the effort, since they saw no significant benefit at that particular moment. However, currently the chair woman of the CBO was the one who believed in the process and managed to turn a dubious activity to a profitable community based organisation. The manager also combined some other types of solid waste recovery (i.e. metals and plastics) in order to support the venture financially.
The current structure of the CBO is based on four different groups, each responsible for the collection of organic waste from a specific area/zone. Each group consists of four or more women.
Local Communities: The Women's Composting group is highly related and dependent on the surrounding local communities, whose role is to supply the organic waste produced within their area to the CBO. The group primarily collects community organic waste and has developed collaboration networks with local city markets in order to access some fractions of the organic waste generated in that locations.
108 The Botswana Recycling Guidelines 2012 Advice on Valorisation for Middle-Income Countries
The relation developed with local communities is bilateral since the communities are also benefiting from the activity of the Women's CBO. Primarily, composting the communal organic waste is a sound environmental management activity which results in larger amounts being diverted from being dumped or local landfills. Additionally the operations of those women provides an indirect way of raising awareness for environmental issues within the community. The community has observed the positive effect of the women's activity and the level of involvement is constantly increasing. A type of waste that has been until now dumped or burned, is in this way recovered and considered a resource within the community. Furthermore the CBO is offering employment opportunities for the women, who make their own living and are practically demonstrating women's ability to undertake entrepreneurship roles. There is also a small but not negligible number of farmers who is occasionally requiring quantities of compost for applying at their crops.
The City Assembly: The role of the City Assembly with regards to solid waste management are primarily to formulate and implement solid waste policies as well as to provide services for the collection, transportation, treatment and disposal of solid waste with the city of Lilongwe. Within this commandment the city assembly is responsible for monitoring private companies engaged in solid waste activities.
The initiative of the City Assembly to develop a PPP model for the area of Mtandire has been the cornerstone of the creation of the Women's CBO. Consequently, even though on a day-to-day basis the City Assembly is not monitoring or interacting with the CBO, it benefits from its operations by having a cleaner living environment. Due to the lack of financial and technical resources, the Assembly has a high stake in maintaining and supporting the group. Additionally, the City Assembly is highly interested in registering the Women's group, in order for them to have a legal standing and be able to access more sources of organic waste.
The Ministry of Local Government: The operations of the composting CBO are also related, in theory at least, to the activities of the Ministry of Local Government since this is the designated institution for providing permits and licenses to solid waste operators as well as monitoring their activities. However, the CBO is not yet registered.
The Four Seasons Nursery: This large private horticultural company has a considerable stake and interest in the CBO's operations since it is its only client. The nursery has agreed to purchase the majority of compost produced from the women, provided that it meets their specifications. They train the women and promote compost as a soil conditioner.
The System Elements The Women's Composting CBO business model includes the following elements of a typical waste management system: generation, collection/transportation and treatment.
Generation: The main supplying sources of organic waste for the CBO include city fruits and vegetables markets and households. In the case of the Women's CBO the supply locations are spread around the community and the flow of materials is not consistent in time, volume or quality. In any case, 100% of all organic waste accumulated for the CBO's use comes from the community.
For the women to respond to the challenge of not consistent supply they have started investigating collection to areas which are more distant to their usual collection locations. The women are currently facing an additional challenge with regards to the scarcity of organic waste in the area. Since they have proven that composting of organic waste is a profitable operation, the amount of women interested in participating is increasing , resulting in higher collection rates and less organic waste available in the streets.
Collection/Transportation: The collection model for the Women's Composting activities are basic and restricted to collecting themselves directly from markets or other sources. They are separated in four groups, each group responsible for collection in one area or zone, in order to avoid overlaps. They collect in average 2tonnes per day of organic manure and they use push carts for the transportation process. They cover around 5-7klm per day. However, due to the
The Botswana Recycling Guidelines 2012 Advice on Valorisation for Middle-Income Countries
109
scarcity of materials, as mentioned before, the women are collecting materials at distances of 10 km from the processing facility.
Treatment: Once the organic waste is collected by all groups, they transport it to the main processing facility where the composting process is taking place. The facility consists of an open air location of approximately 2 acres. The process is open air, static pile composting. It involves basic biological and manual activities like piling, mixing, turning and maturing. The overall composting process is lasting one month. The equipment used throughout all the individual stages of the process are quite basic, including shovels, gloves, plastic nylon covers for the piles and few small carts.
Part of the treatment operations includes mixing, during which the group is adding maize husk (the outer part of maize) or cow dan, in order to enrich the mixture and produce a compost with more nutrients. The technical characteristics of the compost are currently being researched by the University of Malawi.
The final product is packaged in wooden boxes provided by the client itself, the Four Seasons Nursery. Transportation to the client's location is done by the client itself.
The System Aspects Technical: The technical characteristics of the Women's Composting CBO operations refer more to the indicators that represent the technical performance of the group. To this respect,
Product Types: The only product is compost. Production Volumes: 0.5tonnes per day of compost (≈14tonnes per month) Production Time: 1 month
The main technical challenge the CBO is facing is related to the facility currently used for composting. The facility is an open-air field with no protection from weather conditions. The CBO with the support of CCODE is currently planning to build a roofed facility, which will protect the windrows from both rain and sun.
Financial: The finacial aspects refer to the finacial performace of the Women's Composting group as a Community Based Organization. The start up capital needed was not very high and regarded only basic equipment for mixing, turning and covering the compost piles. At the initiation phase, the Women CBO was supported by CCODE, which provided a loan to the group from its own revolving fund, locally called “Mchengapi” Fund. The women were able to repay back the loan within almost two years of operations.
Yearly turnover: 40,000 Malawi kwacha Product Price: 100-160 Malawi kwacha External Source of Finance: Loan from a revolving fund Salary per member: 2,000-3,000 Malawi kwacha per month (about US$300)
Socio-cultural: The activity of these women has raised awareness not only from the environmental side but also from a social point of view. Usually, women in Malawi remain marginalized compared to men. Women have less access to education, credit, land and property. In addition they have less access to employment opportunities both in the public and private sectors, technology and other key market information to support their business activities. Due to lack of experience, very few employers are willing to recruit and train them on the job. Thus, the Women's CBO has demonstrated the ability of women to be involved in income generating activities which benefit not only themselves but the community as a whole.
A specific challenge encountered currently is the fact that more and more women would like to get involved in the CBO. This represents a new challenge for the women of the group, since this means that they will have to collect waste from even further locations.

110 The Botswana Recycling Guidelines 2012 Advice on Valorisation for Middle-Income Countries
Institutional: The CBO is receiving significant support both from the City Assembly and the Academic Institutions of the country. The activities of the group are perceived as positive for the overall community and every possible effort is provided. The City Assembly is undertaking efforts to register the CBO and creates the enabling environment for the cooperation with the Four Seasons Nursery, in order for the CBO to have at least one client to buy the compost. Additionally academic institutions, like the University of Malawi, are conducting waste management baseline and market researches in order to identify the framework withing which the CBO is and should be operating.
Environmental: The environmental benefits of the women's activity are viewed as positive for the community. They contribute to a healthier living environment by dealing with the organic wastes and by liberating community members from undertaking burning or burying tasks for their waste. The net environmental impact of the CBO's operations is positive due to the small-scale of operations and the absence of electrical equipment in the production process.
Policy and Legal: Land is a basic factor of production as well as an important source of livelihood for most Malawians. There are three legally recognized types of land tenure in Malawi: customary, private and public. Customary tenure is the most widespread category. However, other sub-tenures that are commonly practiced by customary landholders (renting and borrowing are not legally recognised. Registered private land (freehold and leasehold) accounts for less than 8.0 per cent of the land area. Inadequate access to land has been identified as one of the critical factors contributing to poverty in the country. Additionally discrimination in access to land based on social status, economic status and gender is a major constraint.
The CBO has resolved this challenge with the support of CCODE. The land used for hosting the CBO belongs to CCODE and the women have the right to use it without any charge, as part of the cooperation of CCODE with the Malawi's Homeless Federation.
Table 13. Partial SWOT analysis
The Strengths: The Weaknesses:
No significant operational costs Lack of stability/continuity of the workforce
Easy Initiation phase Not profitable without a ppp or external support
No need to pay taxes Access to finance from financial institutions is impossible.
The benefits are staying within the community. If left without technical support is bound to fail
Easily replicable business model that might create unfavourable competition.
16.9 Activity: Combining rural organics management with empowerment opportunities
There are many opportunities to work on organic waste in combination with OIPELEGENG an Empowerment programmes. There could be a great synergy with the process of developing product recognition and markets for compost in Botswana. For this to work, the degree of composting expertise within the Social Affairs Ministry needs to be built up, or, in contrast, PPPs need to be set up with existing or to-be-developed composting businesses.
Results: a. A manual for composting as an empowerment activity is developed by the Department,
the Agricultural University, and an international consultant b. Councils compete to operate a pilot c. Experiments are supported for composting on landfills, cattle posts, and unused urban
lands d. Compost is produced
The Botswana Recycling Guidelines 2012 Advice on Valorisation for Middle-Income Countries
111
e. The Agricultural University develops a plan for two years of testing of the compost on yields, water retention, soil quality
f. Demonstration sites are built using Empowerment and IPELEGENG workers g. Mines in different areas agree to be the “buyer of last resort,” in case the compost has
nowhere else to go h. A two-year demonstration project is completed and the results are presented i. Composting is recognised as the main waste management strategy for rural areas.
16.10 Case story: terreautage in Mali
Mali, like Botswana, is a dry country. In the Sahel, it rains seldom and the soil is poor in organic substances. Much agriculture takes place in the river bed and flood plain areas.
To enrich the soil and add nutrients, both waste companies and farmers engage in the practice of terreautage. Raw waste, which in Mali is 40% by weight sand, grit, and sweepings, and 55% organics, is screened lightly to remove plastics, and then sold to farmers. The farmers spread it directly on their fields. The result can be unsightly, because so much plastic remains, but the terreau is effective in improving the soil. Why do you think that this practice spoils the market for compost?
16.11 List of references specific to this guideline
Sandec:
www.eawag.ch/forschung/sandec/publikationen/swm/organic_waste_management on organic waste management
www.eawag.ch/forschung/sandec/publikationen/swm/market_demand on marketing compost
Scheinberg, Anne, et al (2011). Sustainable valorisation of urban organic wastes. Insights from African Case Studies. Agricultural Economic Institute (LEI), Wageningen University, Wageningen, the Netherlands
112 The Botswana Recycling Guidelines 2012 Advice on Valorisation for Middle-Income Countries
Chapter 4. Guidelines Relating to Finances and Fees
17 Guideline 17: Willingness to Pay for Waste Collection Services
17.1 Goals
The goals to be achieved with this guideline are:
1. De-mystifying the issue of willingness to pay in relation to waste collection services 2. Bringing the economic issue of payment into the same frame as the social issue of
appropriateness and affordability, and the operational issue of reliability 3. Providing key information necessary for making decisions in relation to payment
systems.
It is not the goal of this guideline that the reader will be able to implement a willingness to pay study, which is a rather technical project. The goal is rather to build the capacity to hire and manage an economist from the university or a consulting firm who will do such a study, and to help them avoid the usual pitfalls about applying this economic tool to the waste management and recycling sector.
17.2 What is this guideline about?
This guideline is about the relationship between users of a waste collection service and the service providers and system managers. In Botswana the users are households, businesses, and industries, also called waste generators. The providers are Councils, but also their designated private sector agents, and some private companies who work for Councils or commercial, institutional and industrial clients.
Explanation: The point of departure for this Guideline is that during the inception phase and stakeholder consultations, it became clear that households are paying too little for waste management services, because Councils do not trust the households to pay. The implicit assumption made by Botswana politicians is that there is little or no willingness and ability to pay for waste services at a level that covers costs of collection and disposal. The consulting team believes that there is much more willingness and ability to pay than the politicians think, and advises the Department (with potential support from UNDP) to do a willingness and ability to pay study to explore this.
A willingness-to-pay study is often demanded by the World Bank or other multi-lateral lenders or donors as a condition of receiving a capital investment loan for infrastructure. The implicit assumption behind such a condition is that the lender wants to know that the borrower can raise the funds to pay back the loan by getting the system users to pay for the service they are getting.
17.3 Topic: Economic demand and willingness and ability to pay
Users of a system are willing to pay for services for which there is economic demand. Economic demand means that there is a clear relationship between a price for a good or a service, and someone is willing to pay that price to get that service. Economic demand is not the same as needing something: children might need schoolbooks (or their parents might think they need them) but not be willing or able to pay for them. The same children might be willing to pay for Coca Cola or candy even though they do not actually need to or actually benefit from consuming these things.
Ability to pay – also referred to as affordability – is closely related to willingness to pay, but it is not the same thing. When I have a third or fourth child, I might be willing to pay for a bigger house, but if my salary is too low to cover feeding and clothing all my family and paying to rent that bigger house, I do not have the ability to pay, and the house is not affordable. In these times, many people use credit cards or bank loans to pay for things which they are willing to pay for but which for them are not affordable, which creates the types of financial crises we are now facing.

The Botswana Recycling Guidelines 2012 Advice on Valorisation for Middle-Income Countries
113
In the water, transport, education, or housing sector, there is truth in the implicit hypothesis behind a willingness-to-pay study is that users want the service and can pay for it, especially if they cannot get it anywhere else without paying. The benefit that households or businesses are willing to pay for is the water, or the shelter, the transport from point a to point b, or the ability of their children to attend quality schools. This is a demand for a positive economic good.
Economic demand for services the waste sector does not work precisely like economic demand in housing, water, or transport. The demand for waste services is to remove a negative economic bad, which is waste, or excreta, or dirty water. The benefit is the lack of the waste, and the service is the removal of that waste from in or near the household or business.
A second way that economic demand for waste services is different is that it is quite easy to get the benefit without paying, if the user is willing to take their waste and dump it in the bush or in a river or the sea, to bury it at the back of their compound or cattle post, or to burn it so the pollution goes into the air, or even just to drop it in a ditch on the way to work. In this case the river or the sea or the ground are called sinks. The word “sink” describes the specific part of nature that receives the waste and is expected to absorb it. “Sink” is an important concept in waste management, because it describes the function of disposal facilities.
Even in the poorest countries like Mali, households will pay for someone to remove their waste, not because they cannot do it themselves, but because it is convenient, and it contributes to meeting cultural ideals of comfort, cleanliness, and convenience. Waste collection also provides an individual benefit for households an businesses. For these two reasons, experience indicates that there is virtually always economic demand from users for direct removal services such as waste collection or latrine emptying. For this reason, there is a strong expectation that there is willingness and ability to pay for waste collection, especially when the users have some influence on the way the service is provided. Trust and reliability also has a lot to do with willingness and ability to pay for waste collection: when users know that the waste will be regularly removed and their streets will be clean, their willingness to pay goes up. In relation to demand for collection services, a willingness-to-pay study can be useful to determine the level and focus of that demand.
But there is no functional user demand for disposal, or safe, controlled sinking (unless there is a sudden environmental emergency). One reason for this is that outside of a crisis, there is little individual benefit in safe disposal. Most people are not confronted with a disposal facility next to their home, so they do not care much about where the garbage goes. For diffuse benefits, societies depend on their elected government officials to represent the (weak) collective demand for better public health, cleaner cities, and unpolluted sources of drinking and cooking water. In Botswana, the demand for a sink for waste – that is, for controlled and effective modern disposal – comes in general from Councils and the Department and the Ministry and other governmental stakeholders, who receive complaints about dirty cities, who are working on better business climates and economic development, and who are in contact with global ideas about good practice and who receive advice from professional engineers, solid waste consultants, and donor organisations. That is part of the reason why guideline 6 states that Councils should pay for disposal, because it is Councils who represent the demand for better-functioning and cleaner districts.
17.4 Topic: Is there gold in the garbage?
During the inception phase, a number of key stakeholders stated that “someone will buy our garbage” or “in Sweden garbage is worth €100 per ton for a waste to energy incinerator.” This is based on a misconception. Garbage, mixed together in a compactor truck, has no value and under normal circumstances no-one will pay for getting garbage, only for removing it. In Northern European countries, Councils or private waste management companies receive a yearly waste management fee of about €500, to remove the waste from households. Then they pay about €100 – €200 per ton to dump it at a landfill or, in some countries, to burn it in an incinerator.

114 The Botswana Recycling Guidelines 2012 Advice on Valorisation for Middle-Income Countries
The incinerator is a form of sink, in that it reduces the volume of the waste, and puts residues into the ground and into the air. Most European incinerators also use oil to fire the waste (which doesn‟t really burn on its own), and recover some of the capital and operating costs by re-directing the heat produced in the burning process to generate energy. However, without the per-ton payment for disposal, they would not be able to break even and the incinerators would not be sustainable. The cost of incineration pays the district or provincial government to build, maintain, and operate the incinerator. Every entity that dumps waste for burning pays, so all of the Councils and City Authorities and private companies have an incentive to divert part of their waste from disposal to recycling, composting, or other forms of valorisation.
In short, there is no gold in the garbage, but there is some money to be made by removing it and safe sinking it, if the right payment systems exist.
17.5 Activity: Community payment consultation: what do people want to pay for?
Explanation: A classic willingness to pay study is a survey and a game, in which the household or business is treated as a kind of enemy that needs to be tricked into an answer. It is a survey because you ask people to answer questions, and a game because the order of asking the questions often determines or steers the answer. A classic willingness to pay study describes the service, and asks: “would you be willing to pay 500 pula per month for your waste to be collected each week”? If the respondent says yes, then the next question is if they would be willing to pay 1000 pula, while if they say no, the next question is whether they would be willing to pay 400 pula. You keep playing the game until you find the place where they won‟t go higher or lower.
In the ISWM approach to willingness to pay, we take the game part out, and treat the households or users like partners. We consult with them openly to find out what is working and also what is wrong with the current waste system and the service that they receive (or don‟t receive). We go for discovering what the respondents most want to fix in the waste management system, to get the focus on where their personal demand lies. We ask them if they are already paying, or not, and why. Then we ask what they are or could be willing to pay for, because if they aren‟t getting something, maybe the service providers simply don‟t know about it or haven‟t thought about it. And last, as an open question (not a game), we ask them to write down on a small card, the amount that they are willing to pay per week or per month, and the specific services that they have identified that they would be wiling to pay for.
Results: a. A consultation with the stakeholder platform, valorisation reference group, or
committee has been conducted around the issue of willingness to pay. b. The Department and Councils have agreed that a willingness and ability to pay study is
necessary for some categories of users. c. A preliminary visit to a few households in each district has tested the kinds of
questions and answers that might work, with a focus on: what is working and what is not in your waste service? are you paying? (Is your neighbour paying, do you think?) what would you like to see happen in relation to the waste service? What do your
neighbours want? what would you be willing to pay (more) for? (written down on a card) how much would you be willing to pay for that specific
service? d. These issues have been documented and analysed. e. The stakeholder platform is consulted as to their ideas as to how to use to frame the
willingness and ability to pay study. f. The Terms of Reference for the Willingness and Ability to Pay study has been
produced.

The Botswana Recycling Guidelines 2012 Advice on Valorisation for Middle-Income Countries
115
17.6 Activity: Contracting and implementing a willingness to pay study to produce a
plan for introducing new fees and tariffs
Results: a. A statistician or sociologist has been contracted to design the sampling protocol, to
know how many households should be surveyed, and to determine how they are to be selected.
b. The statistician has also advised whether or not to announce the study, and how to phrase the announcement, so as not to skew the responses.
c. Data collectors have been recruited and trained. Data collectors can be professionals, volunteers, students, IPELEGENG participants with at least their O-levels, members of civic or environmental groups, or any combination of the above. NB: data collectors should be advised to dress modestly to fit in with the communities they are visiting.
d. The dates and logistics for the survey have been determined, arranged, and announced consistent with the advice of the statistician/sociologist.
e. The spreadsheet or data base for receiving the data has been designed based on the preliminary visit.
f. The survey has been conducted for one day in the week before the main survey.
g. After that first day, the instrument has been refined in response to what is learned.
h. The survey has been conducted and the data has been analysed.
i. The conclusions and new ideas have been presented to the stakeholder platform for discussion.
j. The stakeholder platform or committee has made a recommendation as to how to develop payment systems based on the results of the study.
k. The Department or its consultants have made a plan for introducing fees and tariffs in a phased process.
17.7 Case Example: User Pay in the Maldives
Explanation: The above methodology was co-developed with WASTE and Green Partners in a 2009-2010 User Pay project in the Republic of the Maldives, an Indian Ocean archipelago of 1000 small islands to the Southwest of India. Each island has its own Island Waste Management Centre (IWMC), generally an open dump on the shore which is burned over every day. The exception is Mal‟e, the capital, which is very densely populated and has only a depot/transfer station, with the dumpsite on a separate island.
Women are the waste managers in the Maldives, and they take their household waste to the IWMC each couple of days in a wheelbarrow. Since the islands are not more than 2 km in diameter, the distance to take a wheelbarrow is not extreme.
At the time of the User Pays project, there had been a willingness to pay study but its results were not so clear, so the User Pays consulting team was asked to do some work in this area. We visited households and asked the series of questions above. Some surprising things emerged.
1. The women knew what they wanted, the men did not, because the women culturally were the waste managers.
2. They wanted to pay for an attendant at the IWMC, to help them empty the wheelbarrow 3. Women wanted to be able to pay to opt out of the community-based voluntary street
sweeping system. 4. In some cases they wanted to simply wanted to be able to pay for a waste collection
service so they could stop going with wheelbarrows. 5. There was wide agreement about the “right price” per week for waste service. Consistent
with global information, this “right price” translated to about 1% of the family‟s weekly income.
6. People preferred to pay a private collector directly, rather than paying the Island or regional administration.

116 The Botswana Recycling Guidelines 2012 Advice on Valorisation for Middle-Income Countries
7. On some islands, people preferred to do more work themselves, and pay less.
On the basis of these results, the consultants designed an excel model that the islanders themselves could use to determine the level and type of service on each island, and the fee for it.
17.8 Topic: Willingness to pay in rural areas and cattle posts
For Botswana - give the sparse population in the rural areas and cattle posts, we may want to consider whether and what sort of willingness to pay research is necessary, especially given that some of the households may argue that they do not need to have their waste removed as they have huge parcels of land - which is sufficient enough for them to handle their own waste disposal. In other words for some rural communities, there may not be economic demand even for collection. There are several ways to address this.
Master Composter is a strategy for individual households to manage and include the re-usability of their own waste. Like other kinds of valorisation, separation at source helps, as does some kind of value chain. Making and using compost is potentially interesting in and for cultivation areas, not for the fertiliser value, but because of the water-holding and nutrient-banking properties of compost.
Feeding animals with organic waste is almost certainly a main strategy for waste management in those areas.
Some of the lessons from the Maldives also seem relevant, because even though the ecosystem is completely different, there are certain similarities based on having highly dispersed small population clusters with a lot of ground – or in the Maldives case water – to be covered with fossil fuel to get from one to the other. It doesn‟t matter so much that the diesel is used for motorboats there and pickup trucks in Botswana, the situation is somewhat similar.
For rural Botswana, therefore, we would suggest that in combination with a PAYT programme that introducing a choice: to pay or to do it yourself, alone or in groups – might be a relevant and interesting idea for rural councils. The “do it yourself” could include, for example, bringing your neighbour‟s recyclable and non-recyclable materials to the district landfill once per week if you are going that way; spending a half day a week cutting wood at the wood drop-off at the landfill, or other types of activities.
In combination with household management practices, such as composting or animal feeding of organics, the district Councils with large rural areas can help their residents by programmatic initiatives increasing repair, creating “exchange” depots for durable goods and clothes, minimising plastics, organising depots for recyclable materials in the parking lot of the supermarket, and the like. This, combined with a PAYT system of landfill fees – also for individual households, would mean that rural families would have so many opportunities to divert from disposal that what they need to pay would be minimal. Therefore also some kind of survey, because it is especially important to hear from them precisely what they think they need to pay for.
17.9 Case Example: failed community survey in Topoli, Bulgaria
In 2005 WASTE was involved in a Dutch-financed project in Bulgaria, with a focus on village-based waste management and sanitation. The Bulgarian partner, Institute for Ecological Modernisation, organised a community survey in the village of Topoli, near the City of Varna. While the survey was more focused on organic waste, there were some questions also in relation to willingness and ability to pay.
Two researchers from the University were contracted to do the study. They were women in their mid-20s who liked to dress in a very urban and stylish way. Although Topoli is close to Varna, there the culture is quite rural, people dress conservatively and informally.
The Botswana Recycling Guidelines 2012 Advice on Valorisation for Middle-Income Countries
117
In spite of the instruction to dress conservatively, the two young women researchers showed up for the first day of surveying in spike heels, extremely low necklines showing a considerable amount of décolletage, tight dresses in very bright colours, gold jewellery, and fancy hairstyles.
During the first day, the researchers got a really startling number of refusals to participate, so many that the project manager had to intervene. He went to some of the village councillors and a few known households to see what was going on. The answer came back that there had been an article in the newspaper about kidnapping of children for human trafficking in child prostitution. The way the women had dressed created the impression that they were from the city and alien to the village environment. The villagers put two and two together, and concluded that the two young women were scouting for families with children to give information to the kidnapping ring, and so they refused to talk to them.
The team re-arranged the survey, and held a meeting at the cultural centre to explain. After that the surveyors were required to dress modestly and professionally, even if they did not want to.
17.10 Case Example: Willingness to pay in the 1997 JICA study in Nairobi
In 1996, JICA did a solid waste management plan for Nairobi, Kenya. The idea of paying for services was not common, and they did a willingness to pay study that showed limited or no willingness to pay, especially in low-income housing estates. But they also registered widespread dissatisfaction with the heaps of waste everywhere, the fear of disease, and the general lack of cleanliness.
The JICA team made an experiment. They chose some housing estates that were high, middle, and low-income. They informed the residents and the study team paid for a reliable collection service for three to six months, which was either unpaid or paid at a very low level. After six months of enjoying clean living areas, the willingness to pay was well above the cost of providing the service. Residents were especially positive about the reliability of the service.
17.11 List of references specific to this guideline
This guideline owes much to the work of Environmental Economist Reba Shoos. Ms. Shoos and her work are to be found at www.greenpartners.ro.
MATRA project in Bulgaria, WASTE, Advisers on urban environment and development, Gouda, the Netherlands.
Solid Waste Management Plan for Nairobi, Kenya. JICA, Japanese International Co-operation Agency, 1997.
Marchand, Rogier (1999). Paying for solid waste services in Bauan, the Philippines. WASTE, Advisers on urban environment and development, Gouda, the Netherlands. Available from www.waste.nl or www.wasteportal.net.
Shove. Elizabeth (2004). Comfort, Cleanliness and Convenience: The Social Organization of Normality (New Technologies/New Cultures). Berg Publishers, London, UK.
Scheinberg, Wilson and Rodic (2010): Solid Waste Management in the World‟s Cities. UN-Habitat‟s Third Global Report on the State of Water and Sanitation in the World‟s Cities
118 The Botswana Recycling Guidelines 2012 Advice on Valorisation for Middle-Income Countries
18 Guideline 18: Analysing Costs and Setting Tariffs
18.1 Goals
The goals to be achieved with this guideline are:
1. To present different modalities of waste management fee systems 2. To determine the costs related to waste management services 3. To set up fees that reflect the real costs of the service 4. To provide an example of fee setting
18.2 What is this guideline about?
This guideline aims to provide an understanding of basic concepts related to fee setting for waste management. It provides some information of different modalities of fees, list of costs that should be taken into account when developing a fee for the users of solid waste management services and an example of a fee development in Peru. For purposes of this guideline, a fee is considered to be a fixed sum charge, as by an institution, and a tariff is a tax that the government charges on goods that enter or leave the country. Some countries including the Netherlands also use the word “tariff” interchangeably with the word “fee”, and we do that here as well.
18.3 Topic: Tariffs and service fees
Explanation: During the inception phase, it became clear that Botswana stakeholders are paying too little for both collection and disposal. Much collection and all disposal is under-priced, and some Councils do not feel that they can (politically) afford to charge users for a waste service which the Council officials feel is inadequate. Councils also do not charge themselves or their agents for disposal.
In this situation, there is a downwards spiral of broken-down trucks, delayed collections, unsatisfied clients, illegally dumped waste, and the like. In order to generate sufficient revenues to cover the costs of solid waste service, it is necessary to have a clear understanding of the actual costs associated with providing the service. This is difficult as the Ministry of Transportation takes some costs, and the Councils take others, and there is not a unified budget or cost analysis.
Botswana is a middle-income country, but there are also a goodly number of poor people living there, and in rural areas and in the North there are a shortage of jobs. While most settlements have some form of solid waste services, their performance may be inadequate or erratic. When defining fees for waste management, the municipality must consider that the services must be sustainable, environmentally friendly and have fair fees which are easy to collect and adapted to possibilities of people. In some countries the fee is based on user‟s categories: high, middle, low and very low income. The municipality must define if the tariff will be differentiated or it will be the same for all. In case of a differentiated tariff, the municipality must be able to identify the different economic strata of the city. In some countries electricity consumption is used as an indicator of the income of the families, in other countries the values of the properties are used.
Here are some variations:
Tax : determined by property area, consumption of water or electricity. Flat rate fee: the fee is paid regardless of the amount of waste. PAYT, pay as you throw, or a container tag fee system: the fee is based on the volume
of the container bin, the size of the bag used, or the weight. Linear or neutral: each collection unit (bin, container) costs the same independently of
the units. Regressive or passive: the second collection unit set by the same user costs less than
the first. Progressive or active: the second collection unit set by the same user costs much more
than the first.

The Botswana Recycling Guidelines 2012 Advice on Valorisation for Middle-Income Countries
119
The following costs for the services must be taken into account.
1. Fee: a fixed sum charge, as by an institution. 2. Tariff is a tax that the government charges on goods that enter or leave the country; in
this guideline we also use tariff and fee interchangeably. So also a fee or fee system. 3. Direct costs: Personnel Services: Salaries of waste workers, maintenance, social taxes.
Non personnel services: grounds and buildings purchase, leasehold, or rent, insurances of personnel and fleet, maintenance and reparations of waste equipment. Materials: fuel, additives, tires, batteries, personal equipment for workers (shoes, gloves) and finally the cost of waste final disposal. Currently in Botswana many of the costs are not included in the actual Council budget.
4. Indirect costs: Administration: Administrative personnel. In some cases depreciation is taken under indirect costs, but is safer to put it under direct costs.
5. Financial costs: Interest, bank fees, lending commissions, transaction fees 6. Development costs: an estimated 10% of the total costs and it is used for development
of new services or improvement of activities. 7. Capital or investment costs: Purchase of equipment or real estate, construction costs
of facilities.
18.4 Case example: “Fee setting Cañete, Peru”
Cañete is a peri-urban city in Peru. During the implementation of a four year programme, one of the main activities developed was the development of the tariff for waste management services. IPES (NGO based in Lima) together with the Municipality of Cañete determined the costs of the service and followed a procedure to establish a differentiated tariff that was connected to the value of the property.
The detail description of the costs will be found in the following pages. They determined the types of houses and businesses. They identified, using a sample of the population, the amount of waste produced by different service users. Based on the information they developed a differentiated tariff.
18.5 List of references specific to this activity
Chapter XVI. Financial arrangements for solid waste management. Available at http://www.unep.or.jp/ietc/publications/spc/solid_waste_management/Vol_I/24-Chapter16.pdf [Accessed 12th September 2012]
IPES. 2010. Report on activities developed under the ISSUE 2 Programme. WASTE, the Netherlands.

120 The Botswana Recycling Guidelines 2012 Advice on Valorisation for Middle-Income Countries
Figure 12. Costs structure for fee calculation

The Botswana Recycling Guidelines 2012 Advice on Valorisation for Middle-Income Countries
121
Figure 12. Costs structure for fee calculation (continued)

122 The Botswana Recycling Guidelines 2012 Advice on Valorisation for Middle-Income Countries
Figure 13. Indirect costs and administrative expenditures

The Botswana Recycling Guidelines 2012 Advice on Valorisation for Middle-Income Countries
123
Figure 14. Fixed costs

124 The Botswana Recycling Guidelines 2012 Advice on Valorisation for Middle-Income Countries
Figure 15. Classification of types of building

The Botswana Recycling Guidelines 2012 Advice on Valorisation for Middle-Income Countries
125
Figure 16. Monthly payment according to type of building or commercial activity

126 The Botswana Recycling Guidelines 2012 Advice on Valorisation for Middle-Income Countries
Figure 17. Public cleansing monthly payment fee

The Botswana Recycling Guidelines 2012 Advice on Valorisation for Middle-Income Countries
127
19 Guideline 19: Financial Incentives, Tools, and Policies
19.1 Goals
The goals to be achieved with this guideline are:
1. To provide information on the types of financial incentives, tools and policies for solid waste and valorisation that are common in high-income countries
2. To explore the appropriateness of these tools and policies for introduction into the Botswana system of waste management.
19.2 What is this guideline about?
This guideline is designed to provide an orientation to financial tools for the staff of the Department and the Councils, Rather than a detailed description, the guideline offers a of menu of financial incentives, tools and policies. Some of them have been touched upon in other guidelines. Neither the list nor the descriptions are exhaustive, but they provide a kind of direction for further investigation. Here is a quick look at the most interesting:
Table 14. Overview of some key tools and incentives and the part of the waste system they apply to
Tools Definition Purposes, Effects, Implications
Related policy and impact
LANDFILL Tipping fee
A payment usually per tonne made to the landfill operator to dispose of waste at a disposal or treatment facility. In some cases tipping fees are also charged at MRFs and composting facilities.
To pay for the use of the sink at the disposal facility, but also to establish the value of managing waste safely and to provide incentives for valorisation
Municipal inclusive recycling, internalising the negative externalities of waste generation and disposal
LANDFILL Landfill surcharge
A financing mechanism paid to the local authority, but collected by the landfill operator, for investment in recycling or valorisation infrastructure. An extra, usually temporary fee is added to the tipping fee, to pay for developing valorisation.
It increases the incentive to avoid disposal, at the same time that it finances the development of valorisation infrastructure
Municipal inclusive recycling, diversion or recycling goals that require 50% or above prevention, repair, reuse, recycling, com-posting, other valorisation
RECYCLING, COMPOSTING, ORGANICS Diversion credit
A transfer payment from the solid waste system to the private or NGO operators of valorisation enterprises. This is an output-based aid (OBA) mechanism to reward non-state actors for their performance in successfully re-directing materials from the waste system into real agricultural or industrial value chains.
Diversion credits reward private sector value chain performance that increases the per cent of materials to be valorised, to develop or expand markets, or to co-finance the “gap” between the negative externality and the positive intrinsic value of type 3 &4 materials
Price supports, variable price contracts, EPR arrangements, organic waste diversion, composting market development, mine land reclamation, import substitution for ag products
COLLECTION Volume-based fees, pay as you throw (PAYT)
An approach to tariffs and fees for collection that divides the fee into a fixed “capacity fee” and a variable “volume fee”. The volume-based fee gives an incentive to throw less away, while the capacity fee makes sure that the Council earns enough money to keep the basic system operating even if all users successfully reduce their disposal needs to nearly zero through preventing waste, better maintenance, &/or diverting to valorisation.
Users pay for each bag of waste they throw away. In Africa PAYT usually works by the providers selling bags at a price that includes the cost of collection and disposal.
Municipal recycling, in conjunction with “enterprise fund” financing for collection, valorisation and disposal at Council level. Fines for littering, together with active enforcement against illegal disposal in the first two years of the system create good habits, after that it is not necessary.

128 The Botswana Recycling Guidelines 2012 Advice on Valorisation for Middle-Income Countries
Tools Definition Purposes, Effects, Implications
Related policy and impact
MANAGEMENT Enterprise funds, public authorities. dedicated funds
This is a governance tool that creates semi-private or private-like entities to operate waste management systems on behalf of Councils or Districts. Usually part of the budget comes from taxpayer sources, and part from both service fees and materials revenues, if any. A separate, dedicated bank account that can only be used for waste management functions is key to making this kind of arrangement feasible.
Output-based aid, performance standards, and transparency are necessary to make this model work. The enterprise fund has to be strictly reserved for waste and valorisation investment and operation, but it is possible to arrange the revenue streams so that some funds also go to the general fund.
Decentralisation, regionalisation, PPPs, government control, landfill minimisation, unwillingness to give control to the private sector.
PROCESSING loan guarantees or PPP shares
Sources of debt financing for private sector valorisation that relies on the Council to guarantee the loans, that is, to ensure that the private entrepreneur does not default. A variant is for the Council to actually purchase shares in the private company
Requires a level of trust and willingness of the private party to report and disclose their finances to the Council or Department
Mandatory and actively enforced recycling and diversion goals above 50% of the total waste, and also for C&D and commercial materials.
COLLECTION micro-franchising
Known globally as “the Dar es Salaam system,” micro-franchising uses the personal relationship between micro and small enterprises, NGOs and CBOS and their clients to fill service niches in cities where public collection systems are under-funded or lack capacity or resources. The Council manages the allocation system for routes or zones and may co-finance equipment and communication; micro private service providers collect and take to public or private transfer/ MRF. A zonal franchise gives right and obligation both to collect the fees and to provide the services.
Is an alternative to large-scale multi-national privatisation that relieves the burden on Councils but keeps more control and accountability with citizen committees, the Council, and local stakeholders and users.
Integration of the informal recycling sector, social enterprises, Empowerment, youth and women‟s‟ groups economic development, municipal inclusive recycling
COLLECTION, RECYCLING Waste ventures: micro- and meso-loans /guarantees
Economic development or donor funds are used to leverage private bank financing for micro, small, and medium-sized enterprises in valorisation and waste services. Sometimes this works well in conjunction with disposal surcharges as an extra source of financing, or with advanced disposal fees coming from EPR systems.
Local commercial banks can apply for third-party guarantee funds that allow them to lend to high-risk micro and small enterprises, co-operatives of informal recyclers or women and youth groups who have approved business plans.
IPELEGENG, Empowerment, integration of the informal sector, value chain inclusive recycling
19.3 Case example: DifTar in the Netherlands
The integrated cost of waste management in the Netherlands is set by national policy, which requires all municipalities to minimise disposal to landfill, aim for 83% recycling and composting, and charge a flat fee to households. In 2012, this fee is between €400 and €500 (US $500 to US $600) per household. About 20% of Dutch municipalities are working with a reduced form of PAYT, called DifTar, or Differentiated Tariff. In these municipalities, a charge of €1 per 120-litre bag or container is introduced, and of €52 per year is deducted from the yearly fee. So the household flat fee is then of €348 instead of €400, and if the household uses one bag per week they come out even. Otherwise they pay more for more waste, or less if they really separate well, based on and assumed one bag or container per week, at a cost of €1 per container.

The Botswana Recycling Guidelines 2012 Advice on Valorisation for Middle-Income Countries
129
The household can maximise their use of the curbside organics collection, the recycling and packaging depots, and the periodic paper and household hazardous waste collections, and thereby reduce their waste system payment by putting out the residual materials less frequently than once per week. The municipality assures that they collect most of the money anyway.
19.4 Case Study: PAYT in Tompkins County, New York
Courtesy of Micro Services Plus, Sebastopol, California, Tompkins County New York Solid Waste, and the USEPA
In 1988 the landfill for Tompkins County, home of Cornell University in Ithaca, New York, like many others across New York State, was closing. Although a site within the County was available, the reflection and discussion around a 20-year solid waste plan cast doubt upon the wisdom of investing in a landfill, for two main reasons. First, the costs of building a local landfill for the County‟s 100,000 inhabitants did not seem to match the benefits, especially since secondly the amount of moderately priced private landfill capacity within a radius of 75 miles was growing rapidly. . The County decided to invest in what they really wanted, a high-performance recycling program which could grow through the years. So in terms of investment in infrastructure, the decision was made to concentrate on plans to build a integrated Recycling and Solid Waste Management Centre (RSWC). This facility had an innovative approach to diversion, by combining a moderate-size MRF, transfer, and tipping-area sorting capability under one roof. The equipment and ingress and egress to the RSWC created the technical possibility of shifting more and more of the materials from the “waste side” to the “recycling side” during the 20-year period.
When the County‟s 20-year Solid Waste Management Plan (1992-2012, approved in 1995 for a period lasting through 2014) was prepared, the State of New York required counties to set a goal of at least 50% diversion from disposal. Tompkins County went further, with a plan that gradually increased goals and shifted emphasis from disposal to prevention, reuse, composting and recycling. The County, working in partnership with the private and non-profit sectors, is now diverting 60%+ from disposal and has a 75% goal for 2020. Supporting the practical implementation of this ambitious vision, the Tompkins County Solid Waste Management Division (TCSW) is working on increasing material diversion and recovery and re-sizing the residual management function.
The Tompkins County Mandatory Recycling Law was adopted in 1992. Key to this law was the decision that every resident in the County would have a curbside opportunity to recycle – no matter how rural their community. The County would contract one company for curbside collection and require the recyclables to be brought to the RSWC, but residents would remain free to select their own waste hauling contractor. The curbside collection is one of the services paid by the annual solid waste management fee, which is currently $56 per household per year. Businesses also pay an annual fee based on their size and type.
Households in Tompkins County thus pay only for mixed waste disposal, not for recycling collection. And they pay by volume, following the 1993 pay-as-you-throw (PAYT) Trash Tag program. Sale of trash tags finances all costs of recycling, household hazardous waste collection and closing old landfills, and all trash set outs – cans or bags, must bear a prepaid tag. To insure adequate revenue the County opted for multiple revenue streams with 60% covered by the trash tags – currently $3.50 per 60-gallon bag . . The remaining requisite revenue is provided by hauler licenses, grants, sales of recyclable materials and disposal fees.
Contractual Arrangements Four more urbanized areas within the County are responsible for residential waste collection, and the rest of the county‟s population is served by private-to-private arrangements between the approximately 15 hauling companies active in the region and the County‟s households, businesses, mobile home parks, institutions, and three universities, including Cornell with a student population of nearly 40,000..

130 The Botswana Recycling Guidelines 2012 Advice on Valorisation for Middle-Income Countries
The PAYT system is the practical instrument complementing universal curbside recycling collection of recyclables to all County households. Haulers (and city Departments of Public Works (DPWs) or collection units) have to sell, and residents have to buy, trash tags for all their set-outs of mixed waste. Regardless of the service provider, residents and small businesses that place their waste at the curb must purchase trash tags from their haulers or city DPWs.
Larger businesses, institutions and those with their own dumpsters may select their own service provider but these also must pay by the volume of the non-recyclable waste.
Currently all municipal solid waste received at the RSWC is disposed of at the Seneca Meadows Landfill approximately 50 miles away from Ithaca. Private haulers chooses their own disposal sites; the annual reports to the DEC, the Department of Environmental Conservation, show about five different landfills that receive Tompkins County waste. .
TCSW contracts with a single private service provider for the service of County-wide residential curbside collection. The current service provider was Casella Waste Systems; the contract goes up for bid again in 2013. The contract requires the collector provide the same, County-approved curbside collection service to every household every other week and to deliver the collected recyclables to the RSWC. In 2011, the County changed its curbside collection from two-stream to single stream, and in 2013 is planning to begin a pilot curbside collection of household of source-separated food scraps.
In 2010 the operational contract for the RSWMC came up for re-authorisation. A procurement resulted in a contract with FCR at that time a company of Casella Waste Systems. The company became independent in 2012 and took the name “ReCommunity.” They bid for single-stream operation, with export of the single stream to a MRF about 40 miles distant, and a concept to sort commercial waste and bale paper-rich loads. All marketing is done by the contractor with a formula for revenue-sharing with the County. TCSW runs the scale house and the drop-off area where an additional recyclables are received, including food scraps.
Since 2007, the County has contracted with Cayuga Compost, a private company which owned by an excavating and construction contractor in Tompkins County, to operate a commercial organic composting program for County businesses, institutions, restaurants, the hospital, etc. The service is operated by providing the clients with 120- and 240-litre rolling carts which are used unlined for food waste. Participating institutions also agree to shift to compostable paper plates, cups, and other disposable items, compostable flatware, and a source separation to keep non-compostables out of the compostable waste. Cayuga Compost collects the rolling carts in a box truck, leaving a clean, washed cart for each one they collect. At the site the carts are off-loaded, dumped, and pressure-washed. The food waste is composted in active windrows, turned periodically, and maintains thermophilic temperatures during cold winters and warm summers. In 2012 the company has about 125 clients, and was reaching their through permitted site capacity of 2,000 tons per year. A permit expansion is underway for 5000 tons per year to enable residential collection of food scraps in the next few years.
Cayuga Compost markets the finished compost which is sold in bags at local retail outlets and in bulk. The compost is also utilized in specialty blended products as specified by landscapers, wineries and others. With the expansion, the County anticipates that the material will be used for local food production.
Residential yard waste is not collected by the County: The City of Ithaca and several other urban areas collect yard waste. Yard waste is also accepted for free drop-off at the RSWMC. This organic material is also delivered to the Cayuga Compost site.
The County also funds the Cornell Cooperative Extension of Tompkins County Master Composter education program for residents, small businesses, and apartments. In 2011-2012 the USDA financed an organics waste pilot in two mobile home parks, which was successful enough and has been expanded to other locations in 2012. The County also began accepting food scraps from residents at the drop-off area of the RSWC early in 2012.
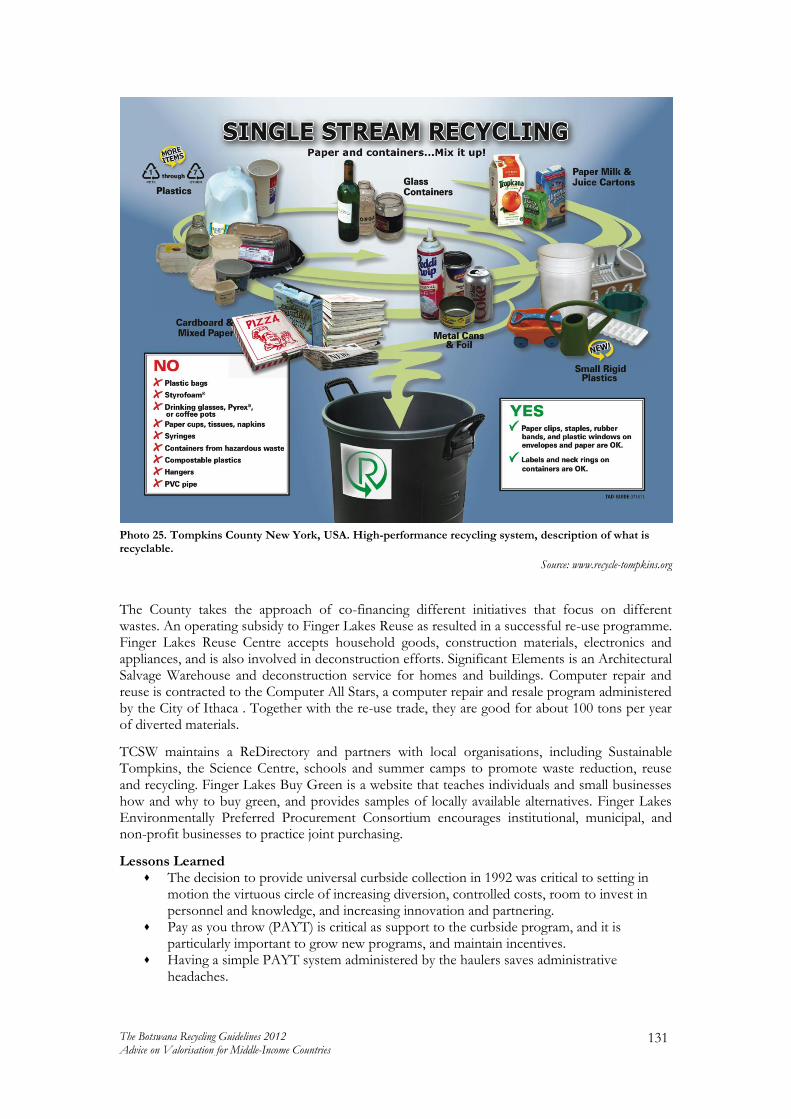
The Botswana Recycling Guidelines 2012 Advice on Valorisation for Middle-Income Countries
131
Photo 25. Tompkins County New York, USA. High-performance recycling system, description of what is recyclable.
Source: www.recycle-tompkins.org
The County takes the approach of co-financing different initiatives that focus on different wastes. An operating subsidy to Finger Lakes Reuse as resulted in a successful re-use programme. Finger Lakes Reuse Centre accepts household goods, construction materials, electronics and appliances, and is also involved in deconstruction efforts. Significant Elements is an Architectural Salvage Warehouse and deconstruction service for homes and buildings. Computer repair and reuse is contracted to the Computer All Stars, a computer repair and resale program administered by the City of Ithaca . Together with the re-use trade, they are good for about 100 tons per year of diverted materials.
TCSW maintains a ReDirectory and partners with local organisations, including Sustainable Tompkins, the Science Centre, schools and summer camps to promote waste reduction, reuse and recycling. Finger Lakes Buy Green is a website that teaches individuals and small businesses how and why to buy green, and provides samples of locally available alternatives. Finger Lakes Environmentally Preferred Procurement Consortium encourages institutional, municipal, and non-profit businesses to practice joint purchasing.
Lessons Learned The decision to provide universal curbside collection in 1992 was critical to setting in
motion the virtuous circle of increasing diversion, controlled costs, room to invest in personnel and knowledge, and increasing innovation and partnering.
Pay as you throw (PAYT) is critical as support to the curbside program, and it is particularly important to grow new programs, and maintain incentives.
Having a simple PAYT system administered by the haulers saves administrative headaches.

132 The Botswana Recycling Guidelines 2012 Advice on Valorisation for Middle-Income Countries
Different waste streams, different types of communities, and different types of generators each require their own approach. The more different approaches, the more likely the diversion rate will rise.
Investing in staff and knowledge is at least as important as investing in facilities and equipment.
An enterprise fund is critical to having transparent and sustainable financing. That enterprise fund needs to have a fixed source of funding (in TC it is the annual fee), and the rest of the income can be variable, drawn from a variety of sources.
Advantages Low cost system because universal curbside collection raises the economy of scale and
provides a critical mass of materials and public support Financial stability through enterprise fund management Excellent publicly owned privately operated MRF and transfer facility Extensive public consultation, involvement, and education Hands on assistance for businesses inspires rather than requires participation Solid public-private partnerships and contractual arrangements
Disadvantages Haulers are not required to bring commercial recyclables to the RSWC. Legislators and various sectors are concerned about increases in the annual fee that funds
non-disposal costs.
What should we have done differently? Before deciding to embark on establishing a new County landfill, policy makers should have done a more careful analysis of the real economics of constructing and operating a landfill given the small size of our county compared with the cost of hauling and disposing trash at an out-of-county larger landfill. After a significant amount of money was spent on the planning process, a cost analysis showed it was not economical to build and operate a local landfill. Instead it made more sense to fund programs to reduce waste (e.g. building a recycling processing facility). When the County began the landfill process, the cost of hauling and disposing of staff was twice the cost of building a landfill. As new regional landfills were permitted and opened, the cost of disposal became much cheaper.
It was a mistake to suddenly start funding all solid waste costs from the disposal fee and remove funding for recycling and waste reduction from the property tax. This resulted in a magnified disposal fee and haulers stopped bringing trash to our old county landfill resulting in a serious financial crisis.
Contact Info Tompkins County, Barbara Eckstrom, Solid Waste Manager, beckstrom@tompkins-
co.org, 607 273-6632 www.recycletompkins.org http://www.recycletompkins.org www.dec.ny.gov/docs/materials_minerals_pdf/nyctestimony.pdf Resa Dimino, 2010 to
New York City Council Committee on Sanitation and Solid Waste Management.

The Botswana Recycling Guidelines 2012 Advice on Valorisation for Middle-Income Countries
133
20 Guideline 20: Extended Producer Responsibility (EPR) and Corporate Social Responsibility (CSR)
20.1 Goals
The goals to be achieved with this guideline are:
1. To establish a common understanding of EPR and CSR. 2. To support the Department and other stakeholders in exploring and framing the
potential for EPR and CSR in relation to the solid waste management system.
20.2 What is this guideline about?
In the field of waste management, extended producer responsibility (EPR) is a strategy designed to promote the integration of environmental costs associated with goods throughout their life cycles into the market price of the products.] The concept was first formally introduced in Sweden by Thomas Lindhqvist in a 1990 report to the Swedish Ministry of the Environment. In subsequent reports prepared for the Ministry, the following definition emerged:
"EPR is an environmental protection strategy to reach an environmental objective of a decreased total environmental impact of a product, by making the manufacturer of the product responsible for the entire life-cycle of the product and especially for the take-back, recycling and final disposal.”7
20.3 Topic: Extended Producer Responsibility (EPR)
EPR is designed to create economic feedback from the solid waste system to producers or their agents that over time reduces the burden of products and packages on Councils and other governmental entities managing solid waste and organising valorisation. EPR is a long-term strategy, based on political negotiation between the national government and the private sector. The EPR mechanism works to leverage costs, logistical, and physical responsibility for the end of life of products and packages onto the designers, producers, manufacturers, importers, and distributors of those products and packages. The idea is that these economic agents are able to change products and packages so that they are:
1. Less toxic for those who use, handle, and discard them 2. Less resource-intensive, especially in terms of non-renewable resources and their CO2
footprint 3. Refillable, re-usable, and recyclable 4. Less likely to produce pollution when disposed or littered 5. Easier and more feasible to repair 6. More efficient for transport 7. Contain fewer and more easily identifiable types of components and materials 8. Easier and more feasible to dismantle at and of life 9. Traceable back to the specific brand or manufacturer to assure responsibility
EPR is based on the idea that the producers really have control of the design and manufacture of their products and packages. Because EPR creates a new and significant cost centre for manufacturers, importers, and distributors, they will themselves often deny that they have this control, and state that it is consumers and the market that determine what it is they produce and how they produce it. Both arguments have elements of truth, and the form of EPR agreements is based in large measure on how that truth is negotiated in specific political contexts.
7 Source: wikipedia

134 The Botswana Recycling Guidelines 2012 Advice on Valorisation for Middle-Income Countries
The European Union has gone further than any other political body in developing EPR into an operational strategy that is integrated with the solid waste management system and actively drives valorisation.
Individual countries in the European Union have their own EPR systems which comply with the European Union‟s Waste Directives, meta-legislation that tells the member states what to do. European EPR and related directives are based partially on early developments in the Dutch, German and Scandinavian waste management systems, and covers a range of products and packages:
Packaging waste (most countries) Paper (Netherlands) WEEE (waste from electronic and electric equipment) Batteries and accumulators (Netherlands) Construction and demolition waste Fluorescent lights End of life vehicles Durable goods, white and brown goods and small appliances Chemicals
20.4 Activity: Developing an EPR system
Developing an EPR System involves a few steps, and strong governance and commitment from the national government(s) involved is essential for getting from the idea to the reality. Generally speaking, the results are as listed below:
Result: An EPR system has been determined to be necessary. a. The composition of waste, by fractions which are interesting to industry, has been
determined and benchmarked
b. The Department, supported by UNDP, consultants, and researchers, has established the environmental, economic, and social impact of the use and end-of life for specific fractions, such as packaging waste, plastic, WEEE, appliances, end of life vehicles, batteries, fertilizers, chemicals, and the like.
c. The impact or level of suffering that the country and the people have from each particular waste stream or fraction has been modelled and the modelling has been validated
d. Based on the impacts, a consultation (negotiation) with industry about the need for them to take responsibility for their products or packages has been opened.
e. The consultation has produced a shared (negotiated) agreement on the definition of the problem to be solved.
f. The Department, other relevant ministries, industry and key stakeholders have engaged in a consultation and have developed and agreed upon a strategy for solving the problem
g. Roles and responsibilities to national government, councils, the private sector, and the EPR industries in solving the problem have been assigned.
Generally, EPR systems recognise three types of responsibilities:
financial responsibility: paying for valorisation or safe end of life management physical responsibility: ownership of the materials (during and) after their useful life, so
that the liability for problems created by the products or packages attaches to the owner logistical responsibility: organising and paying for the movement of the products or
packages
Result: The issues of responsibility have been negotiated. a. The responsibility for historic WEEE, that is, things which become waste now but whose
producers are no longer in business , has been discussed, quantified, estimated, or agreed upon and integrated into the proposals for financial, physical and logistical responsibility.

The Botswana Recycling Guidelines 2012 Advice on Valorisation for Middle-Income Countries
135
b. Closing the system and preventing free riders has been discussed, quantified, estimated, or agreed upon and integrated into the proposals for financial, physical and logistical responsibility.
c. The strategy for managing waste which is generated as a result of piracy, counterfeit products and illegally imported products (including purchasing through internet) has been discussed, quantified, estimated, or agreed upon and integrated into the proposals for financial, physical and logistical responsibility.
Result: The administrative and physical systems for operating the EPR system have been created. Often this means making contractual agreements with existing stakeholders to move or process materials. This step includes setting up the systems to manage money in the EPR system, including introducing advanced disposal or point of purchase fees or deposits, creating fees and funds, deciding whether the public or private sector holds the money and what the rules are for spending it, and the like.
Result: The EPR systems have been tested in practice for at least 18 months to two years. Result: The EPR systems have been institutionalised in law at country and/or regional level.
20.5 Topic: What level of EPR is likely to be feasible for Botswana?
Negotiating EPR agreements with specific companies and/or groups of companies is a challenging process, and it doesn‟t work very well in “small markets,” that is, countries like Botswana with a population of two million, because the companies don‟t have very much to lose if they refuse: even if every citizen of Botswana decided to refuse to drink Coca-Cola because the company doesn‟t take care of its packaging waste, the impact on Coca Cola‟s yearly profit would hardly be noticeable.
Larger countries like South Africa are more likely to get the attention of industry, and indeed, South Africa has some EPR agreements in place. Botswana benefits from the Collect-a-can agreement, which is anchored in South Africa. However, the level of political priority for recycling in South Africa is not so high, so there is a presumption that these systems could produce more if there were more stringent governance.
For Botswana alone, there is limited likelihood for having a full-fledged EPR system, although two proto-systems, the Thole Trust collections for waste oil and the tax on plastic bags, are beginning to function.
On the other hand, the potential for using either the SADC or COMESA frameworks for negotiating and introducing an EPR agreement is extremely promising, because these groupings include some of the fastest-growing economies in the world. The challenge here will be to get a critical mass of the national governments in either of these institutions to agree to the same system of EPR.
20.6 Topic: Corporate Social Responsibility (CSR)
Corporate Social Responsibility (CSR) is another path for engaging the private sector. CSR seeks to engage companies based on their moral obligations to the places they operate, rather than based on their factual responsibility for particular waste fractions. CSR is a modern-day version of corporate charity, and this accounts for the high degree of variability in its usefulness and credibility. There are many definitions available to explain what CSR is. A nice one is the following:
“CSR is about how companies manage the business processes to produce an overall positive impact on society".
Companies engaging in CSR do so out of an internal need or desire to improve their environmental, social, or economic impacts, in contrast to EPR which is usually driven by external

136 The Botswana Recycling Guidelines 2012 Advice on Valorisation for Middle-Income Countries
negotiations with the national government. Or CSR may be an indirect response to information from ISO 9.000 or ISO 14.000 certification processes, trade criteria and barriers, treaty relationships, and the like. In general, CSR activities provide companies with answers to three aspects of their operations.
1. The quality of their management - both in terms of people and processes inside the company
2. The nature, and quantity of their impact on society in the various areas
3. Outside stakeholders taking an increasing interest in the activity of the company. Most NGOs and civil society groups look to the outer circle - what the company has actually done, good or bad, in terms of its products and services, in terms of its impact on the environment and on local communities, or in how it treats and develops its workforce.
20.7 Case example: EPR in South Africa
Source: National Waste Management Strategy of South Africa
In South Africa, individual waste management plans can include voluntary producer responsibility schemes for particular waste streams whereby producers, importers or retailers take responsibility for the waste generated by their products beyond point-of-sale and choose the most effective way of meeting their responsibilities.
The Waste Act also provides for the declaration of mandatory Extended Producer Responsibility (EPR) schemes whereby the Minister prescribes how a waste stream should be managed and the required funding mechanism to do so. Mandatory EPR schemes can be declared when voluntary schemes provided for by individual waste management plans have failed to effectively manage a waste stream.
Identifying products, groups of products or waste streams for EPR It is the Minister’s prerogative to declare the application of EPR to a product, group of products or waste stream. The declaration must be done in consultation with the Minister of Trade and Industry by notice in the government gazette. The Minister must also consult the Minister of Finance regarding any financial arrangements for an EPR programme. This is especially pertinent where the EPR programme is likely to require changes to product design, or impact significantly on the economy or economic sectors. The characteristics of a product determine if an EPR programme is appropriate for it. Products with the following characteristics are candidates:
Products with toxic constituents that may become a problem at the end of life. Examples include: batteries, electronics, used oil, pharmaceuticals, paint and paint products (latex oil-based paints and thinners), pesticides, radioactive materials, products containing mercury and cadmium including thermometers, thermostats, electrical switches (including automotive), and fluorescent lamps.
Large products that are not easily and conveniently thrown out as waste. Examples include: carpets, building materials, TVs, computers, appliances, tyres, propane tanks and gas canisters.
Products with multiple material types that make them difficult to recover in traditional recycling systems. Examples include: packaging, electronics, and vehicles.
A risk-based evaluation will establish if a product, group of products or waste stream is suitable for EPR and its consequences. This may include an assessment of legal and administrative difficulties, such as the potential impact on waste avoidance, economic implications (including job creation), potential for contravention of competition requirements, enforcement and the potential for illegal activities. The risk-based evaluation will draw on scientific information and
take into account the country’s obligations with respect to any applicable international agreements.
The design of the EPR measures for mandatory schemes will include appropriate funding mechanisms to attract consumer participation, the establishment of cost-effective collection and

The Botswana Recycling Guidelines 2012 Advice on Valorisation for Middle-Income Countries
137
return networks for discarded products, the identification of markets and uses for returned products and materials, and achieving co-operation where multiple firms are involved. This will be done in consultation with the affected producers of the product, group of products or waste stream under consideration.
20.8 List of references specific to this guideline
For information on EPR, the Strategic Planning Guide, and other high-quality and useful publications, please go to the website of WasteAware. http://wasteaware.org/publications.
For case information on South Africa: www.wastepolicy.co.za
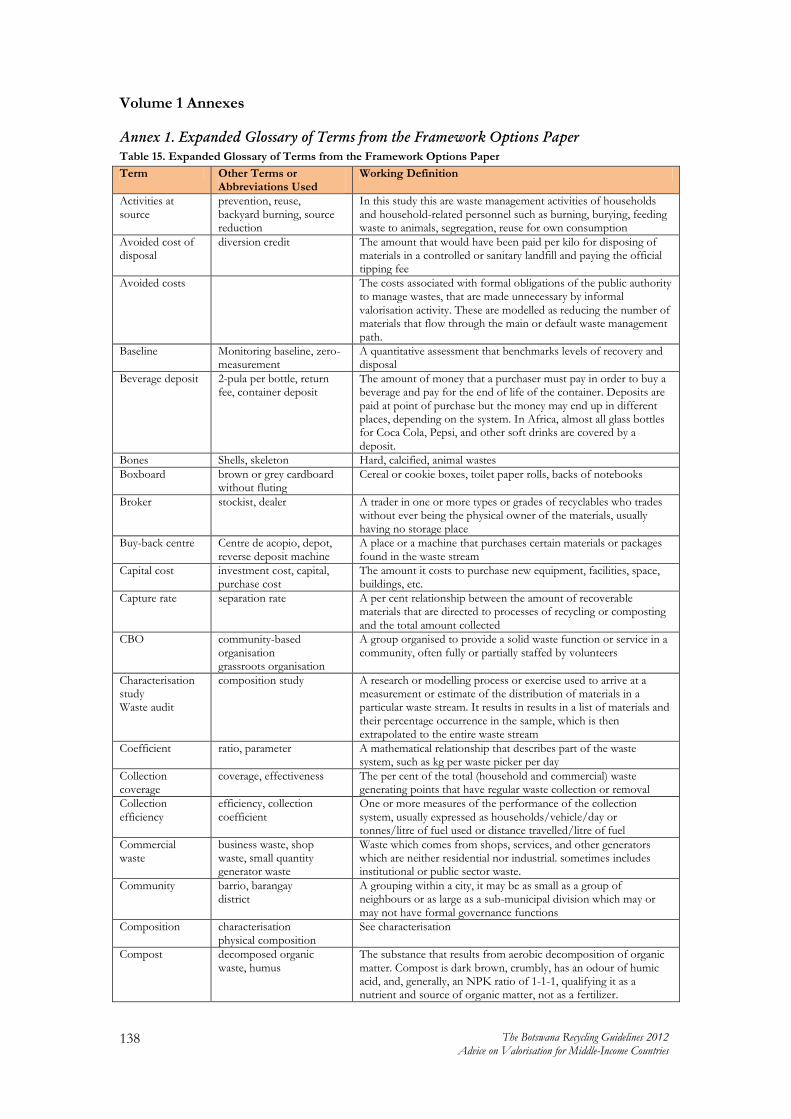
138 The Botswana Recycling Guidelines 2012 Advice on Valorisation for Middle-Income Countries
Volume 1 Annexes
Annex 1. Expanded Glossary of Terms from the Framework Options Paper
Table 15. Expanded Glossary of Terms from the Framework Options Paper
Term Other Terms or Abbreviations Used
Working Definition
Activities at source
prevention, reuse, backyard burning, source reduction
In this study this are waste management activities of households and household-related personnel such as burning, burying, feeding waste to animals, segregation, reuse for own consumption
Avoided cost of disposal
diversion credit The amount that would have been paid per kilo for disposing of materials in a controlled or sanitary landfill and paying the official tipping fee
Avoided costs The costs associated with formal obligations of the public authority to manage wastes, that are made unnecessary by informal valorisation activity. These are modelled as reducing the number of materials that flow through the main or default waste management path.
Baseline Monitoring baseline, zero-measurement
A quantitative assessment that benchmarks levels of recovery and disposal
Beverage deposit 2-pula per bottle, return fee, container deposit
The amount of money that a purchaser must pay in order to buy a beverage and pay for the end of life of the container. Deposits are paid at point of purchase but the money may end up in different places, depending on the system. In Africa, almost all glass bottles for Coca Cola, Pepsi, and other soft drinks are covered by a deposit.
Bones Shells, skeleton Hard, calcified, animal wastes
Boxboard brown or grey cardboard without fluting
Cereal or cookie boxes, toilet paper rolls, backs of notebooks
Broker stockist, dealer A trader in one or more types or grades of recyclables who trades without ever being the physical owner of the materials, usually having no storage place
Buy-back centre Centre de acopio, depot, reverse deposit machine
A place or a machine that purchases certain materials or packages found in the waste stream
Capital cost investment cost, capital, purchase cost
The amount it costs to purchase new equipment, facilities, space, buildings, etc.
Capture rate separation rate A per cent relationship between the amount of recoverable materials that are directed to processes of recycling or composting and the total amount collected
CBO community-based organisation grassroots organisation
A group organised to provide a solid waste function or service in a community, often fully or partially staffed by volunteers
Characterisation study Waste audit
composition study A research or modelling process or exercise used to arrive at a measurement or estimate of the distribution of materials in a particular waste stream. It results in results in a list of materials and their percentage occurrence in the sample, which is then extrapolated to the entire waste stream
Coefficient ratio, parameter A mathematical relationship that describes part of the waste system, such as kg per waste picker per day
Collection coverage
coverage, effectiveness The per cent of the total (household and commercial) waste generating points that have regular waste collection or removal
Collection efficiency
efficiency, collection coefficient
One or more measures of the performance of the collection system, usually expressed as households/vehicle/day or tonnes/litre of fuel used or distance travelled/litre of fuel
Commercial waste
business waste, shop waste, small quantity generator waste
Waste which comes from shops, services, and other generators which are neither residential nor industrial. sometimes includes institutional or public sector waste.
Community barrio, barangay district
A grouping within a city, it may be as small as a group of neighbours or as large as a sub-municipal division which may or may not have formal governance functions
Composition characterisation physical composition
See characterisation
Compost decomposed organic waste, humus
The substance that results from aerobic decomposition of organic matter. Compost is dark brown, crumbly, has an odour of humic acid, and, generally, an NPK ratio of 1-1-1, qualifying it as a nutrient and source of organic matter, not as a fertilizer.

The Botswana Recycling Guidelines 2012 Advice on Valorisation for Middle-Income Countries
139
Term Other Terms or Abbreviations Used
Working Definition
Composting treatment, organic waste management
The aerobic decomposition of materials from living organisms under controlled conditions and in the presence of oxygen
Construction & demolition waste
debris, C&D, rubble, contractor waste
Waste from the process of construction, demolition, or repair of houses, commercial buildings, roads, bridges, etc. Generally divided into commercial construction waste from construction companies, and do-it-yourself (DIY) waste from homeowners making their own repairs.
Controlled landfill
sanitary landfill An engineered method of disposing of solid wastes on land, in which the waste is compacted and covered every day. a controlled landfill is not sealed from below and does not have leachate collection system. Specifically having controlled access at the point of entry, and usually, a weigh-bridge
Co-operative co-op, buyers association, sellers association
An enterprise or association with multiple owners or members who participate together or in parallel in specific activities. In the waste management sector, the most usually form of co-operative is for operations, as in the case of SWACH in Pune, India, or to sell materials collectively and with lower transaction costs, as in the case of Cooperar in Colombia. In some Latin American countries, co-operatives have a special tax status and so are a favoured form for establishing a business.
Cost per tonne cost per metric tonne, price per tonne
The activity-based and calculated cost to process one metric tonne of material through one specific process step, or for a whole subsystem, divided by the number of tonnes that enter that step.
Coverage collection rate See collection coverage
Cullet crushed or broken bottle glass
Is graded into flint = white or clear glass; amber = brown glass; green = green glass
Deposit Beverage deposit An amount per bottle, can, or other package that is paid at the point of purchase, and refunded when the container is returned to a distribution centre.
Depot deposit, drop-off, community collection point, community container
A container, site, or facility designed to receive waste materials and/or separated recyclables directly from the generator.
Disposal discharge, dumping, throwing away
Discharge of waste in a place designed to be its permanent resting place
Disposal site dumpsite, dump, depot The site where solid wastes are deposited on land without precautions regarding human health or environment.
Disposal-illegal wild dump, illegal dump Disposal of waste at a site different from one officially designated by the municipal authorities
Disposal-legal controlled dump-site, landfill
Disposal of waste at a site designated by the municipal authorities
Diversion credit reward, payment for recycling, price support
A price support for recyclables that have been marketed to the value chain, based on the value of avoiding disposal for those recyclables.
Dry waste recyclables, packaging inorganic waste
What is left when organics are separated at source. alternatively, a way of describing a fraction that is to be further sorted into its components
Dump picker scavenger, waste picker Woman, man, child or family who extracts recyclable materials from disposal sites, often living on or near them.
Dumpster container, skip A vessel to contain waste, usually larger than 1 m3 and used for more than one household
Effectiveness coverage See coverage
Efficiency collection efficiency See efficiency
Enabling environment
Policy structure, boundary conditions, rules of engagement, frame
A combination of policy, legal, institutional, and practical actions, interventions, and rules of engagement that change the boundary conditions for a particular activity
Environmental costs. Carbon footprint
Costs of emissions, energy use, and extraction of raw materials, if they can be expressed in terms of tonnes of CO2 equivalent
Extrapolate estimate, model Apply coefficients or ratios from one area or set of data to another
Ferrous metals iron, steel Metals which contain iron and which react to a magnet and are subject to rusting

140 The Botswana Recycling Guidelines 2012 Advice on Valorisation for Middle-Income Countries
Term Other Terms or Abbreviations Used
Working Definition
Fertiliser Plant nutrients, manure A natural or processed or synthetic substance used to feed plants with the goal of increasing yields or improving the growth rates or quality of what is produced. Fertiliser typically has values for N-P-K of 5-10-5 or higher.
Formal sector official, government, recognised, contracted
Economic stakeholders in the solid waste system which are organised, owned, sponsored, paid, contracted, authorised, listed, recognised, and/or allowed by official local, regional, or national solid waste authorities and the activities they sponsor.
Formal waste sector
solid waste system, solid waste authorities, government, materials recovery facility
Solid waste management activities planned, sponsored, financed, carried out or , regulated and and/or recognised by the formal local authorities or their agents., usually through contracts, licenses or concessions
Garden waste yard waste, brush, organics, organic waste, grass clippings, weeds
Waste products of gardening, horticultural, or silvacultural activities
Generator waste producer, household The source of the waste, that is, the first point it becomes waste
HDPE High density polyethylene Rigid containers used for milk or juices, milky look
Household container
garbage can, waste can, waste bin, dustbin, bin
The vessel used by a household or commercial generator to store and set out the waste materials, usually made of metal, plastic, rubber, or a basket
Household waste municipal solid waste, domestic waste, MSW, non -dangerous waste
Discarded materials from households which are generated in the normal process of living and dying
Incineration burning, combustion Controlled process by which solid, liquid or gaseous combustible wastes are burned and changed into gases.
Indicator Benchmark, metric, assessment measurement, data point
A verifiable quantitative or physical fact which is used to assess, measure, or estimate a situation, level of performance or efficiency, or other situation or circumstance.
Inert material fines dust sand and gravel
The fraction of solid waste which does not burn and also does not decompose: ash, dust, gravel, grit, etc.
Informal sector waste pickers, rag pickers, scavengers, junkshops
Individuals or businesses who are involved in waste activities but are not recognised by the formal solid waste authorities, or who operate in violation of or in competition with formal authorities.
Informal waste sector
waste pickers, scavengers, junkshops
Individuals or enterprises who are involved in waste activities but are not sponsored, financed, recognised or allowed by the formal solid waste authorities, or who operate in violation of or in competition with formal authorities.
Input data, assumptions The quantitative values that are the basis for modelling
Integration (see special section below)
addition Furedy has made a list of interpretations of the term integration. Although it is probably not complete, it is quite concise. She refers to integration as:
IWB Itinerant waste buyer Woman, man, child, family or enterprise that purchases source separated waste materials from households, shops or institutions, usually focusing on one specific material or type of materials
Jumpers crew, collectors Helpers in the collection vehicle that segregate recyclables during collection
Kitchen waste swill, pig slops, garbage, compostables, kitchen organics, food scraps
Vegetable, fruit, dairy, fish, meat solid or liquid waste from food preparation or food consumption. Can be at household or commercial level.
Labour costs Costs paid for labour or as a fee which is a proxy for labour. Where there are informal process steps that do not show a labour cost, the labour costs have been shadow priced. See section on shadow pricing, below.
Landfill dump, dumpsite relleno sanitario
“The engineered deposit of waste onto and into land”…
LDPE Low density polyethylene, plastic film, nylon, foil
Plastic bags, water pouches, usually not the kind that crackles (which is cellulose-based cellophane)
Manure shit, animal faeces Africa: fertiliser
Liquid or solid excreta from livestock, often piled or allowed to decompose in a pile which attracts worms. In English-speaking Africa, also used as a substitute for the word “fertiliser”.
Mass balance process flow diagram, materials flow diagram, chain analysis
A visual schematic representation of the movement of materials through the entire waste system or only the formal or informal waste system, which indicates the weight of each fraction at each stage
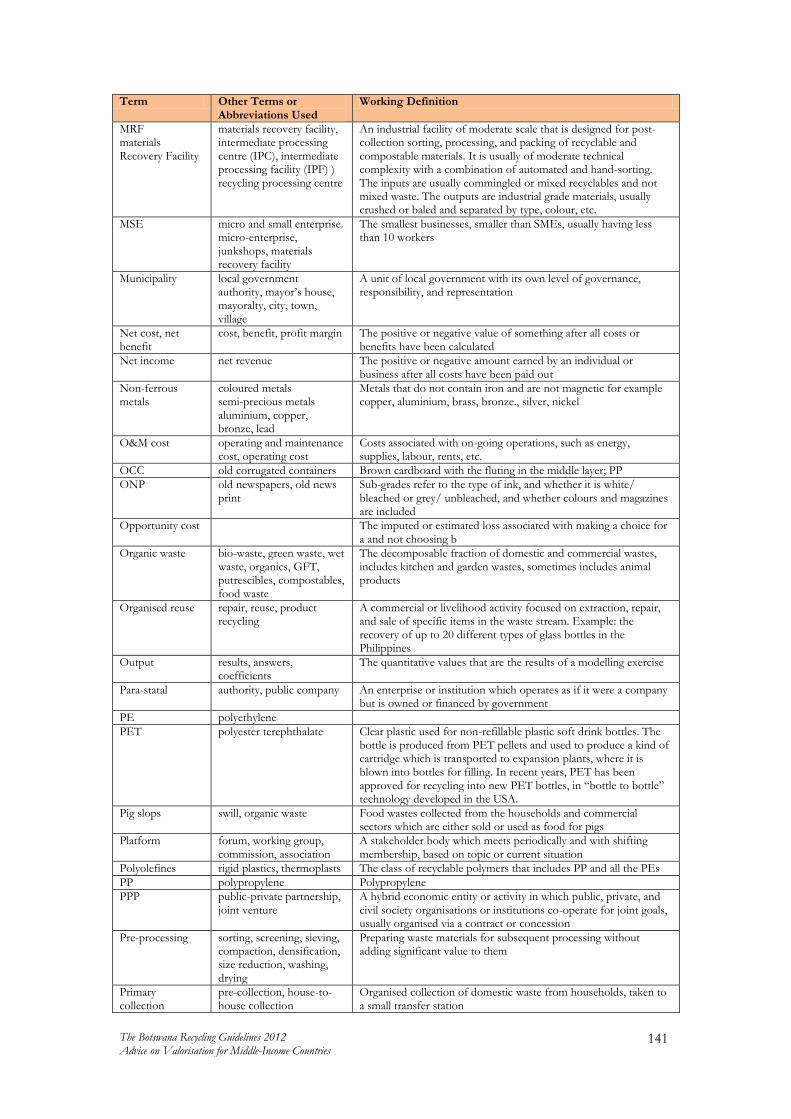
The Botswana Recycling Guidelines 2012 Advice on Valorisation for Middle-Income Countries
141
Term Other Terms or Abbreviations Used
Working Definition
MRF materials Recovery Facility
materials recovery facility, intermediate processing centre (IPC), intermediate processing facility (IPF) ) recycling processing centre
An industrial facility of moderate scale that is designed for post-collection sorting, processing, and packing of recyclable and compostable materials. It is usually of moderate technical complexity with a combination of automated and hand-sorting. The inputs are usually commingled or mixed recyclables and not mixed waste. The outputs are industrial grade materials, usually crushed or baled and separated by type, colour, etc.
MSE micro and small enterprise. micro-enterprise, junkshops, materials recovery facility
The smallest businesses, smaller than SMEs, usually having less than 10 workers
Municipality local government authority, mayor‟s house, mayoralty, city, town, village
A unit of local government with its own level of governance, responsibility, and representation
Net cost, net benefit
cost, benefit, profit margin The positive or negative value of something after all costs or benefits have been calculated
Net income net revenue The positive or negative amount earned by an individual or business after all costs have been paid out
Non-ferrous metals
coloured metals semi-precious metals aluminium, copper, bronze, lead
Metals that do not contain iron and are not magnetic for example copper, aluminium, brass, bronze., silver, nickel
O&M cost operating and maintenance cost, operating cost
Costs associated with on-going operations, such as energy, supplies, labour, rents, etc.
OCC old corrugated containers Brown cardboard with the fluting in the middle layer; PP
ONP old newspapers, old news print
Sub-grades refer to the type of ink, and whether it is white/ bleached or grey/ unbleached, and whether colours and magazines are included
Opportunity cost The imputed or estimated loss associated with making a choice for a and not choosing b
Organic waste bio-waste, green waste, wet waste, organics, GFT, putrescibles, compostables, food waste
The decomposable fraction of domestic and commercial wastes, includes kitchen and garden wastes, sometimes includes animal products
Organised reuse repair, reuse, product recycling
A commercial or livelihood activity focused on extraction, repair, and sale of specific items in the waste stream. Example: the recovery of up to 20 different types of glass bottles in the Philippines
Output results, answers, coefficients
The quantitative values that are the results of a modelling exercise
Para-statal authority, public company An enterprise or institution which operates as if it were a company but is owned or financed by government
PE polyethylene
PET polyester terephthalate Clear plastic used for non-refillable plastic soft drink bottles. The bottle is produced from PET pellets and used to produce a kind of cartridge which is transported to expansion plants, where it is blown into bottles for filling. In recent years, PET has been approved for recycling into new PET bottles, in “bottle to bottle” technology developed in the USA.
Pig slops swill, organic waste Food wastes collected from the households and commercial sectors which are either sold or used as food for pigs
Platform forum, working group, commission, association
A stakeholder body which meets periodically and with shifting membership, based on topic or current situation
Polyolefines rigid plastics, thermoplasts The class of recyclable polymers that includes PP and all the PEs
PP polypropylene Polypropylene
PPP public-private partnership, joint venture
A hybrid economic entity or activity in which public, private, and civil society organisations or institutions co-operate for joint goals, usually organised via a contract or concession
Pre-processing sorting, screening, sieving, compaction, densification, size reduction, washing, drying
Preparing waste materials for subsequent processing without adding significant value to them
Primary collection
pre-collection, house-to-house collection
Organised collection of domestic waste from households, taken to a small transfer station
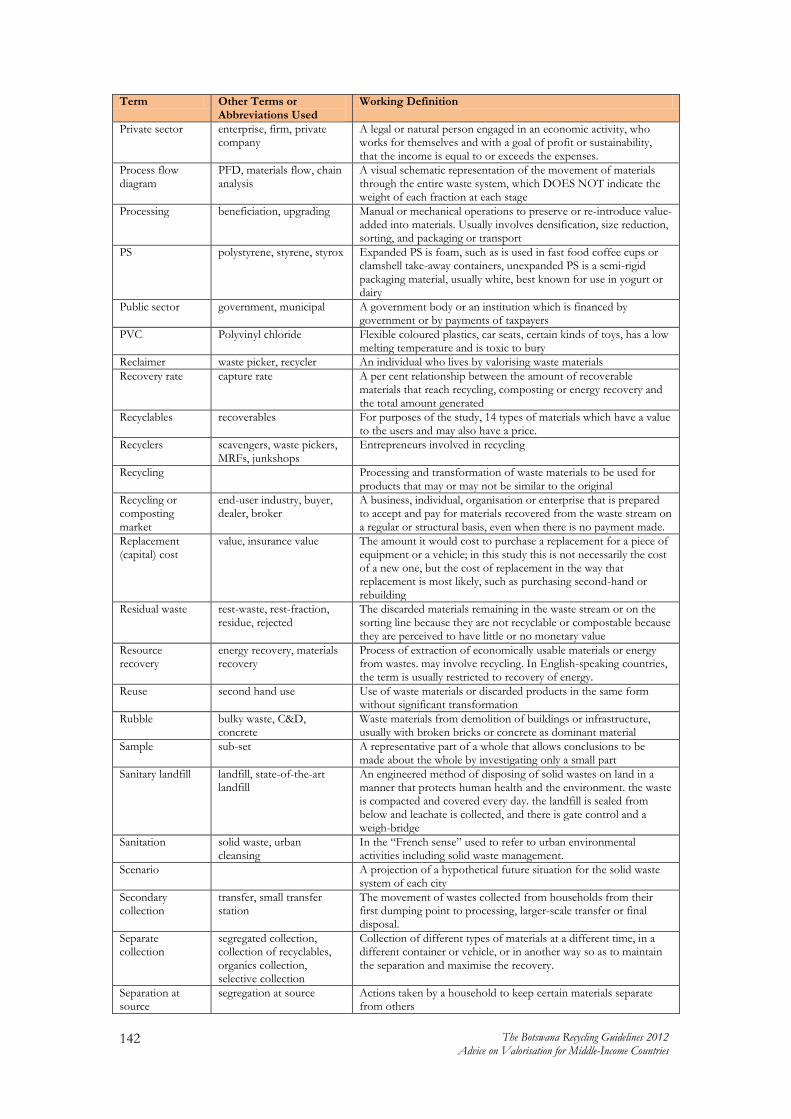
142 The Botswana Recycling Guidelines 2012 Advice on Valorisation for Middle-Income Countries
Term Other Terms or Abbreviations Used
Working Definition
Private sector enterprise, firm, private company
A legal or natural person engaged in an economic activity, who works for themselves and with a goal of profit or sustainability, that the income is equal to or exceeds the expenses.
Process flow diagram
PFD, materials flow, chain analysis
A visual schematic representation of the movement of materials through the entire waste system, which DOES NOT indicate the weight of each fraction at each stage
Processing beneficiation, upgrading Manual or mechanical operations to preserve or re-introduce value-added into materials. Usually involves densification, size reduction, sorting, and packaging or transport
PS polystyrene, styrene, styrox Expanded PS is foam, such as is used in fast food coffee cups or clamshell take-away containers, unexpanded PS is a semi-rigid packaging material, usually white, best known for use in yogurt or dairy
Public sector government, municipal A government body or an institution which is financed by government or by payments of taxpayers
PVC Polyvinyl chloride Flexible coloured plastics, car seats, certain kinds of toys, has a low melting temperature and is toxic to bury
Reclaimer waste picker, recycler An individual who lives by valorising waste materials
Recovery rate capture rate A per cent relationship between the amount of recoverable materials that reach recycling, composting or energy recovery and the total amount generated
Recyclables recoverables For purposes of the study, 14 types of materials which have a value to the users and may also have a price.
Recyclers scavengers, waste pickers, MRFs, junkshops
Entrepreneurs involved in recycling
Recycling Processing and transformation of waste materials to be used for products that may or may not be similar to the original
Recycling or composting market
end-user industry, buyer, dealer, broker
A business, individual, organisation or enterprise that is prepared to accept and pay for materials recovered from the waste stream on a regular or structural basis, even when there is no payment made.
Replacement (capital) cost
value, insurance value The amount it would cost to purchase a replacement for a piece of equipment or a vehicle; in this study this is not necessarily the cost of a new one, but the cost of replacement in the way that replacement is most likely, such as purchasing second-hand or rebuilding
Residual waste rest-waste, rest-fraction, residue, rejected
The discarded materials remaining in the waste stream or on the sorting line because they are not recyclable or compostable because they are perceived to have little or no monetary value
Resource recovery
energy recovery, materials recovery
Process of extraction of economically usable materials or energy from wastes. may involve recycling. In English-speaking countries, the term is usually restricted to recovery of energy.
Reuse second hand use Use of waste materials or discarded products in the same form without significant transformation
Rubble bulky waste, C&D, concrete
Waste materials from demolition of buildings or infrastructure, usually with broken bricks or concrete as dominant material
Sample sub-set A representative part of a whole that allows conclusions to be made about the whole by investigating only a small part
Sanitary landfill landfill, state-of-the-art landfill
An engineered method of disposing of solid wastes on land in a manner that protects human health and the environment. the waste is compacted and covered every day. the landfill is sealed from below and leachate is collected, and there is gate control and a weigh-bridge
Sanitation solid waste, urban cleansing
In the “French sense” used to refer to urban environmental activities including solid waste management.
Scenario A projection of a hypothetical future situation for the solid waste system of each city
Secondary collection
transfer, small transfer station
The movement of wastes collected from households from their first dumping point to processing, larger-scale transfer or final disposal.
Separate collection
segregated collection, collection of recyclables, organics collection, selective collection
Collection of different types of materials at a different time, in a different container or vehicle, or in another way so as to maintain the separation and maximise the recovery.
Separation at source
segregation at source Actions taken by a household to keep certain materials separate from others

The Botswana Recycling Guidelines 2012 Advice on Valorisation for Middle-Income Countries
143
Term Other Terms or Abbreviations Used
Working Definition
Shadow price proxy price, hedonic price, contingent valuation
A reasonable estimate for the price of something based on extrapolating the price for something similar
SME small and medium-sized business, small business
Businesses usually having between 11 and 50 employees or workers
Socio-economic costs
Costs associated with impacts to individuals or family units
Solid waste garbage, trash, waste, rubbish
Materials that are discarded or rejected when their owner considers them to be spent, useless, worthless, or in excess.
Sorting classification, high-grading, selection
Separating mixed materials into single-material components, mechanically or manually. In some cases classifying a mixed single-material stream into specific grades or types of that material
Source generator, origin The point at which a material is defined as waste and discarded. usually either a house or a business
Source separation separation at source, segregation at source
Actions taken to keep and store certain materials separately from commingled (mixed) waste at the point of generation
Street picker street scavenger, waste picker
Woman, man, child or family who removes recyclable materials from dumpsters, streets and public places
Terreautage partial composting, unmanaged decomposition,
The West African practice of production and land application of lightly screened raw organic waste, from the French word for soil
Terreau partially decomposed kitchen and garden waste
Lightly screened raw organic waste, from the French word for soil
Tetra-Pak juice or milk boxes, beverage bricks
Composite packaging with waxed cardboard on the outside, a layer of polyethylene in the middle, and the inner layer of aluminium foil
Tipping fee dump fee, tip fee The amount that is charged for disposing of waste at a facility, usually per tonne, per cubic metre, or per vehicle
Tissue & towelling
household paper Paper towels, toilet paper, napkins, sanitary products
Topsoil fertile soil, humus The organic rich layer of soil which allows plants to grow. It is produced through natural processes of decomposition of plant material.
Transfer transit, collection point, depot
The movement of wastes from their first point of dumping to final disposal; it usually includes some very basic processing: compaction, pre-sorting or size reduction.
Transfer station transit point A place where waste from collection vehicles is assembled before being transported to disposal sites or treatment stations.
Treatment decontamination, processing, composting
Manual or mechanical operations to make discarded or disposed materials or mixed waste less dangerous or to improve the physical characteristics so it is easier to incinerate or landfill. In some locations also used to mean conserving value added.
Valorisation recycling, recovery, 3-R, conserving value added commercialising secondary materials
The root of this word is value, that is the extraction of economic value which is to be found in materials extracted from the waste stream. It is derived from the French word for recycling, but covers more broadly also the use and commercialisation of organic wastes, kitchen and garden waste, and, in certain circumstances, also excreta and waste water. Valorisation involves commercial transactions, recovery can also be without payment as long as there is some transaction that recognises the value of what is traded.
Value added added value, resource value The amount of worth added to resources in the process of manufacturing
Value chain recycling sector, recycling industry, agricultural sector
The group of enterprises connected by transfer of materials, who are involved in extracting, processing, transporting and/or using secondary resources in industrial or agricultural production
Waste audit waste assessment, walk-through
A visit to a factory, office, or institution for the purpose of inventorying and analysing the ways in which waste is generated, handled, managed, and removed.
Waste dealer junkshop owner, scrap trader, consolidator, owner of a go down, waste buyer
Individual or business purchasing materials for recycling or composting, storing them, upgrading or processing them, and then reselling them. An entrepreneur who trades in recyclables and uses a dedicated storage place.
Waste pickers scavenger, rag picker Person who salvages recyclable materials from streets, public places or disposal sites

144 The Botswana Recycling Guidelines 2012 Advice on Valorisation for Middle-Income Countries
Term Other Terms or Abbreviations Used
Working Definition
WEEE Waste from electric and electronic equipment; e-waste, computers, IT waste, durable good waste
Discarded electric and electronic equipment which cannot be recycled without dismantling, and which may include both precious metals and hazardous components
Weigh bridge scale, wheel scale, truck balance
A facility for weighing trucks and producing weight slips
Wet waste organic waste, green waste, organics
Used both for the physically wet part of the waste stream and to describe compostable waste separated at source from dry or recyclable waste
Integration, cont‟d
Recognizing the dignity of pickers as people and their need for work; tolerating their activities and reducing official harassment of them;
Giving social assistance to picker families; educating picker children so they can do other work;
Allowing pickers access to windrow compost facilities, in order to reduce the amounts of non-organics in the waste;
Employing pickers at recovery facilities, including those at dump sites, to work on conveyer belts;
Legalizing picking; requiring the registration of pickers; subjecting them to regulations and laws;
Allowing, encouraging or organizing co-operatives or small enterprises of former pickers; allowing these to negotiate access to wastes either for waste trading, or a combination of primary waste collection services and waste trading;
Providing job security and special protection to waste pickers; intervening in prices for recyclables to guarantee a basic living wage for pickers.

The Botswana Recycling Guidelines 2012 Advice on Valorisation for Middle-Income Countries
145
Annex 2. References
ACR+, The Association of Cities and Regions for Recycling and Sustainable Resource Management (2009): Municipal Waste in Europe. Collection Environnement, Victoires Editions, Paris.
Anschütz, Justine (ed.) (2005): UWEP City Case Studies. City Case Studies of Bamako, La Ceiba, Bangalore and Batangas Bay, the Four “PPS” Cities of the UWEP Plus Programme, 2001–2004. WASTE, Gouda. available at www.waste.nl
Aziz, Hossam (2004): “Improving the Livelihood of Child Waste Pickers: Experiences with the “Zabbaleen” in Cairo, Egypt”, An Evaluative Field Study, WASTE, Gouda.
Ball, Jarrod (1998): Minimum Standards for Disposal by Landfill, Second Edition. Department of Water Affairs & Forestry, Private Bag X313, Pretoria.
Berenyi, Eileen Brettler (1999): “Whither MRF-based recycling?”. Resource Recycling, April 1999, pp. 12-17.
Bolaane, Ben, and Mansoor Ali (2004): Sampling Household Waste at Source: Lessons Learnt in Gaborone, Waste Management and Research 2004 22: 142.
Bolaane, Ben (2006): Constraints to promoting people centred approaches in recycling. Habitat International 30 (2006) 731–740
Bulkeley, Harriet, and Matt Watson (2007): “Modes of governing municipal waste.” Environment and Planning A, Volume 39, pp. 2733-2753
Canterbury, Janice: “Pay-as-you-throw: A growing MSW management success story.” Resource Recycling, October 1997, pp 16-22.
Chaturvedi, Bharati (2007): Privatization of Solid Waste Collection and Transportation in Delhi : The Impact on the Informal Recycling Sector. Paper prepared as partial fulfilment of course on Urban Issues in Developing Countries, School for Advanced International Studies, Johns Hopkins University. Washington DC.
Chaturvedi, Bharati (2009): Cooling Agents: The Impact on the Informal Recycling Sector on Carbon Emissions. Chintan-Environmental, Delhi, India
Chaturvedi, Bharati, Irmanda Handayani, Malati Gadgil, Prakash Shukla and Jai Prakash Choudhury (2009): City Presentation Document for Delhi/New Delhi, India. Unpublished report used in the production of Scheinberg, Wilson and Rodic 2010. Chintan-Environmental, Delhi, India
Chikarmane, Poornima, and Laxmi Narayan (2007): City Report for the City of Pune, India. Unpublished report used in the production of Scheinberg, Simpson and Gupt 2010. KKPKP, Pune, India. Available at www.giz.de.
Chintan-Environmental (2009): Wastepickers and Climate Change: Greenhouse gas mitigation by the informal recycling sector in Delhi. Unpublished study, Chintan-Environmental, New Delhi, India.
Cohen, Maurie J.(2000): “Ecological Modernisation, Environmental Knowledge and National Character: A Preliminary Analysis of the Netherlands.” Environmental Politics, Volume 9 Number 1, pp. 77-106.
Cointreau, Sandra (1987): Solid Waste Recycling: Case Studies in Developing Countries. World Bank, Washington, DC.
146
Cointreau, Sandra (1989): “Provision of solid waste services in developing countries”, Resource Paper presented at the International Seminar on the Provision of Municipal Public Services in Developing Countries, August 21-29, 1989 Assenovgrad, Bulgaria
Cointreau, Sandra (1991): “Conceptual issues and experiences in developing countries”, : World Bank, Washington, DC.
Cointreau Sandra (1994): Private Sector Participation in Municipal Solid Waste Services in Developing Countries, Volume 1 The Private Sector. World Bank, Urban Management Programme, Washington, DC.
D‟Alisa, G., et al., 2010. “Conflict in Campania: Waste emergency or crisis of democracy.” Ecological Economics 70: 239–249.
Dias, Sonia M. (2010): Overview of the legal framework for social inclusion in solid waste management in Brazil. WIEGO, Cambridge, Massachusetts, USA. Available at www.inclusivecities.org.
Dias, Sonia M., (2000): “Integrating Waste Pickers for Sustainable Recycling”, Paper delivered at the Manila Meeting of the Collaborative Working Group (CWG) on Planning for Sustainable and Integrated Solid Waste Management, Manila, Philippines. Available at www.cwgnet.net.
Dimino, Resa (2010): Beyond Waste, A sustainable materials management strategy for New York State. New York State Department of Environmental Conservation, Albany, N.Y. USA
Doychinov, Nicola (2008): “The Bulgarian EkoPak Experience”. Presentation given at the IFC Recycling Linkages Summit, Belgrade, November 2008. IFC PEP SE, IFC, Ulica Makedonija 9-11/III, 1000 Skopje, Macedonia, www.ifc.org/pepse
Eerd, M. van (1996): The Occupational Health Aspects of Waste Collection and Recycling: A Survey of the Literature UWEP Working Document 4, Part I, WASTE, Gouda.
Folz, David (1998) “The many important ways recycling has changed.” Resource Recycling, September 1998, pp. 26-30.
Gille, Zsuzsa (2007): From the Cult of Waste to the Trash Heap of History: The Politics of Waste in Socialist and Postsocialist Hungary. Indiana University Press, Bloomington, Indiana, USA.
Gwebu, Thando C (2003): Population, Development, and Waste Management in Botswana, Conceptual and Policy Implications for Climate Change. Department of Environmental Science, University of Botswana.
IFC (International Finance Corporation) (2008): “The IFC Recycling Linkages Programme.” Presentation given at the CWG Workshop in Cluj-Napoca, Romania, February 20-22, 2008. Available at www.greenpartners.ro.
IJgosse, Jeroen, J. Anschütz and A. Scheinberg, (2004): Putting Integrated Sustainable Waste Management into Practice: Using the ISWM Assessment Methodology as Applied in the UWEP Plus Programme (2001–2003), WASTE, Gouda.
ILO/IPEC. (2004b): Addressing the Exploitation of Children in Scavenging: a Thematic Evaluation of Action on Child Labour. A Global Synthesis Report for the ILO prepared by WASTE, Gouda, the Netherlands. ILO, Geneva, Switzerland.
Ishengoma Alodia, and K. Toole (2003): “Jobs and services that work for the poor; Promoting Decent Work in municipal service enterprises in east Africa; the Dar es salaam Project and the informal economy.” Paper presented at the Knowledge-sharing workshop organized by INTEGRATION. ITC Turin Italy; 28 October – 1 November 2003.

The Botswana Recycling Guidelines 2012 Advice on Valorisation for Middle-Income Countries
147
Ishengoma, Alodia, and T. Lyimo (2002): “The Dar es Salaam experience to reduce poverty – promoting employment through urban services”” Paper presented at the World Urban Forum; Nairobi Kenya, 29 April – 4 May 2002.
Iskandar, Laila, Berti Shaker et al (2007): City Report for Cairo. Background document prepared by CID, Cairo Egypt, summarised in Scheinberg, Simpson and Gupt 2010). Available at www.giz.de.
Keita, Modibo M. (2003): Diagnostique de la Filiere de Recuperation de Dechets dans la Commune IV du District de Bamako, Rapport Final, COPIDUC, and Commune IV of Bamako. WASTE, Gouda, the Netherlands.
Kgathi, D. L. and Ben Bolaane (2001): Instruments for Sustainable Waste Management in Botswana. Department of Environmental Science, University of Botswana.
Kgosiesele, E and Zhaohui Luo (2010): An evaluation of waste management in Botswana: Achievements and challenges Journal of American Science
Ketlogetswe, C. and T. H. Mothudi (2005): Botswana‟s Environmental Policy on Recycling. Resources, Conservation and Recycling 44 (2005) pp. 333-342.
Kgosiesele, Ednah and Luo Zhaohui (2010): An Evaluation of waste management in Botswana: Achievements and Challenges. Journal of American Science 2010; 6(9), pp 144-150.
Lardinois, Inge and Arnold van de Klundert, (1994): “Informal resource recovery: The pros and cons.” WASTE, Gouda
Lardinois, Inge and Christine Furedy. (1999): Separation at Source, WASTE, Gouda.
Lifuka, Rueben (2007): City Report for Lusaka, resource document for Scheinberg, Simpson and Gupt 2010. Riverine Associates, Lusaka, Zambia
Medina, Martin (1997): Informal Recycling and Collection of Solid Wastes in Developing Countries: Issues and Opportunities. UNU/IAS Working Paper Number 24, The United Nations University/Institute of Advanced Studies, Tokyo, Japan
Medina, Martin (2009): Global Supply Chains in Chinese and Indian Industrialization: Impact on Waste Scavenging in Developing Countries UNU/WIDER Working Paper, The United Nations University/Institute of Advanced Studies, Tokyo, Japan
Melosi, Martin (1981): Garbage in the Cities, Refuse, Reform and Environment, 1880-1980. ; Texas A&M Press, College Station, Texas (USA).
Mol, Arthur P.J. (1995): The refinement of production: ecological modernisation theory and the chemical industry Van Arkel, International Books, Utrecht, the Netherlands
Mol, Arthur P.J. (2000): “The Environmental Movement in an Era of Ecological Modernisation.” Geoforum Volume 31 pp. 45-56.
Morris, Jeffrey (2000): “What works best to increase waste diversion?”. Resource Recycling, January 2000, 37-40.
Mokokwe, Kentlafetse (2008): Position Paper, Waste Reuse and Recycling. Botswana Ministry of Environment, Water, and Tourism, 2008.
Mokokwe, Kentlafetse (2008): Position Paper, Waste Separation at Source Project at Ramotswa. Botswana Ministry of Environment, Water, and Tourism, 2008
Motsumi, Sekgowa (2007, revised from 2004): Department of Environmental Affairs, Botswana.

148
Oelofse, Catherine, D. Scott, G. Oelofse, and J. Houghton (2006): “Shifts within ecological modernization in South Africa: deliberation, innovation and institutional opportunities,” Local Environment Volume 11 Number 1, pp 61-78.
Price, Jorge, A.R. Rivas, and I. Lardinois. (eds.) (1998): Micro and Small Enterprises, The Case of Latin America, WASTE, Gouda.
Republic Of Botswana (1998) Botswana's Strategy For Waste Management, First Edition, 1998.
Samson, Melanie (ed.) (2009): Refusing to be Cast Aside: Waste Pickers Organising Around the World.. WIEGO (Women in Informal Employment: Globalising and Organising), Cambridge, Massachusetts, USA. Available at www.wiego.org.
Scheinberg, Anne (2001a): Financial and Economic Issues in Integrated Sustainable Waste Management. In Scheinberg (2001): Integrated Sustainable Waste Management, Set of Five Tools for Decision-Makers WASTE, Gouda, the Netherlands.
Scheinberg, Anne (2001b) Micro and Small Enterprises in Integrated Sustainable Waste Management. In Scheinberg (2001): Integrated Sustainable Waste Management, Set of Five Tools for Decision-Makers WASTE, Gouda, the Netherlands.
Scheinberg, Anne (ed.) (2001): Integrated Sustainable Waste Management. Set of Five Tools for Decision-makers - Experiences from the Urban Waste Expertise Programme (1995 - 2001), WASTE, Gouda.
Scheinberg, Anne (2011): “Value Added: Modes of Sustainable Recycling in the Modernisation of WASTE Management Systems,” PhD Dissertation, Wageningen University, the Netherlands. Published by WASTE, Gouda, the Netherlands
Scheinberg, Anne and A.P.J. Mol (2010): “Multiple Modernities; transitional Bulgaria and the ecological modernisation of solid waste management,.” Environment and Planning C Volume 28 Number 1, pp. 18-36.
Scheinberg, Anne and Arnold van de Klundert (2005): ISWM Case Study: Developing the Dar es Salaam – UNIDO Recycling Processing Centre. UN Industrial Development Organisation (UNIDO), Vienna, Austria. Available at www.waste.nl.
Scheinberg, Anne and Jeroen IJgosse. (2004): “Waste Management in the Netherlands.” Report Prepared for UNITRABALHO, Recife, Brazil. WASTE, Gouda, The Netherlands
Scheinberg, Anne, and Justine Anschütz (2007): “Slim pickin‟s: Supporting waste pickers in the ecological modernisation of urban waste management systems”. International Journal of Technology Management and Sustainable Development, Volume 5, number 3, pp 257-270.
Scheinberg, Anne, David C. Wilson and Ljiljana Rodic (2010): Solid Waste Management in the World‟s Cities. UN-Habitat‟s Third Global Report on the State of Water and Sanitation in the World‟s Cities. Earthscan Publications, Newcastle-on-Tyne, UK
Scheinberg, Anne, Aleksandra Mitrovic, and Valentin Post (2007): Assessment Report: Needs of Roma Collectors and Other Stakeholders in the PEP SE Region for Training, Technical Assistance, and Financial Services and Recommendations for Programmatic Response. Prepared for the Recycling Linkages Private Enterprise Programme South East Europe (PEP SE) of the International Finance Corporation, Skopje, Macedonia
Scheinberg, Anne, Michael Simpson and Yamini Gupt (2007): Economic Aspects of the Informal Sector in Solid Waste. Unpublished draft research report. German Technical Co-operation, Eschborn, Germany. Available at www.waste.nl and www.giz.de. (NB: rewritten and published under the same authors in 2010).
The Botswana Recycling Guidelines 2012 Advice on Valorisation for Middle-Income Countries
149
Scheinberg, Anne, Michael H. Simpson, and Yamini Gupt (2010): Economic Aspects of the Informal Sector in Solid Waste, Final Report and Annexes. GIZ (German International Co-operation), the CWG (Collaborative Working Group on Solid Waste Management in Low- and Middle-income Countries, and the German Ministry of Foreign Affairs, Eschborn, Germany. Available at www.GIZ.de.
Scheinberg, Anne, (2012), WIEGO, Informal Sector Integration and High Performance Recycling: Evidence from 20 cities, Working Paper No 23, www.wiego.org
Simpson, Michael (1993): “Lapaks and Bandars Convert MSW in Indonesia.” Biocycle, June 1993.
Simpson-Hebert, May Ling, A. Mitrovic, and G. Zajic. (2005): A Paper Life, WEDC, Loughborough University, Loughborough, UK.
Smink, Carla K. (2002): Modernisation of Enviornmental regulations. End-of-Life Vehicle regulations in the Netherlands and Denmark, PhD Dissertation, Aalborg (Denmark) University, Aalborg.
Soos, Reka, and Ciprian Popovici, (2008): Planning In the Real World, Challenges of Sustainable and Affordable Modernisation in the Solid Waste Sector. Report of the CWG International workshop, Cluj-Napoca, Romania, 22 and 23 February, 2008. Green Partners, str. Fintinele 18, 400294 Cluj-Napoca, Romania. Available at www.greenpartners.ro
Srinivasan L., 1990 Tools for Community Participation. A manual for training trainers in participatory techniques, Prowwess/UNDP, New York, USA
Tompkins County New York (2012). Case Study for the USEPA Zero Waste Initiative.
Tompkins County, New York (1995): Tompkins County Solid Waste Management Plan.
Tones, Per (ed.) (1988): The Sociology of Consumption. Oslo, Slum For lag A.S, Chapter 7.
UNDP (2002): Country Profile of Botswana, made for the Johannesburg Local Agenda 21 Summit, 2002,
UNEP-IETC (1997): The UNEP Solid Waste SourceBook. United Nations Environmental Programme, International Environmental Technology Centre (UNEP-IETC), Osaka, Japan.
Urban Waste Expertise Programme Plus (UWEP Plus) (2003): Progress Reports of the UWEP Plus Programme, (2001–2004). WASTE, Advisers on Urban Environment and Development, Nieuwe Haven 201, 2801 CW Gouda, the Netherlands. downloadable from www.waste.nl
UWEP Plus (2005): Reports of the Urban Waste Expertise Programme Plus, 2001-2004. WASTE, Advisers on Urban Environment and Development, Nieuwe Haven 201, 2801 CW Gouda, the Netherlands. downloadable from www.waste.nl
Vest, Heino (1999): Guidelines for the promotion of recycling projects in Botswana, Department of Solid Waste Management, Gabarone, Botswana.
WASTE, (2010): Three-day training on Recycling, Composting, and Special Wastes, Two-day Training on Economics and Finances of Integrated Sustainable Waste Management, both developed for the project “Fair Waste Practices” in South Serbia. WASTE, Gouda, the Netherlands
WIEGO, Women in the Informal Economy Globalising, Organising. www.wiego.org.
Wilson, David C, Anne Scheinberg, and Ljiljana Rodic (2010): “Comparative Analysis Of Solid Waste Management In Cities Around The World”. UK Solid Waste Association, November 2010.

150
Wilson, David C., 2007: “Development Drivers for Waste Management.” Waste Management and Research Volume 25, pp. 198-207.
Wilson, Sir David C., C. Velis, and C. Cheesman. (2006): “Role of informal sector recycling in waste management in developing countries.” Habitat International 30, pp 797-808.