the blues - petroleumstilsynet · the blues is a musical form often associated with melancholy. its...
TRANSCRIPT


2

3
THE BLUES is a musical form often associated with melancholy.Its starting point is a simple, repeated 12-bar chord sequence. Butit can have many other musical extensions, and development of theharmonic framework of the blues has been particularly noteworthy injazz. A musician playing the blues will always work within the basic12-bar structure, which allows them to concentrate on interpretingand conveying the message of the music in lyrics and melody.INDICATORS normally refer to the condition, level or status ofsomething, and are usually measurable and presented numerically.Ideal indicator systems contain information used both to defineactivities which prevent incidents and to measure the outcomesachieved by safety systems. Indicators have probably been emergedbecause humans like them. They can tell us something understandable,and provide guidance in complex and difficult areas.THIS BOOKLET is meant to challenge, involve and encourage re-flection. We seek to provide an “indicator blues”, structured toencompass challenges, opportunities, conflicting goals, choices,decisions and the consequences of using indicators.

A debate on the use of indicators often occurs in the wake of majoraccidents. These discussions concern such issues as the nature of anindicator, what information it can or cannot provide, and how appropriateyardsticks can be developed.
Questions addressed include the distinction between reactive andproactive indicators and how to develop yardsticks which can give earlyand reliable information for averting major accidents.
Indicators can be used as one of several sources to monitor and assessthe level of risk. They should be able to support decisions and giveguidance on necessary measures for monitoring the risk level. And theyshould motivate management and others to take the right steps to avoidaccidents.
Norway’s petroleum regulations require the responsible party to establishmeasurement parameters to monitor factors of significance to health,safety and the environment (HSE). Indicators must also be established formonitoring changes and trends in major accident risk and environmentalrisk.
4

5
Like to know more?Section 10 of themanagement regulation onmeasurement parameters and indicators
These indicators are meant to be used as tools for managing risk and forkeeping facilities, plants, people and the environment secure.
One challenge is the lack of general agreement on what constitutes valid,effective or reliable indicators for different aspects of HSE risk, or how theseshould be operationalised.
This booklet addresses the indicator concept, the difference betweenproactive and reactive indicators, and the interaction between indicatorsand human/organisational factors.
The aim is to present a simple overview of the way indicators can be used tomonitor contributors to risk, how they can support decisions or mislead, andhow they can affect organisational practice and the motivation of individuals.
No pat answers are provided. Instead, the purpose is to challenge, involveand encourage reflection. Indicators can sometimes be perceived as un-challengeable. This booklet seeks to make it easier to question them andto illuminate various conditions which underpin their development andapplication.

7
INDICATORS - IN THEORYThe guidelines to section 10 of the management regulations state that “theindicators should be both proactive and reactive, and reflect technical, or-ganisational and human factors”. A proactive strategy for risk managementcan be defined as one which seeks to determine the boundaries of safeoperation, make these visible to decision-makers, and counter conditionswhich shift activities closer to these limits. Proactive indicators will supportthe cautionary principle by providing information on the performance of keywork processes, activities or barriers.
These are intended in turn to prevent future incidents, and come into playbefore control over the position has been lost and an undesirable incidentoccurs. A similar concept is the activity indicator, which measures how farimportant safety philosophies, procedures and practices are in place tomanage risk.
Reactive indicators measure something which has happened, be it afailure, a near miss or an accident. A related concept is the outcomeindicator, which measures how safety-related activities achieve the desiredoutcome. By definition, reactive indicators are based on measurementsmade after an event has taken place.
A distinction is also drawn between indicators related to processsafety/major accidents and those which deal with personal safety. The firstof these categories covers hazards related to activities or results withsignificance for all or most of a facility or a plant. Failures or accidents cancause many deaths, great damage to equipment or extensive destruction.Indicators for personal safety deal with hazards affecting people in the formof personal injury, and have little or no relationship with major accident risk.
Like to know more?Rasmussen & Svedung (2000)Proactive risk management in a dynamic societyHollnagel, Woods & Leveson(2006)Resilience engineering: Conceptsand preceptsReiman & Pietikäinen (2012)Leading indicators of system safety– Monitoring and driving the organizational safety potential

8
Such yardsticks do not in themselves provide information on how well theorganisation manages major accident risk or protects a facility’s integrity.Using personal safety indicators and minor near misses to express majoraccident risk would be considered unsound by most people.
In order to monitor and influence various types of risk, organisations mustknow something about what could happen, what is happening and whathas happened. That means knowing the past and learning from experience. They must also monitor in the present, and have managers, specialists andoperators who can provide an overall view of and insights into importantactivities and results for safety.
At the same time, companies must seek to predict what can happen in thefuture. Proactive indicators involve trying to forecast what might occur, be-cause the companies want to identify and monitor activities they think affectsafety now and in the future. This means they must have a scientific basisor good reasons for assuming that given operations lead to the desired out-comes. A challenge in identifying the underlying causes of major accidentsis that such relationships are very hard to determine in advance. The wholecausal chain leading to an undesirable incident can normally only be iden-tified with hindsight. And the further back you go in the chain, the weakerthe link with the incident. A key issue in the debate concerns how far it ispossible to identify cause and effect between proactive indicators andnegative safety outcomes such as accidents.
Two conditions may correlate or be sequential, but one does not neces-sarily give rise to the other (causality). A correlation means that A leads toB or vice versa, or that one or more third conditions (C) cause both A andB. A relationship has been found, for example, between ice cream sales

9
and murders in New York. Does that mean people who eat ice cream becomeviolent? This is very unlikely, and both variables proved to be influenced by athird – the weather. Both ice cream sales and criminality increase on hot days.Despite the correlation, the one did not cause the other.
Where indicators for major accident risk are concerned, experts disagreeover whether causality needs to be demonstrated between yardsticks andthe phenomenon they measure. The alternative view considers it sufficientto show or assume that the relationship is strong and that the numbers arelarge enough to be able to document trends over time.
RECOMMENDED PRACTICE, STANDARDS AND GUIDELINESRecommended practice, standards and guidelines provide the good recipesfor establishing, using and evaluating indicators in practice. They also describemodels which can make it easier to understand these yardsticks.
Indicators form part of an organisation’s internal control and managementsystem, and are components in its processes for ensuring continuous im-provement. When used correctly, they can allow comparisons to be madeacross groups, facilities, fields and players, and contribute to experiencetransfer and learning. They can also be used in reporting to employers,employees, the government or the general public.
Indicator hierarchies are models which can be used to evaluate levels andstructures for reporting safety-related activities and results. The reportinglevel determines whether the indicator will apply to the whole organisation,a group of facilities, a single facility or specific activities. Within thisstructure, measurements from separate facilities are collated to create in-tegrated indicators valid for a whole field or the entire organisation.
Like to know more?API (2010) Recommended practice 754EI (2010) Human factors performance indicators ISO 31000 Risk management.Principles and guidelinesISO 9001 Quality managementsystems HSE (2006) Developing processsafety indicators OGP (2011) Report 456OECD (2008) Guidance ondeveloping safety performanceindicators

10
Required indicators will vary between each facility or field and to meet theneeds of top management within the organisation. The American PetroleumInstitute (API) recommends that indicators or information selected for seniorlevels in the company should be representative for the whole organisation.On individual facilities, however, proactive indicators related to specificactivities could be more desirable.
Creating reactive indicators is easier, since these reflect actual near missesor accidents. Proactive versions, on the other hand, address conditionsfurther back in the causal chain. So developing good proactive indicatorscan be difficult. Complex causality makes it hard to form a full picture ofactivities and conditions which influence the system’s condition. In an effortto understand the role of indicators in the course of an accident, a numberof guidelines have tried to relate them to the “Swiss cheese” model. It isimportant to appreciate that this approach can involve both a simplificationof the original model and a constraint on the indicator concept.
The model assumes that an organisation builds up successive layers ofdefence against accidents. Comprising both barriers and safeguards, theseare visualised as slices of cheese. Each defensive “slice” may incorporateflaws, which are in constant motion. An incident can only occur if these“holes” align while an accident trajectory passes through. The holes in thecheese can be active or latent failures. While the active type is short-lived,latent conditions represent long-term faults in the system – such asunanticipated hazards which have not been defended against.
Efforts have been made to position indicators in the Swiss cheese model,where the proactive type measures the performance of the slices andreactive ones gauge the holes – in other words, unsafe acts or latent
Like to know more?Reason (2008)
The Human Contribution

11
conditions. This has been criticised for making the concepts less clear, be-cause proactive usually relates to something which precedes a loss ofcontrol or an undesirable incident. The alternative way of viewing indicatorsin this model is to say that those on the cheese slices and holes areproactive as long as they precede an incident. Reactive indicators aremeasures made after the event.
Britain’s Health and Safety Executive (HSE) recommends that both aproactive and a reactive indicator should be established for each riskcontrol system or barrier function. Interaction between these two yardstickswill either confirm that the system is functioning as it should or sound awarning that problems are developing. The same recommendation hasbeen given by the Organisation for Economic Cooperation andDevelopment (OECD). It says that each activity (or proactive) indicatorshould have an associated outcome (or reactive) one. Describing indicatorsas part of a continuous improvement process, with information which canbe used both proactively and reactively, is a common denominator ofrecommended practice, standards and guidelines.
Although indicators can be viewed in relation to barriers activated in theshift from normal operation towards failures, hazards and accidents, theconcept is actually more extensive. It will cover a number of activities foundin normal operation but not reflected in barrier models. Good indicator sys-tems should also be able to pick up weak signals or early warnings ofweaknesses and failures which might lead to accidents.


13
ON THE STRAIGHT AND NARROWMany scientific requirements exist for good measurements. One is thatindicators should be valid. This means they must relate to and measurewhat is to be measured – such as major accident risk. Documenting whateffect using the indicator has or how it affects major accident risk is alsorequired. And it must be reliable and unaffected by accidental factors. Thismeans, for example, that results must be the same even if different peopleconduct the measurements related to the relevant indicator. That hasnothing to do with whether the indicator is valid, but whether it is affectedby uncontrolled variables or circumstances. A thermometer can measuretemperature reliably, for instance. But if a calibration error means it reads10°C too much, its results will not be valid in deciding whether you have afever. Similarly, a watch can be correctly set and run steadily. But if the timesetting changes each time your wrist moves too sharply, it will not bereliable.
Indicators must also be sensitive to changes in what they measure. In otherwords, they must respond to variations in risk. A thermometer which onlyworked in 10-degree steps would not be sensitive enough to measure afever. Furthermore, indicators need to be representative and addressfactors relevant to major accident risk. And finally they should not bevulnerable to manipulation. This means it must not be possible to affect thefigures or assessments on which the indicator rests unless an actualchange has occurred in what is to be measured.
Little systematic empirical research exists for indicators in the petroleumsector, and documented correlations between these and major accidentsare lacking (uncertainty about validity).

14
Major accident risk and safety are complex phenomena in a constant stateof change. It is still not possible to predict the interaction between all thefactors which may lead to accidents. One challenge is that the further backyou go in a causal chain, the harder it becomes to identify correlations(validity) which lead to an accident, for example. So concentrating onvalidity can overlook early warnings or signals of failure.
Oversimplifying the indicator system in order to satisfy scientific standardsrisks ending up with results which cannot be transferred to the much morecomplex real world. That can be viewed as a choice between taking theright route, with scientifically acceptable but perhaps impractical indicators,or trying to find a useful path. It will be more difficult in the latter case todemonstrate that the indicators correlate with major accidents or have thedesired effect. But the activities and results underlying them are consideredlikely to be important for safety. Scientists debate whether it is enough tobe convinced that some activities affect safety – through expert assess-ment, for example – or whether a causal relationship must be proven.
British philosopher Carveth Read wrote in 1898: “It is better to be vaguelyright than exactly wrong”. This can serve as a reminder that it is better insafety work to be on the safe side, and that important information is notonly numerical. The counterargument would be that failing to observescientific standards risks constructing safety systems which are potentiallycounterproductive and fail to manage risk. The challenge is to strike a goodbalance between these extremes.

15


17
GONE ASTRAYEnvisage the following circumstances. This year’s trends in risk level(RNNP) report from the PSA is ready for publication. The media andselected guests have been called in to hear the findings. These include asteady downward trend over recent years in the risk indicators for majoraccidents, which is now lower than ever. The next day’s media headlinesread: “Risk of major accidents lower than ever”.
This might be a reasonable conclusion for people without expert knowledgeof the RNNP indicators to reach. One question which ought to be asked iswhether reactive indicators for major accident risk – which measure whathas happened – can be used to predict the future.
Safety research has demonstrated that people have a tendency to equateproactive and reactive indicators. To some extent, the latter reflect the out-come of important activities to enhance safety. This means reactiveindicators are also relevant in the future, assuming the activities involveddo not change. That depends, too, on other important operating parametersstaying unchanged. These include financial or political conditions,regulatory requirements or standards, management priorities andcontractual terms.
Like the government, employer organisations and unions in Norway areconcerned to ensure that systematic efforts to improve HSE never end. At thesame time, many major changes are afoot in the Norwegian petroleum sector.Oil prices are low, and most operators and contractors on the Norwegiancontinental shelf (NCS) agree that costs must come down. The industry isdownsizing and pursuing efficiency and restructuring processes, whilecompany plans for maintenance and modification are changing. Suchprocesses can have positive results. But risk may be affected by a transitional

18
period of this kind, with changing operating parameters and conditions. Thequestion is whether the indicators for major accident risk are still credibleand valid measures of the present level of risk. Are conditions undercontrol?
Using indicators can lead you astray. A key challenge arises when they areincorporated in a performance management system using incentives ofvarious kinds to achieve specific targets. Incentives or sanctions tied toindicators could encourage a desire to manage these rather than thephenomena they are meant to monitor.
Among other applications, indicators are intended to influence or amendthe way individuals and groups in organisations act, think and feel aboutimportant conditions for safety. This could seem a rather unusual way tothink about such yardsticks, but it follows logically from their purpose. Mostindicators will eventually require decision-makers and others to act or makechanges on the basis of the information provided in order for the yardsticksto be effective.

19

21
EFFECT AND AFFECTA blowout, explosion and fire occurred on the Deepwater Horizon rig drillingon the Macondo well in the Gulf of Mexico on 20 April 2010. Eleven peopledied, a number of others were seriously injured and the unit sank after twodays. More than four million barrels of oil flowed freely from the well beforethe leak was plugged after 87 days.
In the wake of this disaster, its causes have been related in part to the inter-pretation, use and effects of indicators at individual, group and or-ganisational levels.
MENTAL SHORTCUTS AND BIASESAlthough attention was also being paid to safety before the Macondoaccident, major accident risk had been measured using indicators forpersonal safety. Investigations have shown that the latter fail to provide arelevant picture of major accident risk. The indicators being measured att-racted attention. Several reports found that people were more concernedto manage through personal safety indicators. This could have createdfalse confidence that the major accident risk was low.
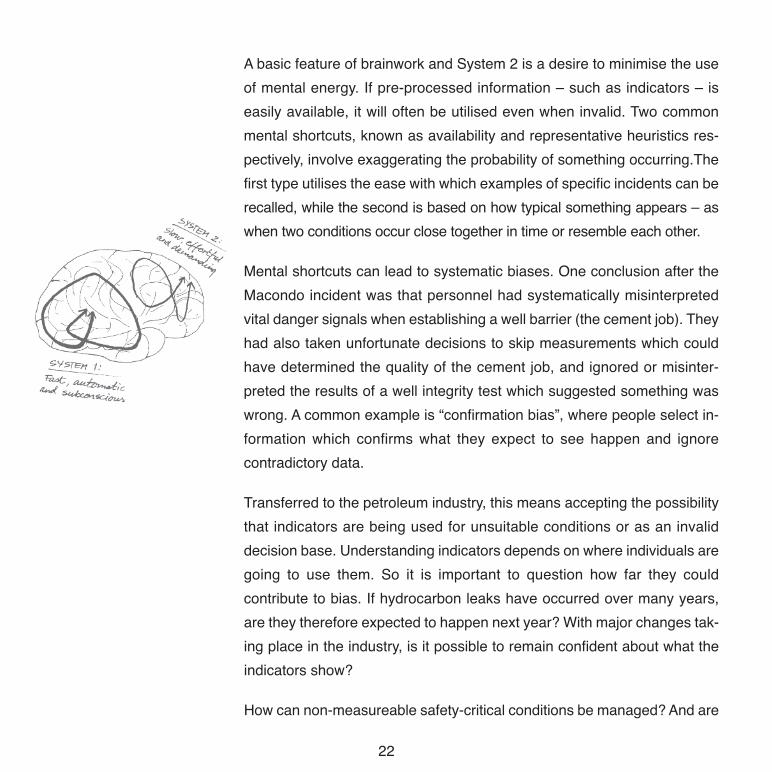
For better or worse, indicators are ideal for people’s mental apparatus. Thisis because the brain constantly seeks to create causes and effects. Theseare stored as mental recipes or heuristics – simplifications of reality whichhelp to find suitable, but often incomplete, answers to difficult questionsand to take decisions. Two different systems for information processing canbe distinguished in the brain, with the first automatic and swift, requiringlittle involvement and beyond conscious control. The second system ismentally demanding and involves consciously focusing attention, solvingproblems and comparing information.
Like to know more?Hopkins (2012)Disastrous DecisionsKahneman (2011)Thinking fast and slowPSA A book about learningStørseth, Hauge & Tinmannsvik (2014)Safety barriers: Organizational potential and forces of psychology
22
A basic feature of brainwork and System 2 is a desire to minimise the useof mental energy. If pre-processed information – such as indicators – iseasily available, it will often be utilised even when invalid. Two commonmental shortcuts, known as availability and representative heuristics res-pectively, involve exaggerating the probability of something occurring.Thefirst type utilises the ease with which examples of specific incidents can berecalled, while the second is based on how typical something appears – aswhen two conditions occur close together in time or resemble each other.
Mental shortcuts can lead to systematic biases. One conclusion after theMacondo incident was that personnel had systematically misinterpretedvital danger signals when establishing a well barrier (the cement job). Theyhad also taken unfortunate decisions to skip measurements which couldhave determined the quality of the cement job, and ignored or misinter-preted the results of a well integrity test which suggested something waswrong. A common example is “confirmation bias”, where people select in-formation which confirms what they expect to see happen and ignorecontradictory data.
Transferred to the petroleum industry, this means accepting the possibilitythat indicators are being used for unsuitable conditions or as an invaliddecision base. Understanding indicators depends on where individuals aregoing to use them. So it is important to question how far they couldcontribute to bias. If hydrocarbon leaks have occurred over many years,are they therefore expected to happen next year? With major changes tak-ing place in the industry, is it possible to remain confident about what theindicators show?
How can non-measureable safety-critical conditions be managed? And are

23
there differences between the way indicators are interpreted by specialistson the one hand and understood by management, media and offshoreworkers on the other?
MOTIVATIONPeople are motivated by jobs which are specific, measurable, attainable,relevant and time-bound, which they master and which they achieved goodresults with earlier. Indicators have many of these properties. They arespecific and measurable, reflect something in the real world, and cover adefined period. They provide fully processed information, often in visualform, and invite the brain to do what it does best – draw quick, automaticand simplified conclusions about reality.
If the indicators are good, judicious and accurate, utilising them can beuseful. But should they be detailed and difficult to grasp, people can quicklybe misled. Indicators can also be useful and appropriate from an expert’sperspective, while decision-makers and others may fail to appreciate im-portant shortcomings in the information they provide and generalise this toareas where it is no longer valid.
Motivation deals with the internal and external forces which initiate actionand determine its direction, intensity and duration. These are factors whichallow problems to be solved in specific ways, and which determine thecommitment people make to their work. A distinction is generally made be-tween intrinsic and extrinsic motivation, with the first referring to the waywork is experienced as intrinsically meaningful and rewarding. The feelingof being able to influence your own work, perform well and master the jobsyou do will strengthen this intrinsic motivation. That can be reinforced byan indicator which helps to give you a better understanding of the
24
significance of your work for what the indicator measures, and which youfeel you can influence.
Costs were under tight scrutiny in the Macondo organisation, where drillingwas not doing well on efficiency indicators. It was among the 10 worst interms of days per 10 000 feet drilled, and for the non-productive timeindicator. Performance-based bonus schemes for management weregoverned by drilling efficiency, and attention in personal evaluationsnormally concentrated on costs and performance. Some possible effectsof this included the choice of cheaper and faster well solutions and thedropping of safety-critical tests which called for longer rig time. Similarly,well tests which should have been carried out during exploration drillingwere hopped over and left to the people who would be completing the wellfor production.
Extrinsic motivation refers to sources of behaviour which are governed byoutside rewards, and which relate to results rather than the work itself. Per-formance pay and indicator-based bonuses are examples of this, but otherscould be praise and positive feedback. Aims can include promoting learn-ing, concentrating attention and motivating safety improvements. Researchshows that performance pay for individuals is generally positive with simpleand boring jobs, boosting commitment and results, but negative for morecomplex and interesting work. Absence of rewards can also be perceivedas punishment, and doing away with them may reduce motivation to belowthe level before the system was first introduced. Moreover, althoughexternal rewards influence commitment, they do not increase employeeknowledge, skills or ability to perform well. If financial reward systemsrelated to indicators are nevertheless to be adopted at the individual level,
Like to know more?Janis (1971)Groupthink

25
some questions need to be asked. These include what is actually beingrewarded, does this present possible downsides, and is anything beingachieved with external rewards which could not be attained in other ways?
“THAT’S THE WAY WE DO THINGS HERE”Humans are specialists at interacting with each other. In addition to normsand values, groups form shared perceptions of the things they feel helpthem to perform tasks. Colleagues and managers teach new members ofthe group the right way to perceive, think and feel in relation to the problemsand jobs to be tackled. These are building blocks in the organisationalculture, and provide strong guidance on decision-making, problem-solvingand ways to act for individuals and groups. On the other hand, externalfactors and operating parameters will affect an organisation’s culture. Whenparameters come under pressure, a robust HSE culture can play a key roleas a protective buffer to ensure that a high priority is given to safety.
After test results indicated a leak in the Macondo well, a theory (known asa bladder effect) was propounded to explain that the well was safe despitethe poor results. In addition to drilling personnel from the contractor, theteam involved included two representatives from the operator company.The culture among the drilling crew has been described as close-knit, withable professionals who took a proprietorial attitude to each well and wereused to being in charge. Strong group pressure was also observed, wherepowerful sanctions were imposed against people asking “unintelligent”questions. While the operator employees were initially sceptical to thebladder effect, one of them soon came round to the theory and the otherthen also agreed.

26
Following the disaster, one of the operator personnel said that he felt theothers found it laughable that he was doubtful about the theory.
What happened within this group has subsequently been related to theconcepts of “normalising” danger signals and of “groupthink”. Normalisationinvolves redefining or interpreting failures or faults in such a way that theyare eventually regarded as acceptable. Group thinking describes a type ofproblem-solving where the search for agreement overrides a realistic as-sessment of alternative approaches or interpretations.
In the wake of an undesirable incident, it can be difficult to grasp theposition the players found themselves in before the event occurred and theoutcome was known. The tendency is to disregard other possible out-comes. Instead of the uncertainty faced by players ahead of an unexpectedevent being appreciated, they get blamed for failing to understand what isobvious with hindsight. Nevertheless, complex systems fail in complexways. Looking at how indicators affect individuals or groups is not enough.Attention must be paid to the way indicators shape organisationalframeworks, which in turn affect employees.
CONFLICTING GOALS AND ORGANISATIONALFRAMEWORKSRobust organisations must be able to balance conflicting demands be-tween production or efficiency needs and safety requirements, for instance.A number of decisions were taken ahead of the Macondo accident to savetime or money without their consequences for safety being adequately as-sessed. Downsizing and cutbacks, concentrating on doing the job fasterand cheaper, and incentives which rewarded this, are among the conditions

27
subsequently subject to criticism. Important tools intended to identifypotential problems and the consequences of hazards concentrated only onpossible negative effects for time and costs, and took no account of safetyimpacts. Pressure on costs drove decisions in the direction of removing or-ganisational redundancy, which also affected safety. It led in part toinsufficient staffing and lack of training.
The following familiar challenges related to indicators used to provide baseinformation for major accident risk were identified after the accident.
• Excessive weight is given to indicators for accident trends (historical per-formance) when assessing accident risk (future performance).
• Great weight is given to indicators for accident trends (such as workaccidents) despite their limited relevance for assessing major accident risk.
• Information relevant for assessment in conjunction with accident trendsis available but not used, particularly if accidents show a decliningtendency.
• Important information on accident risk or uncertainty is filtered away.


29
OVERVIEW OF INDICATORSCountless conditions can form part of a chain of events which maycollectively represent an HSE risk. Many of these will be unknown. Estab-lishing indicators for conditions further back in the chain is difficult, partlybecause it can be hard to determine such relationships. But choosing toignore them risks missing weak but early and important warning signals.Where the consequences can be serious, “it is better to be vaguely rightthan exactly wrong”. Staying on the safe side is also crucial to the way thePSA as the regulator wants the industry to relate to risk.
Scientists and international guidelines distinguish between indicatorsrelated specifically to risk and those assumed to have such a relationship.The same applies to the effects of using the indicators. Proving that exertinginfluence on an indicator in a positive direction helps to enhance safety isdifficult, but good reasons may exist for assuming that it does. Another wayof saying this is that indicators for activities, desired outcomes and safetysystems can be based on what technical experts, operating personnelmanagement and union representatives agree on and believe are importantfor handling risk. Worker participation, dialogue and collaboration increasethe chance that activities and results enshrined in the indicators are under-stood and motivate personnel in the desired direction which are importantand coveted outcomes.
Indicators have probably emerged because humans like them. They cantell us something understandable, and provide guidance in complex anddifficult areas. As in the blues, indicators involve challenges, opportunities,choices and consequences. Good ones present challenges for the industryto tackle.

30
This represents a positive effect if it prompts increased attention on areaswhich all sides believe are important for HSE, and which the industry candemonstrate progress with. Nobody wants indicators to be more importantin themselves than the aspects they are intended to say something about– such as occupational health, the safety of facilities and plants, andenvironmental protection. Using indicators must be beneficial.
Norway has a performance-based (functional) regulatory regime, whichgives companies freedom to choose recommended solutions or recognisedalternatives. But this freedom is accompanied by an expectation fromgovernment that the industry conducts thorough follow-up of its ownactivities. Indicators will also provide a simplified presentation of reality,with its degrees of uncertainty. They therefore are and must remain onlyone of many tools for managing risk.

31
