the blackstone group l.p. -...
TRANSCRIPT
UNITED STATESSECURITIES AND EXCHANGE COMMISSION
WASHINGTON, D.C. 20549
FORM 8-K
CURRENT REPORTPursuant to Section 13 or 15(d)
of the Securities Exchange Act of 1934
Date of Report (Date of earliest event reported): January 26, 2017
The Blackstone Group L.P.(Exact name of Registrant as specified in its charter)
Delaware 001-33551 20-8875684
(State or other jurisdiction ofincorporation)
(CommissionFile Number)
(I.R.S. EmployerIdentification No.)
345 Park AvenueNew York, New York 10154
(Address of principal executive offices) (Zip Code)
(212) 583-5000(Registrant’s telephone number, including area code)
NOT APPLICABLE(Former name or former address, if changed since last report)
Check the appropriate box below if the Form 8-K filing is intended to simultaneously satisfy the filing obligation of the registrant under any of the following provisions (see GeneralInstruction A.2. below):
☐ Written communications pursuant to Rule 425 under the Securities Act (17 CFR 230.425)
☐ Soliciting material pursuant to Rule 14a-12 under the Exchange Act (17 CFR 240.14a-12)
☐ Pre-commencement communications pursuant to Rule 14d-2(b) under the Exchange Act (17 CFR 240.14d-2(b))
☐ Pre-commencement communications pursuant to Rule 13e-4(c) under the Exchange Act (17 CFR 240.13e-4(c))

Item 2.02 Results of Operations.
On January 26, 2017, The Blackstone Group L.P. issued a press release and detailed presentation announcing financial results for its fourth quarter and full year endedDecember 31, 2016.
The press release is attached hereto as Exhibit 99.1. All information in the press release is furnished but not filed.
Item 9.01 Financial Statements and Exhibits.
(d) Exhibits. ExhibitNo. Description
99.1 Press release of The Blackstone Group L.P. dated January 26, 2017.
i

SIGNATURE
Pursuant to the requirements of the Securities Exchange Act of 1934, the registrant has duly caused this report to be signed on its behalf by the undersigned hereunto dulyauthorized.
Date: January 26, 2017
The Blackstone Group L.P.By: Blackstone Group Management L.L.C., its General Partner
By: /s/ Michael S. ChaeName: Michael S. ChaeTitle: Chief Financial Officer
ii

Exhibit 99.1
Blackstone Reports Fourth Quarter and Full Year 2016 Results
New York, January 26, 2017 : Blackstone (NYSE:BX) today reported its fourth quarter and full year 2016 results.
Stephen A. Schwarzman, Chairman and Chief Executive Officer, said, “Blackstone’s most recent results marked a strong finish to a turbulent year, as fourth quarter earnings nearlydoubled versus the prior year period. Full year earnings rose significantly due to greater appreciation across the investment funds as well as strong growth in fee related income. Our robustinvestment returns attracted best-in-class capital inflows, driving Total Assets Under Management to $367 billion, another record. And we continue to pay substantial distributions to ourunitholders, delivering over $8 billion of value in the past three years, which is the highest of any public firm in our industry.”
Blackstone issued a full detailed presentation of its fourth quarter and full year 2016 results, which can be viewed at www.blackstone.com .
Distribution
Blackstone has declared a quarterly distribution of $0.47 per common unit to record holders of common units at the close of business on February 6, 2017. This distribution will be paid onFebruary 13, 2017.
Quarterly Investor Call Details
Blackstone will host a conference call on January 26, 2017 at 11:00 a.m. ET to discuss fourth quarter and full year 2016 results. The conference call can be accessed via the Investorssection of Blackstone’s website at www.blackstone.com or by dialing +1 (877) 391-6747 (U.S. domestic) or +1 (617) 597-9291 (international), pass code 149 943 55#. For those unable tolisten to the live broadcast, a replay will be available on www.blackstone.com or by dialing +1 (888) 286-8010 (U.S. domestic) or +1 (617) 801-6888 (international), pass code453 218 99#.
About Blackstone
Blackstone is one of the world’s leading investment firms. We seek to create positive economic impact and long-term value for our investors, the companies we invest in, and thecommunities in which we work. We do this by using extraordinary people and flexible capital to help companies solve problems. Our asset management businesses, with over $360 billionin assets under management, include investment vehicles focused on private equity, real estate, public debt and equity, non-investment grade credit, real assets and secondary funds, all ona global basis. Further information is available at www.blackstone.com . Follow Blackstone on Twitter @Blackstone . The Blackstone Group L.P.345 Park AvenueNew York, New York 10154T 212 583 5000
Forward-Looking Statements
This release may contain forward-looking statements within the meaning of Section 27A of the Securities Act of 1933 and Section 21E of the Securities Exchange Act of 1934 whichreflect Blackstone’s current views with respect to, among other things, Blackstone’s operations and financial performance. You can identify these forward-looking statements by the use ofwords such as “outlook,” “indicator,” “believes,” “expects,” “potential,” “continues,” “may,” “will,” “should,” “seeks,” “approximately,” “predicts,” “intends,” “plans,” “estimates,”“anticipates” or the negative version of these words or other comparable words. Such forward-looking statements are subject to various risks and uncertainties. Accordingly, there are orwill be important factors that could cause actual outcomes or results to differ materially from those indicated in these statements. Blackstone believes these factors include but are notlimited to those described under the section entitled “Risk Factors” in its Annual Report on Form 10-K for the fiscal year ended December 31, 2015, as such factors may be updated fromtime to time in its periodic filings with the Securities and Exchange Commission, which are accessible on the SEC’s website at www.sec.gov. These factors should not be construed asexhaustive and should be read in conjunction with the other cautionary statements that are included in this release and in the filings. Blackstone undertakes no obligation to publicly updateor review any forward-looking statement, whether as a result of new information, future developments or otherwise.
This release does not constitute an offer of any Blackstone Fund.
Investor and Media Relations Contacts Joan SolotarBlackstoneTel: +1 (212) 583-5068 [email protected]
Weston TuckerBlackstoneTel: +1 (212) 583-5231 [email protected]
Christine AndersonBlackstoneTel: +1 (212) [email protected]
2
Blackstone’s Fourth Quarter and Full Year2016 Earnings
January 26, 2017
Blackstone 1
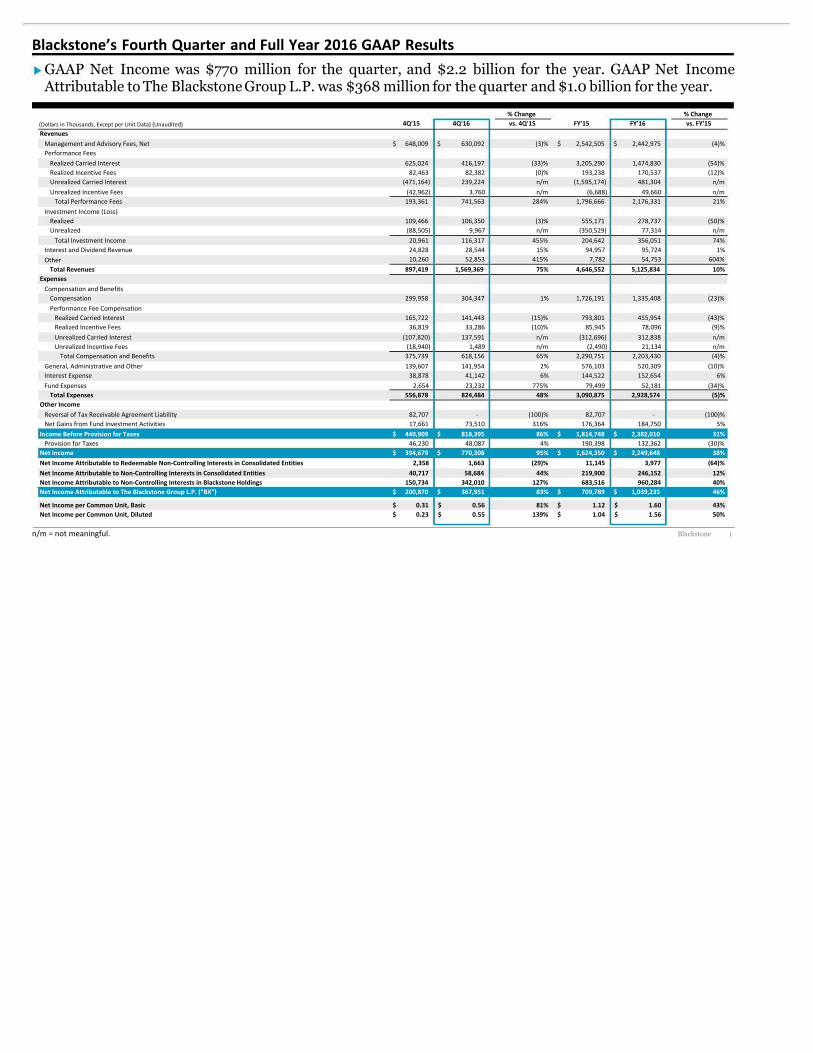
Blackstone’s Fourth Quarter and Full Year 2016 GAAP ResultsGAAP Net Income was $770 million for the quarter, and $2.2 billion for the year. GAAP Net IncomeAttributable to The Blackstone Group L.P. was $368 million for the quarter and $1.0 billion for the year.
n/m=notmeaningful.
% Change % Change(DollarsinThousands,ExceptperUnitData)(Unaudited) 4Q'15 4Q'16 vs. 4Q'15 FY'15 FY'16 vs. FY'15RevenuesManagementandAdvisoryFees,Net 648,009$ 630,092$ (3)% 2,542,505$ 2,442,975$ (4)%PerformanceFeesRealizedCarriedInterest 625,024 416,197 (33)% 3,205,290 1,474,830 (54)%RealizedIncentiveFees 82,463 82,382 (0)% 193,238 170,537 (12)%UnrealizedCarriedInterest (471,164) 239,224 n/m (1,595,174) 481,304 n/mUnrealizedIncentiveFees (42,962) 3,760 n/m (6,688) 49,660 n/mTotalPerformanceFees 193,361 741,563 284% 1,796,666 2,176,331 21%
InvestmentIncome(Loss)Realized 109,466 106,350 (3)% 555,171 278,737 (50)%Unrealized (88,505) 9,967 n/m (350,529) 77,314 n/mTotalInvestmentIncome 20,961 116,317 455% 204,642 356,051 74%
InterestandDividendRevenue 24,828 28,544 15% 94,957 95,724 1%Other 10,260 52,853 415% 7,782 54,753 604%
Total Revenues 897,419 1,569,369 75% 4,646,552 5,125,834 10%ExpensesCompensationandBenefitsCompensation 299,958 304,347 1% 1,726,191 1,335,408 (23)%PerformanceFeeCompensationRealizedCarriedInterest 165,722 141,443 (15)% 793,801 455,954 (43)%RealizedIncentiveFees 36,819 33,286 (10)% 85,945 78,096 (9)%UnrealizedCarriedInterest (107,820) 137,591 n/m (312,696) 312,838 n/mUnrealizedIncentiveFees (18,940) 1,489 n/m (2,490) 21,134 n/mTotalCompensationandBenefits 375,739 618,156 65% 2,290,751 2,203,430 (4)%
General,AdministrativeandOther 139,607 141,954 2% 576,103 520,309 (10)%InterestExpense 38,878 41,142 6% 144,522 152,654 6%FundExpenses 2,654 23,232 775% 79,499 52,181 (34)%
Total Expenses 556,878 824,484 48% 3,090,875 2,928,574 (5)%Other IncomeReversalofTaxReceivableAgreementLiability 82,707 - (100)% 82,707 - (100)%NetGainsfromFundInvestmentActivities 17,661 73,510 316% 176,364 184,750 5%
Income Before Provision for Taxes 440,909$ 818,395$ 86% 1,814,748$ 2,382,010$ 31%ProvisionforTaxes 46,230 48,087 4% 190,398 132,362 (30)%
Net Income 394,679$ 770,308$ 95% 1,624,350$ 2,249,648$ 38%Net Income Attributable to Redeemable Non-Controlling Interests in Consolidated Entities 2,358 1,663 (29)% 11,145 3,977 (64)%Net Income Attributable to Non-Controlling Interests in Consolidated Entities 40,717 58,684 44% 219,900 246,152 12%Net Income Attributable to Non-Controlling Interests in Blackstone Holdings 150,734 342,010 127% 683,516 960,284 40%Net Income Attributable to The Blackstone Group L.P. ("BX") 200,870$ 367,951$ 83% 709,789$ 1,039,235$ 46%
Net Income per Common Unit, Basic 0.31$ 0.56$ 81% 1.12$ 1.60$ 43%Net Income per Common Unit, Diluted 0.23$ 0.55$ 139% 1.04$ 1.56$ 50%
Blackstone 2
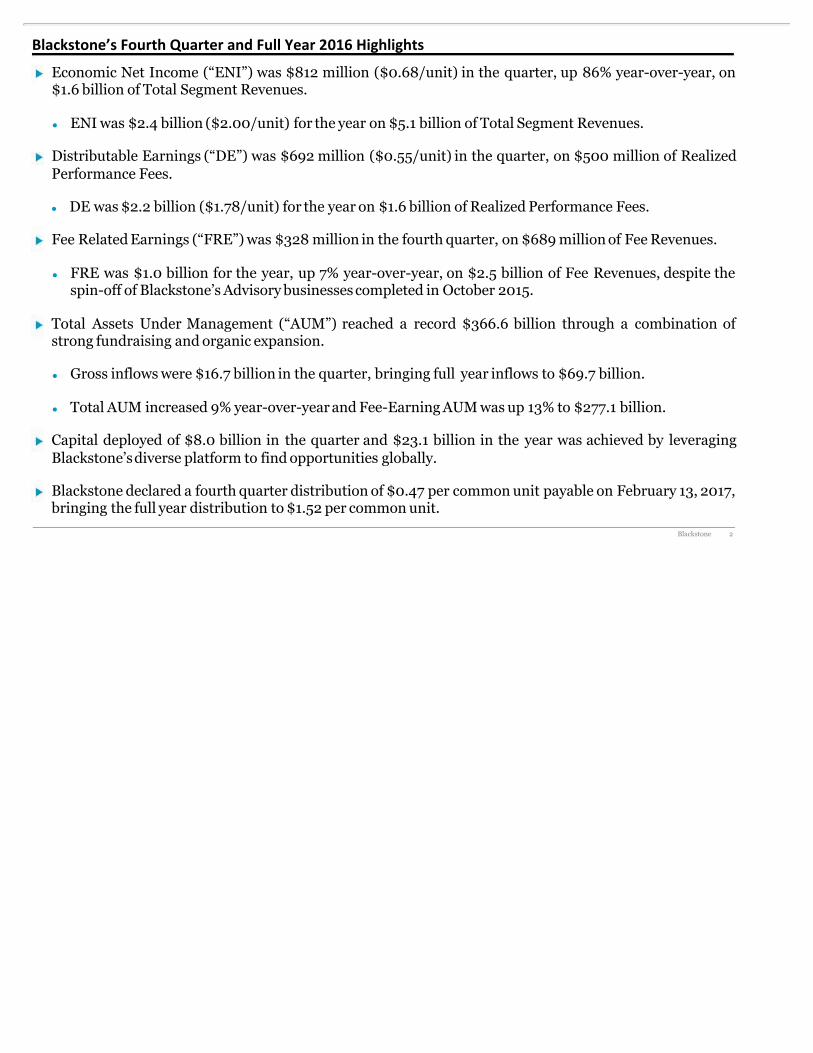
Blackstone’s Fourth Quarter and Full Year 2016 Highlights
Economic Net Income (“ENI”) was $812 million ($0.68/unit) in the quarter, up 86% year-over-year, on$1.6 billion of Total Segment Revenues.
• ENI was $2.4 billion ($2.00/unit) for the year on $5.1 billion of Total Segment Revenues.
Distributable Earnings (“DE”) was $692 million ($0.55/unit) in the quarter, on $500 million of RealizedPerformance Fees.
• DE was $2.2 billion ($1.78/unit) for the year on $1.6 billion of Realized Performance Fees.
Fee Related Earnings (“FRE”) was $328 million in the fourth quarter, on $689 million of Fee Revenues.
• FRE was $1.0 billion for the year, up 7% year-over-year, on $2.5 billion of Fee Revenues, despite thespin-off of Blackstone’s Advisory businesses completed in October 2015.
Total Assets Under Management (“AUM”) reached a record $366.6 billion through a combination ofstrong fundraising and organic expansion.
• Gross inflows were $16.7 billion in the quarter, bringing full year inflows to $69.7 billion.
• Total AUM increased 9% year-over-year and Fee-Earning AUM was up 13% to $277.1 billion.
Capital deployed of $8.0 billion in the quarter and $23.1 billion in the year was achieved by leveragingBlackstone’sdiverse platform to find opportunities globally.
Blackstone declared a fourth quarter distribution of $0.47 per common unit payable on February 13, 2017,bringing the full year distribution to $1.52 per common unit.
Blackstone 3
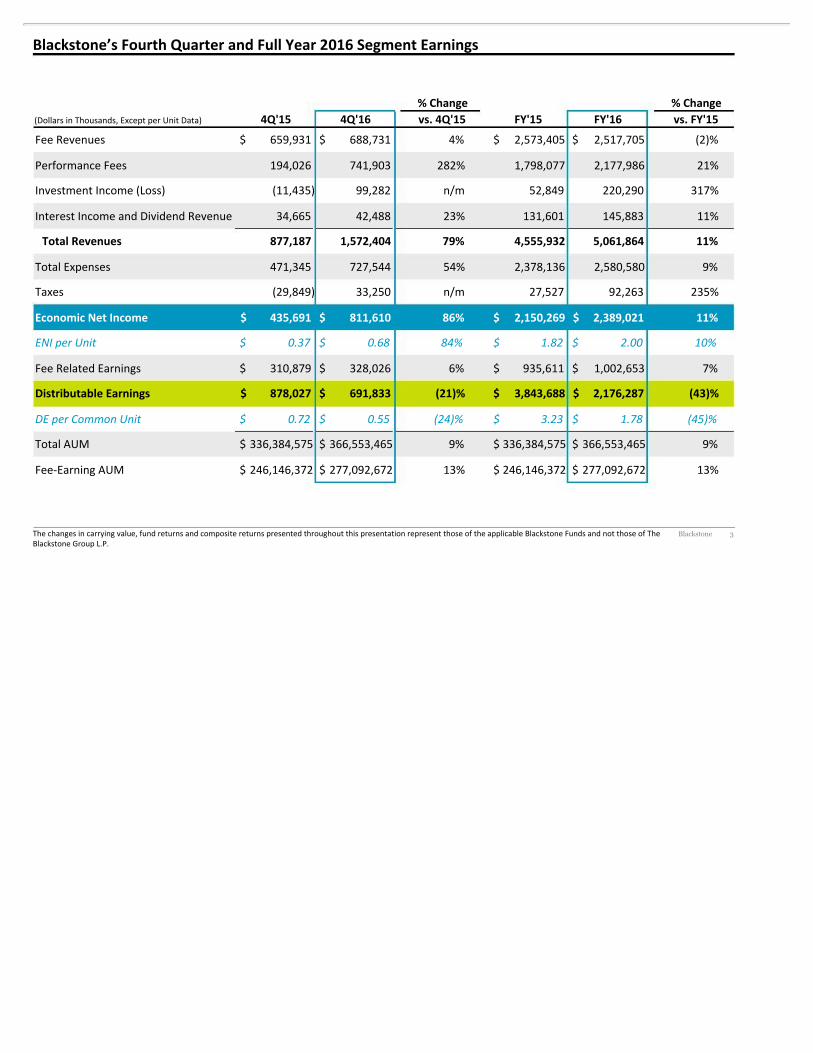
Blackstone’s Fourth Quarter and Full Year 2016 Segment Earnings
Thechangesincarryingvalue,fundreturnsandcompositereturnspresentedthroughoutthispresentationrepresentthoseoftheapplicableBlackstoneFundsandnotthoseofTheBlackstoneGroupL.P.
% Change % Change(DollarsinThousands,ExceptperUnitData) 4Q'15 4Q'16 vs. 4Q'15 FY'15 FY'16 vs. FY'15
FeeRevenues 659,931$ 688,731$ 4% 2,573,405$ 2,517,705$ (2)%
PerformanceFees 194,026 741,903 282% 1,798,077 2,177,986 21%
InvestmentIncome(Loss) (11,435) 99,282 n/m 52,849 220,290 317%
InterestIncomeandDividendRevenue 34,665 42,488 23% 131,601 145,883 11%
Total Revenues 877,187 1,572,404 79% 4,555,932 5,061,864 11%
TotalExpenses 471,345 727,544 54% 2,378,136 2,580,580 9%
Taxes (29,849) 33,250 n/m 27,527 92,263 235%
Economic Net Income 435,691$ 811,610$ 86% 2,150,269$ 2,389,021$ 11%
ENI per Unit 0.37$ 0.68$ 84% 1.82$ 2.00$ 10%
FeeRelatedEarnings 310,879$ 328,026$ 6% 935,611$ 1,002,653$ 7%
Distributable Earnings 878,027$ 691,833$ (21)% 3,843,688$ 2,176,287$ (43)%
DE per Common Unit 0.72$ 0.55$ (24)% 3.23$ 1.78$ (45)%
TotalAUM 336,384,575$ 366,553,465$ 9% 336,384,575$ 366,553,465$ 9%
Fee-EarningAUM 246,146,372$ 277,092,672$ 13% 246,146,372$ 277,092,672$ 13%

Blackstone 4
Private Equity
10.7%FY’16IncreaseinCorporatePrivateEquityCarryingValue
$14.2 billionFY’16Realizations
$100.2 billionTotalAUMup6%YoY
Corporate Private Equity carrying value increased 4.5% in the quarter, driven by appreciation in the privateinvestment portfolio, and increased 10.7% for the year.
Realizations of $3.8 billion in the quarter were driven mainly by public and strategic sales across the segment,bringing full year realizations to $14.2 billion.
Invested or committed $4.7 billion during the quarter and $11.1 billion for the year across the segment.
Inflows of $3.2 billion in the quarter included closings for Tactical Opportunities, the core private equity fund andStrategic Partners bringing full year inflows to $16.9 billion.
Total AUM increased 6% year-over-year to $100.2 billion, driven by fundraising across all strategies within thesegment, which more than offset significant realization activity.
Fee-Earning AUM increased 34% year-over-year due to the commencement of investment periods of variousflagship funds across the segment.
% Change % Change
(DollarsinThousands) 4Q'15 4Q'16 vs. 4Q'15 FY'15 FY'16 vs. FY'15
FeeRevenues 157,183$ 176,662$ 12% 518,553$ 581,655$ 12%
PerformanceFees 161,061 252,794 57% 757,032 670,049 (11)%
InvestmentIncome 32,823 23,938 (27)% 73,311 68,534 (7)%
InterestIncomeandDividendRevenue 9,812 11,746 20% 33,218 40,271 21%
Total Revenues 360,879 465,140 29% 1,382,114 1,360,509 (2)%
Compensation 70,651 73,154 4% 280,248 310,457 11%
PerformanceFeeCompensation 73,365 116,659 59% 246,750 274,819 11%
OtherOperatingExpenses 53,900 52,465 (3)% 199,158 196,433 (1)%
Total Expenses 197,916 242,278 22% 726,156 781,709 8%
Economic Income 162,963$ 222,862$ 37% 655,958$ 578,800$ (12)%
TotalAUM 94,280,074$ 100,192,950$ 6% 94,280,074$ 100,192,950$ 6%
Fee-EarningAUM 51,451,196$ 69,113,409$ 34% 51,451,196$ 69,113,409$ 34%
Blackstone 5
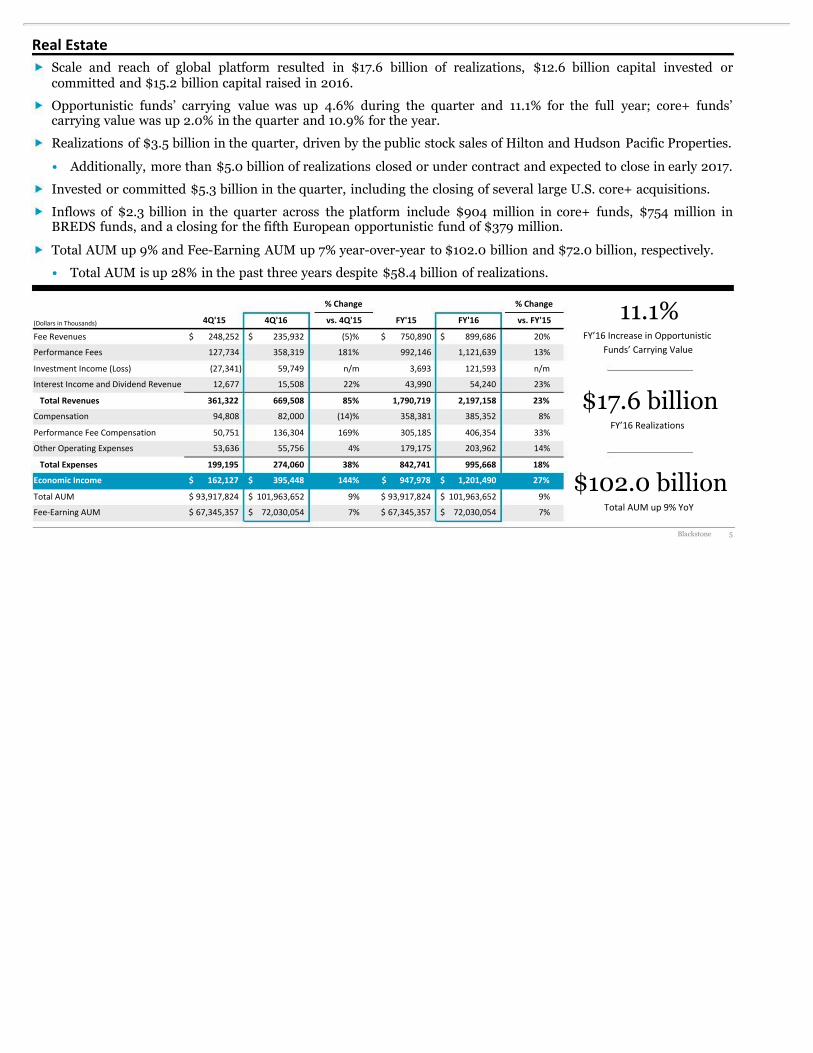
Real Estate
11.1%FY’16IncreaseinOpportunistic
Funds’CarryingValue
$102.0 billionTotalAUMup9%YoY
$17.6 billionFY’16Realizations
Scale and reach of global platform resulted in $17.6 billion of realizations, $12.6 billion capital invested orcommitted and $15.2 billion capital raised in 2016.
Opportunistic funds’ carrying value was up 4.6% during the quarter and 11.1% for the full year; core+ funds’carrying value was up 2.0% in the quarter and 10.9% for the year.
Realizations of $3.5 billion in the quarter, driven by the public stock sales of Hilton and Hudson Pacific Properties.
• Additionally, more than $5.0 billion of realizations closed or under contract and expected to close in early 2017.
Invested or committed $5.3 billion in the quarter, including the closing of several large U.S. core+ acquisitions.
Inflows of $2.3 billion in the quarter across the platform include $904 million in core+ funds, $754 million inBREDS funds, and a closing for the fifth European opportunistic fund of $379 million.
Total AUM up 9% and Fee-Earning AUM up 7% year-over-year to $102.0 billion and $72.0 billion, respectively.
• Total AUM is up 28% in the past three years despite $58.4 billion of realizations.
% Change % Change
(DollarsinThousands) 4Q'15 4Q'16 vs. 4Q'15 FY'15 FY'16 vs. FY'15
FeeRevenues 248,252$ 235,932$ (5)% 750,890$ 899,686$ 20%
PerformanceFees 127,734 358,319 181% 992,146 1,121,639 13%
InvestmentIncome(Loss) (27,341) 59,749 n/m 3,693 121,593 n/m
InterestIncomeandDividendRevenue 12,677 15,508 22% 43,990 54,240 23%
Total Revenues 361,322 669,508 85% 1,790,719 2,197,158 23%
Compensation 94,808 82,000 (14)% 358,381 385,352 8%
PerformanceFeeCompensation 50,751 136,304 169% 305,185 406,354 33%
OtherOperatingExpenses 53,636 55,756 4% 179,175 203,962 14%
Total Expenses 199,195 274,060 38% 842,741 995,668 18%
Economic Income 162,127$ 395,448$ 144% 947,978$ 1,201,490$ 27%
TotalAUM 93,917,824$ 101,963,652$ 9% 93,917,824$ 101,963,652$ 9%
Fee-EarningAUM 67,345,357$ 72,030,054$ 7% 67,345,357$ 72,030,054$ 7%
Blackstone 6
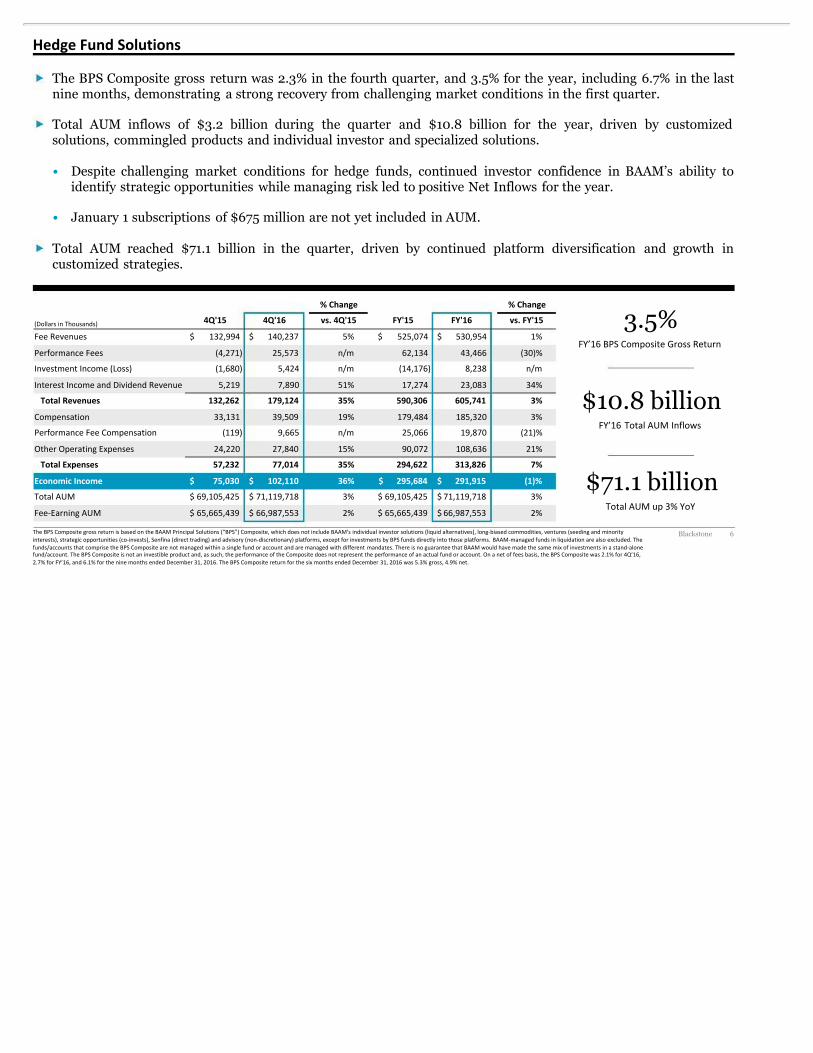
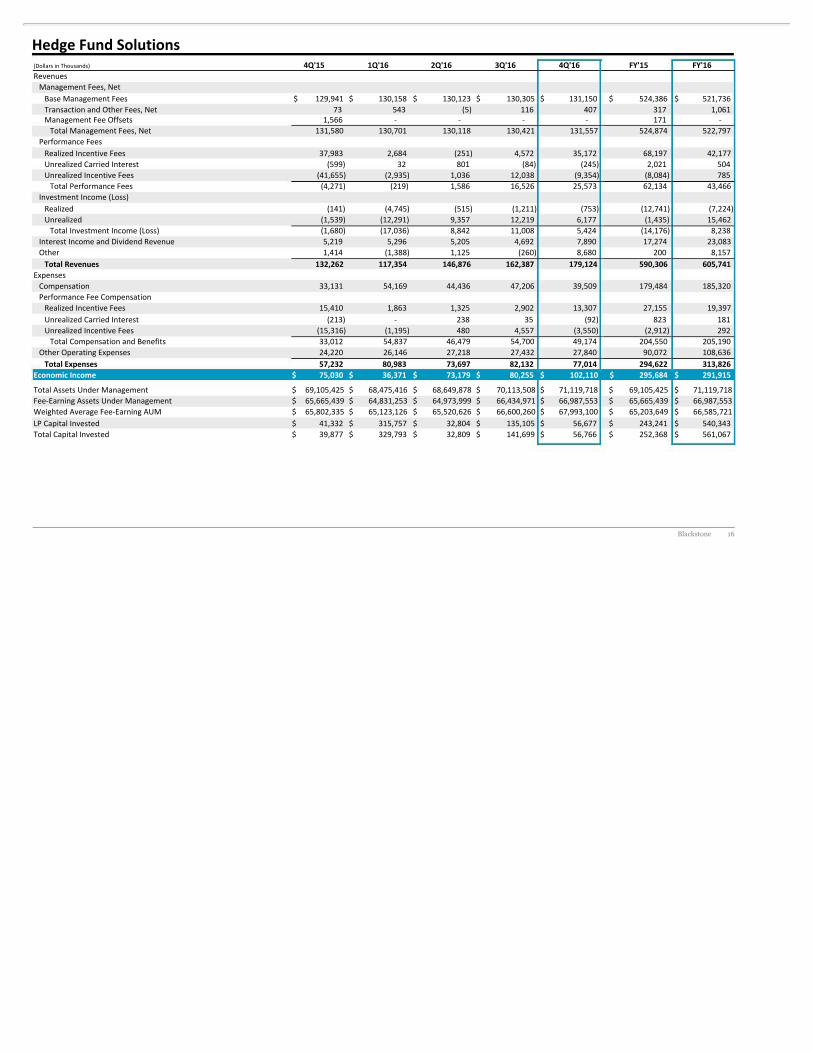
Hedge Fund Solutions
3.5%FY’16BPSCompositeGrossReturn
TheBPSCompositegrossreturnisbasedontheBAAMPrincipalSolutions(“BPS”)Composite,whichdoesnotincludeBAAM'sindividualinvestorsolutions(liquidalternatives),long-biasedcommodities,ventures(seedingandminorityinterests),strategicopportunities(co-invests),Senfina (directtrading)andadvisory(non-discretionary)platforms,exceptforinvestmentsbyBPSfundsdirectlyintothoseplatforms. BAAM-managedfundsinliquidationarealsoexcluded.Thefunds/accountsthatcomprisetheBPSCompositearenotmanagedwithinasinglefundoraccountandaremanagedwithdifferent mandates.ThereisnoguaranteethatBAAMwouldhavemadethesamemixofinvestmentsinastand-alonefund/account.TheBPSCompositeisnotaninvestibleproductand,assuch,theperformanceoftheCompositedoesnotrepresenttheperformanceofanactualfundoraccount.Onanetoffeesbasis,theBPSCompositewas2.1%for4Q’16,2.7%forFY’16,and6.1%fortheninemonthsendedDecember31,2016.TheBPSCompositereturnforthesixmonthsendedDecember 31,2016was5.3%gross,4.9%net.
The BPS Composite gross return was 2.3% in the fourth quarter, and 3.5% for the year, including 6.7% in the lastnine months, demonstrating a strong recovery from challenging market conditions in the first quarter.
Total AUM inflows of $3.2 billion during the quarter and $10.8 billion for the year, driven by customizedsolutions, commingled products and individual investor and specialized solutions.
• Despite challenging market conditions for hedge funds, continued investor confidence in BAAM’s ability toidentify strategic opportunities while managing risk led to positive Net Inflows for the year.
• January 1 subscriptions of $675 million are not yet included in AUM.
Total AUM reached $71.1 billion in the quarter, driven by continued platform diversification and growth incustomized strategies.
$10.8 billionFY’16 TotalAUM Inflows
$71.1 billionTotalAUMup3%YoY
% Change % Change
(DollarsinThousands) 4Q'15 4Q'16 vs. 4Q'15 FY'15 FY'16 vs. FY'15
FeeRevenues 132,994$ 140,237$ 5% 525,074$ 530,954$ 1%
PerformanceFees (4,271) 25,573 n/m 62,134 43,466 (30)%
InvestmentIncome(Loss) (1,680) 5,424 n/m (14,176) 8,238 n/m
InterestIncomeandDividendRevenue 5,219 7,890 51% 17,274 23,083 34%
Total Revenues 132,262 179,124 35% 590,306 605,741 3%
Compensation 33,131 39,509 19% 179,484 185,320 3%
PerformanceFeeCompensation (119) 9,665 n/m 25,066 19,870 (21)%
OtherOperatingExpenses 24,220 27,840 15% 90,072 108,636 21%
Total Expenses 57,232 77,014 35% 294,622 313,826 7%
Economic Income 75,030$ 102,110$ 36% 295,684$ 291,915$ (1)%
TotalAUM 69,105,425$ 71,119,718$ 3% 69,105,425$ 71,119,718$ 3%
Fee-EarningAUM 65,665,439$ 66,987,553$ 2% 65,665,439$ 66,987,553$ 2%
Blackstone 7
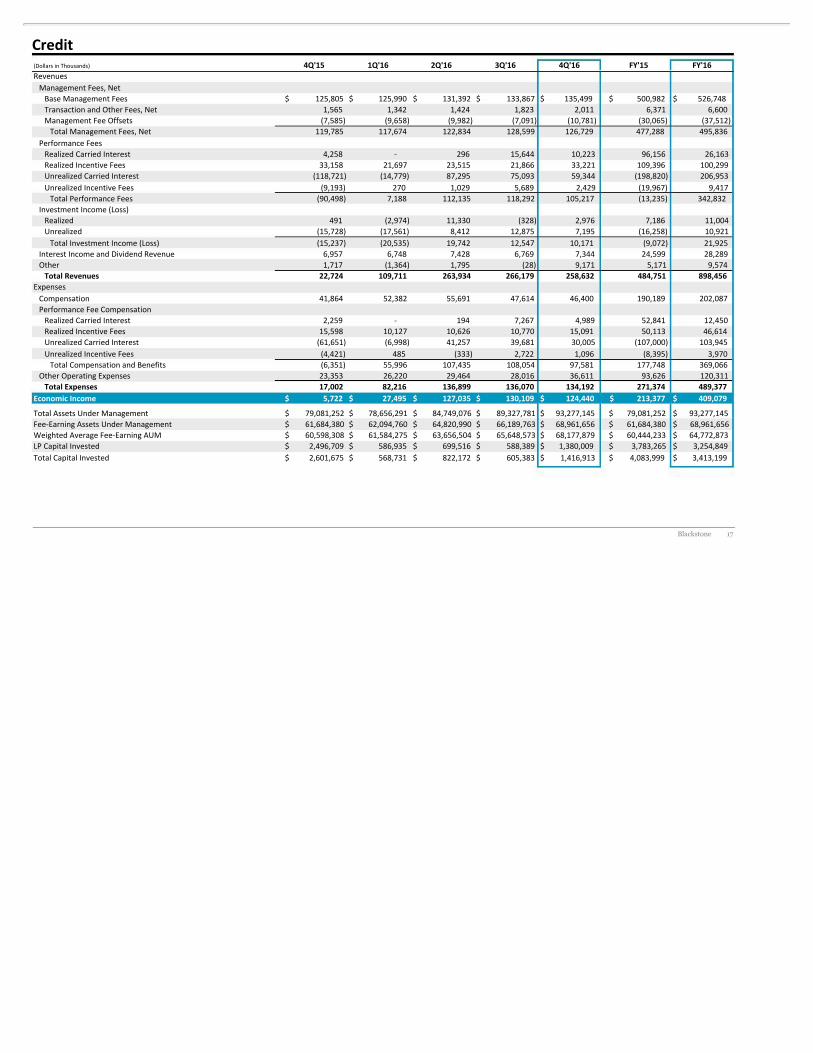
Credit
PerformingCreditStrategiesincludemezzaninelendingfunds,BusinessDevelopmentCompanies(“BDCs”)andotherperformingcreditstrategyfunds.DistressedStrategiesincludehedgefundstrategies,rescuelendingfundsanddistressedenergystrategies.Thecompositegrossreturnsrepresentaweighted-averagecompositeofthefee-earningfundsexceeding$100millionoffairvalueateachrespectivequarterendforeachstrategy.CompositegrossreturnsexcludetheBlackstoneFundsthatwerecontributedtoGSO aspartofBlackstone’sacquisitionofGSO inMarch2008.PerformingCreditStrategies’netreturnswere3.4%and16.7%for4Q’16 andFY'16.DistressedStrategies’netreturnswere5.4%and13.3%for4Q’16andFY'16.ThebreakdownofTotalAUMfor4Q’16 isasfollows:DistressedStrategies$22.7billion(33%IncentiveFee,67%CarriedInterest),PerformingCreditStrategies$36.8billion(49%IncentiveFee,51%CarriedInterest),andLongOnly$33.8billion.ThebreakdownofFee-EarningAUMfor4Q’16 isasfollows:DistressedStrategies$13.1billion(51%IncentiveFee,49%CarriedInterest),PerformingCreditStrategies$22.7billion(80%IncentiveFee,20%CarriedInterest),andLongOnly$33.2billion.
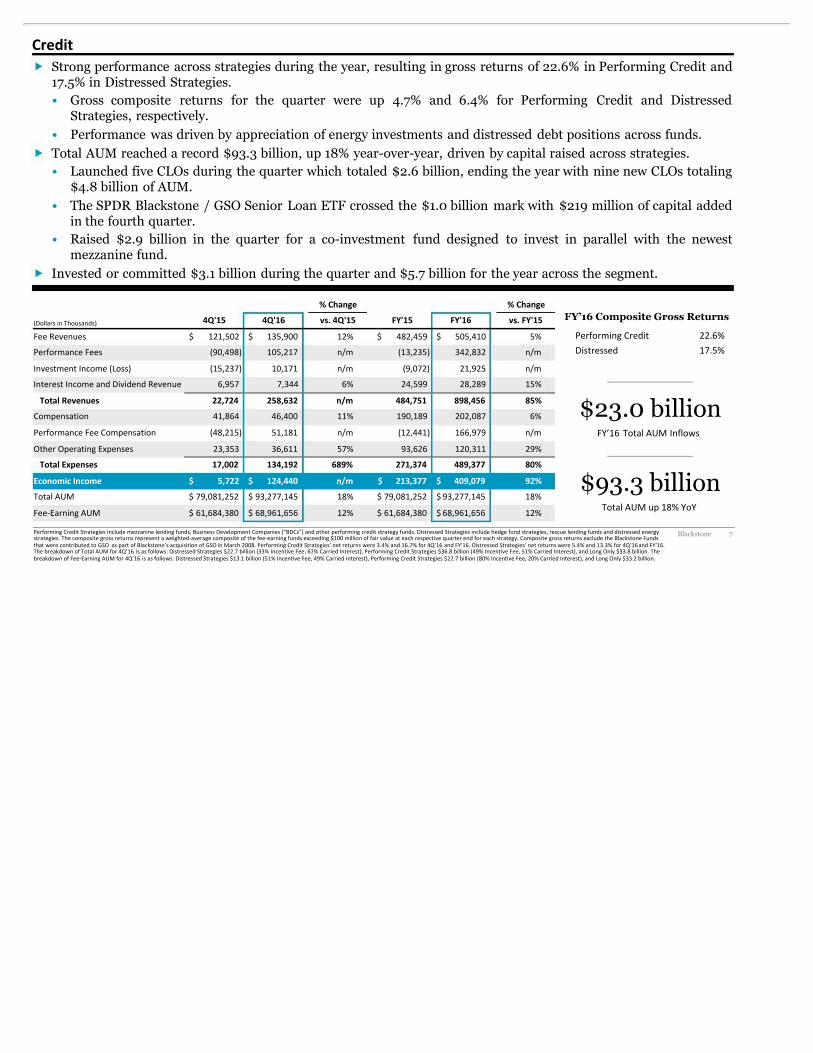
$23.0 billionFY’16 TotalAUM Inflows
$93.3 billionTotalAUMup18%YoY
FY’16 Composite Gross Returns
PerformingCredit 22.6%Distressed 17.5%
Strong performance across strategies during the year, resulting in gross returns of 22.6% in Performing Credit and17.5% in Distressed Strategies.• Gross composite returns for the quarter were up 4.7% and 6.4% for Performing Credit and Distressed
Strategies, respectively.• Performance was driven by appreciation of energy investments and distressed debt positions across funds.Total AUM reached a record $93.3 billion, up 18% year-over-year, driven by capital raised across strategies.• Launched five CLOs during the quarter which totaled $2.6 billion, ending the year with nine new CLOs totaling
$4.8 billion of AUM.• The SPDR Blackstone / GSO Senior Loan ETF crossed the $1.0 billion mark with $219 million of capital added
in the fourth quarter.• Raised $2.9 billion in the quarter for a co-investment fund designed to invest in parallel with the newest
mezzanine fund.Invested or committed $3.1 billion during the quarter and $5.7 billion for the year across the segment.
% Change % Change
(DollarsinThousands) 4Q'15 4Q'16 vs. 4Q'15 FY'15 FY'16 vs. FY'15
FeeRevenues 121,502$ 135,900$ 12% 482,459$ 505,410$ 5%
PerformanceFees (90,498) 105,217 n/m (13,235) 342,832 n/m
InvestmentIncome(Loss) (15,237) 10,171 n/m (9,072) 21,925 n/m
InterestIncomeandDividendRevenue 6,957 7,344 6% 24,599 28,289 15%
Total Revenues 22,724 258,632 n/m 484,751 898,456 85%
Compensation 41,864 46,400 11% 190,189 202,087 6%
PerformanceFeeCompensation (48,215) 51,181 n/m (12,441) 166,979 n/m
OtherOperatingExpenses 23,353 36,611 57% 93,626 120,311 29%
Total Expenses 17,002 134,192 689% 271,374 489,377 80%
Economic Income 5,722$ 124,440$ n/m 213,377$ 409,079$ 92%
TotalAUM 79,081,252$ 93,277,145$ 18% 79,081,252$ 93,277,145$ 18%
Fee-EarningAUM 61,684,380$ 68,961,656$ 12% 61,684,380$ 68,961,656$ 12%
Blackstone 8
$72.9 $79.1 $93.3
$63.6 $69.1$71.1
$80.9$93.9
$102.0
$73.1$94.3
$100.2
4Q'14 4Q'15 4Q'16
Fee-Earning AUM by Segment(DollarsinBillions)
Total AUM by Segment(DollarsinBillions)
$290.4
PrivateEquity RealEstate HedgeFundSolutions Credit
Assets Under Management
$58.8 $61.7 $69.0
$61.4 $65.7 $67.0
$52.6$67.3 $72.0
$43.9$51.5
$69.1
4Q'14 4Q'15 4Q'16
$336.4$366.6
$216.7$246.1
$277.1
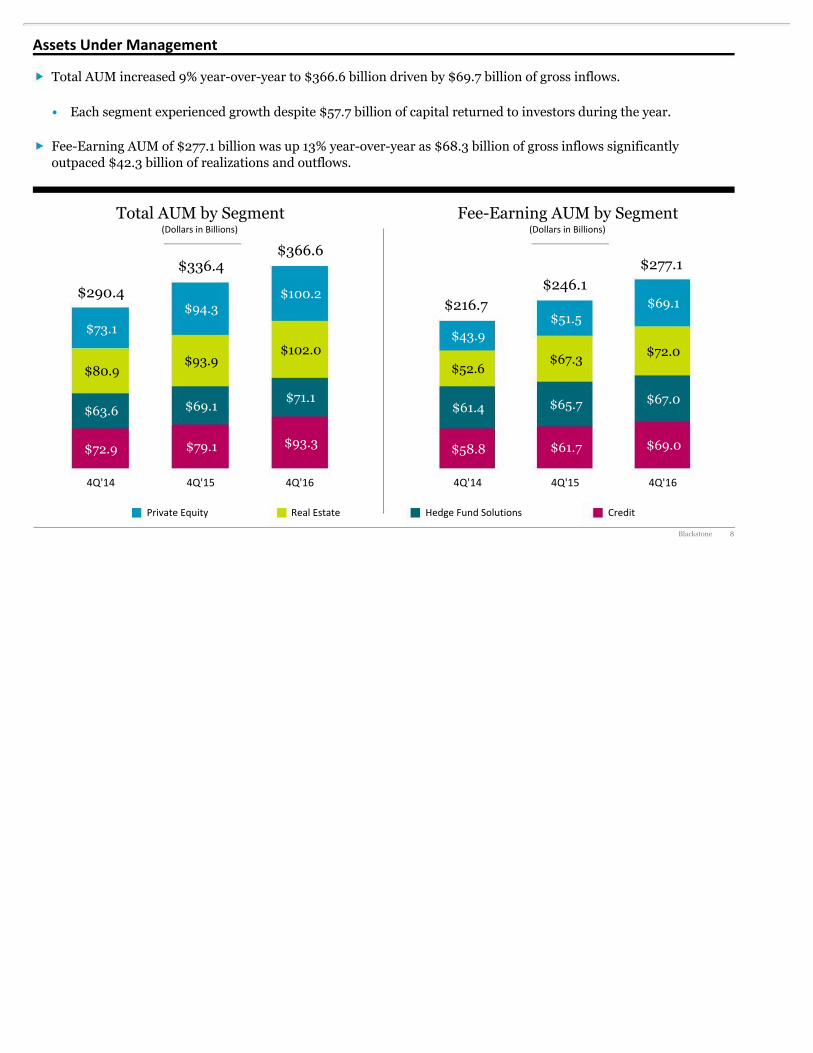
Total AUM increased 9% year-over-year to $366.6 billion driven by $69.7 billion of gross inflows.
• Each segment experienced growth despite $57.7 billion of capital returned to investors during the year.
Fee-Earning AUM of $277.1 billion was up 13% year-over-year as $68.3 billion of gross inflows significantlyoutpaced $42.3 billion of realizations and outflows.
Blackstone 9
$16.6
$2.0
$11.7
$13.5
$149.6 $143.8 $149.8
$12.9 $25.8 $25.3$42.5
$80.0$97.2
4Q'14 4Q'15 4Q'16
$43.6
$32.1
$4.3
$21.3
Additional Capital Detail
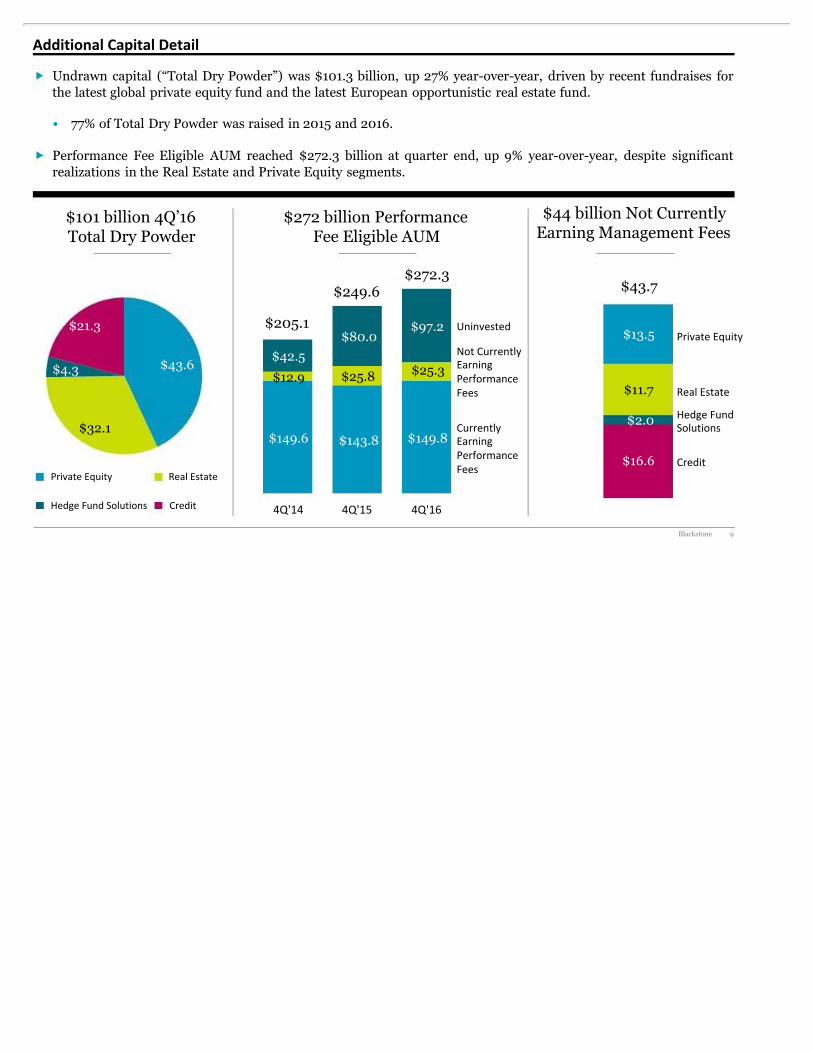
Undrawn capital (“Total Dry Powder”) was $101.3 billion, up 27% year-over-year, driven by recent fundraises forthe latest global private equity fund and the latest European opportunistic real estate fund.
• 77% of Total Dry Powder was raised in 2015 and 2016.
Performance Fee Eligible AUM reached $272.3 billion at quarter end, up 9% year-over-year, despite significantrealizations in the Real Estate and Private Equity segments.
Uninvested
NotCurrentlyEarningPerformanceFees
CurrentlyEarningPerformanceFees
PrivateEquity RealEstate
HedgeFundSolutions Credit
$101 billion 4Q’16Total Dry Powder
$272 billion PerformanceFee Eligible AUM
$44 billion Not CurrentlyEarning Management Fees
$249.6$272.3
$205.1
Credit
HedgeFundSolutions
RealEstate
PrivateEquity
$43.7
Blackstone 10
4Q'14 4Q'15 4Q'16
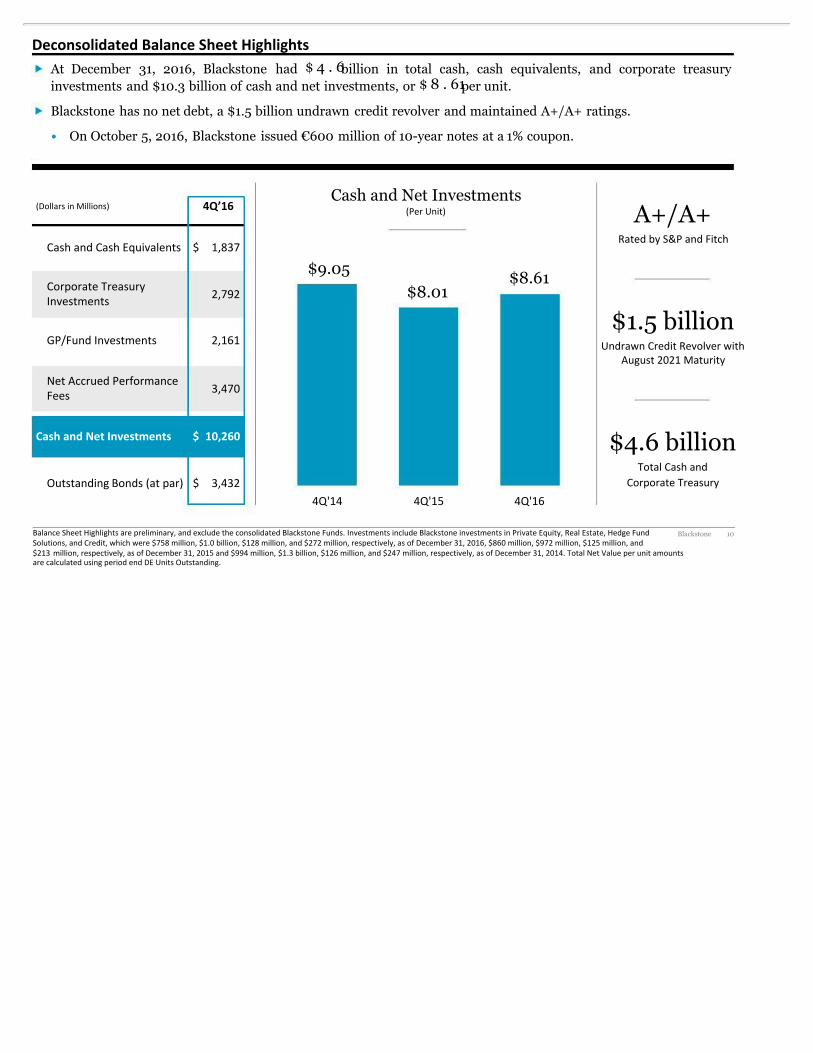
At December 31, 2016, Blackstone had $ 4 . 6billion in total cash, cash equivalents, and corporate treasuryinvestments and $10.3 billion of cash and net investments, or $ 8 . 61per unit.
Blackstone has no net debt, a $1.5 billion undrawn credit revolver and maintained A+/A+ ratings.
• On October 5, 2016, Blackstone issued €600 million of 10-year notes at a 1% coupon.
Deconsolidated Balance Sheet Highlights
BalanceSheetHighlightsarepreliminary,andexcludetheconsolidatedBlackstoneFunds.InvestmentsincludeBlackstoneinvestmentsinPrivateEquity,RealEstate,HedgeFundSolutions,andCredit,whichwere$758million,$1.0billion,$128million,and$272million,respectively,asofDecember31,2016,$860million,$972million,$125million,and$213 million,respectively,asofDecember31,2015and$994million,$1.3billion,$126million,and$247million,respectively,asofDecember31,2014.TotalNetValueperunitamountsarecalculatedusingperiodendDEUnitsOutstanding.
A+/A+RatedbyS&PandFitch
$1.5 billionUndrawnCreditRevolverwith
August2021Maturity
$4.6 billionTotalCashand
CorporateTreasury
$8.61$8.01
$9.05
Cash and Net Investments(PerUnit)(DollarsinMillions) 4Q’16
CashandCashEquivalents $ 1,837
CorporateTreasuryInvestments 2,792
GP/FundInvestments 2,161
NetAccruedPerformanceFees 3,470
Cash and Net Investments $ 10,260
Outstanding Bonds(atpar) $ 3,432
Blackstone 11
$1,060 $1,159$888
$488
$1,218
$134
2014 2015 2016
$2,612$2,186 $1,986
$1,657
$931 $1,268
4Q'14 4Q'15 4Q'16
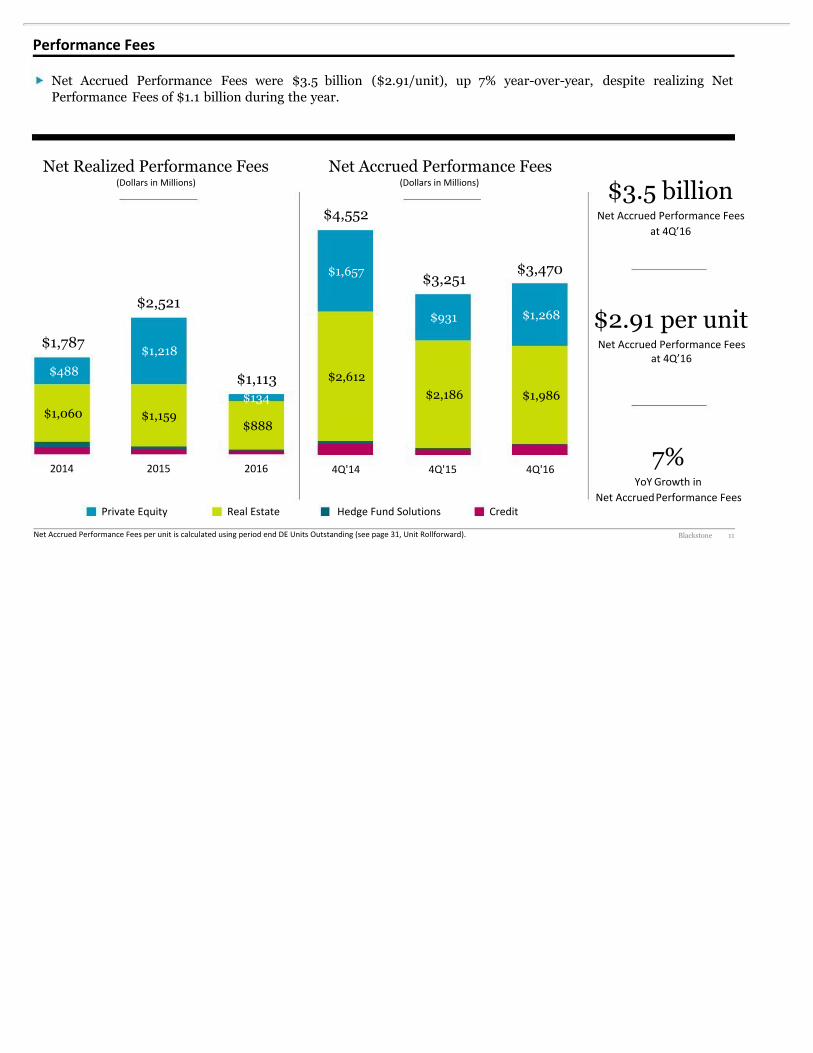
Performance Fees
Net Realized Performance Fees(DollarsinMillions)
$2,521
$1,113
$1,787
Net Accrued Performance Fees(DollarsinMillions)
$3,251$3,470
$4,552
PrivateEquity RealEstate CreditHedgeFundSolutions
$3.5 billionNetAccruedPerformanceFees
at4Q’16
7%YoYGrowthin
NetAccruedPerformanceFees
$2.91 per unitNetAccruedPerformanceFees
at4Q’16
NetAccruedPerformanceFeesperunitiscalculatedusingperiodendDEUnitsOutstanding(seepage31,UnitRollforward).
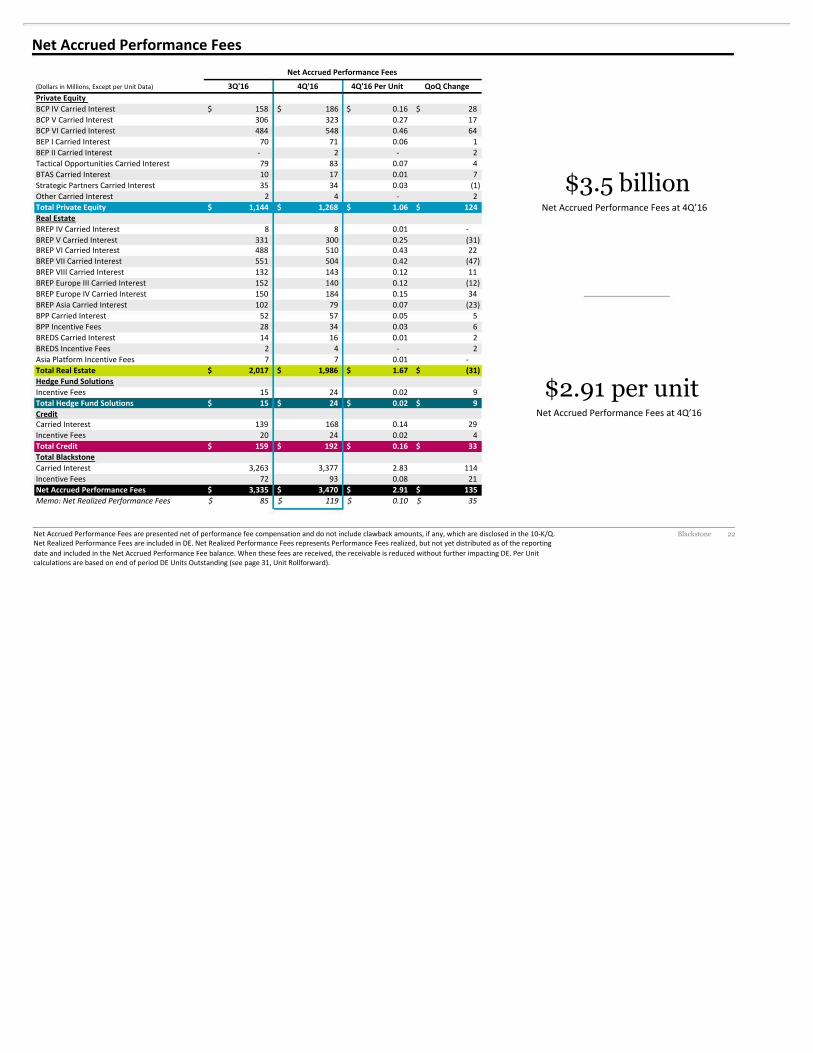
Net Accrued Performance Fees were $3.5 billion ($2.91/unit), up 7% year-over-year, despite realizing NetPerformance Fees of $1.1 billion during the year.

Appendix
Blackstone 13
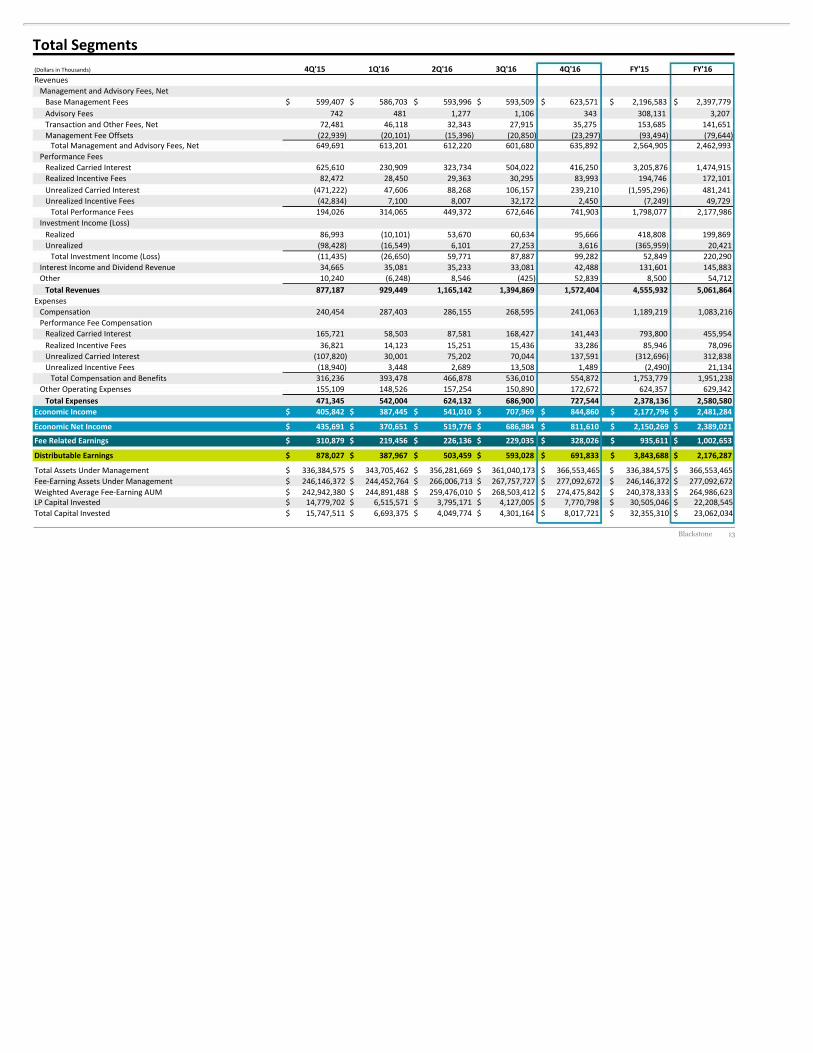
Total Segments(DollarsinThousands) 4Q'15 1Q'16 2Q'16 3Q'16 4Q'16 FY'15 FY'16RevenuesManagementandAdvisoryFees,NetBaseManagementFees 599,407$ 586,703$ 593,996$ 593,509$ 623,571$ 2,196,583$ 2,397,779$AdvisoryFees 742 481 1,277 1,106 343 308,131 3,207TransactionandOtherFees,Net 72,481 46,118 32,343 27,915 35,275 153,685 141,651ManagementFeeOffsets (22,939) (20,101) (15,396) (20,850) (23,297) (93,494) (79,644)TotalManagementandAdvisoryFees,Net 649,691 613,201 612,220 601,680 635,892 2,564,905 2,462,993
PerformanceFeesRealizedCarriedInterest 625,610 230,909 323,734 504,022 416,250 3,205,876 1,474,915RealizedIncentiveFees 82,472 28,450 29,363 30,295 83,993 194,746 172,101UnrealizedCarriedInterest (471,222) 47,606 88,268 106,157 239,210 (1,595,296) 481,241UnrealizedIncentiveFees (42,834) 7,100 8,007 32,172 2,450 (7,249) 49,729TotalPerformanceFees 194,026 314,065 449,372 672,646 741,903 1,798,077 2,177,986
InvestmentIncome(Loss)Realized 86,993 (10,101) 53,670 60,634 95,666 418,808 199,869Unrealized (98,428) (16,549) 6,101 27,253 3,616 (365,959) 20,421TotalInvestmentIncome(Loss) (11,435) (26,650) 59,771 87,887 99,282 52,849 220,290
InterestIncomeandDividendRevenue 34,665 35,081 35,233 33,081 42,488 131,601 145,883Other 10,240 (6,248) 8,546 (425) 52,839 8,500 54,712
Total Revenues 877,187 929,449 1,165,142 1,394,869 1,572,404 4,555,932 5,061,864ExpensesCompensation 240,454 287,403 286,155 268,595 241,063 1,189,219 1,083,216PerformanceFeeCompensationRealizedCarriedInterest 165,721 58,503 87,581 168,427 141,443 793,800 455,954RealizedIncentiveFees 36,821 14,123 15,251 15,436 33,286 85,946 78,096UnrealizedCarriedInterest (107,820) 30,001 75,202 70,044 137,591 (312,696) 312,838UnrealizedIncentiveFees (18,940) 3,448 2,689 13,508 1,489 (2,490) 21,134TotalCompensationandBenefits 316,236 393,478 466,878 536,010 554,872 1,753,779 1,951,238
OtherOperatingExpenses 155,109 148,526 157,254 150,890 172,672 624,357 629,342Total Expenses 471,345 542,004 624,132 686,900 727,544 2,378,136 2,580,580
Economic Income 405,842$ 387,445$ 541,010$ 707,969$ 844,860$ 2,177,796$ 2,481,284$
Economic Net Income 435,691$ 370,651$ 519,776$ 686,984$ 811,610$ 2,150,269$ 2,389,021$
Fee Related Earnings 310,879$ 219,456$ 226,136$ 229,035$ 328,026$ 935,611$ 1,002,653$
Distributable Earnings 878,027$ 387,967$ 503,459$ 593,028$ 691,833$ 3,843,688$ 2,176,287$
TotalAssetsUnderManagement 336,384,575$ 343,705,462$ 356,281,669$ 361,040,173$ 366,553,465$ 336,384,575$ 366,553,465$Fee-EarningAssetsUnderManagement 246,146,372$ 244,452,764$ 266,006,713$ 267,757,727$ 277,092,672$ 246,146,372$ 277,092,672$WeightedAverageFee-EarningAUM 242,942,380$ 244,891,488$ 259,476,010$ 268,503,412$ 274,475,842$ 240,378,333$ 264,986,623$LPCapitalInvested 14,779,702$ 6,515,571$ 3,795,171$ 4,127,005$ 7,770,798$ 30,505,046$ 22,208,545$TotalCapitalInvested 15,747,511$ 6,693,375$ 4,049,774$ 4,301,164$ 8,017,721$ 32,355,310$ 23,062,034$
Blackstone 14
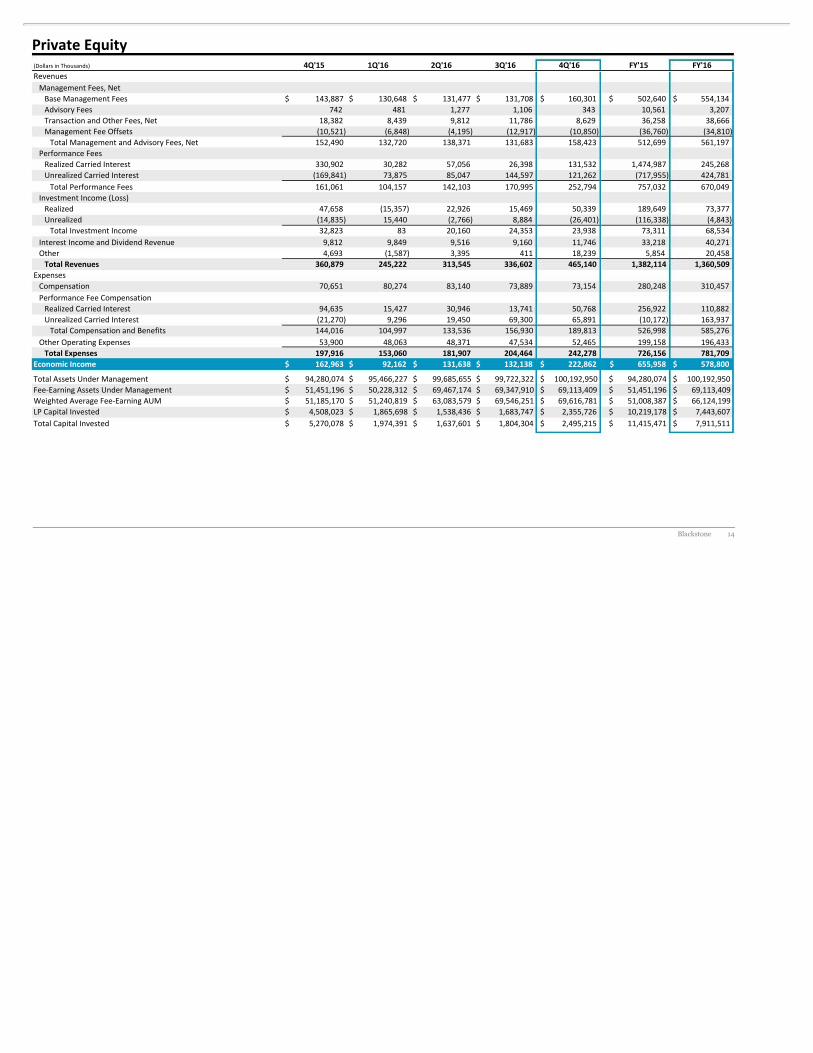
Private Equity(DollarsinThousands) 4Q'15 1Q'16 2Q'16 3Q'16 4Q'16 FY'15 FY'16RevenuesManagementFees,NetBaseManagementFees 143,887$ 130,648$ 131,477$ 131,708$ 160,301$ 502,640$ 554,134$AdvisoryFees 742 481 1,277 1,106 343 10,561 3,207TransactionandOtherFees,Net 18,382 8,439 9,812 11,786 8,629 36,258 38,666ManagementFeeOffsets (10,521) (6,848) (4,195) (12,917) (10,850) (36,760) (34,810)TotalManagementandAdvisoryFees,Net 152,490 132,720 138,371 131,683 158,423 512,699 561,197
PerformanceFeesRealizedCarriedInterest 330,902 30,282 57,056 26,398 131,532 1,474,987 245,268UnrealizedCarriedInterest (169,841) 73,875 85,047 144,597 121,262 (717,955) 424,781TotalPerformanceFees 161,061 104,157 142,103 170,995 252,794 757,032 670,049
InvestmentIncome(Loss)Realized 47,658 (15,357) 22,926 15,469 50,339 189,649 73,377Unrealized (14,835) 15,440 (2,766) 8,884 (26,401) (116,338) (4,843)TotalInvestmentIncome 32,823 83 20,160 24,353 23,938 73,311 68,534
InterestIncomeandDividendRevenue 9,812 9,849 9,516 9,160 11,746 33,218 40,271Other 4,693 (1,587) 3,395 411 18,239 5,854 20,458
Total Revenues 360,879 245,222 313,545 336,602 465,140 1,382,114 1,360,509ExpensesCompensation 70,651 80,274 83,140 73,889 73,154 280,248 310,457PerformanceFeeCompensationRealizedCarriedInterest 94,635 15,427 30,946 13,741 50,768 256,922 110,882UnrealizedCarriedInterest (21,270) 9,296 19,450 69,300 65,891 (10,172) 163,937TotalCompensationandBenefits 144,016 104,997 133,536 156,930 189,813 526,998 585,276
OtherOperatingExpenses 53,900 48,063 48,371 47,534 52,465 199,158 196,433Total Expenses 197,916 153,060 181,907 204,464 242,278 726,156 781,709
Economic Income 162,963$ 92,162$ 131,638$ 132,138$ 222,862$ 655,958$ 578,800$
TotalAssetsUnderManagement 94,280,074$ 95,466,227$ 99,685,655$ 99,722,322$ 100,192,950$ 94,280,074$ 100,192,950$Fee-EarningAssetsUnderManagement 51,451,196$ 50,228,312$ 69,467,174$ 69,347,910$ 69,113,409$ 51,451,196$ 69,113,409$WeightedAverageFee-EarningAUM 51,185,170$ 51,240,819$ 63,083,579$ 69,546,251$ 69,616,781$ 51,008,387$ 66,124,199$LPCapitalInvested 4,508,023$ 1,865,698$ 1,538,436$ 1,683,747$ 2,355,726$ 10,219,178$ 7,443,607$TotalCapitalInvested 5,270,078$ 1,974,391$ 1,637,601$ 1,804,304$ 2,495,215$ 11,415,471$ 7,911,511$
Blackstone 15
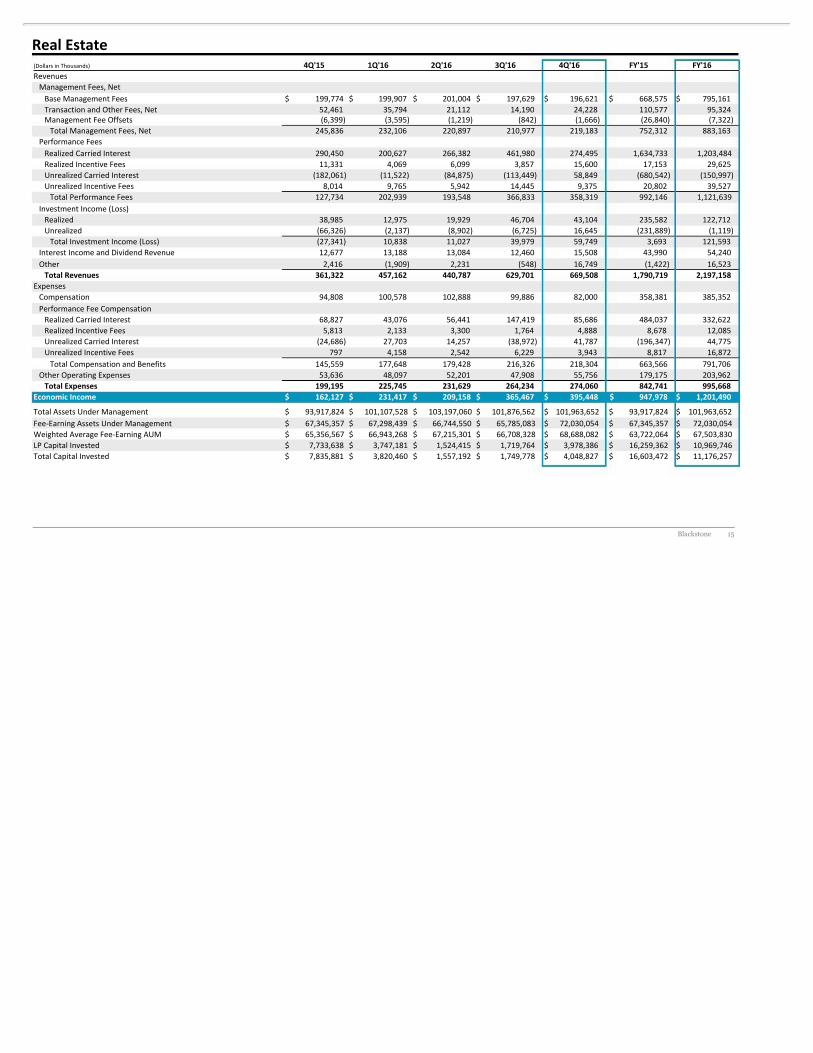
Real Estate(DollarsinThousands) 4Q'15 1Q'16 2Q'16 3Q'16 4Q'16 FY'15 FY'16RevenuesManagementFees,NetBaseManagementFees 199,774$ 199,907$ 201,004$ 197,629$ 196,621$ 668,575$ 795,161$TransactionandOtherFees,Net 52,461 35,794 21,112 14,190 24,228 110,577 95,324ManagementFeeOffsets (6,399) (3,595) (1,219) (842) (1,666) (26,840) (7,322)TotalManagementFees,Net 245,836 232,106 220,897 210,977 219,183 752,312 883,163
PerformanceFeesRealizedCarriedInterest 290,450 200,627 266,382 461,980 274,495 1,634,733 1,203,484RealizedIncentiveFees 11,331 4,069 6,099 3,857 15,600 17,153 29,625UnrealizedCarriedInterest (182,061) (11,522) (84,875) (113,449) 58,849 (680,542) (150,997)UnrealizedIncentiveFees 8,014 9,765 5,942 14,445 9,375 20,802 39,527TotalPerformanceFees 127,734 202,939 193,548 366,833 358,319 992,146 1,121,639
InvestmentIncome(Loss)Realized 38,985 12,975 19,929 46,704 43,104 235,582 122,712Unrealized (66,326) (2,137) (8,902) (6,725) 16,645 (231,889) (1,119)TotalInvestmentIncome(Loss) (27,341) 10,838 11,027 39,979 59,749 3,693 121,593
InterestIncomeandDividendRevenue 12,677 13,188 13,084 12,460 15,508 43,990 54,240Other 2,416 (1,909) 2,231 (548) 16,749 (1,422) 16,523
Total Revenues 361,322 457,162 440,787 629,701 669,508 1,790,719 2,197,158ExpensesCompensation 94,808 100,578 102,888 99,886 82,000 358,381 385,352PerformanceFeeCompensationRealizedCarriedInterest 68,827 43,076 56,441 147,419 85,686 484,037 332,622RealizedIncentiveFees 5,813 2,133 3,300 1,764 4,888 8,678 12,085UnrealizedCarriedInterest (24,686) 27,703 14,257 (38,972) 41,787 (196,347) 44,775UnrealizedIncentiveFees 797 4,158 2,542 6,229 3,943 8,817 16,872TotalCompensationandBenefits 145,559 177,648 179,428 216,326 218,304 663,566 791,706
OtherOperatingExpenses 53,636 48,097 52,201 47,908 55,756 179,175 203,962Total Expenses 199,195 225,745 231,629 264,234 274,060 842,741 995,668
Economic Income 162,127$ 231,417$ 209,158$ 365,467$ 395,448$ 947,978$ 1,201,490$
TotalAssetsUnderManagement 93,917,824$ 101,107,528$ 103,197,060$ 101,876,562$ 101,963,652$ 93,917,824$ 101,963,652$Fee-EarningAssetsUnderManagement 67,345,357$ 67,298,439$ 66,744,550$ 65,785,083$ 72,030,054$ 67,345,357$ 72,030,054$WeightedAverageFee-EarningAUM 65,356,567$ 66,943,268$ 67,215,301$ 66,708,328$ 68,688,082$ 63,722,064$ 67,503,830$LPCapitalInvested 7,733,638$ 3,747,181$ 1,524,415$ 1,719,764$ 3,978,386$ 16,259,362$ 10,969,746$TotalCapitalInvested 7,835,881$ 3,820,460$ 1,557,192$ 1,749,778$ 4,048,827$ 16,603,472$ 11,176,257$
Blackstone 16
Hedge Fund Solutions(DollarsinThousands) 4Q'15 1Q'16 2Q'16 3Q'16 4Q'16 FY'15 FY'16RevenuesManagementFees,NetBaseManagementFees 129,941$ 130,158$ 130,123$ 130,305$ 131,150$ 524,386$ 521,736$TransactionandOtherFees,Net 73 543 (5) 116 407 317 1,061ManagementFeeOffsets 1,566 - - - - 171 -TotalManagementFees,Net 131,580 130,701 130,118 130,421 131,557 524,874 522,797
PerformanceFeesRealizedIncentiveFees 37,983 2,684 (251) 4,572 35,172 68,197 42,177UnrealizedCarriedInterest (599) 32 801 (84) (245) 2,021 504UnrealizedIncentiveFees (41,655) (2,935) 1,036 12,038 (9,354) (8,084) 785TotalPerformanceFees (4,271) (219) 1,586 16,526 25,573 62,134 43,466
InvestmentIncome(Loss)Realized (141) (4,745) (515) (1,211) (753) (12,741) (7,224)Unrealized (1,539) (12,291) 9,357 12,219 6,177 (1,435) 15,462TotalInvestmentIncome(Loss) (1,680) (17,036) 8,842 11,008 5,424 (14,176) 8,238
InterestIncomeandDividendRevenue 5,219 5,296 5,205 4,692 7,890 17,274 23,083Other 1,414 (1,388) 1,125 (260) 8,680 200 8,157
Total Revenues 132,262 117,354 146,876 162,387 179,124 590,306 605,741ExpensesCompensation 33,131 54,169 44,436 47,206 39,509 179,484 185,320PerformanceFeeCompensationRealizedIncentiveFees 15,410 1,863 1,325 2,902 13,307 27,155 19,397UnrealizedCarriedInterest (213) - 238 35 (92) 823 181UnrealizedIncentiveFees (15,316) (1,195) 480 4,557 (3,550) (2,912) 292TotalCompensationandBenefits 33,012 54,837 46,479 54,700 49,174 204,550 205,190
OtherOperatingExpenses 24,220 26,146 27,218 27,432 27,840 90,072 108,636Total Expenses 57,232 80,983 73,697 82,132 77,014 294,622 313,826
Economic Income 75,030$ 36,371$ 73,179$ 80,255$ 102,110$ 295,684$ 291,915$
TotalAssetsUnderManagement 69,105,425$ 68,475,416$ 68,649,878$ 70,113,508$ 71,119,718$ 69,105,425$ 71,119,718$Fee-EarningAssetsUnderManagement 65,665,439$ 64,831,253$ 64,973,999$ 66,434,971$ 66,987,553$ 65,665,439$ 66,987,553$WeightedAverageFee-EarningAUM 65,802,335$ 65,123,126$ 65,520,626$ 66,600,260$ 67,993,100$ 65,203,649$ 66,585,721$LPCapitalInvested 41,332$ 315,757$ 32,804$ 135,105$ 56,677$ 243,241$ 540,343$TotalCapitalInvested 39,877$ 329,793$ 32,809$ 141,699$ 56,766$ 252,368$ 561,067$
Blackstone 17
Credit(DollarsinThousands) 4Q'15 1Q'16 2Q'16 3Q'16 4Q'16 FY'15 FY'16RevenuesManagementFees,NetBaseManagementFees 125,805$ 125,990$ 131,392$ 133,867$ 135,499$ 500,982$ 526,748$TransactionandOtherFees,Net 1,565 1,342 1,424 1,823 2,011 6,371 6,600ManagementFeeOffsets (7,585) (9,658) (9,982) (7,091) (10,781) (30,065) (37,512)TotalManagementFees,Net 119,785 117,674 122,834 128,599 126,729 477,288 495,836
PerformanceFeesRealizedCarriedInterest 4,258 - 296 15,644 10,223 96,156 26,163RealizedIncentiveFees 33,158 21,697 23,515 21,866 33,221 109,396 100,299UnrealizedCarriedInterest (118,721) (14,779) 87,295 75,093 59,344 (198,820) 206,953UnrealizedIncentiveFees (9,193) 270 1,029 5,689 2,429 (19,967) 9,417TotalPerformanceFees (90,498) 7,188 112,135 118,292 105,217 (13,235) 342,832
InvestmentIncome(Loss)Realized 491 (2,974) 11,330 (328) 2,976 7,186 11,004Unrealized (15,728) (17,561) 8,412 12,875 7,195 (16,258) 10,921TotalInvestmentIncome(Loss) (15,237) (20,535) 19,742 12,547 10,171 (9,072) 21,925
InterestIncomeandDividendRevenue 6,957 6,748 7,428 6,769 7,344 24,599 28,289Other 1,717 (1,364) 1,795 (28) 9,171 5,171 9,574
Total Revenues 22,724 109,711 263,934 266,179 258,632 484,751 898,456ExpensesCompensation 41,864 52,382 55,691 47,614 46,400 190,189 202,087PerformanceFeeCompensationRealizedCarriedInterest 2,259 - 194 7,267 4,989 52,841 12,450RealizedIncentiveFees 15,598 10,127 10,626 10,770 15,091 50,113 46,614UnrealizedCarriedInterest (61,651) (6,998) 41,257 39,681 30,005 (107,000) 103,945UnrealizedIncentiveFees (4,421) 485 (333) 2,722 1,096 (8,395) 3,970TotalCompensationandBenefits (6,351) 55,996 107,435 108,054 97,581 177,748 369,066
OtherOperatingExpenses 23,353 26,220 29,464 28,016 36,611 93,626 120,311Total Expenses 17,002 82,216 136,899 136,070 134,192 271,374 489,377
Economic Income 5,722$ 27,495$ 127,035$ 130,109$ 124,440$ 213,377$ 409,079$
TotalAssetsUnderManagement 79,081,252$ 78,656,291$ 84,749,076$ 89,327,781$ 93,277,145$ 79,081,252$ 93,277,145$Fee-EarningAssetsUnderManagement 61,684,380$ 62,094,760$ 64,820,990$ 66,189,763$ 68,961,656$ 61,684,380$ 68,961,656$WeightedAverageFee-EarningAUM 60,598,308$ 61,584,275$ 63,656,504$ 65,648,573$ 68,177,879$ 60,444,233$ 64,772,873$LPCapitalInvested 2,496,709$ 586,935$ 699,516$ 588,389$ 1,380,009$ 3,783,265$ 3,254,849$TotalCapitalInvested 2,601,675$ 568,731$ 822,172$ 605,383$ 1,416,913$ 4,083,999$ 3,413,199$
Blackstone 18
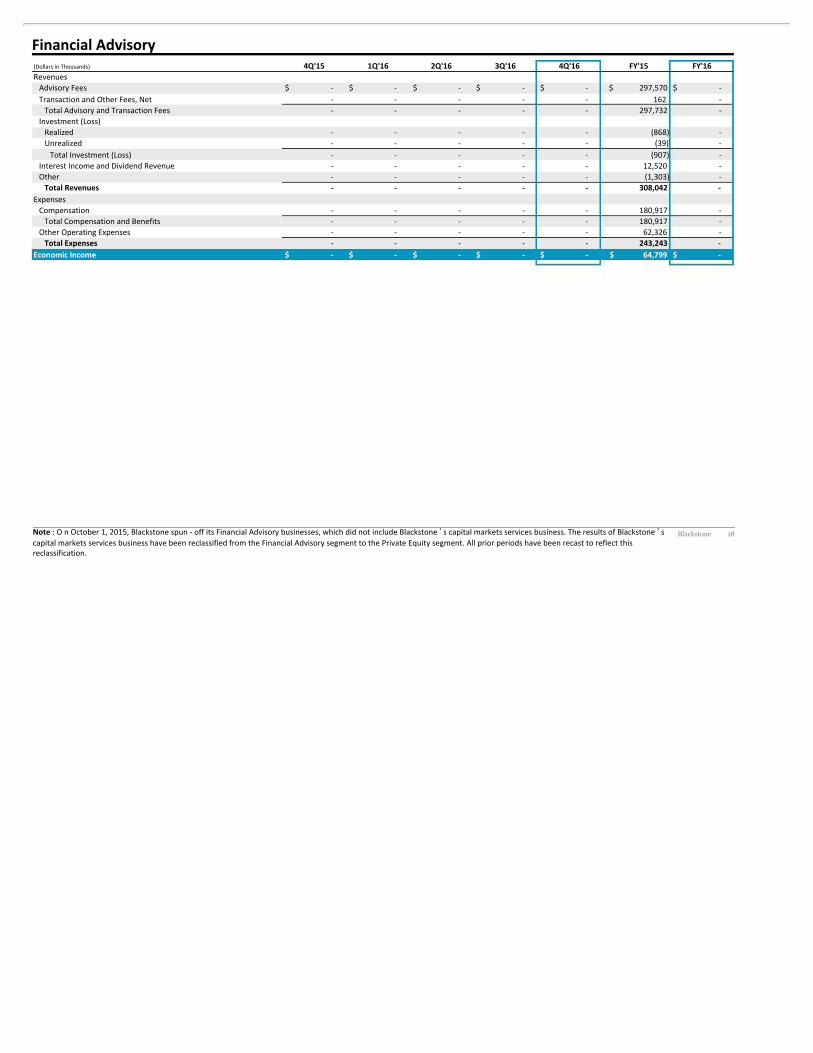
Financial Advisory
Note :OnOctober1,2015,Blackstonespun-offitsFinancialAdvisorybusinesses,whichdidnotincludeBlackstone’ scapitalmarketsservicesbusiness.TheresultsofBlackstone’ scapitalmarketsservicesbusinesshavebeenreclassifiedfromtheFinancialAdvisorysegmenttothePrivateEquitysegment.Allpriorperiodshavebeenrecasttoreflectthisreclassification.
(DollarsinThousands) 4Q'15 1Q'16 2Q'16 3Q'16 4Q'16 FY'15 FY'16RevenuesAdvisoryFees -$ -$ -$ -$ -$ 297,570$ -$TransactionandOtherFees,Net - - - - - 162 -TotalAdvisoryandTransactionFees - - - - - 297,732 -
Investment(Loss)Realized - - - - - (868) -Unrealized - - - - - (39) -TotalInvestment(Loss) - - - - - (907) -
InterestIncomeandDividendRevenue - - - - - 12,520 -Other - - - - - (1,303) -
Total Revenues - - - - - 308,042 -ExpensesCompensation - - - - - 180,917 -TotalCompensationandBenefits - - - - - 180,917 -
OtherOperatingExpenses - - - - - 62,326 -Total Expenses - - - - - 243,243 -
Economic Income -$ -$ -$ -$ -$ 64,799$ -$
Blackstone 19
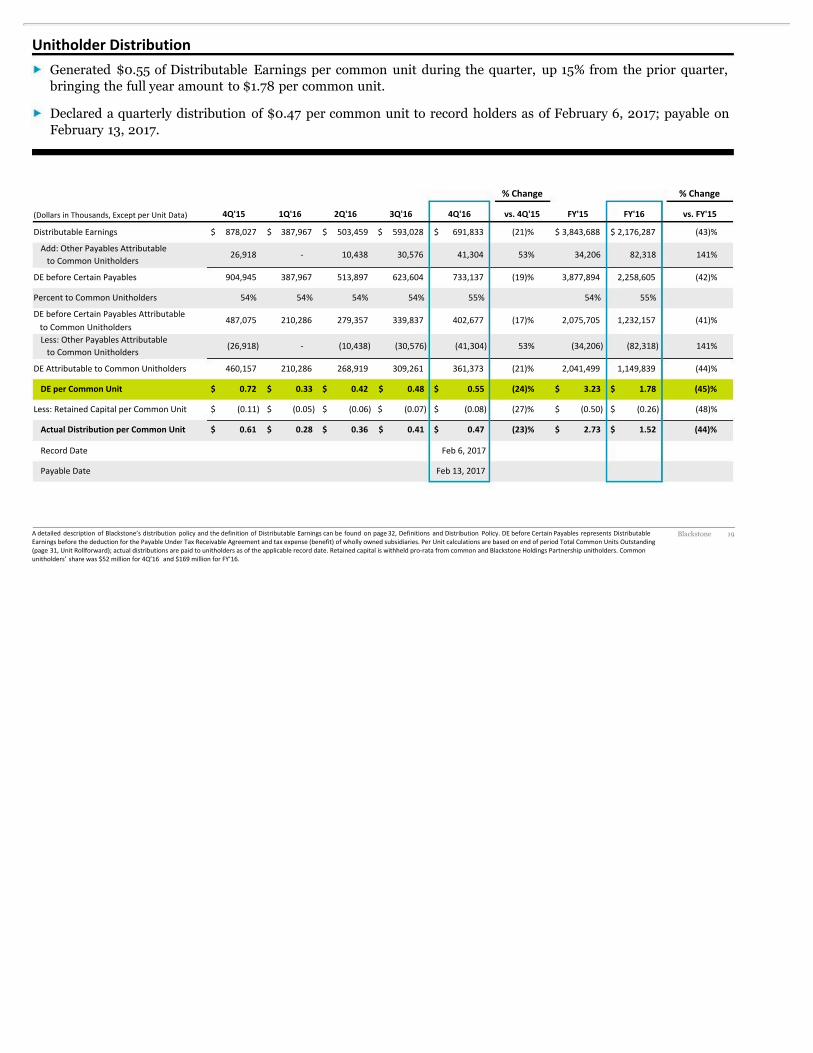
Unitholder Distribution
A detailed description of Blackstone’s distribution policy and the definition of Distributable Earnings can be found on page32, Definitions and Distribution Policy. DE before Certain Payables represents DistributableEarningsbeforethedeductionforthePayableUnderTaxReceivableAgreementandtaxexpense(benefit)ofwhollyownedsubsidiaries.PerUnitcalculationsarebasedonendofperiodTotalCommonUnitsOutstanding(page 31,UnitRollforward);actualdistributionsarepaidtounitholdersasoftheapplicablerecorddate.Retainedcapitaliswithheldpro-ratafromcommonandBlackstoneHoldingsPartnershipunitholders.Commonunitholders’ sharewas$52millionfor4Q’16 and$169millionforFY’16.
Generated $0.55 of Distributable Earnings per common unit during the quarter, up 15% from the prior quarter,bringing the full year amount to $1.78 per common unit.
Declared a quarterly distribution of $0.47 per common unit to record holders as of February 6, 2017; payable onFebruary 13, 2017.
% Change % Change
(DollarsinThousands,ExceptperUnitData) 4Q'15 1Q'16 2Q'16 3Q'16 4Q'16 vs. 4Q'15 FY'15 FY'16 vs. FY'15
DistributableEarnings 878,027$ 387,967$ 503,459$ 593,028$ 691,833$ (21)% 3,843,688$ 2,176,287$ (43)%
Add:OtherPayablesAttributabletoCommonUnitholders
26,918 - 10,438 30,576 41,304 53% 34,206 82,318 141%
DEbeforeCertainPayables 904,945 387,967 513,897 623,604 733,137 (19)% 3,877,894 2,258,605 (42)%
PercenttoCommonUnitholders 54% 54% 54% 54% 55% 54% 55%
DEbeforeCertainPayablesAttributabletoCommonUnitholders
487,075 210,286 279,357 339,837 402,677 (17)% 2,075,705 1,232,157 (41)%
Less:OtherPayablesAttributabletoCommonUnitholders
(26,918) - (10,438) (30,576) (41,304) 53% (34,206) (82,318) 141%
DEAttributabletoCommonUnitholders 460,157 210,286 268,919 309,261 361,373 (21)% 2,041,499 1,149,839 (44)%
DE per Common Unit 0.72$ 0.33$ 0.42$ 0.48$ 0.55$ (24)% 3.23$ 1.78$ (45)%
Less:RetainedCapitalperCommonUnit (0.11)$ (0.05)$ (0.06)$ (0.07)$ (0.08)$ (27)% (0.50)$ (0.26)$ (48)%
Actual Distribution per Common Unit 0.61$ 0.28$ 0.36$ 0.41$ 0.47$ (23)% 2.73$ 1.52$ (44)%
RecordDate Feb6,2017
PayableDate Feb13,2017
Blackstone 20
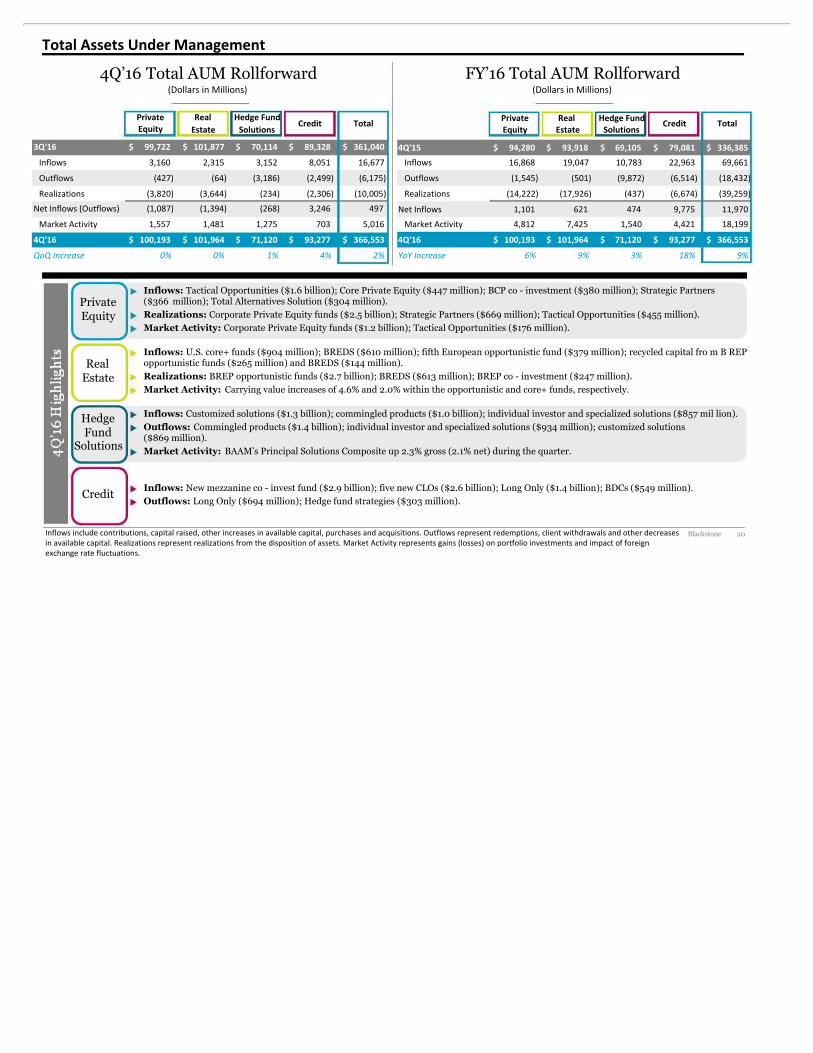
4Q’16 Total AUM Rollforward(DollarsinMillions)
FY’16 Total AUM Rollforward(DollarsinMillions)
Inflowsincludecontributions,capitalraised,otherincreasesinavailablecapital,purchasesandacquisitions.Outflowsrepresentredemptions,clientwithdrawalsandotherdecreasesinavailablecapital.Realizationsrepresentrealizationsfromthedispositionofassets.MarketActivityrepresentsgains(losses)onportfolioinvestmentsandimpactofforeignexchangeratefluctuations.
Total Assets Under Management
Private Real Hedge FundEquity Estate Solutions
4Q'15 94,280$ 93,918$ 69,105$ 79,081$ 336,385$
Inflows 16,868 19,047 10,783 22,963 69,661
Outflows (1,545) (501) (9,872) (6,514) (18,432)
Realizations (14,222) (17,926) (437) (6,674) (39,259)
NetInflows 1,101 621 474 9,775 11,970
MarketActivity 4,812 7,425 1,540 4,421 18,199
4Q'16 100,193$ 101,964$ 71,120$ 93,277$ 366,553$
YoY Increase 6% 9% 3% 18% 9%
Credit Total
PrivateEquity
RealEstate
HedgeFund
Solutions
Credit
Inflows: U.S. core+ funds ($904 million); BREDS ($610 million); fifth European opportunistic fund ($379 million); recycled capital fro m B REPopportunistic funds ($265 million) and BREDS ($144 million).Realizations: BREP opportunistic funds ($2.7 billion); BREDS ($613 million); BREP co - investment ($247 million).Market Activity: Carrying value increases of 4.6% and 2.0% within the opportunistic and core+ funds, respectively.
Inflows: Customized solutions ($1.3 billion); commingled products ($1.0 billion); individual investor and specialized solutions ($857 mil lion).Outflows: Commingled products ($1.4 billion); individual investor and specialized solutions ($934 million); customized solutions($869 million).Market Activity: BAAM’s Principal Solutions Composite up 2.3% gross (2.1% net) during the quarter.
Inflows: New mezzanine co - invest fund ($2.9 billion); five new CLOs ($2.6 billion); Long Only ($1.4 billion); BDCs ($549 million).Outflows: Long Only ($694 million); Hedge fund strategies ($303 million).
Inflows: Tactical Opportunities ($1.6 billion); Core Private Equity ($447 million); BCP co - investment ($380 million); Strategic Partners($366 million); Total Alternatives Solution ($304 million).Realizations: Corporate Private Equity funds ($2.5 billion); Strategic Partners ($669 million); Tactical Opportunities ($455 million).Market Activity: Corporate Private Equity funds ($1.2 billion); Tactical Opportunities ($176 million).
Private Real Hedge FundEquity Estate Solutions
3Q'16 99,722$ 101,877$ 70,114$ 89,328$ 361,040$
Inflows 3,160 2,315 3,152 8,051 16,677
Outflows (427) (64) (3,186) (2,499) (6,175)
Realizations (3,820) (3,644) (234) (2,306) (10,005)
NetInflows(Outflows) (1,087) (1,394) (268) 3,246 497
MarketActivity 1,557 1,481 1,275 703 5,016
4Q'16 100,193$ 101,964$ 71,120$ 93,277$ 366,553$
QoQ Increase 0% 0% 1% 4% 2%
Credit Total
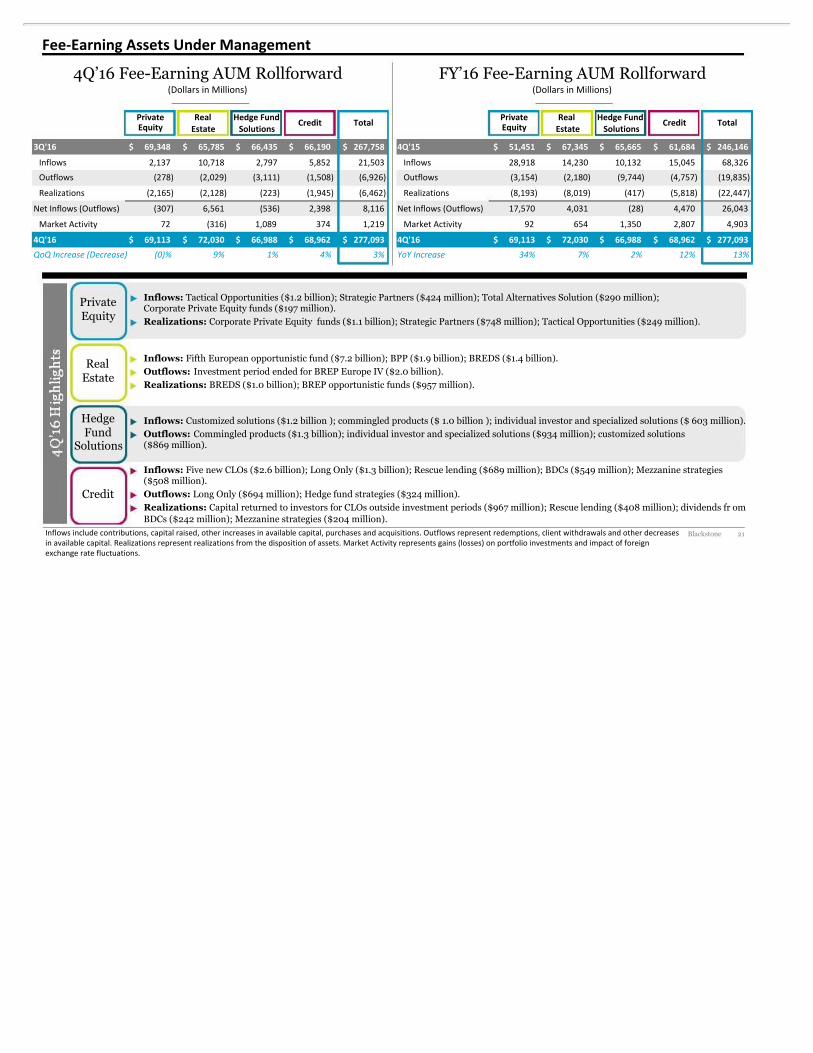
Blackstone 21Inflowsincludecontributions,capitalraised,otherincreasesinavailablecapital,purchasesandacquisitions.Outflowsrepresentredemptions,clientwithdrawalsandotherdecreasesinavailablecapital.Realizationsrepresentrealizationsfromthedispositionofassets.MarketActivityrepresentsgains(losses)onportfolioinvestmentsandimpactofforeignexchangeratefluctuations.
4Q’16 Fee-Earning AUM Rollforward(DollarsinMillions)
FY’16 Fee-Earning AUM Rollforward(DollarsinMillions)
PrivateEquity
RealEstate
HedgeFund
Solutions
Credit
Inflows: Fifth European opportunistic fund ($7.2 billion); BPP ($1.9 billion); BREDS ($1.4 billion).Outflows: Investment period ended for BREP Europe IV ($2.0 billion).Realizations: BREDS ($1.0 billion); BREP opportunistic funds ($957 million).
Inflows: Customized solutions ($1.2 billion ); commingled products ($ 1.0 billion ); individual investor and specialized solutions ($ 603 million).Outflows: Commingled products ($1.3 billion); individual investor and specialized solutions ($934 million); customized solutions($869 million).
Inflows: Five new CLOs ($2.6 billion); Long Only ($1.3 billion); Rescue lending ($689 million); BDCs ($549 million); Mezzanine strategies($508 million).Outflows: Long Only ($694 million); Hedge fund strategies ($324 million).Realizations: Capital returned to investors for CLOs outside investment periods ($967 million); Rescue lending ($408 million); dividends fr omBDCs ($242 million); Mezzanine strategies ($204 million).
Inflows: Tactical Opportunities ($1.2 billion); Strategic Partners ($424 million); Total Alternatives Solution ($290 million);Corporate Private Equity funds ($197 million).Realizations: Corporate Private Equity funds ($1.1 billion); Strategic Partners ($748 million); Tactical Opportunities ($249 million).
Fee-Earning Assets Under Management
Private Real Hedge FundEquity Estate Solutions
3Q'16 69,348$ 65,785$ 66,435$ 66,190$ 267,758$
Inflows 2,137 10,718 2,797 5,852 21,503
Outflows (278) (2,029) (3,111) (1,508) (6,926)
Realizations (2,165) (2,128) (223) (1,945) (6,462)
NetInflows(Outflows) (307) 6,561 (536) 2,398 8,116
MarketActivity 72 (316) 1,089 374 1,219
4Q'16 69,113$ 72,030$ 66,988$ 68,962$ 277,093$
QoQ Increase (Decrease) (0)% 9% 1% 4% 3%
Credit Total Private Real Hedge FundEquity Estate Solutions
4Q'15 51,451$ 67,345$ 65,665$ 61,684$ 246,146$
Inflows 28,918 14,230 10,132 15,045 68,326
Outflows (3,154) (2,180) (9,744) (4,757) (19,835)
Realizations (8,193) (8,019) (417) (5,818) (22,447)
NetInflows(Outflows) 17,570 4,031 (28) 4,470 26,043
MarketActivity 92 654 1,350 2,807 4,903
4Q'16 69,113$ 72,030$ 66,988$ 68,962$ 277,093$
YoY Increase 34% 7% 2% 12% 13%
Credit Total
Blackstone 22
Net Accrued Performance Fees
$3.5 billionNetAccruedPerformanceFeesat4Q’16
$2.91 per unitNetAccruedPerformanceFeesat4Q’16
Net Accrued Performance Fees
(DollarsinMillions,ExceptperUnitData) 3Q'16 4Q'16 4Q'16 Per Unit QoQ ChangePrivate EquityBCPIVCarriedInterest 158$ 186$ 0.16$ 28$BCPVCarriedInterest 306 323 0.27 17BCPVICarriedInterest 484 548 0.46 64BEPICarriedInterest 70 71 0.06 1BEPIICarriedInterest - 2 - 2TacticalOpportunitiesCarriedInterest 79 83 0.07 4BTASCarriedInterest 10 17 0.01 7StrategicPartnersCarriedInterest 35 34 0.03 (1)OtherCarriedInterest 2 4 - 2Total Private Equity 1,144$ 1,268$ 1.06$ 124$ Real EstateBREPIVCarriedInterest 8 8 0.01 -BREPVCarriedInterest 331 300 0.25 (31)BREPVICarriedInterest 488 510 0.43 22BREPVIICarriedInterest 551 504 0.42 (47)BREPVIIICarriedInterest 132 143 0.12 11BREPEuropeIIICarriedInterest 152 140 0.12 (12)BREPEuropeIVCarriedInterest 150 184 0.15 34BREPAsiaCarriedInterest 102 79 0.07 (23)BPPCarriedInterest 52 57 0.05 5BPPIncentiveFees 28 34 0.03 6BREDSCarriedInterest 14 16 0.01 2BREDSIncentiveFees 2 4 - 2AsiaPlatformIncentiveFees 7 7 0.01 -Total Real Estate 2,017$ 1,986$ 1.67$ (31)$ Hedge Fund SolutionsIncentiveFees 15 24 0.02 9Total Hedge Fund Solutions 15$ 24$ 0.02$ 9$ CreditCarriedInterest 139 168 0.14 29IncentiveFees 20 24 0.02 4Total Credit 159$ 192$ 0.16$ 33$ Total BlackstoneCarriedInterest 3,263 3,377 2.83 114IncentiveFees 72 93 0.08 21Net Accrued Performance Fees 3,335$ 3,470$ 2.91$ 135$ Memo: Net Realized Performance Fees 85$ 119$ 0.10$ 35$
NetAccruedPerformanceFeesarepresentednetofperformancefeecompensationanddonotincludeclawbackamounts,ifany,whicharedisclosedinthe10-K/Q.NetRealizedPerformanceFeesareincludedinDE.NetRealizedPerformanceFeesrepresentsPerformanceFeesrealized,butnotyetdistributedasofthereportingdateandincludedintheNetAccruedPerformanceFeebalance.Whenthesefeesarereceived,thereceivableisreducedwithoutfurtherimpactingDE.PerUnitcalculationsarebasedonendofperiodDEUnitsOutstanding(seepage31,UnitRollforward).
Blackstone 23
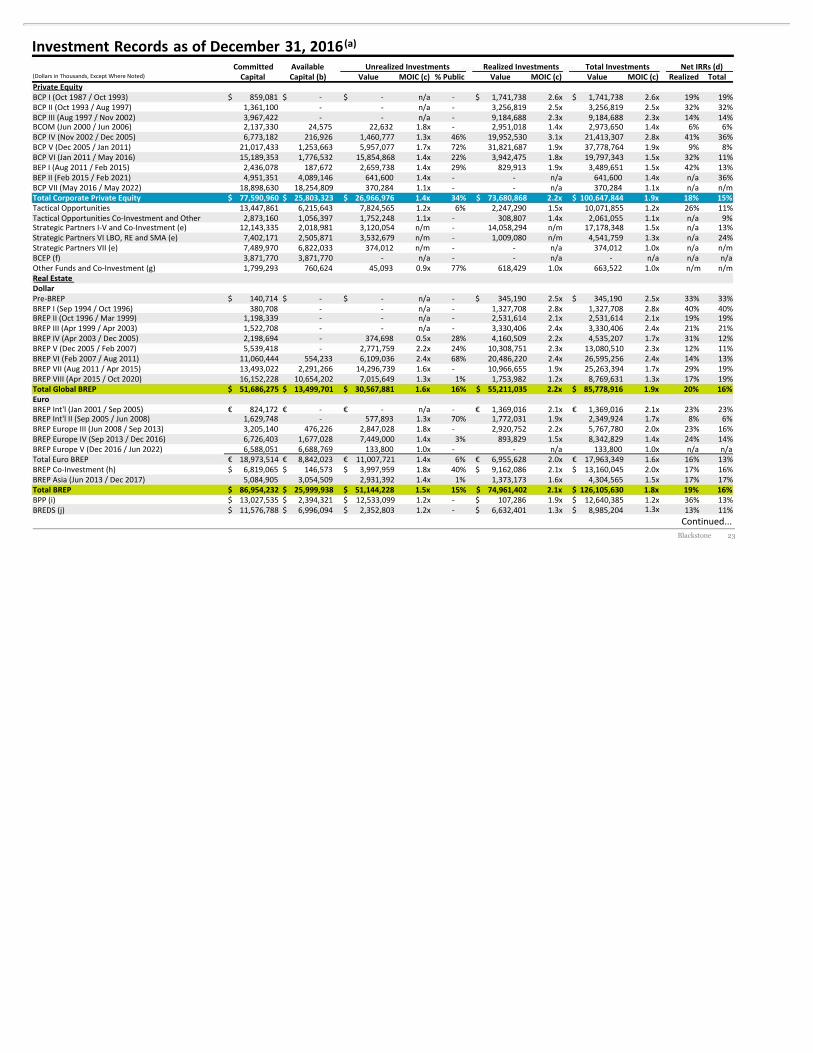
Investment Records as of December 31, 2016 (a)
Continued...
Committed Available Unrealized Investments Realized Investments Total Investments Net IRRs (d)(DollarsinThousands,ExceptWhereNoted) Capital Capital (b) Value MOIC (c) % Public Value MOIC (c) Value MOIC (c) Realized TotalPrivate EquityBCPI(Oct1987/Oct1993) 859,081$ -$ -$ n/a - 1,741,738$ 2.6x 1,741,738$ 2.6x 19% 19%BCPII(Oct1993/Aug1997) 1,361,100 - - n/a - 3,256,819 2.5x 3,256,819 2.5x 32% 32%BCPIII(Aug1997/Nov2002) 3,967,422 - - n/a - 9,184,688 2.3x 9,184,688 2.3x 14% 14%BCOM(Jun2000/Jun2006) 2,137,330 24,575 22,632 1.8x - 2,951,018 1.4x 2,973,650 1.4x 6% 6%BCPIV(Nov2002/Dec2005) 6,773,182 216,926 1,460,777 1.3x 46% 19,952,530 3.1x 21,413,307 2.8x 41% 36%BCPV(Dec2005/Jan2011) 21,017,433 1,253,663 5,957,077 1.7x 72% 31,821,687 1.9x 37,778,764 1.9x 9% 8%BCPVI(Jan2011/May2016) 15,189,353 1,776,532 15,854,868 1.4x 22% 3,942,475 1.8x 19,797,343 1.5x 32% 11%BEPI(Aug2011/Feb2015) 2,436,078 187,672 2,659,738 1.4x 29% 829,913 1.9x 3,489,651 1.5x 42% 13%BEPII(Feb2015/Feb2021) 4,951,351 4,089,146 641,600 1.4x - - n/a 641,600 1.4x n/a 36%BCPVII(May2016/May2022) 18,898,630 18,254,809 370,284 1.1x - - n/a 370,284 1.1x n/a n/mTotal Corporate Private Equity 77,590,960$ 25,803,323$ 26,966,976$ 1.4x 34% 73,680,868$ 2.2x 100,647,844$ 1.9x 18% 15%TacticalOpportunities 13,447,861 6,215,643 7,824,565 1.2x 6% 2,247,290 1.5x 10,071,855 1.2x 26% 11%TacticalOpportunitiesCo-InvestmentandOther 2,873,160 1,056,397 1,752,248 1.1x - 308,807 1.4x 2,061,055 1.1x n/a 9%StrategicPartnersI-VandCo-Investment(e) 12,143,335 2,018,981 3,120,054 n/m - 14,058,294 n/m 17,178,348 1.5x n/a 13%StrategicPartnersVILBO,REandSMA(e) 7,402,171 2,505,871 3,532,679 n/m - 1,009,080 n/m 4,541,759 1.3x n/a 24%StrategicPartnersVII(e) 7,489,970 6,822,033 374,012 n/m - - n/a 374,012 1.0x n/a n/mBCEP(f) 3,871,770 3,871,770 - n/a - - n/a - n/a n/a n/aOtherFundsandCo-Investment(g) 1,799,293 760,624 45,093 0.9x 77% 618,429 1.0x 663,522 1.0x n/m n/mReal EstateDollarPre-BREP 140,714$ -$ -$ n/a - 345,190$ 2.5x 345,190$ 2.5x 33% 33%BREPI(Sep1994/Oct1996) 380,708 - - n/a - 1,327,708 2.8x 1,327,708 2.8x 40% 40%BREPII(Oct1996/Mar1999) 1,198,339 - - n/a - 2,531,614 2.1x 2,531,614 2.1x 19% 19%BREPIII(Apr1999/Apr2003) 1,522,708 - - n/a - 3,330,406 2.4x 3,330,406 2.4x 21% 21%BREPIV(Apr2003/Dec2005) 2,198,694 - 374,698 0.5x 28% 4,160,509 2.2x 4,535,207 1.7x 31% 12%BREPV(Dec2005/Feb2007) 5,539,418 - 2,771,759 2.2x 24% 10,308,751 2.3x 13,080,510 2.3x 12% 11%BREPVI(Feb2007/Aug2011) 11,060,444 554,233 6,109,036 2.4x 68% 20,486,220 2.4x 26,595,256 2.4x 14% 13%BREPVII(Aug2011/Apr2015) 13,493,022 2,291,266 14,296,739 1.6x - 10,966,655 1.9x 25,263,394 1.7x 29% 19%BREPVIII(Apr2015/Oct2020) 16,152,228 10,654,202 7,015,649 1.3x 1% 1,753,982 1.2x 8,769,631 1.3x 17% 19%Total Global BREP 51,686,275$ 13,499,701$ 30,567,881$ 1.6x 16% 55,211,035$ 2.2x 85,778,916$ 1.9x 20% 16%EuroBREPInt'l(Jan2001/Sep2005) 824,172€ -€ -€ n/a - 1,369,016€ 2.1x 1,369,016€ 2.1x 23% 23%BREPInt'lII(Sep2005/Jun2008) 1,629,748 - 577,893 1.3x 70% 1,772,031 1.9x 2,349,924 1.7x 8% 6%BREPEuropeIII(Jun2008/Sep2013) 3,205,140 476,226 2,847,028 1.8x - 2,920,752 2.2x 5,767,780 2.0x 23% 16%BREPEuropeIV(Sep2013/Dec2016) 6,726,403 1,677,028 7,449,000 1.4x 3% 893,829 1.5x 8,342,829 1.4x 24% 14%BREPEuropeV(Dec2016/Jun2022) 6,588,051 6,688,769 133,800 1.0x - - n/a 133,800 1.0x n/a n/aTotalEuroBREP 18,973,514€ 8,842,023€ 11,007,721€ 1.4x 6% 6,955,628€ 2.0x 17,963,349€ 1.6x 16% 13%BREPCo-Investment(h) 6,819,065$ 146,573$ 3,997,959$ 1.8x 40% 9,162,086$ 2.1x 13,160,045$ 2.0x 17% 16%BREPAsia(Jun2013/Dec2017) 5,084,905 3,054,509 2,931,392 1.4x 1% 1,373,173 1.6x 4,304,565 1.5x 17% 17%Total BREP 86,954,232$ 25,999,938$ 51,144,228$ 1.5x 15% 74,961,402$ 2.1x 126,105,630$ 1.8x 19% 16%BPP(i) 13,027,535$ 2,394,321$ 12,533,099$ 1.2x - 107,286$ 1.9x 12,640,385$ 1.2x 36% 13%BREDS(j) 11,576,788$ 6,996,094$ 2,352,803$ 1.2x - 6,632,401$ 1.3x 8,985,204$ 1.3x 13% 11%
Blackstone 24
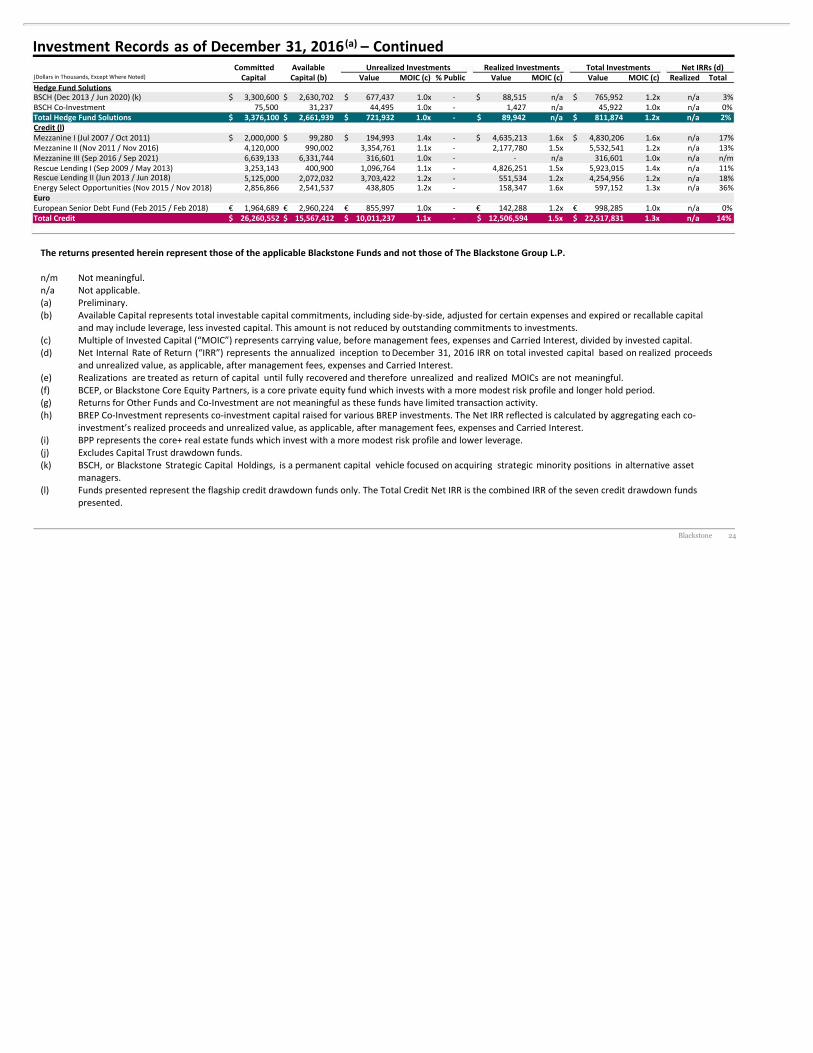
Investment Records as of December 31, 2016 (a) – Continued
The returns presented herein represent those of the applicable Blackstone Funds and not those of The Blackstone Group L.P.
n/m Notmeaningful.n/a Notapplicable.(a) Preliminary.(b) AvailableCapitalrepresentstotalinvestablecapitalcommitments,includingside-by-side,adjustedforcertainexpensesandexpiredorrecallablecapital
andmayincludeleverage,lessinvestedcapital.Thisamountisnotreducedbyoutstandingcommitmentstoinvestments.(c) MultipleofInvestedCapital(“MOIC”)representscarryingvalue,beforemanagementfees,expensesandCarriedInterest,dividedbyinvestedcapital.(d) Net Internal Rate of Return (“IRR”) represents the annualized inception toDecember 31, 2016 IRR on total invested capital based on realized proceeds
andunrealizedvalue,asapplicable,aftermanagementfees,expensesandCarriedInterest.(e) Realizations are treated as return of capital until fully recovered and therefore unrealized and realized MOICs are not meaningful.(f) BCEP,orBlackstoneCoreEquityPartners,isacoreprivateequityfundwhichinvestswithamoremodestriskprofileandlongerholdperiod.(g) ReturnsforOtherFundsandCo-Investmentarenotmeaningfulasthesefundshavelimitedtransactionactivity.(h) BREPCo-Investmentrepresentsco-investmentcapitalraisedforvariousBREPinvestments.TheNetIRRreflectediscalculatedbyaggregatingeachco-
investment’srealizedproceedsandunrealizedvalue,asapplicable,aftermanagementfees,expensesandCarriedInterest.(i) BPPrepresentsthecore+realestatefundswhichinvestwithamoremodestriskprofileandlowerleverage.(j) ExcludesCapitalTrustdrawdownfunds.(k) BSCH, or Blackstone Strategic Capital Holdings, is a permanent capital vehicle focused on acquiring strategic minority positions in alternative asset
managers.(l) Fundspresentedrepresenttheflagshipcreditdrawdownfundsonly.TheTotalCreditNetIRRisthecombinedIRRofthesevencreditdrawdownfunds
presented.
Committed Available Unrealized Investments Realized Investments Total Investments Net IRRs (d)(DollarsinThousands,ExceptWhereNoted) Capital Capital (b) Value MOIC (c) % Public Value MOIC (c) Value MOIC (c) Realized TotalHedge Fund SolutionsBSCH(Dec2013/Jun2020)(k) 3,300,600$ 2,630,702$ 677,437$ 1.0x - 88,515$ n/a 765,952$ 1.2x n/a 3%BSCHCo-Investment 75,500 31,237 44,495 1.0x - 1,427 n/a 45,922 1.0x n/a 0%Total Hedge Fund Solutions 3,376,100$ 2,661,939$ 721,932$ 1.0x - 89,942$ n/a 811,874$ 1.2x n/a 2%Credit (l)MezzanineI(Jul2007/Oct2011) 2,000,000$ 99,280$ 194,993$ 1.4x - 4,635,213$ 1.6x 4,830,206$ 1.6x n/a 17%MezzanineII(Nov2011/Nov2016) 4,120,000 990,002 3,354,761 1.1x - 2,177,780 1.5x 5,532,541 1.2x n/a 13%MezzanineIII(Sep2016/Sep2021) 6,639,133 6,331,744 316,601 1.0x - - n/a 316,601 1.0x n/a n/mRescueLendingI(Sep2009/May2013) 3,253,143 400,900 1,096,764 1.1x - 4,826,251 1.5x 5,923,015 1.4x n/a 11%RescueLendingII(Jun2013/Jun2018) 5,125,000 2,072,032 3,703,422 1.2x - 551,534 1.2x 4,254,956 1.2x n/a 18%EnergySelectOpportunities(Nov2015/Nov2018) 2,856,866 2,541,537 438,805 1.2x - 158,347 1.6x 597,152 1.3x n/a 36%EuroEuropeanSeniorDebtFund(Feb2015/Feb2018) 1,964,689€ 2,960,224€ 855,997€ 1.0x - 142,288€ 1.2x 998,285€ 1.0x n/a 0%Total Credit 26,260,552$ 15,567,412$ 10,011,237$ 1.1x - 12,506,594$ 1.5x 22,517,831$ 1.3x n/a 14%
Blackstone 25
Reconciliation of GAAP to Non-GAAP Measures
Notesonpage26.
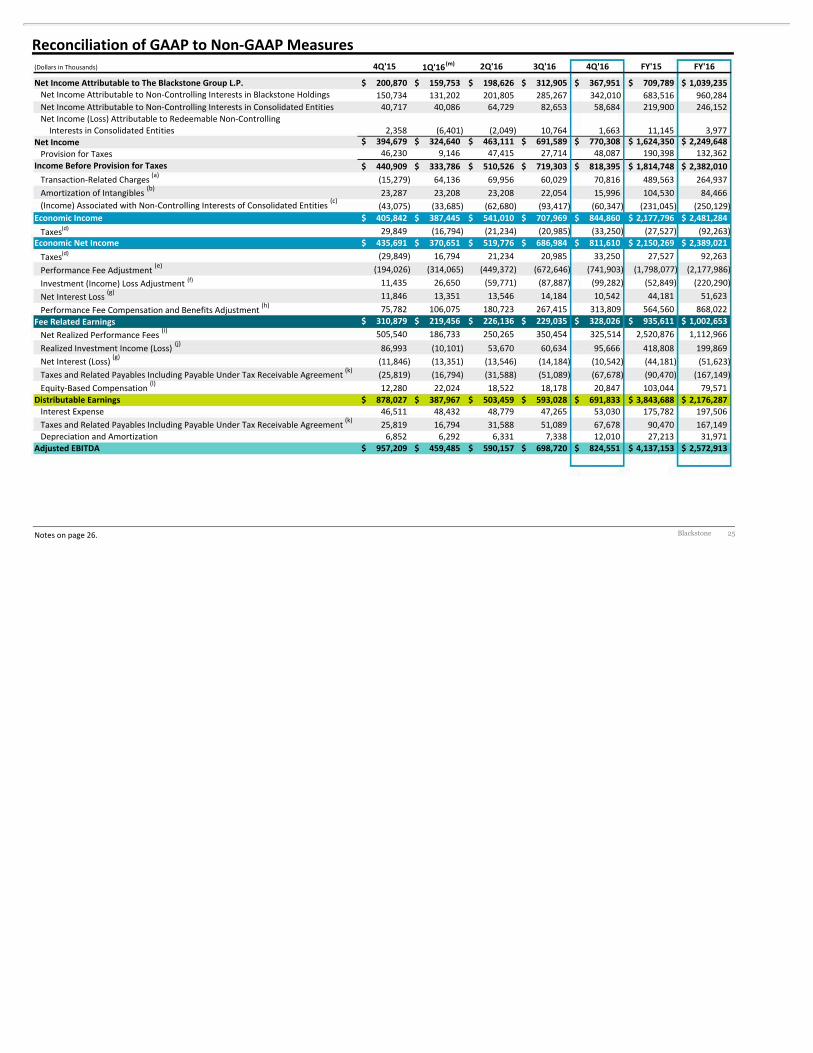
(DollarsinThousands) 4Q'15 1Q'16 (m) 2Q'16 3Q'16 4Q'16 FY'15 FY'16
Net Income Attributable to The Blackstone Group L.P. 200,870$ 159,753$ 198,626$ 312,905$ 367,951$ 709,789$ 1,039,235$NetIncomeAttributabletoNon-ControllingInterestsinBlackstoneHoldings 150,734 131,202 201,805 285,267 342,010 683,516 960,284NetIncomeAttributabletoNon-ControllingInterestsinConsolidatedEntities 40,717 40,086 64,729 82,653 58,684 219,900 246,152NetIncome(Loss)AttributabletoRedeemableNon-ControllingInterestsinConsolidatedEntities 2,358 (6,401) (2,049) 10,764 1,663 11,145 3,977
Net Income 394,679$ 324,640$ 463,111$ 691,589$ 770,308$ 1,624,350$ 2,249,648$ProvisionforTaxes 46,230 9,146 47,415 27,714 48,087 190,398 132,362
Income Before Provision for Taxes 440,909$ 333,786$ 510,526$ 719,303$ 818,395$ 1,814,748$ 2,382,010$Transaction-RelatedCharges (a) (15,279) 64,136 69,956 60,029 70,816 489,563 264,937AmortizationofIntangibles (b) 23,287 23,208 23,208 22,054 15,996 104,530 84,466(Income)AssociatedwithNon-ControllingInterestsofConsolidatedEntities (c)
(43,075) (33,685) (62,680) (93,417) (60,347) (231,045) (250,129)Economic Income 405,842$ 387,445$ 541,010$ 707,969$ 844,860$ 2,177,796$ 2,481,284$Taxes(d) 29,849 (16,794) (21,234) (20,985) (33,250) (27,527) (92,263)
Economic Net Income 435,691$ 370,651$ 519,776$ 686,984$ 811,610$ 2,150,269$ 2,389,021$Taxes(d) (29,849) 16,794 21,234 20,985 33,250 27,527 92,263PerformanceFeeAdjustment (e) (194,026) (314,065) (449,372) (672,646) (741,903) (1,798,077) (2,177,986)Investment(Income)LossAdjustment (f) 11,435 26,650 (59,771) (87,887) (99,282) (52,849) (220,290)NetInterestLoss (g) 11,846 13,351 13,546 14,184 10,542 44,181 51,623PerformanceFeeCompensationandBenefitsAdjustment (h) 75,782 106,075 180,723 267,415 313,809 564,560 868,022
Fee Related Earnings 310,879$ 219,456$ 226,136$ 229,035$ 328,026$ 935,611$ 1,002,653$NetRealizedPerformanceFees (i) 505,540 186,733 250,265 350,454 325,514 2,520,876 1,112,966RealizedInvestmentIncome(Loss) (j) 86,993 (10,101) 53,670 60,634 95,666 418,808 199,869NetInterest(Loss) (g) (11,846) (13,351) (13,546) (14,184) (10,542) (44,181) (51,623)TaxesandRelatedPayablesIncludingPayableUnderTaxReceivableAgreement (k) (25,819) (16,794) (31,588) (51,089) (67,678) (90,470) (167,149)Equity-BasedCompensation (l) 12,280 22,024 18,522 18,178 20,847 103,044 79,571
Distributable Earnings 878,027$ 387,967$ 503,459$ 593,028$ 691,833$ 3,843,688$ 2,176,287$InterestExpense 46,511 48,432 48,779 47,265 53,030 175,782 197,506TaxesandRelatedPayablesIncludingPayableUnderTaxReceivableAgreement (k) 25,819 16,794 31,588 51,089 67,678 90,470 167,149DepreciationandAmortization 6,852 6,292 6,331 7,338 12,010 27,213 31,971
Adjusted EBITDA 957,209$ 459,485$ 590,157$ 698,720$ 824,551$ 4,137,153$ 2,572,913$
Blackstone 26
Reconciliation of GAAP to Non-GAAP Measures – Notes
Note: Seepage32,DefinitionsandDistributionPolicy.
(a) ThisadjustmentaddsbacktoIncome(Loss)BeforeProvision(Benefit)forTaxesamountsforTransaction-RelatedChargeswhichincludeprincipallyequity-basedcompensationchargesassociatedwithBlackstone’sinitialpublicofferingandlong-termretentionprogramsoutsideofannualdeferredcompensationandothercorporateactions.
(b) ThisadjustmentaddsbacktoIncome(Loss)BeforeProvision(Benefit)forTaxesamountsfortheAmortizationofIntangibleswhichareassociatedwithBlackstone’sinitialpublicofferingandothercorporateactions.
(c) ThisadjustmentaddsbacktoIncome(Loss)BeforeProvision(Benefit)forTaxestheamountof(Income)LossAssociatedwithNon-ControllingInterestsofConsolidatedEntitiesandincludestheamountofManagementFeeRevenuesassociatedwithConsolidatedCLOEntities.
(d) TaxesrepresentthetotalGAAPtaxprovisionadjustedtoincludeonlythecurrenttaxprovision(benefit)calculatedonIncome(Loss)BeforeProvisionforTaxes.
(e) ThisadjustmentremovesfromEIthetotalsegmentamountofPerformanceFees.(f) ThisadjustmentremovesfromEIthetotalsegmentamountofInvestmentIncome(Loss).(g) ThisadjustmentrepresentsInterestIncomeandDividendRevenuelessInterestExpense.(h) ThisadjustmentremovesfromexpensesthecompensationandbenefitamountsrelatedtoBlackstone’sprofitsharingplansrelated
toPerformanceFees.(i) RepresentstheadjustmentforrealizedPerformanceFeesnetofcorrespondingactualamountsdueunderBlackstone’sprofit
sharingplansrelatedthereto.EqualsthesumofNetRealizedIncentiveFeesandNetRealizedCarriedInterest.(j) RepresentstheadjustmentforBlackstone’sRealizedInvestmentIncome(Loss).(k) TaxesandRelatedPayablesIncludingPayableUnderTaxReceivableAgreementrepresentthetotalGAAPtaxprovisionadjustedto
includeonlythecurrenttaxprovision(benefit) calculatedonIncome(Loss)BeforeProvisionforTaxesandthePayableUnderTaxReceivableAgreement.
(l) Representsequity-basedawardexpenseincludedinEI,whichexcludesalltransaction-relatedequity-basedcharges.(m) BlackstoneadoptednewGAAPstockcompensationguidancein2Q’16asofJanuary1,2016.AdoptionchangedProvisionforTaxes,
NetIncome,NetIncomeAttributabletoTheBlackstoneGroupL.P.andthenumberofGAAPWeighted-AverageUnitsOutstanding - Dilutedin1Q’16.Suchamountshavebeenrecastinthispresentationfromtheamountsoriginallyreportedin1Q’16.
Blackstone 27
Reconciliation of GAAP to Total Segment Measures
Notesonpage28.
Continued...
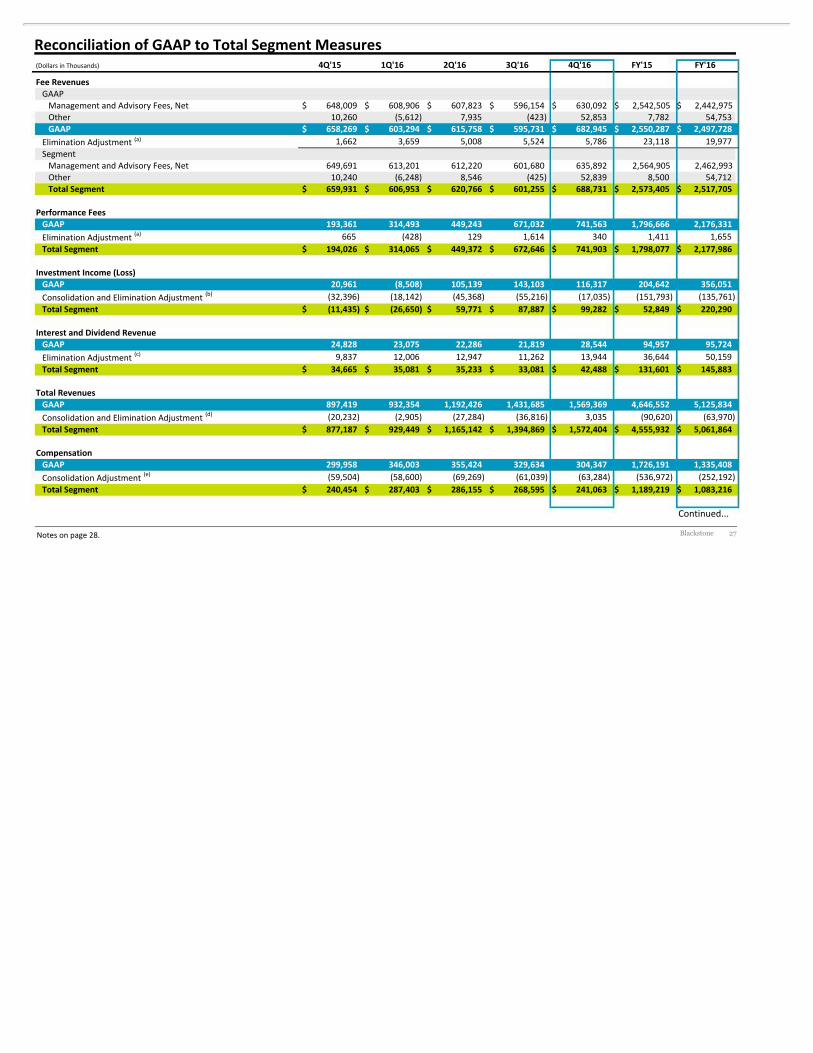
(DollarsinThousands) 4Q'15 1Q'16 2Q'16 3Q'16 4Q'16 FY'15 FY'16
Fee RevenuesGAAPManagementandAdvisoryFees,Net 648,009$ 608,906$ 607,823$ 596,154$ 630,092$ 2,542,505$ 2,442,975$Other 10,260 (5,612) 7,935 (423) 52,853 7,782 54,753GAAP 658,269$ 603,294$ 615,758$ 595,731$ 682,945$ 2,550,287$ 2,497,728$
EliminationAdjustment (a) 1,662 3,659 5,008 5,524 5,786 23,118 19,977SegmentManagementandAdvisoryFees,Net 649,691 613,201 612,220 601,680 635,892 2,564,905 2,462,993Other 10,240 (6,248) 8,546 (425) 52,839 8,500 54,712Total Segment 659,931$ 606,953$ 620,766$ 601,255$ 688,731$ 2,573,405$ 2,517,705$
Performance FeesGAAP 193,361 314,493 449,243 671,032 741,563 1,796,666 2,176,331EliminationAdjustment (a) 665 (428) 129 1,614 340 1,411 1,655Total Segment 194,026$ 314,065$ 449,372$ 672,646$ 741,903$ 1,798,077$ 2,177,986$
Investment Income (Loss)GAAP 20,961 (8,508) 105,139 143,103 116,317 204,642 356,051ConsolidationandEliminationAdjustment (b) (32,396) (18,142) (45,368) (55,216) (17,035) (151,793) (135,761)Total Segment (11,435)$ (26,650)$ 59,771$ 87,887$ 99,282$ 52,849$ 220,290$
Interest and Dividend RevenueGAAP 24,828 23,075 22,286 21,819 28,544 94,957 95,724EliminationAdjustment (c) 9,837 12,006 12,947 11,262 13,944 36,644 50,159Total Segment 34,665$ 35,081$ 35,233$ 33,081$ 42,488$ 131,601$ 145,883$
Total RevenuesGAAP 897,419 932,354 1,192,426 1,431,685 1,569,369 4,646,552 5,125,834ConsolidationandEliminationAdjustment (d) (20,232) (2,905) (27,284) (36,816) 3,035 (90,620) (63,970)Total Segment 877,187$ 929,449$ 1,165,142$ 1,394,869$ 1,572,404$ 4,555,932$ 5,061,864$
CompensationGAAP 299,958 346,003 355,424 329,634 304,347 1,726,191 1,335,408ConsolidationAdjustment (e) (59,504) (58,600) (69,269) (61,039) (63,284) (536,972) (252,192)Total Segment 240,454$ 287,403$ 286,155$ 268,595$ 241,063$ 1,189,219$ 1,083,216$
Blackstone 28
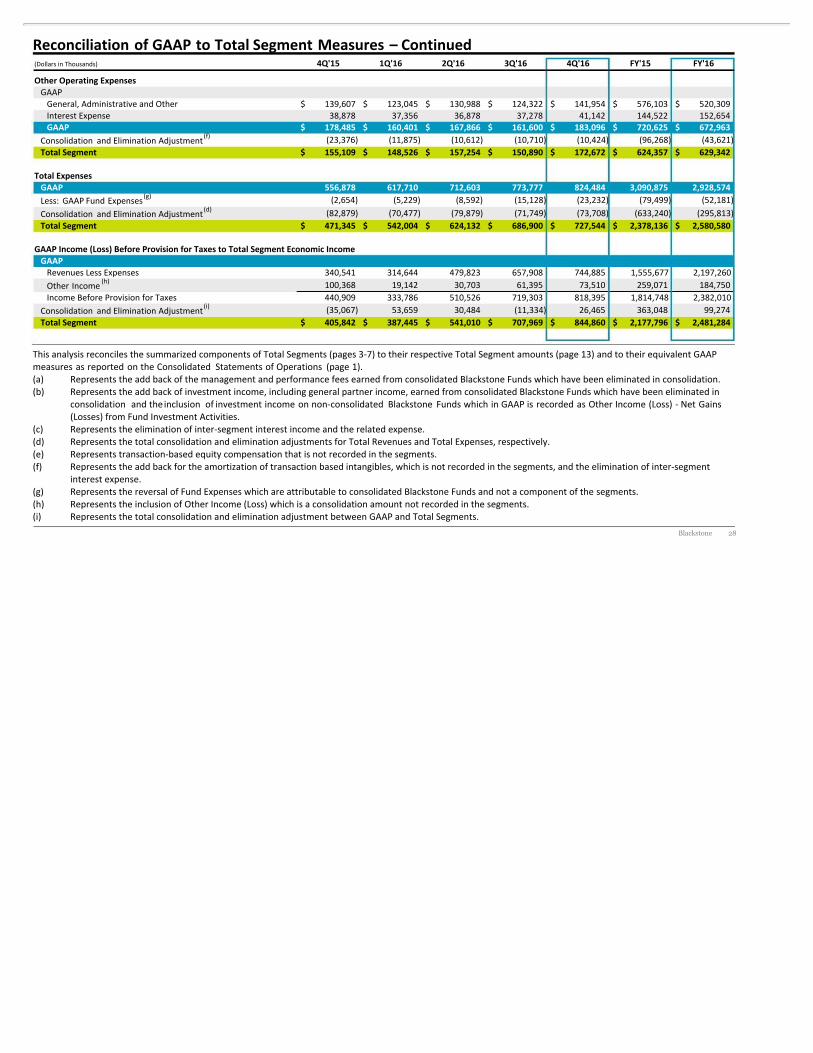
Reconciliation of GAAP to Total Segment Measures – Continued
ThisanalysisreconcilesthesummarizedcomponentsofTotalSegments(pages3-7)totheirrespectiveTotalSegmentamounts(page13)andtotheirequivalentGAAPmeasures as reported on the Consolidated Statements of Operations (page 1).(a) RepresentstheaddbackofthemanagementandperformancefeesearnedfromconsolidatedBlackstoneFundswhichhavebeeneliminatedinconsolidation.(b) Representstheaddbackofinvestmentincome,includinggeneralpartnerincome,earnedfromconsolidatedBlackstoneFundswhichhavebeeneliminatedin
consolidation and theinclusion of investment income on non-consolidated Blackstone Funds which in GAAP is recorded as Other Income (Loss) - Net Gains(Losses)fromFundInvestmentActivities.
(c) Representstheeliminationofinter-segmentinterestincomeandtherelatedexpense.(d) RepresentsthetotalconsolidationandeliminationadjustmentsforTotalRevenuesandTotalExpenses,respectively.(e) Representstransaction-basedequitycompensationthatisnotrecordedinthesegments.(f) Representstheaddbackfortheamortizationoftransactionbasedintangibles,whichisnotrecordedinthesegments,andtheeliminationofinter-segment
interestexpense.(g) RepresentsthereversalofFundExpenseswhichareattributabletoconsolidatedBlackstoneFundsandnotacomponentofthesegments.(h) RepresentstheinclusionofOtherIncome(Loss)whichisaconsolidationamountnotrecordedinthesegments.(i) RepresentsthetotalconsolidationandeliminationadjustmentbetweenGAAPandTotalSegments.
(DollarsinThousands) 4Q'15 1Q'16 2Q'16 3Q'16 4Q'16 FY'15 FY'16
Other Operating ExpensesGAAPGeneral,AdministrativeandOther 139,607$ 123,045$ 130,988$ 124,322$ 141,954$ 576,103$ 520,309$InterestExpense 38,878 37,356 36,878 37,278 41,142 144,522 152,654GAAP 178,485$ 160,401$ 167,866$ 161,600$ 183,096$ 720,625$ 672,963$
Consolidation and Elimination Adjustment (f) (23,376) (11,875) (10,612) (10,710) (10,424) (96,268) (43,621)Total Segment 155,109$ 148,526$ 157,254$ 150,890$ 172,672$ 624,357$ 629,342$
Total ExpensesGAAP 556,878 617,710 712,603 773,777 824,484 3,090,875 2,928,574Less: GAAP Fund Expenses (g) (2,654) (5,229) (8,592) (15,128) (23,232) (79,499) (52,181)Consolidation and Elimination Adjustment (d) (82,879) (70,477) (79,879) (71,749) (73,708) (633,240) (295,813)Total Segment 471,345$ 542,004$ 624,132$ 686,900$ 727,544$ 2,378,136$ 2,580,580$
GAAP Income (Loss) Before Provision for Taxes to Total Segment Economic IncomeGAAPRevenuesLessExpenses 340,541 314,644 479,823 657,908 744,885 1,555,677 2,197,260Other Income (h) 100,368 19,142 30,703 61,395 73,510 259,071 184,750IncomeBeforeProvisionforTaxes 440,909 333,786 510,526 719,303 818,395 1,814,748 2,382,010
Consolidation and Elimination Adjustment (i) (35,067) 53,659 30,484 (11,334) 26,465 363,048 99,274Total Segment 405,842$ 387,445$ 541,010$ 707,969$ 844,860$ 2,177,796$ 2,481,284$
Blackstone 29
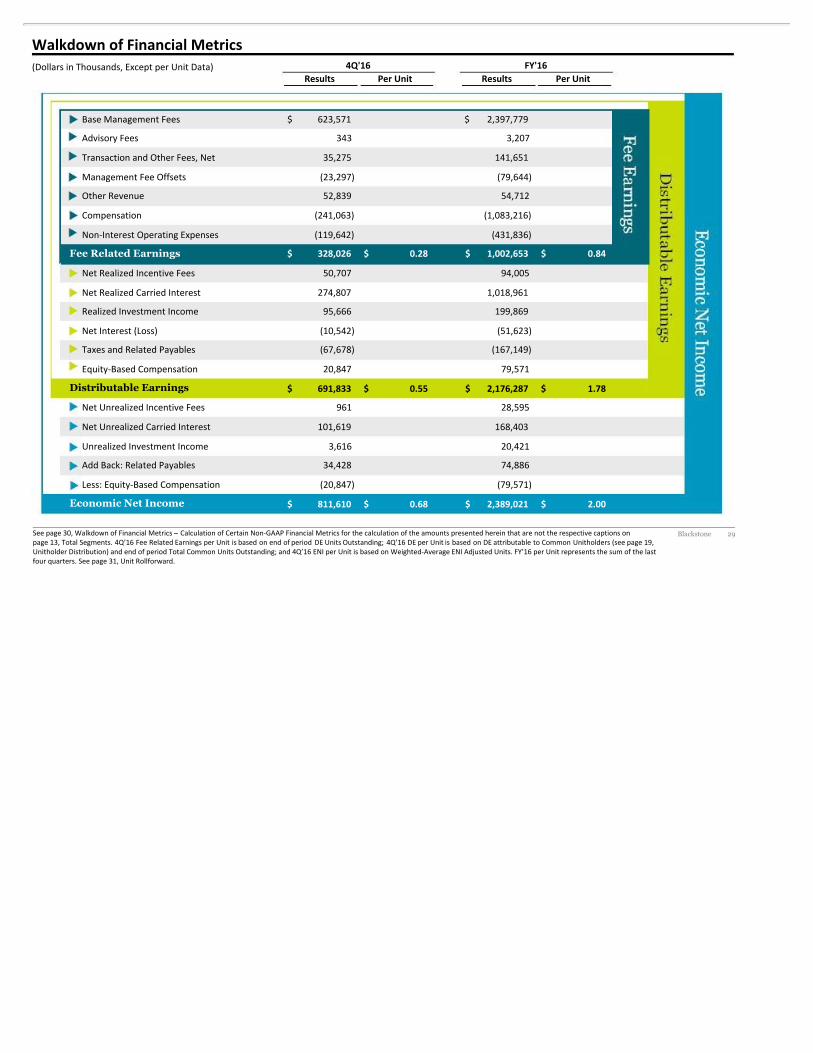
Walkdown of Financial Metrics
Seepage30,WalkdownofFinancialMetrics– CalculationofCertainNon-GAAPFinancialMetricsforthecalculationoftheamountspresentedhereinthatarenottherespectivecaptionsonpage 13, Total Segments. 4Q’16 Fee Related Earnings per Unit is based on end of period DE Units Outstanding; 4Q’16 DE per Unit is based on DE attributable to Common Unitholders (see page 19,UnitholderDistribution)andendofperiodTotalCommonUnitsOutstanding;and4Q’16ENIperUnitisbasedonWeighted-AverageENIAdjustedUnits.FY’16perUnitrepresentsthesumofthelastfourquarters.Seepage31,UnitRollforward.
(DollarsinThousands,ExceptperUnitData) 4Q'16 FY'16Results Per Unit Results Per Unit
BaseManagementFees 623,571$ 2,397,779$
AdvisoryFees 343 3,207
TransactionandOtherFees,Net 35,275 141,651
ManagementFeeOffsets (23,297) (79,644)
OtherRevenue 52,839 54,712
Compensation (241,063) (1,083,216)
Non-InterestOperatingExpenses (119,642) (431,836)
Fee Related Earnings 328,026$ 0.28$ 1,002,653$ 0.84$
NetRealizedIncentiveFees 50,707 94,005
NetRealizedCarriedInterest 274,807 1,018,961
RealizedInvestmentIncome 95,666 199,869
NetInterest(Loss) (10,542) (51,623)
TaxesandRelatedPayables (67,678) (167,149)
Equity-BasedCompensation 20,847 79,571
Distributable Earnings 691,833$ 0.55$ 2,176,287$ 1.78$
NetUnrealizedIncentiveFees 961 28,595
NetUnrealizedCarriedInterest 101,619 168,403
UnrealizedInvestmentIncome 3,616 20,421
AddBack:RelatedPayables 34,428 74,886
Less:Equity-BasedCompensation (20,847) (79,571)
Economic Net Income 811,610$ 0.68$ 2,389,021$ 2.00$
Blackstone 30
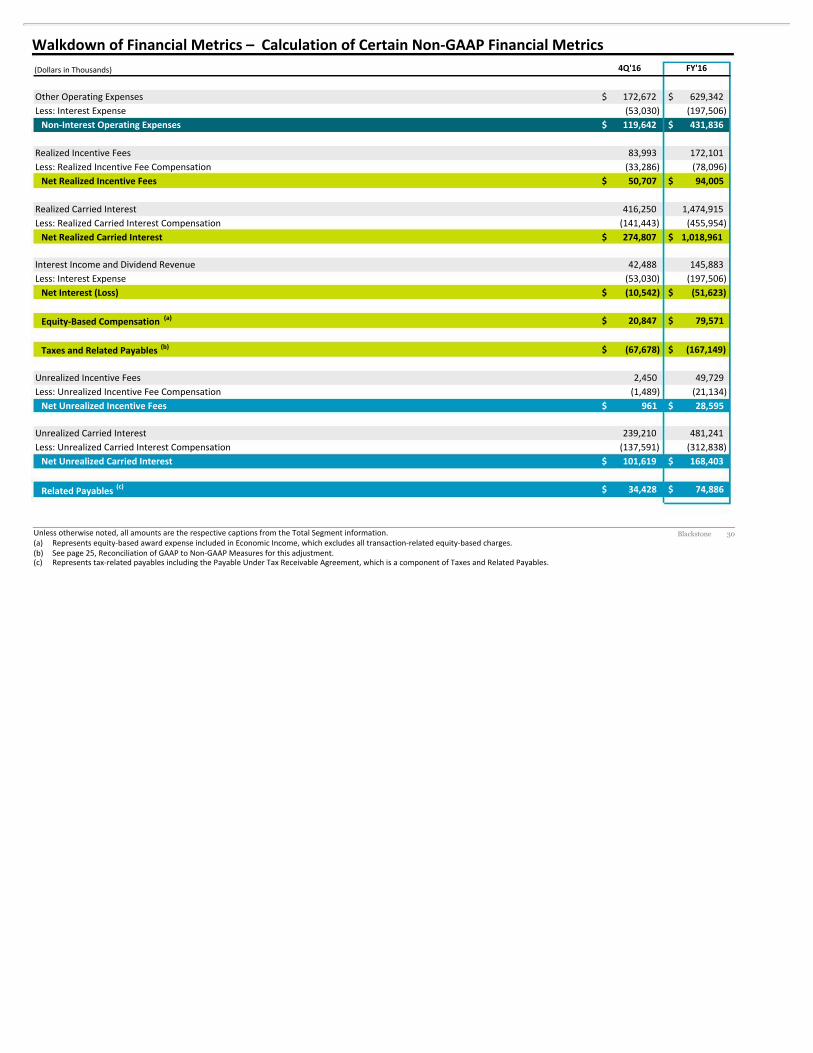
Walkdown of Financial Metrics – Calculation of Certain Non-GAAP Financial Metrics
Unlessotherwisenoted,allamountsaretherespectivecaptionsfromtheTotalSegmentinformation.(a) Representsequity-basedawardexpenseincludedinEconomicIncome,whichexcludesalltransaction-relatedequity-basedcharges.(b) Seepage25,ReconciliationofGAAPtoNon-GAAPMeasuresforthisadjustment.(c) Representstax-relatedpayablesincludingthePayableUnderTaxReceivableAgreement,whichisacomponentofTaxesandRelatedPayables.
(DollarsinThousands) 4Q'16 FY'16
OtherOperatingExpenses 172,672$ 629,342$Less:InterestExpense (53,030) (197,506)
Non-Interest Operating Expenses 119,642$ 431,836$
RealizedIncentiveFees 83,993 172,101Less:RealizedIncentiveFeeCompensation (33,286) (78,096)
Net Realized Incentive Fees 50,707$ 94,005$
RealizedCarriedInterest 416,250 1,474,915Less:RealizedCarriedInterestCompensation (141,443) (455,954)
Net Realized Carried Interest 274,807$ 1,018,961$
InterestIncomeandDividendRevenue 42,488 145,883Less:InterestExpense (53,030) (197,506)
Net Interest (Loss) (10,542)$ (51,623)$
Equity-Based Compensation (a) 20,847$ 79,571$
Taxes and Related Payables (b) (67,678)$ (167,149)$
UnrealizedIncentiveFees 2,450 49,729Less:UnrealizedIncentiveFeeCompensation (1,489) (21,134)
Net Unrealized Incentive Fees 961$ 28,595$
UnrealizedCarriedInterest 239,210 481,241Less:UnrealizedCarriedInterestCompensation (137,591) (312,838)
Net Unrealized Carried Interest 101,619$ 168,403$
Related Payables (c) 34,428$ 74,886$
Blackstone 31
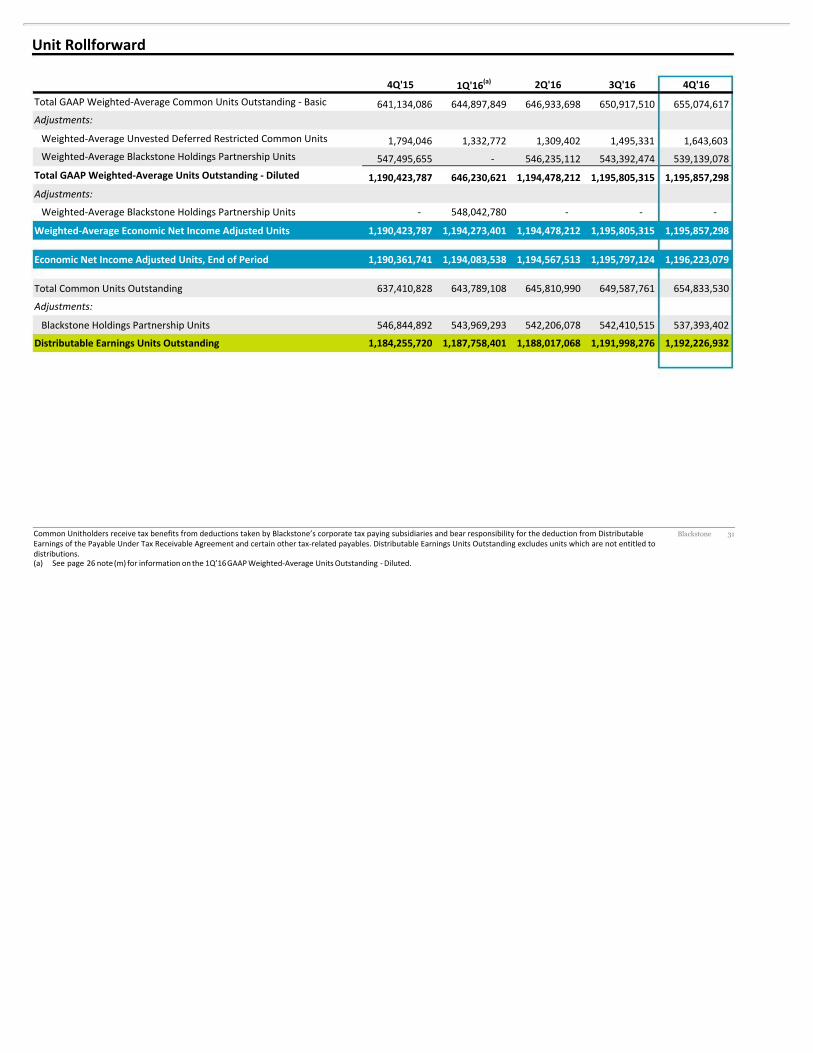
Unit Rollforward
CommonUnitholdersreceivetaxbenefitsfromdeductionstakenbyBlackstone’scorporatetaxpayingsubsidiariesandbearresponsibilityforthedeductionfromDistributableEarningsofthePayableUnderTaxReceivableAgreementandcertainothertax-relatedpayables.DistributableEarningsUnitsOutstandingexcludesunitswhicharenotentitledtodistributions.(a) See page 26 note (m) for information on the 1Q’16GAAPWeighted-Average UnitsOutstanding -Diluted.
4Q'15 1Q'16(a) 2Q'16 3Q'16 4Q'16TotalGAAPWeighted-AverageCommonUnitsOutstanding-Basic 641,134,086 644,897,849 646,933,698 650,917,510 655,074,617Adjustments:
Weighted-AverageUnvestedDeferredRestrictedCommonUnits 1,794,046 1,332,772 1,309,402 1,495,331 1,643,603Weighted-AverageBlackstoneHoldingsPartnershipUnits 547,495,655 - 546,235,112 543,392,474 539,139,078
Total GAAP Weighted-Average Units Outstanding - Diluted 1,190,423,787 646,230,621 1,194,478,212 1,195,805,315 1,195,857,298Adjustments:
Weighted-AverageBlackstoneHoldingsPartnershipUnits - 548,042,780 - - -
Weighted-Average Economic Net Income Adjusted Units 1,190,423,787 1,194,273,401 1,194,478,212 1,195,805,315 1,195,857,298
Economic Net Income Adjusted Units, End of Period 1,190,361,741 1,194,083,538 1,194,567,513 1,195,797,124 1,196,223,079
TotalCommonUnitsOutstanding 637,410,828 643,789,108 645,810,990 649,587,761 654,833,530
Adjustments:
BlackstoneHoldingsPartnershipUnits 546,844,892 543,969,293 542,206,078 542,410,515 537,393,402
Distributable Earnings Units Outstanding 1,184,255,720 1,187,758,401 1,188,017,068 1,191,998,276 1,192,226,932
Blackstone 32
Definitions and Distribution PolicyBlackstone discloses the following financialmeasures thatare calculated andpresented on the basis ofmethodologiesotherthan in accordancewithgenerallyacceptedaccountingprinciplesintheUnitedStatesofAmerica(“non-GAAP”)inthispresentation:• BlackstoneusesEconomicIncome,or“EI”,asakeymeasureofvaluecreation,abenchmarkofitsperformanceandinmakingresourcedeploymentand compensation decisionsacross its four segments. EI represents segmentnet income before taxesexcluding transaction-related charges.Transaction-relatedchargesarisefromBlackstone’sinitialpublicoffering(“IPO”)andlong-termretentionprogramsoutsideofannualdeferredcompensationandothercorporateactions,includingacquisitions.Transaction-relatedchargesincludeequity-basedcompensationcharges,theamortizationofintangibleassetsandcontingentconsiderationassociatedwithacquisitions.EIpresentsrevenuesandexpensesonabasisthatdeconsolidatestheinvestmentfundsBlackstonemanages.
• EconomicNetIncome,or“ENI”,representsEIadjustedtoincludecurrentperiodtaxes.TaxesrepresentthetotalGAAPtaxprovisionadjustedtoincludeonlythecurrenttaxprovision(benefit)calculatedonIncome(Loss)BeforeProvisionforTaxes.
• BlackstoneusesFeeRelatedEarnings,or“FRE”,whichisderivedfromEI,asameasuretohighlightearningsfromoperationsexcluding:(a)theincomerelatedtoperformancefeesandrelatedperformancefeecompensation,(b)incomeearnedfromBlackstone’sinvestmentsintheBlackstoneFundsand(c)netinterestincome(loss).BlackstoneusesFREasameasuretoassesswhetherrecurringrevenuefromitsbusinessesissufficienttoadequatelycoverallofitsoperatingexpensesandgenerateprofits.FREequalscontractualfeerevenuesless(a)compensationexpenses(whichincludesamortizationofnon-IPOandnon-acquisition-relatedequity-basedawards,butexcludesamortizationofIPOandacquisition-relatedequity-basedawards,CarriedInterestandincentivefeecompensation),and(b)non-interestoperatingexpenses.
• DistributableEarnings,or“DE”,whichisderivedfromBlackstone’ssegmentreportedresults,isasupplementalmeasuretoassessperformanceandamountsavailablefordistributionstoBlackstoneunitholders,includingBlackstonepersonnelandotherswhoarelimitedpartnersoftheBlackstoneHoldings partnerships.DEis intended to show the amount of net realized earningswithoutthe effects of the consolidationof the BlackstoneFunds.DE,whichisacomponentofENI,isthesumacrossallsegmentsof:(a)TotalManagementandAdvisoryFees,(b)InterestandDividendRevenue,(c) Other Revenue, (d) Realized PerformanceFees, and (e) Realized InvestmentIncome (Loss); less (a) Compensation,excludingthe expense ofequity-based awards, (b) RealizedPerformanceFee Compensation,(c) Other OperatingExpenses, and (d) Taxes andRelated Payables Under the TaxReceivableAgreement.DEisreconciledtoBlackstone’sConsolidatedStatementofOperations.
• BlackstoneusesAdjustedEarningsBeforeInterest,TaxesandDepreciationandAmortization,or“AdjustedEBITDA”,asasupplementalnon-GAAPmeasurederivedfromsegmentreportedresultsandmaybeusedtoassessitsabilitytoserviceitsborrowings.AdjustedEBITDArepresentsDEplustheadditionof(a)InterestExpense,(b)TaxesandRelatedPayablesIncludingPayableUnderTaxReceivableAgreement,and(c)DepreciationandAmortization.
DistributionPolicy.Blackstone’sintentionistodistributequarterlytocommonunitholdersapproximately85%ofTheBlackstoneGroupL.P.’sshareofDistributableEarnings,subjecttoadjustmentbyamountsdeterminedbyBlackstone’sgeneralpartnertobenecessaryorappropriatetoprovidefortheconductof its business, tomake appropriate investmentsin its business and funds, to comply with applicable law, anyof its debt instruments orotheragreements,ortoprovideforfuturecashrequirementssuchastax-relatedpayments,clawbackobligationsanddistributionstounitholdersforanyensuingquarter.Theamounttobedistributedcouldalsobeadjustedupwardinanyonequarter.AlloftheforegoingissubjecttothequalificationthatthedeclarationandpaymentofanydistributionsareatthesolediscretionofBlackstone’sgeneralpartnerandmaychangeitsdistributionpolicyatanytime,including,withoutlimitation,toeliminatesuchdistributionsentirely.
Blackstone 33
Forward-Looking Statements
Thispresentationmaycontainforward-lookingstatementswithinthemeaningofSection27AoftheSecuritiesActof1933andSection21EoftheSecuritiesExchangeActof1934whichreflectBlackstone’scurrentviewswithrespectto,amongotherthings,Blackstone’soperationsandfinancialperformance.Youcanidentifytheseforward-lookingstatementsbytheuseofwordssuchas“outlook,”“indicator,”“believes,”“expects,”“potential,”“continues,”“may,”“will,”“should,”“seeks,”“approximately,”“predicts,”“intends,”“plans,”“estimates,”“anticipates”orthenegativeversionofthesewordsorothercomparablewords.Suchforward-lookingstatementsaresubjecttovariousrisksanduncertainties.Accordingly,thereareorwillbeimportantfactorsthatcouldcauseactualoutcomesorresultstodiffermateriallyfromthoseindicatedinthesestatements.Blackstonebelievesthesefactorsincludebut arenotlimitedtothosedescribedunderthesectionentitled“RiskFactors”initsAnnualReportonForm10-KforthefiscalyearendedDecember31,2015,assuchfactorsmaybeupdatedfromtimetotimeinitsperiodicfilingswiththeSecuritiesandExchangeCommission,whichareaccessibleontheSEC’swebsiteatwww.sec.gov.Thesefactorsshouldnotbeconstruedasexhaustiveandshouldbereadinconjunctionwiththeothercautionarystatementsthatareincludedinthispresentationandinthefilings.Blackstoneundertakesnoobligationtopubliclyupdateorreviewanyforward-lookingstatement,whetherasaresultofnewinformation,futuredevelopmentsorotherwise.
ThispresentationdoesnotconstituteanofferofanyBlackstoneFund.