the bhlh/pas transcription factor sim1 is a novel obesity gene
TRANSCRIPT

THE bHLH/PAS TRANSCRIPTION FACTOR SIM1 IS A NOVEL OBESITY GENE
APPROVED BY SUPERVISORY COMMITTEE
Andrew R. Zinn, MD, PhD
Carole Mendelson, PhD
Deepak Srivastava, MD
Cai Li, PhD

DEDICATION
I would like to thank my family for all of their support and especially my parents and
brothers: Kristopher and Sean.

THE bHLH/PAS TRANSCRIPTION FACTOR SIM1 IS
A NOVEL OBESITY GENE
by
JIMMY LLOYD HOLDER, JR.
DISSERTATION
Presented to the Faculty of the Graduate School of Biomedical Sciences
The University of Texas Southwestern Medical Center at Dallas
In Partial Fulfillment of the Requirements
For the Degree of
DOCTOR OF PHILOSOPHY
The University of Texas Southwestern Medical Center at Dallas
Dallas, Texas
June, 2005

Copyright
by
Jimmy Lloyd Holder, Jr., 2005
All Rights Reserved

THE bHLH/PAS TRANSCRIPTION FACTOR SIM1 IS A NOVEL OBESITY GENE
Publication No. ___________
JIMMY LLOYD HOLDER, JR.
The University of Texas Southwestern Medical Center at Dallas, 2002.
Supervising Professor: Andrew R. Zinn, M.D., Ph.D. Obesity is epidemic in the United States and other developed countries. Obesity is a
major risk factor for type II diabetes, hypertension, hyperlipidemia and osteoarthritis. I report a unique girl with early-onset obesity (47.5 kg, +9.3 s.d. above mean at age 67
months) and a de novo balanced translocation between chromosomes 1 and 6. She has normal energy expenditure and a voracious appetite. I show that her translocation disrupts a transcription factor gene, SIM1, on chromosome 6q16.2. I also present data that Sim1 haploinsufficiency causes obesity in mice. Animals heterozygous for a Sim1 null allele fed a standard chow diet (4% fat) developed obesity around the time of sexual maturity, were 33-45% heavier than wild-type littermates by 5 months of age, and had increased adiposity by DEXA scans. In contrast, the human subject developed obesity by two years of age, well before puberty. To investigate whether differences in dietary fat consumption might explain this discrepancy in human and mouse phenotypes, I fed mutant mice and wild type littermates a “Westernized” diet (35% fat). Heterozygous Sim1 mice fed this diet became obese prior to 6 weeks of age. The obesity was also more severe, especially in females, who by 8 weeks of

age weighed 72% more than controls compared with 13% on a low fat diet. Heterozygous Sim1 mice maintained on a 4% fat diet ate more than controls over a 5 day period (∆kcals 12-14%), and became even more hyperphagic when acutely challenged with increased dietary fat (∆kcals 46-68% over 5 days). This altered behavior was evident within the first day of exposure to the high fat diet: during this time, heterozygous Sim1 mice failed to significantly change the mass of food consumed, whereas wild-type littermates decreased their food consumption by >15%. These data suggest that Sim1 is critical for the acute and chronic homeostatic response to elevated dietary fat. This data demonstrates that normal Sim1 gene dosage is critical for proper regulation of feeding behavior and body weight regulation.
vi

TABLE OF CONTENTS
Chapter 1: Introduction……………………………………………………………… 1
The growing medical problem of obesity…………………………………… 1
Genetics of obesity…………………..…………………………………….… 3
Hypothalmic control of feeding behavior…………………………………… 6
SIM1……………………………………………………………………….. 11
Chapter 2: Materials and methods…………………………………………………. 13
Clinical studies…………………………………………………………….. 13
Molecular studies………………………………………………………….. 14
Cell culture, Western blotting and reporter assays…………………….…... 17
Generation of knockout mice; genotyping………………………………… 18
Growth and feeding studies……………………………………………….. 18
Wheel running assay……………………………………………………… 19
Dual energy X-ray absorptiometry…………………………………….…. 19
Serum insulin and leptin assays………………………………………….. 19
Chapter 3: SW116: A case of early-onset obesity……………………………….. 21
Results…………………………………………………………………… 23
Clinical studies…………………………………………………………... 23
Molecular studies………………………………………………………... 36
Discussion…………………………………………………………….…. 51
vii
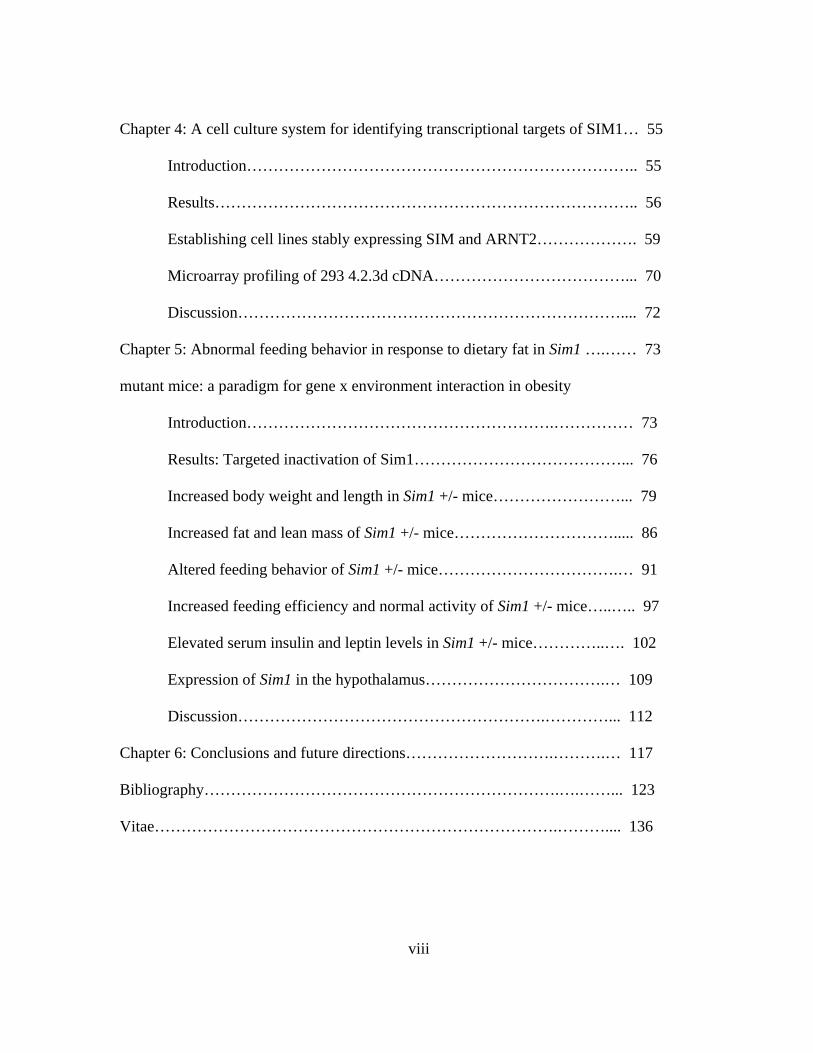
Chapter 4: A cell culture system for identifying transcriptional targets of SIM1… 55
Introduction……………………………………………………………….. 55
Results…………………………………………………………………….. 56
Establishing cell lines stably expressing SIM and ARNT2………………. 59
Microarray profiling of 293 4.2.3d cDNA………………………………... 70
Discussion……………………………………………………………….... 72
Chapter 5: Abnormal feeding behavior in response to dietary fat in Sim1 ….…… 73
mutant mice: a paradigm for gene x environment interaction in obesity
Introduction………………………………………………….…………… 73
Results: Targeted inactivation of Sim1…………………………………... 76
Increased body weight and length in Sim1 +/- mice……………………... 79
Increased fat and lean mass of Sim1 +/- mice…………………………..... 86
Altered feeding behavior of Sim1 +/- mice…………………………….… 91
Increased feeding efficiency and normal activity of Sim1 +/- mice…..….. 97
Elevated serum insulin and leptin levels in Sim1 +/- mice…………..…. 102
Expression of Sim1 in the hypothalamus…………………………….… 109
Discussion………………………………………………….…………... 112
Chapter 6: Conclusions and future directions……………………….……….… 117
Bibliography………………………………………………………….….……... 123
Vitae………………………………………………………………….……….... 136
viii

PRIOR PUBLICATIONS
Holder JL, Habbak RA, Pearlson GD, Aylward EA, Pulsifer M and Warren AC. “Reduced
survival of apolipoprotein E4 homozygotes in Down’s syndrome?” Neuroreport 7 (15-17):
2455-6.
Holder J and Warren AC. “Prevalence of Alzheimer’s disease and Apolipoprotein E allele
frequencies in the Old Order Amish.” Journal of Neuropsychiatry and Clinical Neurosciences
10 (1): 100-2.
Holder JL Jr, Butte NF and Zinn AR. “Profound obesity associated with a balanced
translocation that disrupts the SIM1 gene.” Human Molecular Genetics 9 (1): 101-108.
Holder JL Jr, Zhang L, Kublaoui BM, DiLeone RJ, Oz OK, Bair CH, Lee YH and Zinn AR.
“Sim1 gene dosage modulates the homeostatic feeding response to increased dietary fat.”
American Journal of Physiology: Endocrinology and Metabolism 287 (1): E105-13.
ix

LIST OF FIGURES
Figure 1: Increased prevalence of adult obesity in the United States…………………. 2
Figure 2: SW116 has early-onset obesity……………………………………………. . 24
Figure 3: SW116 has elevated linear growth…………………………………………. 26
Figure 4: SW116 has elevated mass corrected for height…………………………….. 28
Figure 5: Monogenic Obesities……………………………………………………….. 30
Figure 6: SW116 has normal energy expenditure………………………………….…. 36
Figure 7: Cytogenetic abnormalities encompassing 6q16 associated with obesity…... 37
Figure 8: Chromosome 6 physical map of BACs near the translocation breakpoint.... 39
Figure 9: A chromosome 6 BAC crosses SW116’s translocation breakpoint……...... 41
Figure 10: Chromosome 1 physical map of BACs near the translocation breakpoint.. 44
Figure 11: Cloning SW116’s translocation breakpoint……………………………… 46
Figure 12: Sequence alignment……………………………………………………… 48
Figure 13: SIM1 gene………………………………………………………….…….. 49
Figure 14: SIM1 acts as a transcriptional activator…………………………………. 57
Figure 15: Method for SIM inducible cell line……………………………………… 60
Figure 16: 293 pVgRXR inducible cell lines……………………………………….. 62
Figure 17: Western blot of ARNT2 in stably transfected 293 cell lines……………. 64
Figure 18: Inducible expression of SIM1HA in 293 4.2 cells……………………… 65
Figure 19: Inducible expression of dSIM in 293 4.2 cells………………………….. 68
Figure 20: Sim1 heterozygous null mice……………………………………………. 77
x

Figure 21: Male Sim1 deficient mice are obese……………………………………… 80
Figure 22: Female Sim1 deficient mice are obese…………………………………… 82
Figure 23: Sim1 deficient mice are long………………………………….………….. 84
Figure 24: Sim1 deficient mice have elevated fat mass…………………..………….. 86
Figure 25: Sim1 deficient mice have greater lean mass and percentage of body fat... 88
Figure 26: Bone mineral density of Sim1 deficient mice is normal……………….... 90
Figure 27: Male Sim1 deficient mice are hyperphagic……………………….……... 93
Figure 28: Female Sim1 deficient mice are hyperphagic…………………………… 95
Figure 29: Sim1 deficient mice have altered feeding efficiency……………………. 98
Figure 30: Activity of Sim1 deficient mice……………………………………...… 100
Figure 31: Serum glucose in Sim1 deficient mice………………………………..... 103
Figure 32: Serum insulin is elevated in Sim1 deficient mice……………..……….. 105
Figure 33: Serum leptin is elevated in Sim1 deficient mice……………….……… 107
Figure 34: Sim1 expression in the adult mouse DMH and LHA………….……… 110
xi
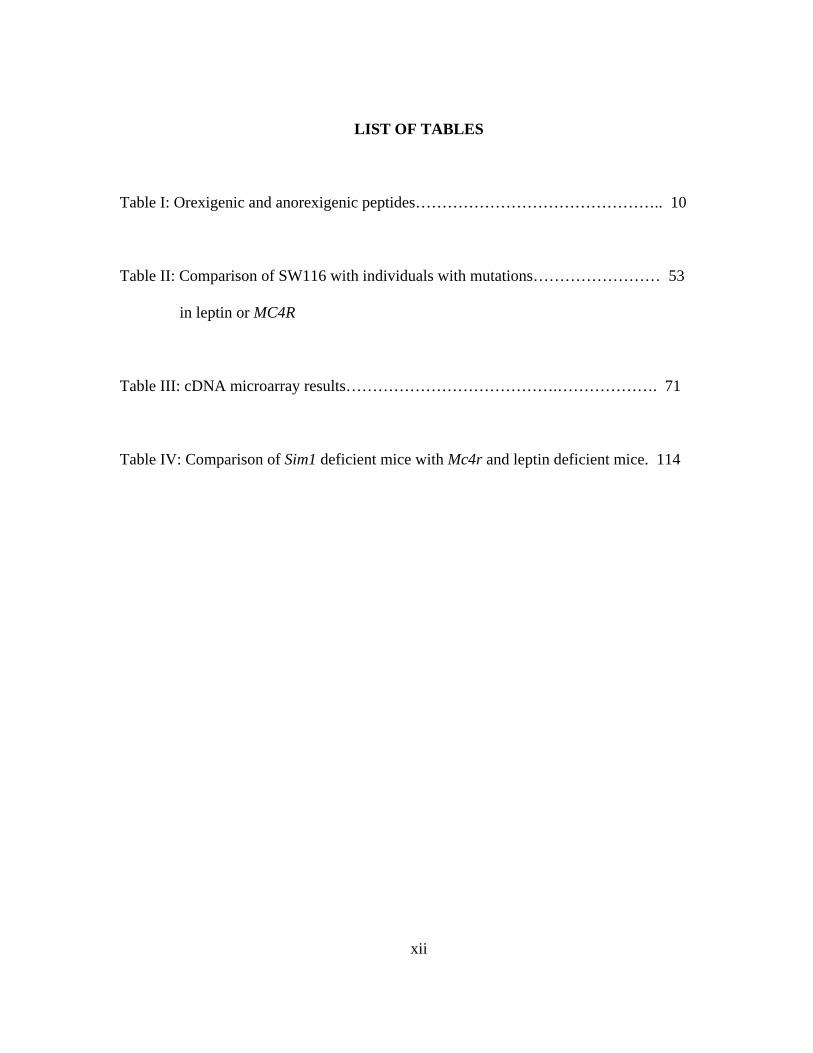
LIST OF TABLES
Table I: Orexigenic and anorexigenic peptides……………………………………….. 10
Table II: Comparison of SW116 with individuals with mutations…………………… 53
in leptin or MC4R
Table III: cDNA microarray results………………………………….………………. 71
Table IV: Comparison of Sim1 deficient mice with Mc4r and leptin deficient mice. 114
xii

Chapter 1
Introduction
The Growing Medical Problem of Obesity
The prevalence of obesity is rising in the United States and other developed countries.
Recent analysis of the National Health and Nutrition Examination Survey (NHANES IV)
demonstrates that obesity of adults nearly doubled from 1976 to 1999 (Fig. 1) (Kopelman
2000). Even more alarming is the recent rise in obesity and overweight in children in the
United States. According to the NHANES data, the percentage of overweight children six to
eleven years old jumped from four percent in 1965 to thirteen percent in 1999. This is more
than a three-fold increase in less than half of a century. This phenomenon is not limited to the
United States. One extreme example is in urban Samoa where it is estimated that 75% of
adult women and 60% of adult men are clinically obese (Kopelman 2000). Less extreme
examples include most western European countries. From the World Health Organization’s
Monitoring trends and determinants of cardiovascular disease (MONICA) study, over fifty
percent of the European population is either overweight or obese (Kopelman 2000).
1

Adult Obesity
NHANES II (19
76-19
80)
NHANES III (1
988-1
994)
NHANES IV (1
999)
0
25
50
75ObeseOverweight or Obese
perc
enta
ge
1523
27
47
5661
Figure 1 Increased prevalence of adult obesity in the United States
A twenty percent increase in body weight is associated with increased incidence of
non-insulin dependent diabetes mellitus (NIDDM), hypertension, osteoarthritis, and
hyperlipidemia. Obesity is in fact the number one predisposing factor to NIDDM. The
mechanism of this predisposition is only partially understood but is thought to involve
elevated serum free fatty acids (FFAs) which can prevent uptake of insulin by the liver and
cause a transient increase in production of insulin by the pancreas. This rise in serum insulin
results in down-regulation of insulin receptors in peripheral tissues such as muscle and
insulin resistance. Either through depletion of pancreatic beta cells or a direct toxic effect of
FFAs, insulin levels are eventually unable to compensate for insulin resistance in obese
individuals resulting in hyperglycemia and NIDDM.
2

Obesity is also a major predisposing factor for cardiovascular disease (Kopelman
2000). The Framingham Heart Study reported that adults less than fifty years old there is a
2.4-fold increased risk of heart failure in women and a 2.0-fold increased risk of heart failure
in men who are obese. Obesity is therefore a risk factor for two of the most common and
devastating diseases, NIDDM and cardiovascular disease. With the dramatic increase in
overweight and obesity of the past several decades, understanding the molecular mechanisms
of weight homeostasis and using the information for rational drug design is of paramount
medical importance.
Genetics of Obesity
Although the problem of obesity has been on the rise for the at least the past fifty
years, some of the genetic determinants of feeding behavior and weight regulation have only
recently been identified. Work determining the endocrine control of feeding behavior began
with classic parabiotic experiments with mice carrying the spontaneous mutant alleles obese
(ob/ob) and diabetes (db/db). Both mutant mice display a syndrome of early-onset severe
obesity, hyperphagia, stunted growth, infertility and diabetes. In the first of these
experiments, the circulatory systems of ob/ob and wild-type mice were connected (Coleman
and Hummel 1969; Coleman 1973). This resulted in complete reversal of the phenotype of
ob/ob mice. They became normophagic, normoglycemic and lost weight. This suggested that
a circulating factor was absent in ob/ob mice and could be replaced in the parabiosis
experiment. When a similar parabiosis experiment was performed with db/db mice, no
3

change in phenotype was observed in the mutant mice. In this experiment, however, the wild-
type mice became anorexic. It was hypothesized that db/db mice were resistant to a
circulating factor that controlled food intake and parabiosed wild-type mice became anorexic
in response to elevated circulating levels of this factor.
In 1994, the gene mutated in the obese allele was determined to be leptin (Zhang,
Proenca et al. 1994). Leptin is a circulating polypeptide secreted by adipocytes in proportion
to their fat content. A year later, the gene mutated in the diabetes allele was identified as the
leptin receptor (Tartaglia, Dembski et al. 1995). This confirmed the predicted function of
these genes by the parabiotic experiments.
Another classic spontaneous mutant mouse model of obesity, Ay, has elucidated
another molecular pathway critical for weight regulation. Ay mice are hyperphagic, obese and
have a yellow coat color (Miller, Duhl et al. 1993). The mutation in these mice has been
identified as a chromosomal inversion causing the promoter of a ubiquitously expressed gene
to be place upstream of the Agouti gene which is normally expressed only in the skin and acts
as an antagonist for the melanocortin 1 receptor. In the Ay mouse, Agouti is ubiquitously
over-expressed and antagonizes two homologues of the melanocortin 1 receptor in the brain,
the melanocortin 3 and 4 receptors (Mc3r and Mc4r). A role for both of these receptors has
been confirmed in mice deficient for these receptors by homologous recombination to
generate null alleles in mice (Huszar, Lynch et al. 1997; Chen, Marsh et al. 2000). Mc4r
deficient mice largely recapitulate the Ay obesity phenotype: they are hyperphagic, obese and
hypometabolic. Mc3r deficient mice have a more subtle phentoype: only the male deficient
mice become slightly larger than wild-type mice at twenty-four weeks of age. Mc3r deficient
4

mice, however, are significantly hypometabolic and have elevated fat mass with depressed
lean mass.
One last spontaneous mouse model of obesity, tubby, revealed a new type of obesity
gene. The gene mutated in the tubby allele was identified in 1996 (Kleyn, Fan et al. 1996).
Despite isolation and complete sequencing of the tubby gene, the molecular function of tubby
was elusive as its amino acid sequence was not significantly similar to any protein of known
function. A breakthrough in the understanding of the potential function of tubby came with
its crystallization and elucidation of its structure (Boggon, Shan et al. 1999). Tubby and its
homologues have a conserved domain at the carboxy-terminus known as the tubby-domain.
The tubby-domain is able to bind double stranded DNA while the amino-terminus can
activate transcription. When tubby is transiently transfected into cells, it is primarily
localized to the nucleus. Combined, these data suggest that tubby is a transcription factor
critical for proper feeding behavior and weight regulation, and feeding regulation in the
hypothalamus requires factors beyond neuropeptides and neuropeptide receptors.
While cloning these spontaneous mouse mutations has significantly improved our
understanding of the molecular mechanisms of weight regulation, scanning large numbers of
obese individuals have revealed few mutations in the human orthologues of these genes.
Only rare mutations in inbred kindreds have been identified in leptin (Montague, Farooqi et
al. 1997) and leptin receptor (Clement, Vaisse et al. 1998). Mutations in MC4R appear to be
more common in obese children (Farooqi, Yeo et al. 2000) than leptin or its receptor but still
probably only accounts for 2-4% of pediatric obesity.
5

Many groups have attempted to map quantitative trait loci in human with respect to
obesity related phenotype such as body mass index (BMI), serum leptin levels or waist
circumference. Through these studies, only five loci with significant linkage have been
identified, and of these, only one at chromosome 2p21 has been confirmed in an independent
population (Rankinen, Perusse et al. 2002). Although the gene responsible for this linkage
has not been identified, proopiomelanocortin (POMC) is located within the linked region and
is considered an excellent candidate gene. POMC encodes a precursor protein for several
neuropeptides including α-MSH which is a natural agonistic ligand for MC3R and MC4R.
Indeed, there are two reports of humans with null mutations in POMC associated with
obesity (Krude, Biebermann et al. 1998; Krude and Gruters 2000) and mice deficient for
Pomc are obese (Yaswen, Diehl et al. 1999).
Classic approaches for identifying genes responsible for genetic susceptibility to
obesity in humans as discussed above have not yielded large numbers of new candidate genes
associated with obesity. Novel approaches to this problem, such as discussed in this work,
could prove a fruitful approach for identifying new obesity genes.
Hypothalamic Control of Feeding Behavior
The role of the hypothalamus in feeding behavior was first established through classic
lesion and stimulation experiments performed in 1940 (Elmquist, Elias et al. 1999). In the
first of these experiments, a medial aspect of the hypothalamus, encompassing portions of the
ventral medial hypothalamus (VMH) and arcuate nucleus of rats was lesioned. This resulted
in a syndrome of obesity, hyperphagia and hypometabolism. In a separate set of experiments,
6

a more lateral aspect of the hypothalami of rats, encompassing the lateral hypothalamic area
(LHA), was lesioned. This resulted in aphagia and weight loss often so severe that the rats
had to be force fed in order to survive. It was also demonstrated that electrical stimulation of
the VMH caused rats to reduce their food intake while stimulation of the LHA caused
hyperphagia. This led to the “dual-center” hypothesis that an area encompassing the VMH
acts as a satiety center and that the LHA acts as a hunger center.
The dual-center hypothesis has been modified more recently. It was demonstrated that
more precise lesions limited to the paraventricular nucleus of the hypothalamus (PVH) also
leads to obesity and hyperphagia although little effect was seen with regard to metabolic rate
(Weingarten, Chang et al. 1985). The PVH has outputs to the autonomic nervous system and
particularly to the preganglionic neurons of the gastrointestinal tract, suggesting a possible
role of the PVH in satiety through changes in gastric motility and gastric secretion.
A molecular understanding of the neurobiology of feeding behavior did not begin
until the identification of leptin as the gene mutated in the ob/ob mouse and its receptor as
the gene mutated in the db/db mouse. As previously discussed, leptin is secreted by the
adipocytes in relation to their triglyceride content. The leptin receptor is expressed
ubiquitously, and there are several isoforms due to transcriptional splice variants. One of
these variants dubbed the long form or Rb form has a more tightly regulated expression
pattern. Within the CNS, the long form is most highly expressed in the hypothalamus
(Mercer, Hoggard et al. 1996). The long form of the leptin receptor is the only isoform with
an intracellular domain that has a signaling capacity. Leptin has clear molecular effects
7
within the arcuate and other nuclei of the hypothalamus. ICV injection of leptin causes Fos
induction within the arcuate as well as the VMH, Dorsomedial hypothalamus (DMH) and
PVH (Elmquist, Ahima et al. 1997). Fos is an immediate-early gene whose presence in
neurons is thought to signal elevated neuronal activity. Although the long form of the
receptor has been reported in regions of the hypothalamus outside of the arcuate, it is
believed that the increase in Fos immunoreactivity in the PVH, VMH and DMH is due to
signaling from the arcuate.
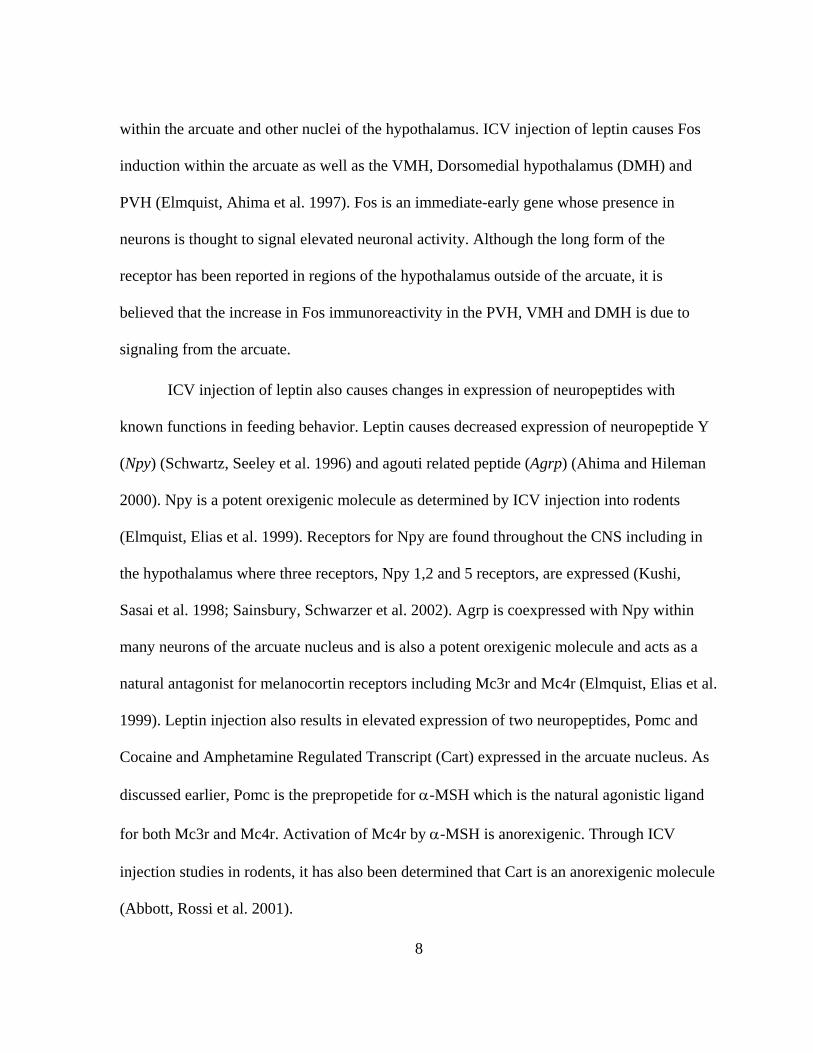
ICV injection of leptin also causes changes in expression of neuropeptides with
known functions in feeding behavior. Leptin causes decreased expression of neuropeptide Y
(Npy) (Schwartz, Seeley et al. 1996) and agouti related peptide (Agrp) (Ahima and Hileman
2000). Npy is a potent orexigenic molecule as determined by ICV injection into rodents
(Elmquist, Elias et al. 1999). Receptors for Npy are found throughout the CNS including in
the hypothalamus where three receptors, Npy 1,2 and 5 receptors, are expressed (Kushi,
Sasai et al. 1998; Sainsbury, Schwarzer et al. 2002). Agrp is coexpressed with Npy within
many neurons of the arcuate nucleus and is also a potent orexigenic molecule and acts as a
natural antagonist for melanocortin receptors including Mc3r and Mc4r (Elmquist, Elias et al.
1999). Leptin injection also results in elevated expression of two neuropeptides, Pomc and
Cocaine and Amphetamine Regulated Transcript (Cart) expressed in the arcuate nucleus. As
discussed earlier, Pomc is the prepropetide for α-MSH which is the natural agonistic ligand
for both Mc3r and Mc4r. Activation of Mc4r by α-MSH is anorexigenic. Through ICV
injection studies in rodents, it has also been determined that Cart is an anorexigenic molecule
(Abbott, Rossi et al. 2001).
8

Combined, these pharmacologic and molecular studies suggest a pathway from the
periphery through the hypothalamus and back to the periphery. Elevated food consumption
causes elevated fat storage and thus elevated leptin secretion from adipocytes. Leptin
activates neurons of the arcuate nucleus depressing expression of orexigenic peptides Npy
and Agrp and elevating expression of Pomc and Cart. This has a net effect of elevated
activity of Mc3r and Mc4r and less activation of Npy receptors. The result is that food intake
is perturbed, possibly through action on gastric motility and gastric acid secretion via PVH
control of the autonomic nervous system.
Unfortunately, the above model greatly simplifies the complexity of the
hypothalamus. It largely ignores the LHA which is known to be critical through lesioning
experiments discussed above. Melanin concentrating hormone (Mch) is produced by neurons
of the LHA and by ICV experiments is known to be an orexigenic neuropeptide (Qu, Ludwig
et al. 1996). Mice deficient for Mch are hypophagic and lean (Shimada, Tritos et al. 1998)
while mice that transgenically overexpress Mch develop obesity (Ludwig, Tritos et al. 2001).
These experiments suggest a critical role for Mch in proper weight balance. Where Mch fits
in the above model however is not clear. Leptin deficient mice have strong induction of Mch
(Qu, Ludwig et al. 1996) and there are leptin receptors in the LHA (Fei, Okano et al. 1997).
But activation of Mch production could be indirect as there are Mc4rs in the LHA (Mountjoy,
Mortrud et al. 1994) and the arcuate does innervate the LHA. A comprehensive list of
orexigenic and anorexigenic neuropeptides and their expression patterns are listed in Table I.
9
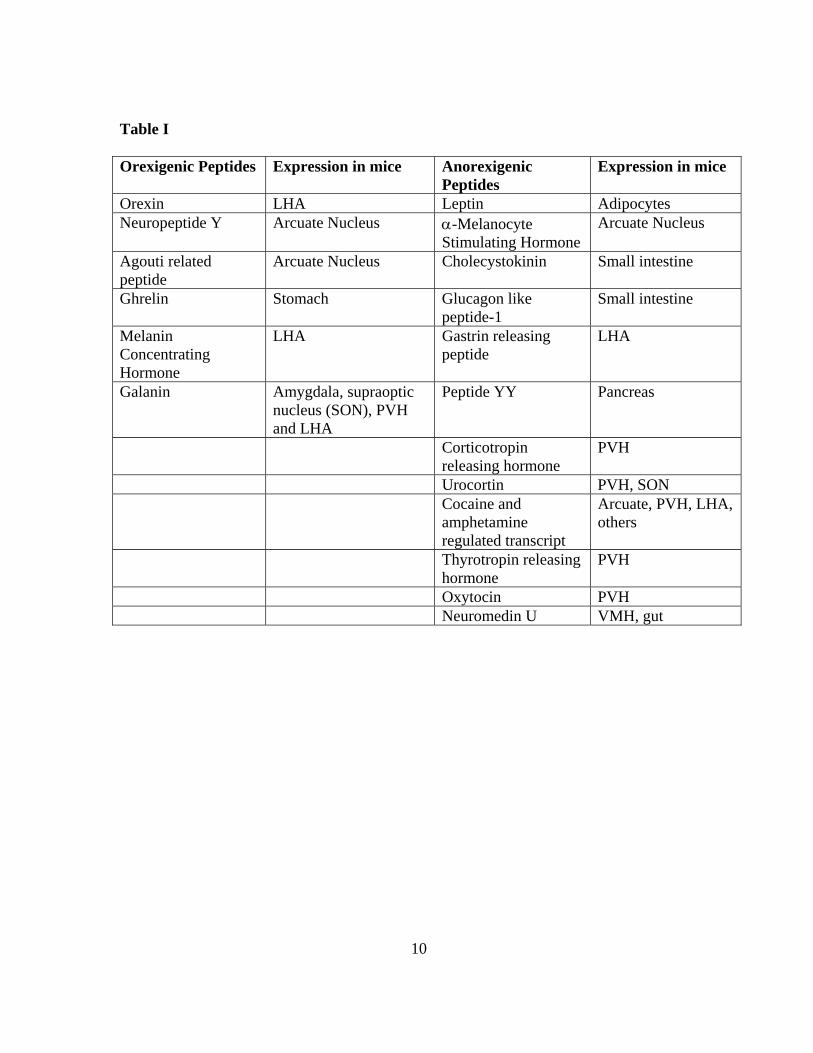
Table I
Orexigenic Peptides Expression in mice Anorexigenic Peptides
Expression in mice
Orexin LHA Leptin Adipocytes Neuropeptide Y Arcuate Nucleus α-Melanocyte
Stimulating Hormone Arcuate Nucleus
Agouti related peptide
Arcuate Nucleus Cholecystokinin Small intestine
Ghrelin Stomach Glucagon like peptide-1
Small intestine
Melanin Concentrating Hormone
LHA Gastrin releasing peptide
LHA
Galanin Amygdala, supraoptic nucleus (SON), PVH and LHA
Peptide YY Pancreas
Corticotropin releasing hormone
PVH
Urocortin PVH, SON Cocaine and
amphetamine regulated transcript
Arcuate, PVH, LHA, others
Thyrotropin releasing hormone
PVH
Oxytocin PVH Neuromedin U VMH, gut
10

SIM1
SIM1 is a mammalian homolog of the Drosophila transcription factor Single-minded, a
prototypical member of the bHLH-PAS (basic Helix-Loop-Helix + Period, Aryl hydrocarbon
receptor, Single-minded) family of proteins. Homozygous loss of function mutations in
Drosophila Single-minded result in the failure of formation of midline central nervous
system structures (Thomas, Crews et al. 1988). Two mouse genes, Sim1 and Sim2, were
cloned by nucleotide sequence homology (Fan, Kuwana et al. 1996). Both homologs are also
present in humans, and the predicted mouse and human SIM1 proteins show 96% amino acid
identity (Chrast, Scott et al. 1997).
Dimerization of bHLH-PAS proteins with other bHLH-PAS proteins such as ARNT (aryl
hydrocarbon receptor nuclear translocator) or ARNT2 is necessary for their function (Probst,
Fan et al. 1997). Specificity of dimerization is mediated at least in part through the PAS
domains (Zelzer, Wappner et al. 1997).
By Northern blot analysis, mouse Sim1 is expressed in adult kidney (Ema, Morita et al.
1996; Fan, Kuwana et al. 1996). Whole mount in situ hybridization of embryonic day 16.5
mouse embryos revealed expression restricted to the kidney tubules, spinal cord, and parts of
the midbrain and forebrain. Particularly interesting is Sim1’s expression in anterior
hypothalamic nuclei of the forebrain. Michaud and Fan determined that Sim1 is highly
expressed in the supraoptic, paraventricular and anterior periventricular (aPV) nuclei of the
hypothalamus in newborn mice (Michaud, Rosenquist et al. 1998). Both the SON and PVH
have neuroendocrine functions. The PVH produces corticotropin releasing factor (CRF) and
thyrotropin releasing hormone (TRH) while both the PVH and SON produce oxytocin and
11

arginine vasopressin (AVP). The aPV produces somatostatin which also impinges on the
pituitary. Further expression studies have been performed and will be presented in Chapter 5.
Targeted inactivation of Sim1 confirmed its critical role in development of
neuroendocrine lineages in the hypothalamus (Michaud, Rosenquist et al. 1998). In mice
lacking Sim1, the SON and PVH are hypocellular and lack at least five types of secretory
neurons (identified by the lack of expression of oxytocin, vasopressin, thyrotropin-releasing
hormone, corticotropin-releasing hormone, and somatostatin) due to failure of terminal
neuronal differentiation. These animals die shortly after birth, presumably due to multiple
hypothalamic-pituitary axis (HPA) deficits. There is no discernable phenotype in other
tissues. No growth abnormality in heterozygotes was reported, but this does not preclude a
human SIM1 heterozyogous phenotype, as there are examples of other genes that are
haploinsufficient in humans but not in laboratory mice, e.g. endothelin B receptor (Hosoda,
Hammer et al. 1994; Puffenberger, Hosoda et al. 1994) and Sonic hedgehog (Roessler,
Belloni et al. 1996). Identification of a human with a SIM1 mutation and her phenotype will
be discussed in Chapter 3, and detailed studies of Sim1 heterozygous mice are presented in
Chapter 5.
12

Chapter 2
Materials and Methods
Clinical studies
Studies were approved by the Institutional Review Boards at UT Southwestern Medical
School and Baylor College of Medicine, and informed consent was obtained for all studies.
Body weight was measured with a digital balance and height was measured with a
stadiometer. Skinfold and circumference measurements were taken at various sites of the
body. Dual-energy x-ray absorptiometry (DXA, Hologic 4500A, Madison, WI) was used to
measure fat mass, fat-free mass, and total body bone mineral content.
A three-day food intake record was kept by the child’s parents, after instruction by a
registered dietitian. The food intake records were converted to nutrient intakes (energy,
protein, fat and carbohydrate) using the Minnesota Nutrition Data System.
Energy expenditure was measured in a metabolic research unit by calorimetry or in the
free-living state by the doubly labeled water method.
Calorimetry. Energy expenditure was measured for 24 hr in a room respiration
calorimeter. The operation and calibration of the calorimeters have been described previously
in detail (Moon, Vohra et al. 1995). Energy expenditure was computed at 1-min intervals
from O2 consumption and CO2 production and used to calculate 24-hr total energy
expenditure, basal metabolic rate, sleeping metabolic rate, and respiratory quotient.
13

Doubly labeled water. Total energy expenditure over a 14 day period was calculated from
the fractional turnover rates of 2H and 18
O following oral ingestion of 100 mg/kg H2O and
125 mg/kg 18
O as water. Isotope dilution spaces were used to compute total body water.
Baseline urine samples were collected. Subsequently, one daily urine sample was collected at
home for the next 14 days. The 2H and
18O abundances of the urine samples were measured
by gas-isotope-ratio mass spectrometry. Carbon dioxide production (VCO2) was calculated
from the dilution spaces and fractional turnover rates of 2H and
18O using the multipoint
slope-intercept method. Fractionated insensible water losses were calculated from ventilatory
volume and body surface area, both expressed as functions of CO2 production. Total energy
expenditure was calculated using the Weir equation.
Molecular studies
Epstein-Barr virus-immortalized cell lines were generated from SW116 and her parents by
standard methods. The balanced translocation was verified by two-color fluorescent in situ
hybridization (FISH) as previously described, using whole chromosome paints for
chromosomes 1 and 6. A somatic cell hybrid retaining the der(1) chromosome was
constructed by fusing the patient’s lymphoblastoid cells to thymidine kinase-deficient
Chinese hamster cells (Mohandas, Sparkes et al. 1979) using polyethylene glycol 4000 (Life
Technologies, Rockville, MD). Colonies were selected in the presence of hypoxanthine-
aminopterin-thymidine. After >10 serial passages, DNA was extracted from clones and tested
by PCR for various chromosome 1 and 6 STS markers.
14

BAC clones were isolated by PCR screening pooled DNAs from Research Genetics
(Huntsville, AL). YAC clone y852C9 was obtained from a local copy of the CEPH library.
YAC clone yA35F11 was isolated by PCR screening pooled DNAs from the Washington
University library. YACs and BACs were used for FISH as previously described (Guillen,
Lowichik et al. 1997). PAC clones were isolated from an arrayed library by filter
hybridization. BAC and PAC ends were sequenced using either a Thermo Sequenase cycle
sequencing kit (Amersham Pharmacia Biotech, Uppsala, Sweden) or an ABI PRISM 310
automated sequencer (Perkin Elmer Applied Biosystems, Foster City, CA) according to the
manufacturers’ instructions.
Exon trapping experiments was performed using BAC clones b261L4 and b219G7 as
described (Inoue, Hess et al. 1999). PCR and Southern blotting were performed using
standard protocols. Genomic DNA from SW116 or her parents was digested with XbaI and
hybridized with a KpnI/XbaI fragment from chromosome 1 (GenBank AL049861, nt. 83014-
85386). After exposure to a phosphorimager screen, the filter was stripped and reprobed with
a HindIII fragment from chromosome 6 (GenBank Z86062, nt. 54268-54318). Primer pairs
GACCCCTTCACTCTGCTGTAACC and TCGCCGAGCCCTGTGGAGAC or
CATCTTTTGTCTCCCCTCCTGAAC and CAAAAGGGTACTCTAGCCGACTCC were
used to PCR-amplify der(6) or der(1) junction sequences, respectively. Products were
directly sequenced using an ABI 310 sequencer. SSCP was performed using MDE gel matrix
(FMC Bioproducts, Rockland, ME) according to the manufacturer’s instructions. Primers
used to amplify SIM1 exons were:
15

CTGGGAACACCACTCTCATTTTGA and
AGAAGAAAGGGGGAACAAGACACA (exon 1),
TCAGACCCTCAAAGCTTATGTGTT and
CAGGTCCGGGTTCAGTGG (exon 2),
GCCCCCTACCCCTGCTTCC and
TGGCTTCATCTTCGTGGTA (exon 3),
GGGGAAAAACCACAAGCGGACTGC and
CCACGGCGACGGCGACATC (exon 4),
CTTGCTTCCCGCCTCCTCTGACTC and
AGCTTCCCTTCGTTCCTCTC (exon 5),
GCCGCCCTCAGGCTAGGA and
TGTGGCTGAGTCTCCCTCCCTATC (exon 6),
CAGCGGATGCGCCAAGGTTG and
TCCTGCAGGGATTGCTCTC (exon 7),
GGGGTGGGTGAAGGGGTCTCA and
CAGGCAGGCTGGTTCACC (exon 8),
AAAAAGAAAGTTGCAAAACAG and
ATGGTGGCTGATTAAGGGCTTTGT (exon 9),
CAATGAGACCTTAAGGGTGCTTGTAG and
TGGAGTTCGGGAACCCTTTCAC (exon 10),
ACATCATGTGAGCCTGTTTCAAATA and
CATAGTAAATGCTGGTAATGGGGTAT (exon 11).
16

The exon 10 and 11 products were digested with HhaI or MnlI respectively prior to SSCP.
Cell Culture, Western blotting and Reporter assays
All cell culture transfections were performed using Lipofectamine Plus (Invitrogen,
Carlsbad, CA) according to manufacturers instructions. Western blotting was performed
using standard protocols. (Sambrook J, Fritsch EF and Maniatis T: 1989)
The anti-ARNT2 antibody was purchased from a commercial source (Santa Cruz
Biotechnology, Santa Cruz, CA) as was the anti-HA (Babco, Richmond, CA) and anti-V5
(Invitrogen) antibodies. Goat anti-mouse and goat anti-rabbit secondary antibodies
conjugated to horse radish peroxidase (HRP) were also commercially produced (Bio-Rad,
Hercules, CA). Presence of HRP was detected using the ECL Plus kit (Amersham Pharmacia,
Buckinghamshire, UK).
The pGL3/6XCME plasmid was a generous gift of Stephen Crews (University of North
Carolina) as was the dSIM cDNA. The Sim1HA and ARNT2 expression plasmids were gifts
from Chen-Ming Fan (Carnegie Institute, Baltimore, MD). The ecdysone inducible
expression plasmids (pVgRXR, pIND and pIND/LacZ) were commercially purchased
(Invitrogen).
The Luciferase assay was performed according to manufacturers instructions (Promega,
Madison, WI), as was the beta-galactosidase assay (Invitrogen).
17

Generation of knockout mice; genotyping
Mice heterozygous for a Sim1 null allele were generated by Ying-Hue Lee (Sinica
Academy, Taiwan) using standard techniques. The targeted allele contained three lox P sites,
one lox P site was within the 5’ UTR of exon 2 of Sim1 and two flanked a PGK-Neo cassette
within intron two. Mice heterozygous for this allele were mated to transgenic mice with the
Cre recombinase under transcriptional control of the EIIa promoter (Jackson Laboratories).
This resulted in mice carrying an allele with a single lox P site and the coding region of exon
2 deleted constituting a null allele.
Genotyping was routinely performed by PCR using primers
5’-TTTCTGTGCTGCTGGGGTAGGTTT-3’,
5’-CATTCGTGTCTTCCCGGAGCAAACTTC-3’ and
5’-CGAGGAATTCCGATCATATTCAAT-3’
under standard conditions. The null allele resulted in a product of 160 bp and the wild-type
allele generated a product of 377 bp.
Growth and feeding studies
Mice were kept on a 12 hour light/dark cycle, lights on at 6:00am. Animals of each
gender were group-housed for measurements of length and body weight and individually
caged for at least 5 days prior to measurements of food intake. Nose to anus length was
determined at necropsy.
Mice were either fed a low fat chow diet (LF) (Teklad diets, Madison, WI) that is 2.94
kcal/g with 46.8% available carbohydrate, 4.0% available fat and 24.0% available protein or a
18

high fat diet (HF) (Research Diets, New Brunswick, NJ) that is 5.24 kcal/g with 26.3%
available carbohydrate, 34.9% available fat and 26.2% available protein. Feeding efficiency
was calculated by dividing the change in mass (mg) by the food intake (kcal) for a seven day
period on both the HF and LF chow.
Wheel Running Assay
Mice were housed individual for at least seven days prior to data collection. Wheel turns
were measured every five minutes and collected for five days on both the LF and HF chow.
Each revolution was counted by magnetic switch closures with magnets placed on the
revolving wheel. The data acquisition system was by Data Systems International.
Dual energy X-Ray absorptiometry (DEXA)
Animals of six months of age were anesthetized with a mixture of ketamine, xylazine,
and acepromazine. Body fat content and bone mineral density were measured using a Lunar
PIXImus densitometer calibrated with an aluminum/lucite phantom as described by the
manufacturer (GE Medical Systems, Madison, WI).
Serum insulin and leptin assays
Animals were sacrificed by CO2 asphixiation at either six months of age for mice fed the LF
diet or at four months of age for mice fed the HF chow. Blood was obtained by
exanguination and serum collected. All mice were sacrificed between 1:00 pm and 2:30 pm.
Serum glucose was determined using the One Touch Basic glucometer (Johnson and
19

Johnson, Milpitas, CA). Insulin levels were determined using Linco Laboratories (St.
Charles, MO) Rat Insulin RIA kit. Leptin levels were determined using R&D Systems
(Minneapolis, MN) mouse Leptin EIA Kit.
20

Chapter 3
Profound obesity associated with a balanced translocation that disrupts the SIM1 gene
SW116: A Case of Early-Onset Obesity
Numerous family, twin, and adoption studies over the past sixty years indicate that
the heritability of obesity is on the order of 0.4 to 0.8 (Stunkard, Sorensen et al. 1986;
Stunkard 1991); in most cases the pattern of inheritance is polygenic. Genetic studies in
humans and laboratory animals have mapped quantitative trait loci that influence body
weight and diabetes susceptibility (Rankinen, Perusse et al. 2002), but the molecular nature
of these genes is as yet unknown.
By contrast, studies of monogenic obesity in mice have greatly advanced our knowledge
of the endocrine and metabolic pathways regulating body weight. Five mouse spontaneous
obesity mutations have been cloned: diabetes, fat, obese, tubby, and yellow. The most
intensively studied of these are obese, which encodes leptin (Zhang, Proenca et al. 1994), and
diabetes, which encodes the leptin receptor (Tartaglia, Dembski et al. 1995). Fat encodes
carboxypeptidase E, an enzyme necessary for normal processing of neuropeptides such as
Pomc that is involved in central control of feeding behavior as well as processing of
hormones such as proinsulin that regulate peripheral energy metabolism (Naggert, Fricker et
al. 1995). Yellow is a mutation causing ectopic expression of the Agouti gene, which encodes
a competitive antagonist of α-MSH signaling (Miller, Duhl et al. 1993).
21

Predictably, screening of morbidly obese humans has identified rare mutations in some of
these same genes, including leptin (Montague, Farooqi et al. 1997) and the leptin receptor
(Clement, Vaisse et al. 1998). Human mutations associated with obesity have also been
discovered in genes encoding other elements of these pathways, such as proopiomelanocortin
(Krude, Biebermann et al. 1998), prohormone convertase I (Jackson, Creemers et al. 1997),
which cooperates with carboxypeptidase E in prohormone processing, and the melanocortin 4
receptor (MC4R) (Farooqi, Yeo et al. 2000), a key hypothalamic target of α-MSH. Clinical
and metabolic studies of these rare human patients have complemented studies of laboratory
rodents in defining the roles of these molecules in energy balance and revealed some
interesting species differences, e.g. the association of leptin deficiency with
hypercortisolemia in mice but not humans.
In this chapter, I report clinical and molecular studies of a unique patient with obesity and
a balanced 1p;6q chromosome translocation. The results suggest an unsuspected role for a
transcription factor in the regulation of food intake. The transcription factor, SIM1, is critical
for formation of the supraoptic and paraventricular hypothalamic nuclei in mice. The latter
nucleus is well known to be involved in energy homeostasis. Our data suggest that SIM1
plays a role in this function.
22

23
RESULTS
Clinical studies
The proband (SW116) was referred to a pediatric geneticist at age 18 months because
of excessive growth. A prenatal karyotype performed for advanced maternal age revealed a
de novo balanced translocation between the short arm of chromosome 1 and the long arm of
chromosome 6, karyotype 46,XX,t(1;6)(p22.1;q16.2). She was delivered at term by Cesarean
section after an uncomplicated pregnancy. At birth she weighed 3.7 kg (NCHS Z-score +1.5
SD) and was 53 cm long (+1.3 SD). Accelerating growth was noted at age 3 months, and by
25 months she weighed 19.8 kg (+5.2 SD) and was 96 cm tall (+3.1 SD) (wt. for ht. +3.5
SD). She was not dysmorphic, and apart from her obesity, there were no features suggestive
of Prader-Willi, Bardet-Biedl, or other well-defined syndromes. An umbilical hernia present
during infancy resolved without treatment.
The proband’s height curve has remained stable at +3 SD (Fig. 3), while her weight and
weight-for-height curves continue to deviate upward (Fig. 2 and 4). Her rate of weight gain is
comparable to that of girls with mutations in leptin, leptin receptor or MC4R (Fig. 5).

24
SW116 Mass
0 20 40 60 800
20
40
60SW116+3 SDMean-3 SD
Age (months)
Mas
s (K
g)
Figure 2

25
Figure 2 SW116 has early-onset obesity. SW116’s mass was determined at the indicated ages and compared with standard values from NCHS. Her mass has been greater than three standard deviations above the mean since eighteen months of age.

26
SW116 Stature
0 20 40 60 80
SW116+3 SDMean-3 SD
40
60
80
100
120
140
Age (months)
Hei
ght (
cm)
Figure 3

27
Figure 3 SW116 has elevated linear growth.
SW116’s length was determined at the indicated ages and compared with standard values from NCHS. Her length has been at or greater than three standard deviations above the mean since eighteen months of age.
28
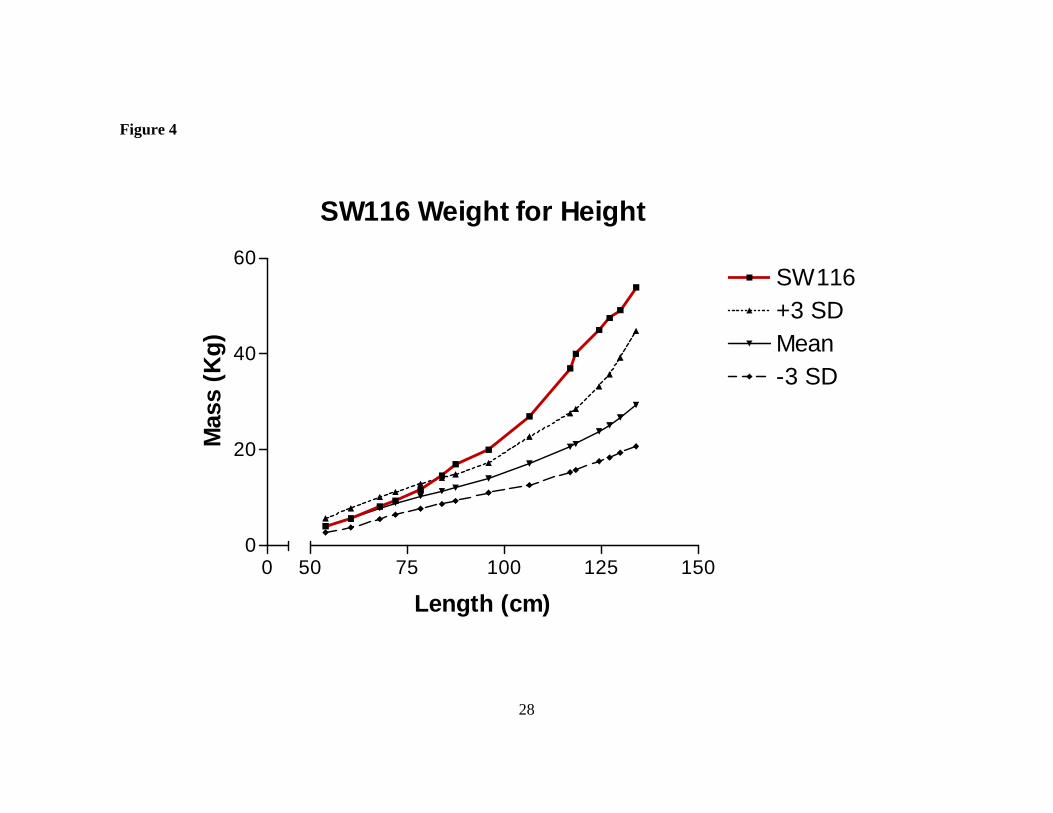
SW116 Weight for Height
00
20
40
60SW116+3 SDMean-3 SD
50 75 100 125 150
Length (cm)
Mas
s (K
g)
Figure 4

29
Figure 4 SW116 has elevated mass when corrected for height. SW116’s weight for height was determined at the indicated ages and compared with standard values from NCHS. Her weight for height has been greater than three standard deviations above the mean since 85 cm of height.

30
Monogenic Obesity
0 20 40 60 800
20
40
60SW116+3 SDMC4RMC4RObObOb-ROb-ROb-RPOMCPOMCAge (months)
Mas
s (K
g)
Figure 5

Figure 5 SW116’s mass is similar to other monogenic obesities.
SW116’s mass is plotted versus other children with early-onset severe obesity due to mutation(s) in the indicated genes. Leptin, Leptin receptor and POMC mutations are recessive. MC4R mutations are dominant.
31

The father of SW116 was 188 cm tall and weighed 104 kg (BMI=29.4), the mother
was 160 cm tall and weighed 54 kg (BMI=21.1), and a male sib at age 51 months was 111
cm tall (+1.5 SD) and weighed 22.4 kg (+2.5 SD) (wt. for ht. +1.9 SD). Abdominal CT and
pituitary MRI of the proband were normal. Lab tests revealed slightly elevated serum insulin
(16 µU/ml, normal 2-13); normal thyroid stimulating hormone, glucose, growth hormone,
somatomedin-C, calcium, and phosphate; and slightly depressed cortisol (5.9 µg/dl, normal
8.7-22.4) concentrations. Repeat tests at age 53 months were normal, except for a
radiographic bone age measurement of 82 months. Serum leptin concentrations were 16 and
24 ng/ml at 38 and 53 months of age, respectively, commensurate with her obesity (Garcia-
Mayor, Andrade et al. 1997; Verrotti, Basciani et al. 1998).
32

An oral glucose tolerance test was administered to SW116 based on her elevated
serum insulin level. SW116 was fasted overnight and provided an oral glucose load the
following morning. Whole blood was serially collected over the next several hours. Three
hours after administration of the oral glucose solution, SW116’s blood glucose level peaked
at 183 mg/dL (normal < 140 mg/dL). Individuals with impaired glucose tolerance peak with
a blood glucose levels of between 140 and 200 mg/dL, and individuals with diabetes peak
with a blood glucose level above 200 mg/dL. Our subject’s serum insulin peaked two hours
after administration of the oral glucose load at 194 µU/mL (normal < 80 µU/mL). Together,
these data suggest our subject is insulin resistant but is not diabetic. As obesity is the major
predisposing factor for insulin resistance and non-insulin dependent diabetes mellitus,
SW116’s obesity has likely caused her insulin resistance.
The mother noted mild hyperphagia beginning around age 4 years. There has been no
evidence of developmental delay, preschool difficulties, or precocious puberty. Recently,
detailed clinical analyses of several individuals with mutations in the melanocortin 4 receptor
have been reported. Much of the phenotype unique to those who are obese due to MC4R
mutations is shared by SW116. In addition to obesity and increased velocity of linear growth,
both have significantly increased bone age. For SW116, bone age at chronological age of 5
years and 10 months was 9.5 years (>3 years advanced). For four out of five children
reported by Stephen O’Rahilly with mutations in the MC4R, the range of advancement in
bone age was 1.0-4.9 years. Advanced bone age has been reported to be associated with
pediatric obesity, but in O’Rahilly’s group of 243 obese children, the average advancement
33

of bone age was 1.7 years. Both SW116 and most children with mutations in the MC4R have
substantially greater bone age advancement.
Both SW116 and children with MC4R mutations also have increased bone mineral
density (BMD). The average Z-score for obese MC4R mutant children was +2.32, while it
was +0.72 for normal family members. SW116’s BMD Z-score was +2.3 at 67.1 months.
SW116’s body composition, food intake, and energy expenditure were studied at age
67 months. She weighed 47.5 kg (+9.3 SD) and was 127.2 cm tall (+3.2 SD) (wt. for ht. +6.3
SD). Fat mass was 52% as determined by dual-energy X-ray absorptiometry, with
generalized distribution. This value lies outside the values, 9-43%, of the 318 healthy girls,
ages four to sixteen, measured previously.
A three-day food intake record by the mother indicated energy intake of 5017 kJ/d.
Her basal and sleeping metabolic rates, measured by 24-hr calorimetry, were slightly greater
than predicted by equations derived from calorimetry of 318 girls (Fig. 6). 24-hr respiratory
quotient was normal at 0.86. Total energy expenditure in the free living state measured by the
doubly-labeled water method was 8314 kJ/d, significantly greater than her reported energy
intake. The ratio of total energy expenditure to basal metabolic rate, an index of physical
activity level, was 1.45, which is within the range of measurements (1.3 to 2.5) observed for
a series of 101 normal 8-year old girls. Observation of her ad libitum consumption revealed
an aggressive, voracious appetite.
34

SW116 Energy Expenditure
BMR (kJ/d
ay)
SMR (kJ/m
in x 1
03 )
TEE (kJ/d
ay)
0
2500
5000
7500
10000
Figure 6 SW116 has normal energy expenditure
Basal metabolic rate (BMR), sleeping metabolic rate (SMR) and total energy expenditure (TEE) were measured by 24 hour calorimetry for SW116 (open bars) and compared with values predicted from her gender, age, race and body weight (hatched) or from her fat-free mass and fat mass (vertical stripe). Black bar, SW116’s TEE as measured by the doubly-labeled water method.
35

36
Molecular studies
Review of the cytogenetic literature revealed three patients (Turleau, Demay et al. 1988;
Villa, Urioste et al. 1995; Gilhuis, van Ravenswaaij et al. 2000) with complex phenotypes
that included early onset obesity and small interstitial deletions of 6q potentially overlapping
SW116’s breakpoint (Fig. 7).
I hypothesized that SW116's unusual growth was due to haploinsufficiency of a gene on
6q. A number of CEPH megaYACs from the Whitehead Institute contig were tested by FISH
against the patient’s cell line and identified one clone, y852C9, that gave signals on both the
der(1) and der(6) chromosomes as well as from chromosome 6. Sequence-tagged sites
(STS’s) mapping to this YAC clone were used to isolate a smaller Washington University
YAC, yA35F11, that also crossed the breakpoint by FISH, and allowed the breakpoint to be
mapped between D6S475 and WI6516. BAC clones were then isolated using markers
WI6516, AFM176xg9, and D6S475, and the ends of these clones were then sequenced to
generate additional STS markers. A BAC and PAC contig (Fig. 8) was constructed by
iterative library screening, end sequencing, and STS content mapping. BAC b325C19
crossed the breakpoint by FISH (Fig. 9) and the del(6)(q16.2q21) subject reported by Villa et
al. (Villa, Urioste et al. 1995) was deleted for this probe.

37
Villa et al. 1995
del(6)(q14q16.2) del(6)(q16.2q21)
Pt. SW116Turleau et al. 1988
breakpoint
Guilhuis et al. 2000
del(6)(q15q21) der(6),t(1p22.1;6q16.2)
translocation
Figure 7

38
Figure 7 Cytogenetic abnormalities encompassing 6q16 associated with obesity.
Ideograms of chromosome 6 depicting SW116 translocation breakpoint (arrow) and three interstitial deletions associated with obesity.

39
Figure 8

40
Figure 8 Chromosome 6 physical map of BACs near the translocation breakpoint. t(1;6) indicates the location of the breakpoint. PCR and Fluorescence In Situ Hybridization (FISH) were used to map the order of BACs with respect to the breakpoint and to one another. Two Yeast Artifical Chromosome (YAC) clones crossing the breakpoint are also shown (thick lines).

41
Figure 9

Figure 9 A chromosome 6 BAC crosses SW116’s translocation breakpoint
Fluorescent in situ hybridization of b325c19 (green) and a chromosome 6 centromere probe (red). Note three green signals: two are associated with the chromosome 6 centromere representing the unaffected chromosome 6 and the derivative(6), one is not associated with the chromosome 6 centromere representing derivative(1).
42

43
To facilitate further breakpoint mapping, a somatic cell hybrid was made selectively
retaining the der(1) chromosome. STS content mapping using this hybrid allowed me to
position the chromosome 6 breakpoint on our contig and to map the chromosome 1
breakpoint between markers WI7492 and D1S1673. Three BAC clones containing D1S1673
were isolated and STS’s generated from end sequences (Fig. 10). All three clones crossed the
breakpoint by STS content mapping and by FISH.
Database searches revealed a match between one end of BAC clone b353H2 which
crosses the 6q breakpoint and a 177 kb contiguous genomic sequence from 6q16 deposited in
GenBank (Accession Z86062). Additional genomic sequence from BAC clone b21C21
crossing the 1p breakpoint was generated by The Sanger Center (Accession AL049861). I
used these genomic sequences to design additional primers used to fine-map the breakpoints
by PCR. Restriction fragments from either side of the translocation detected a novel der(6)
junction fragment (Fig. 11a).

44
b21C21
b219G7
b261L4
Sp6 T7
Sp6
SP6
T7
T7
D1S1673
TEL CENt(1;6)
Figure 10

Figure 10 Chromosome 1 physical map of BACs crossing SW116 translocation breakpoint. BACs b21C21, b219G7 and b261L4 were identified by PCR with STS D1S1673. BAC orientation was determined by PCR with primers developed from BAC end sequencing. b21C21 was determined to cross the translocation breakpoint by FISH and Southern blotting. t(1;6) indicates location of the translocation breakpoint.
45
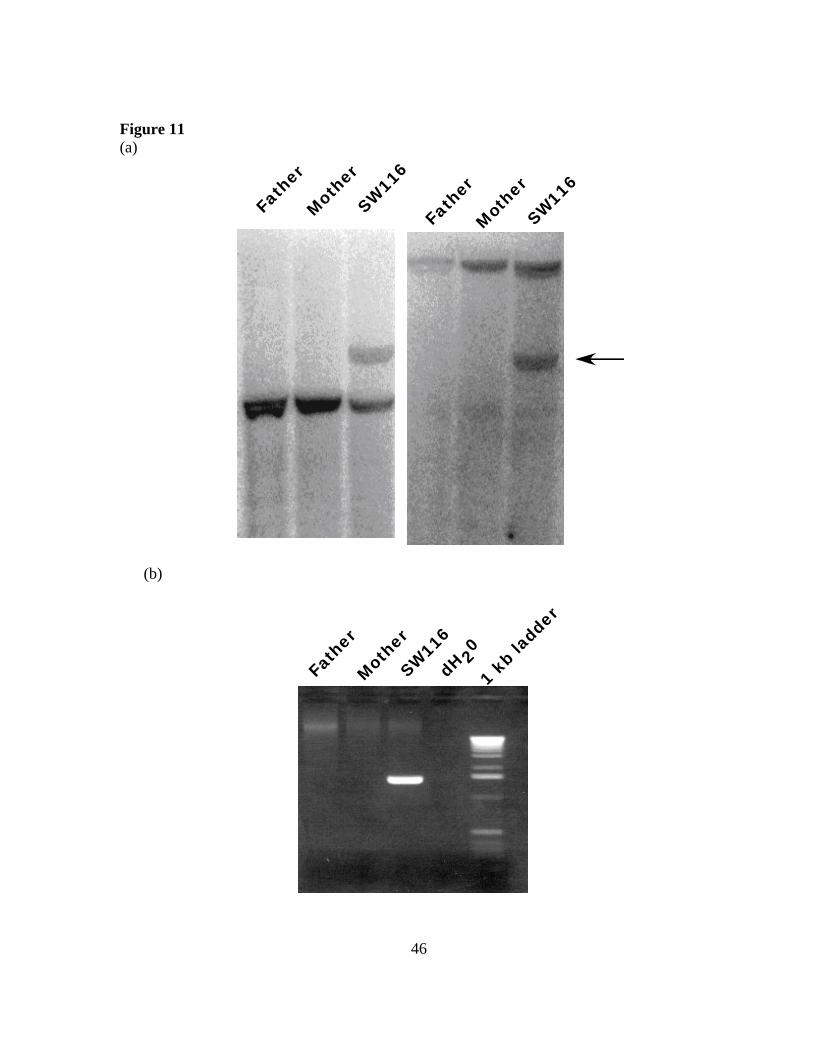
Figure 11 (a)
Father
Mother
SW116
Father
Mother
SW116
(b)
Father
Mother
SW116
1 kbladder
dH 20
46

Figure 11 Cloning SW116’s translocation breakpoint
(a) Southern blotting with genomic DNA digested with XbaI from SW116 and her parents. The first panel was probed with a DNA fragment from the first intron of SIM1. An abnormally migrating band was present in the proband, but not present in the father or mother (arrow). (b) Using a primer from chromosome 1 and a primer from chromosome 6, the der(6) translocation breakpoint was PCR amplified. The product of this reaction was present only in the proband and not in the father or mother.
47

Similar results were obtained for the der(1) chromosome, indicating that the
translocation was not accompanied by a large concomitant deletion. I PCR-amplified and
sequenced both junctions (Fig. 11b) and found that the translocation deleted only a single
base pair of chromosome 6 and none of chromosome 1(Fig. 12).
chr 6 TCCTTGGTGTTTCCCCTTAAGATCTTTGGAGGCTTTGCCGCAAACTTTCTCder (6) TCCTTGGTGTTTCCCCTTAAGATCT gctcactgcagaattctctaacattder (1) gtttatcctgttggattacattcat TGGAGGCTTTGCCGCAAACTTTCTCchr 1 gtttatcctgttggattacattcat gctcactgcagaattctctaacatt
Figure 12 Alignment of SW116’s translocation breakpoint junction fragments with consensus human chromosome 1 and 6 sequence.
The translocation disrupts SIM1
BLAST analysis of > 84 kb of contiguous genomic sequence from BAC clone
b21C21, as well as exon trapping experiments using clone b219G7 failed to identify any
1p22 transcription units disrupted by the translocation. By contrast, sequence and mapping
data indicated that the 6q breakpoint lies within a known gene, SIM1. Inspection of the
intron/exon structure of SIM1 indicated that the translocation breakpoint falls within the first
intron and separates the 5' flanking sequence and the first exon from downstream exons (Fig.
13).
48

Figure 13 SW116’s chromosome 6 translocation breakpoint lies within intron 1 of human SIM1.
To determine whether our proband’s other allele of SIM1 was normal, I PCR-
amplified and sequenced all SIM1 exons and splice sites. She is heterozygous for a silent C to
T substitution at nt. 1328 in exon 9 of the coding sequence. I found no other mutations. Thus
SW116 is presumably heterozygous for a loss-of-function SIM1 mutation. Attempts to detect
SIM1 transcripts by RT-PCR of RNA from control and patient lymphoblastoid cells were
unsuccessful.
SIM1 mutations are probably not a common cause of early-onset obesity
I performed mutation detection using single stranded conformational polymorphism
analysis and limited DNA sequencing on samples from 45 markedly obese children referred
to a pediatric endocrinologist. I found no other coding or splice site mutations. The C to T
silent substitution in SW116 appears to be a common polymorphism. Eight of the 45 obese
children were heterozygous for the T allele, and the remaining subjects were homozygous for
the C allele. By comparison, 9 of 33 controls were heterozygous for the T allele, and the
49

remainder were homozygous for the C allele. There was no significant association of obesity
with this polymorphism (χ2=0.53, 0.25<P<0.5).
50
DISCUSSION
I identified a mutation in the SIM1 gene in a girl with profound obesity and increased
linear growth. Her weight gain must involve occult food consumption, since measured
energy expenditure was normal and was significantly greater than her reported caloric intake.
I hypothesize that SIM1 haploinsufficiency causes her phenotype. If this hypothesis is
correct, obesity due to SIM1 mutations would be expected to show autosomal dominant
inheritance. This prediction cannot be tested in our kindred, since the translocation occurred
de novo. No additional SIM1 mutations were identified by SSCP in 45 other children with
marked obesity, but such mutations may be identified by screening larger numbers of
subjects with more sensitive techniques. Linkage of obesity to 6q16.2 has not been reported
in large genetic studies, but these studies have not specifically examined subjects with
severe, early onset obesity. The physical map of 6q16.2 and the availability of SIM1 genomic
sequences should facilitate testing for associations between obesity and the SIM1 gene.
The possibility that one or both of the SIM1 gene fragments are expressed as part of a
fusion gene cannot be excluded, although no other transcription units are in close proximity
to the breakpoints. It is also possible that a truncated SIM1 transcript produces a dominant
negative protein. The reported interstitial 6q deletions associated with early-onset obesity are
consistent with our haploinsufficiency model. Screening additional patients with early onset
obesity might reveal additional microscopic or submicroscopic deletions of SIM1.
Position effects on expression of nearby genes could also account for the phenotype
of the proband. Inspection of the human transcript map revealed no other obvious candidate
genes near either translocation breakpoint. The leptin receptor gene (LEPR) maps to 1p31,
51

over 20 Mb from the 1p breakpoint, and this locus appeared to be intact by FISH. The only
human obesity-related trait that has been genetically mapped near either breakpoint is a
quantitative trait locus for 24-hr respiratory quotient linked to D1S550 on 1p31-p21 in a
study of Pima Indian (Norman, Tataranni et al. 1998). However, this locus is unlikely to be
relevant to our subject’s phenotype, since her 24-hr respiratory quotient was normal.
It is also possible that the phenotype of the proband and her translocation are
coincidental. Indeed, her father and brother, who do not carry the translocation, are large.
However, unlike the proband, the father’s obesity developed during adulthood, and the
brother’s growth was not sufficiently abnormal to bring him to medical attention.
Nevertheless, as with any complex trait, genetic background and environmental factors
undoubtedly contribute to the severity of the phenotype.
Sim1 continues to be expressed in the PVH in adult mice, suggesting that Sim1
participates in post-developmental HPA function(s). These functions are presently obscure,
since SIM1's transcriptional targets are not known. A system for potentially identifying
transcriptional targets of SIM1 will be presented in Chapter 4. Expression of SIM1 in the
PVH is intriguing with regard to obesity, since this nucleus is critical for the integration of
signals governing appetite and energy expenditure (Elmquist, Elias et al. 1999). Lesions in
the rat PVH result in obesity, and microinjection into the PVH of virtually all known
orexigenic neurotransmitters or neuropeptides stimulates feeding. Conversely, microinjection
of anorexic peptides such as CRF or leptin attenuates post-fasting food intake.
PVH neurons also express the Mc4r (Mountjoy, Mortrud et al. 1994), neuropeptide Y
receptors Y1 (Jacques, Tong et al. 1996) and Y5 (Gerald, Walker et al. 1996), galanin and
52

galanin receptors 1 and 2 (Gundlach and Burazin 1998), CRF and CRF receptor (Richard,
Rivest et al. 1996), and the orexin 2 (hypocretin) receptor (Trivedi, Yu et al. 1998). This
nucleus appears to be an important mediator of these anorexigenic and orexigenic signals.
Mutations in the MC4R gene have been shown to cause obesity and increased linear growth
in both mice and humans (Huszar, Lynch et al. 1997; Farooqi, Yeo et al. 2000). The
increased linear growth phenotype is not a general feature of monogenic obesity, since leptin
deficiency does not increase linear growth in humans (Montague, Farooqi et al. 1997) and in
fact impairs linear growth in mice. In this regard, our proband’s tall stature and the
coincident expression of SIM1 and MC4R in the PVH suggests that both genes may belong to
the same physiologic or even molecular pathway regulating growth and energy balance
(Table II). Alternatively, our proband’s stature may reflect increased growth velocity without
change in final height, as has been noted in other obese children and ascribed to increased
insulin levels (De Simone, Farello et al. 1995).
Table II. Comparison of SW116 with individuals with mutations in leptin or MC4R
SW116 leptin MC4R
Age of onset early-onset early-onset early-onset Linear growth accelerated normal accelerated Food seeking yes yes yes BMR normal normal normal Fasting insulin elevated elevated elevated Fasting glucose normal normal normal Bone age +3.7 years +3.5 years +1.0-4.9 yers Bone Mineral Content
+2.3 SD ?????? +2.3 SD
53

Previous genetic and pharmacologic studies have identified a number of signaling
molecules important for hypothalamic regulation of energy balance (Robinson, Dinulescu et
al. 2000), but few studies have examined nuclear transcription. The transcription factor Fos is
induced rapidly in response to cytokine-related signals, and this induction has been used to
map leptin-responsive neurons in the hypothalamus (Elmquist, Ahima et al. 1997). Mice
lacking another transcription factor expressed in the hypothalamus, nHLH2, show adult-onset
obesity, possibly through a quantitative defect in Pomc levels in the arcuate nucleus (Good,
Porter et al. 1997). It seems likely that changes in hypothalamic gene expression mediated by
transcription factors such as nHLH2 or SIM1 play a role in the long term regulation of food
intake and energy expenditure.
54
Chapter 4
Creation of a cell culture system for identifying SIM1
transcriptional targets
Introduction
From the previous work with patient SW116, SIM1 is a candidate novel human obesity
gene. The mechanism by which haploinsufficiency of SIM1 results in obesity is unclear. As
SIM1 is a transcription factor expressed in the hypothalamus, SIM1 regulated genes might be
critical for proper feeding behavior and body weight regulation. Because of SIM1’s
expression in the hypothalamus, it is impossible to determine what genes might have altered
regulation directly in SW116. To overcome this limitation, I have created a cell culture
system for identifying genes whose expression will be altered when SIM1 is conditionally
overexpressed. Similar approaches have been taken for other transcription factors expressed
in the CNS such as NPAS2 (Reick, Garcia et al. 2001) and Six5 (Sato, Nakamura et al. 2002).
Identifying differentially expressed genes in the brain is particularly problematic because of
the limited expression patterns of many genes of the central nervous system, including that of
SIM1. Use of cells in culture expressing the gene of interest can potentially overcome this
problem because of uniform expression. Using conditional expression systems, it is also
possible to produce dramatic changes in expression of the gene of interest. In order to take
advantage of these benefits, I have created a cell culture system that inducibly expresses SIM
and used this system to attempt identification of SIM1 transcriptional targets.
55
Results
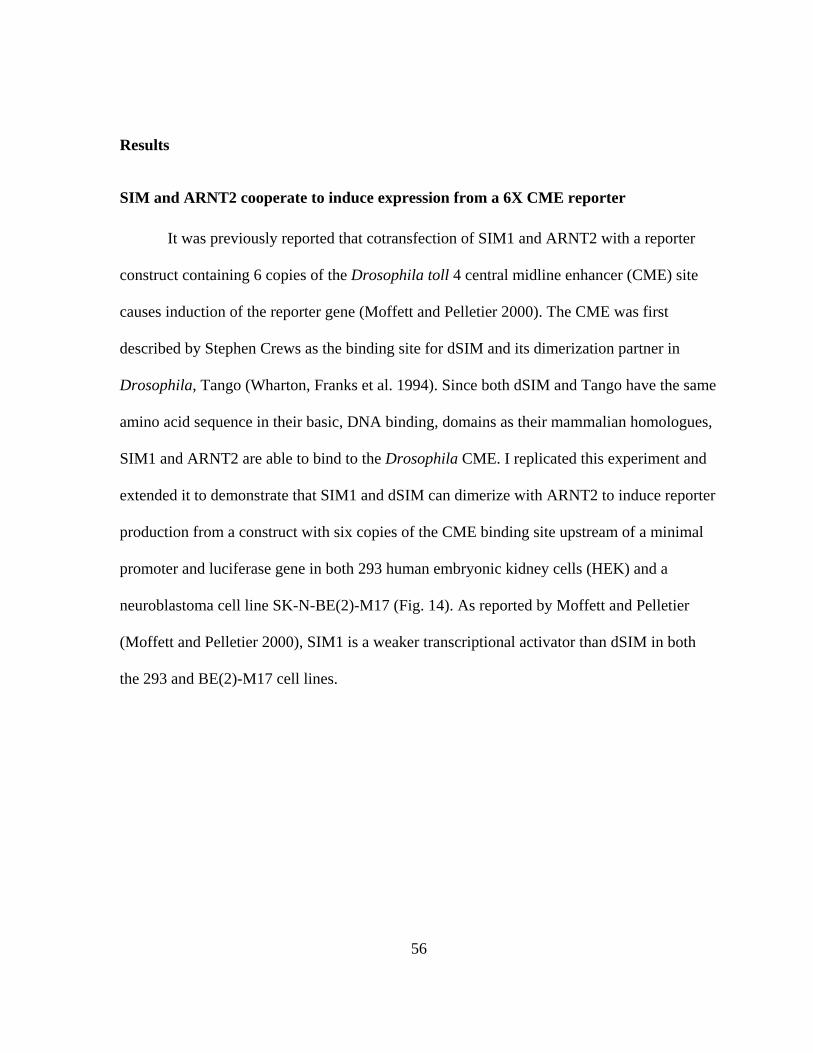
SIM and ARNT2 cooperate to induce expression from a 6X CME reporter
It was previously reported that cotransfection of SIM1 and ARNT2 with a reporter
construct containing 6 copies of the Drosophila toll 4 central midline enhancer (CME) site
causes induction of the reporter gene (Moffett and Pelletier 2000). The CME was first
described by Stephen Crews as the binding site for dSIM and its dimerization partner in
Drosophila, Tango (Wharton, Franks et al. 1994). Since both dSIM and Tango have the same
amino acid sequence in their basic, DNA binding, domains as their mammalian homologues,
SIM1 and ARNT2 are able to bind to the Drosophila CME. I replicated this experiment and
extended it to demonstrate that SIM1 and dSIM can dimerize with ARNT2 to induce reporter
production from a construct with six copies of the CME binding site upstream of a minimal
promoter and luciferase gene in both 293 human embryonic kidney cells (HEK) and a
neuroblastoma cell line SK-N-BE(2)-M17 (Fig. 14). As reported by Moffett and Pelletier
(Moffett and Pelletier 2000), SIM1 is a weaker transcriptional activator than dSIM in both
the 293 and BE(2)-M17 cell lines.
56

Figure 14
(a)
293 HEK pGL3/6XCME
SIM1H
A
dSIM
V5
ARNT2
SIM1H
A/A2
dSIM
V5/A2
report
er0
50
100
150Lu
cife
rase
Indu
ctio
n
(b)
BE(2)-M17 pGL3/6XCME
SIM1H
A
dSIM
V5
ARNT2
SIM1H
A/A2
dSIM
V5/A2
report
er0
10
20
Luci
fera
se In
duct
ion
57

Figure 14 SIM1 acts as a transcriptional activator.
(a) 293 HEK cells or (b) SK-N-BE(2)-M17 human neuroblastoma cells were transiently transfected with the pGL3/6XCME reporter either alone or with expression vector(s) containing a cDNA of the gene noted. Each bar represents the mean +/- SEM.
58

Establishing cell lines stably expressing SIM and ARNT2
Despite the high level of induction of the luciferase promoter from pGL3/6XCME
with cotransfection of either SIM1HA or dSIMV5, in transient transfections there can be
substantial variability with cell to cell expression of transfected genes. To eliminate this
possibility, 293 cells were engineered that inducibly express either SIM1 or dSIM. Figure 15
represents the strategy used to create cell lines expressing SIM1HA or dSIMV5 and ARNT2.
59

Figure 15
60

Figure 15 Experimental scheme for creation of a cell culture system with inducible expression of either SIM1 or dSIM for identifying transcriptional targets of SIM1. Iterative transfections and selection of drug resistant clones will yield cells which constitutively express ARNT2 and inducibly express dSIM or SIM1.
61

The ecdysone inducible expression system from Invitrogen was used to create cells
with inducible expression. First 293 cells were stably transfected with a mammalian
expression plasmid, pVgRXR, that constitutively expresses the ecdysone receptor, RXR and
a Zeocin resistance gene. Four clones were then selected that are resistant to Zeocin. The
clone (pVgRXR-4) with best conditional expression, as determined by transient transfection
with a reporter plasmid, pIND/LacZ, containing beta-galactosidase under an inducible
promoter with five ecdysone receptor/RXR binding sites, was used for subsequent
transfections (Fig. 16).
293 HEK pVgRXR Inducibilty
pVgRXR-1 pVgRXR-2 pVgRXR-3 pVgRXR-40
25
50
75
rela
tive
beta
-gal
acto
sida
seac
tivity
Figure 16 293 HEK cells express beta-galactosidase under control of a promoter which contains five binding sites for heterodimers of the Ecdysone receptor and RXR. Cells were incubated with either standard media or media supplemented with 10 µM ponasterone A for 48 hours. Bars are mean +/- SEM.
As shown previously, cotransfection of SIM and the 6X CME reporter alone is
ineffective in activating transcription of the luciferase reporter. This is due to the requirement
62

of a dimerization partner such as ARNT or ARNT2. Although 293 cells express ARNT and
ARNT2 by rt-PCR, neither can be detected by Western blotting for endogenous protein.
Together, these data indicate that neither ARNT nor ARNT2 are endogenously expressed at
adequate concentrations to dimerize with SIM when overexpressed by transfection.
Therefore, it is necessary to also overexpress ARNT2 to allow adequate formation of
SIM/ARNT2 dimers to activate transcription of either endogenous genes or luciferase from a
reporter construct.
The pVgRXR-4 clone was therefore further transfected with pcDNA3.1/ARNT2, an
expression vector that constitutively expresses mouse ARNT2 with the Cytomegalovirus
(CMV) promoter. Six independent clones were selected for resistance to G418 due to
expression of a nemomycin resistance gene present in the pcDNA3.1 expression vector.
Expression of ARNT2 was determined by Western blotting using a commercial antibody
specific to ARNT2 (Fig. 17). The same protein filter was also hybridized with an antibody
specific for RPS4X, a ribosomal protein, to normalize for protein loading. Clone number two
(293 4.2) had the highest expression of ARNT2 as determined by the ARNT2 to RPS4X
ratio, and was used for subsequent transfections.
63

ARNT2
RPS4X
1 2 3 4 5 6lysate lysate
Figure 17. Constitutive expression of ARNT2 in 293 pVgRXR-4 cells stably transfected with pcDNA3.1/ARNT2. Western blotting was performed with an antibody specific for ARNT2 or for RPS4X. Note the ARNT2/RPS4X ratio. 293 4.2 has the greatest expression of ARNT2.
The 293 4.2 cell line was next transfected with an expression vector that contains five
Ecdysone receptor/RXR heterodimer binding sites (pIND) with either mouse SIM1 tagged
with an epitope from the influenza hemagglutin (pIND/mSIM1HA) or drosophila
Singleminded tagged with V5 (pIND/dSIMV5) cloned downstream of the inducible
promoter. The pIND vector contains a hygromycin resistance gene and clones resistant to
hygromycin were selected. Both Western blotting with an antibody specific to HA for
mSIM1HA or an antibody specific to V5 for dSIMV5 and transient transfections with the
pGL3/6XCME reporter plasmid plus or minus induction by ponasterone A were performed
for determining which clone had the best induction of transcriptional activity. By Western
blotting, clone 293 4.2.2 and 4.2.4 had high level of induction of SIM1HA by ponasterone A.
However, using the functional assay with the 6X CME/Luciferase reporter, none of the
clones isolated appear to be able to strongly induce transcription from the reporter (Fig. 18).
64

Figure 18
(a)
4.2.1 4.2.2 4.2.3 4.2.4
+ + + +- - - -
ARNT2
SIM1HA
(b)
Luciferase Induction
293 4
.2.1
293 4
.2.2
293 4
.2.3
293 4
.2.4
0.0
0.5
1.0
1.5
Luci
fera
se In
duct
ion
with
Pon
aste
rone
A
65

Figure 18. Inducible expression of SIM1HA in 293 4.2 cells. (a) Western blotting of 293 4.2 hygromycin resistant clones stably transfected with pIND/SIM1HA using an antibody specific for the HA epitope and for ARNT2. Cells induced with 10 �M ponasterone A for 48 hours (+) or uninduced (-). (b) Luciferase reporter activity of the same clones. Induction is the ratio of induced/uninduced for 48 hours. Bars are mean +/- SEM.
66
SIM1 is a weak transcriptional activator when compared to dSIM. Additionally,
transfection of ARNT2 and the 6X CME reporter in 293 cells results in substantial
background activation over transfection of the reporter alone. SIM1 and dSIM have precisely
the same amino acid sequence within their basic, DNA binding domains, and dSIM is a much
stronger transcriptional activator as determined by the previous cotransfection assays (Fig.
14). Therefore, the 293 4.2 clone was transfected with pIND/dSIMV5 and eleven clones
resistant to hygromycin were selected. Each clone was checked for inducibilty of dSIM
expression by Western blotting and inducibilty of luciferase from the pGL3/6XCME reporter
plasmid (Fig. 19).
67

Figure 19
(a)
dSIMV5
dSIMV5
4.2.1d
4.2.8d 4.2.9d 4.2.10d 4.2.11d
4.2.6d4.2.5d4.2.4d4.2.3d4.2.2d
4.2.7d
+ + + +- - - -
+ + + +- - - - + -
+ +- -
RPS4X
RPS4X
(b)
Luciferase Induction
4.2.1d
4.2.2d
4.2.3d
4.2.4d
4.2.5d
4.2.6d
4.2.7d
4.2.8d
4.2.9d
4.2.10
d
4.2.11
d0
10
20
30
Luci
fera
se In
duct
ion
with
Pon
aste
rone
A
68

Figure 19. Inducible expression of dSIM in 293 4.2 cells (a) Western blotting of 293 4.2 hygromycin resistant clones stably transfected with pIND/dSIMV5 using an antibody specific for the V5 epitope and for RPS4X. Cells induced with 10 µM ponasterone A for 48 hours (+) or uninduced (-). (b)Luciferase reporter activity of the same clones. Induction is the ratio of induced/uninduced for 48 hours. Bars are mean +/- SEM.
69

Clones 4.2.3d, 4.2.5d and 4.2.10d had strong induction of dSIMV5 with ponasterone
A as determined by Western blotting. Luciferase reporter transfection experiments
indicated that 4.2.3d and 4.2.10d had the best ability to activate transcription from the
6XCME reporter construct. Both could induce Luciferase activity by approximately
twenty-fold. Clone 4.2.3d was used for further experiments to identify transcriptional
targets in mammalian cells.
Microarray profiling of 293 4.2.3d cDNA
To identify genes which are transcriptionally regulated by SIM, the 293 4.2.3d cell
line was used in a cDNA microarray experiment. cDNA from cells of the 4.2.3d clone grown
for 48 hours in the presence of ponasterone A was synthesized with dUTP labeled with the
fluorescent label Cy3. cDNA from uninduced cells were synthesized with dUTP labeled with
Cy5. Both of these labeled cDNAs were hybridized to a cDNA microarray spotted on a glass
slide at the Microarray Core facility at UT Southwestern. The array used for this experiment
contained 10,800 spots, each representing either a known human gene or a human Expressed
Sequence Tagged Site (EST). This hybridization was performed twice, once as described
above and once with the Cy3 and Cy5 dyes reversed.
There were 259 genes in which there was at least a two-fold change in one of the
hybridizations between 293 4.2.10d cells either induced or uninduced. However, no gene was
found to have greater than a two fold difference of expression in both experiments. Lowering
the stringency of this experiment to a 1.4 fold change yielded twenty-four genes changed in
both experiments (Table III).
70

Table III. cDNA microarray results
Genbank Accession
Gene Name 1st experiment
2nd experiment
Putative function
R66896 EST 3.81 1.89 ????? N53453 EST 3.67 1.67 ????? R95882 EST 3.31 1.82 ????? R98442 EST 3.29 1.5 ????? R98107 EST 2.85 2.15 ????? R98934 EST 2.74 1.41 ????? R98191 EST 2.73 1.87 ????? AA010352 Sjogren Antigen A2 2.73 1.6 T69603 Complement
component 1 2.62 1.6
N59690 EST 2.58 1.62 Alu repeat T69359 Mannose-binding
lectin 2.57 1.79
H48467 EST 2.47 1.54 ????? T97080 EST 2.39 1.7 R02699 EST 2.28 1.62 Unc-5c AA070226 Selenoprotein P 2.09 2.71 Antioxidant R31395 EST 2.05 1.89 Oxysterol binding? H48445 EST 2.04 1.68 ????? AA447393 KIAA0091 2.04 1.59 Site-1 protease H93068 2.03 1.94 T80232 Autotaxin 1.6 2.3 phosphodiesterase N62620 Twik-1 -1.42 -2.08 K+ channel W87741 EST -2.05 -2.38 Proto-oncogene R76553 EST -2.15 -3.08 Metalloproteinase H16637 V-CAM1 -2.44 -2.18 ECM
71

Discussion
Despite a high level of induction of the luciferase reporter, none of the genes
examined in the microarray experiment were significantly induced with dSIM expression.
Because of this result, no effort was made to corroborate any of the microarray results by
independent methods such as Northern blotting or real-time RT-PCR. There are several
possible reasons for this result. The pGL3/6XCME reporter has six binding sites for dSIM
which might allow cooperative binding to this reporter not present in SIM1 binding sites in
the human genome. SIM1 might normally require transcriptional coactivators not present in
the 293 cell line. The microarray used for this experiment was originally designed for
profiling the expression of cancer cells versus normal cells, and therefore, does not have
genes which are likely to be involved in the normal function of SIM1, such as genes
expressed in the hypothalamus that have a known function in feeding behavior. It would be
interesting to use other arrays which are more biased for CNS expressed genes. In an attempt
to overcome the possible need for transcriptional cofactors, the lab is currently making a
fusion gene with mouse SIM1 and the transcriptional activation domain VP-16. A similar
experiment has been performed by Sato and colleagues to identify transcriptional target of
the Six5 transcription factor (Sato, Nakamura et al. 2002).
72

Chapter 5
Abnormal feeding behavior in response to dietary fat in Sim1 mutant mice:
a paradigm for gene x environment interaction in obesity
Introduction
The rise in prevalence of obesity over the past several decades is largely due to
changes in environment, including an increasingly sedentary lifestyle and consumption of
calorically dense foods rich in fat. Although this environment has enabled the obesity
epidemic, most of the individual variance in body weight is nevertheless attributed to genetic
factors (Stunkard 1991). Obesity is a polygenic trait, and there are major efforts underway to
identify the underlying genes that contribute to obesity in the general population (Rankinen,
Perusse et al. 2002). At the same time, studies of rare monogenic obesity mutations in
humans and mice have elucidated novel pathways regulating energy homeostasis. To date,
mutations in six human genes have been shown to cause severe, early-onset obesity : leptin
(LEP); leptin receptor (LEPR); proprotein convertase, subtilisin/kexin-type, 1 (PCSK1);
proopiomelanocortin (POMC); melanocortin 4 Receptor (MC4R); and single-minded
homologue 1 (SIM1) (Rankinen, Perusse et al. 2002). Of these, only SIM1 was identified by
positional cloning without any prior knowledge of a mouse mutant phenotype or its potential
physiologic function (Holder, Butte et al. 2000). One copy of SIM1 was disrupted by a
balanced translocation in a girl with early onset obesity, hyperphagia and accelerated linear
growth as described in Chapter 3.
73

The PAS domain is conserved from prokaryotes to eukaryotes, and proteins with this
domain often function in signaling pathways that sense the intracellular or extracellular
environment (Gu, Hogenesch et al. 2000). A number of PAS proteins expressed in the CNS
are critical for basic homeostatic responses, including Clock, BMAL1 and Period, which all
respond to light to establish circadian rhythms (Lowrey and Takahashi 2000), and NPAS2,
which has been proposed to sense redox potential in CNS neurons (Reick, Garcia et al. 2001).
There is growing interest in the role of transcription factors in the central control of
feeding behavior. To date, mutations in four mouse genes encoding known or putative
transcription factors, Tubby (Boggon, Shan et al. 1999), Nhlh2 (Good, Porter et al. 1997), Sf1
(Majdic, Young et al. 2002) and Sim1 (Michaud, Boucher et al. 2001), have been shown to
cause obesity. The molecular mechanisms by which mutations in these genes results in
obesity has not been elucidated, largely because their transcriptional targets relevant to
feeding behavior have not been identified. However, it is well known that feeding or fasting
alters the expression of many neuropeptides. The mechanism of this regulation is unknown
and likely involves transcription factors acting downstream of signaling pathways.
Transcription is especially attractive as a mechanism for the long-term regulation of food
intake and energy expenditure as has been demonstrated for other complex behaviors such as
addiction (Nestler 2001).
In this chapter, I report a role for mammalian Sim1 in energy balance, and in
particular, the homeostatic feeding response to dietary fat content. Sim1 deficient mice were
generated by homologous recombination, and in this chapter I will show that heterozygotes
become obese, like SW116. Obesity was principally due to hyperphagia. When shifted from
74

standard rodent chow to a high fat diet, these mice showed a dramatic and sustained increase
in their excess energy intake, resulting in earlier onset and more severe obesity and
associated insulin resistance. The interaction between Sim1 dosage and dietary fat provides a
model for gene-environment interactions of paramount importance for developing strategies
to combat the current obesity epidemic.
75

RESULTS
Targeted Inactivation of Sim1
Mice carrying a null allele of Sim1 were generated and provided by Ying-Hue Lee
(Sinica Academy, Tiawan). The targeting strategy for generating Sim1 heterozygous null
mice (Fig. 20a) involved creating mice in which the second exon (encoding the translation
intiation domain) was floxed by Lox P sites. Mice heterozygous for this allele were then
crossed to transgenic mice with the Cre recombinase under control of the EIIa promoter
which allows expression of Cre at the one cell embryo stage. This caused recombination and
loss of the coding portion of the second exon of Sim1 from this allele. This is a null allele as
mice heterozygous for the deletion mutant allele display perinatal lethality as previously
published (Michaud, Rosenquist et al. 1998).
76

Figure 20
(a)
(b) (c)
5 kb
3 kb
377 bp160 bp
+/+ +/- +/- +/- +/+
77

Figure 20 Sim1 heterozygous null mice (a) Targeting strategy for generating Sim1 heterozygous null mice (b) Correct targeting was determined by Southern blotting (upper panel) and PCR genotyping (lower panel). For both methods, the upper band represents the wild-type allele and the lower band is the null allele. (c) Six month old Sim1 heterozygous null female (left) and wild-type littermate (right).
78

Increased body weight and length of Sim1 +/- mice
Mice were weaned at three weeks of age onto either a chow containing 4% dietary fat
(LF) or a chow containing 35% dietary fat (HF) and weighed weekly (Fig. 21 and 22). By
eight weeks of age, heterozygous females were 13% heavier than controls (22.9±0.5 g vs.
20.2±0.4 g) on the LF diet (Fig. 22a) and 71% heavier than controls (38.1±1.7 g vs. 22.2±0.7
g) on the HF diet (Fig. 22b). Males were similarly affected: by eight weeks of age,
heterozygotes were 22% heavier than controls (29.6±0.7 g vs. 24.3±0.4 g) on the LF diet
(Fig. 21a) and 51% heavier than controls (46.9±1.5 g vs. 31.1±1.2 g) on the HF diet (Fig
21b). Sim1 +/- mice of either sex continued to gain weight until at least six months of age on
the LF diet (Fig. 21a and 22a) and four months of age on the HF diet (Fig. 21b and 22b).
Sim1 +/- mice were also longer than their wild-type littermates at six months of age
(Fig. 23). Male heterozygotes were more than 0.5 cm longer than controls on either the LF or
HF diet. Female heterozygotes were 0.5 cm or 0.4 cm longer than controls on the LF or HF
diet, respectively.
79

Figure 21
(a)
(b)
Male - LF Chow
4 8 12 16 20 24
+/-+/+
20
30
40
50
60
70
Age (weeks)
Mas
s (g
ram
s)
Male - HF Chow
4 8 12 16
+/-+/+
20
30
40
50
60
70
Age (weeks)
Mas
s (g
ram
s)
80

Figure 21 Male Sim1 deficient mice are obese.
Male Sim1 deficient and wild-type mice were weaned at three weeks onto either a LF chow diet (a) or a HF diet (b). Weight was recorded weekly. (a) +/- n=15, +/+ n=15. (b) +/- n=9, +/+ n=11. Each point represents the mean +/- SEM.
81

Figure 22 (a)
Female - LF Chow
5 10 15 20 25
+/-+/+
20
30
40
50
60
Age (weeks)
Mas
s (g
ram
s)
(b)
Female - HF Chow
4 8 12 16
+/-+/+
20
30
40
50
60
Age (weeks)
Mas
s (g
ram
s)
82

Figure 22 Female Sim1 deficient mice are obese.
Female Sim1 deficient and wild-type mice were weaned at three weeks onto either a LF chow diet (a) or a HF diet (b). Weight was recorded weekly. (a) +/- n=14, +/+ n=14. (b) +/- n=8, +/+ n=11. Each point represents the mean +/- SEM.
83

Figure 23 (a)
Length - LF Chow
Male +/-
Male +/
+
Female
+/-
Female
+/+
9.0
9.5
10.0
10.5
11.0Le
ngth
(cm
)
(b)
Length - HF Chow
Male +/-
Male +/
+
Female
+/-
Female
+/+
9.0
9.5
10.0
10.5
11.0
Leng
th (c
m)
84

Figure 23 Sim1 deficient mice are long.
Terminal length was measured in both male and female +/- and +/+ mice on the (a) LF diet (6 months old), Male +/- n=7, Male +/+ n=10, Female +/- n=9 and Female +/+ n=8 or (b) HF diet (4 months old), Male +/- n=9, Male +/+ n=11, Female +/- n=7 and Female +/+ n=11. All are p<.01 and each bar is the mean +/- SEM.
85
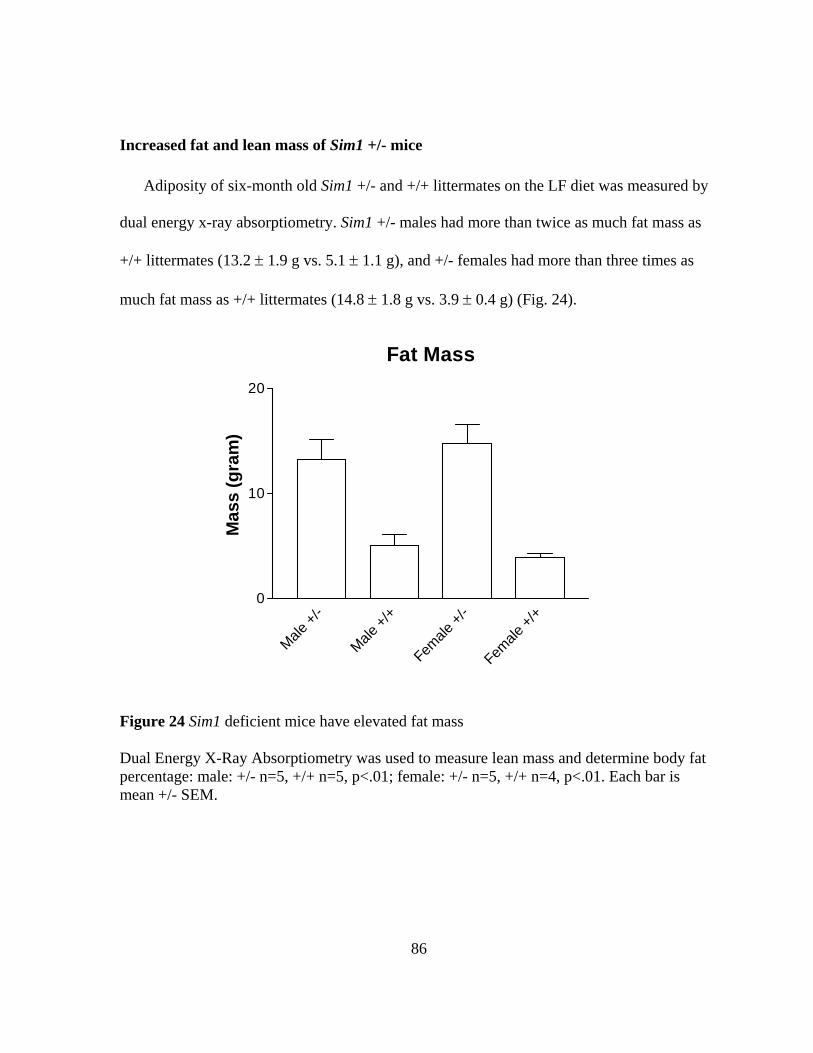
Increased fat and lean mass of Sim1 +/- mice
Adiposity of six-month old Sim1 +/- and +/+ littermates on the LF diet was measured by
dual energy x-ray absorptiometry. Sim1 +/- males had more than twice as much fat mass as
+/+ littermates (13.2 ± 1.9 g vs. 5.1 ± 1.1 g), and +/- females had more than three times as
much fat mass as +/+ littermates (14.8 ± 1.8 g vs. 3.9 ± 0.4 g) (Fig. 24).
Fat Mass
Male +/
-
Male +/
+
Female
+/-
Female
+/+
0
10
20
Mas
s (g
ram
)
Figure 24 Sim1 deficient mice have elevated fat mass
Dual Energy X-Ray Absorptiometry was used to measure lean mass and determine body fat percentage: male: +/- n=5, +/+ n=5, p<.01; female: +/- n=5, +/+ n=4, p<.01. Each bar is mean +/- SEM.
86

Lean mass of both male and female +/- mice was also elevated by more than 20%
compared to +/+ littermates (Fig. 25a), consistent with their increased length. The percent
body fat of Sim1 +/- mice of either sex was greater than +/+ littermates, with females more
severely affected (37.1% vs. 15.6%) than males (29.3% vs. 16%) (Fig. 25b). Thus the
increased weight of Sim1 +/- mice was primarily due to increased body fat.
87

Figure 25
(a)
Lean Mass
Male +/
-
Male +/
+
Female
+/-
Female
+/+
0
10
20
30
40M
ass
(gra
m)
(b)
Body Fat %
Male +/
-
Male +/
+
Female
+/-
Female
+/+
0
10
20
30
40
%
88

Figure 25. Sim1 deficient mice have greater lean mass and percentage of body fat. Dual Energy X-Ray Absorptiometry was used to measure lean mass (a) and determine body fat percentage (b): male: +/- n=5, +/+ n=5, p<.01; female: +/- n=5, +/+ n=4, p<.01. Each bar is mean +/- SEM.
89

Mice with obesity due to leptin or leptin receptor deficiency have markedly increased
bone mineral density (BMD) (Ducy, Amling et al. 2000). We therefore measured whole body
BMD of the Sim1 +/- mice but found no significant difference compared to +/+ littermates
for either sex (Fig. 26).
Bone Mineral Density
Male +/
-
Male +/
+
Female
+/-
Female
+/+
0.000
0.025
0.050
0.075
mg/
cm2
Figure 26 Bone Mineral Density of Sim1 deficient mice is normal. Dual Energy X-Ray Absorptiometry was used to measure bone mineral density (BMD): male: +/- n=5, +/+ n=5; female: +/- n=5, +/+ n=4 each bar is mean +/- SEM.
90

Altered feeding behavior of Sim1 +/- mice
I measured daily food intake of mice on the LF chow diet over a five day period (Fig.
27 and 28, first data point). Both male and female Sim1 +/- mice consumed 14% more food
per day than +/+ littermates (male: 4.2 ± 0.1 g vs. 3.7 ± 0.1 g, female: 4.0 ± 0.1 g vs. 3.5 ±
0.1 g).
I then challenged these same mice with the HF diet for a seven day period. On the
first day, there was an obvious difference between +/- and +/+ littermates. Male +/- mice had
an insignificant increase in the mass of food consumed (5 ± 5%) while male +/+ littermates
decreased their food intake (-16 ± 5%). Females had a similar response to elevated dietary
fat: +/- mice had an insignificant increase in the mass of food consumed (4 ± 5%) compared
with a decrease in food consumption by +/+ littermates (-18 ± 5%).
Food consumption was summed over the final five days of the HF diet, after daily
food consumption stabilized (Fig 27 and 28, 1st shaded area). In contrast to the small increase
in the mass of food consumed on the LF diet, female +/- mice consumed 68% more food than
the female +/+ littermates (16.9 ± 0.6 g vs. 10.0 ± 0.5 g). Males had a similar response to the
HF diet: +/- mice consumed 46% more food than +/+ littermates (18.3 ± 0.5 g vs. 12.5 ± 0.5
g). Thus on a per-gram basis there was a 3 to 4-fold increase on the HF versus the LF diet in
the percent difference in food intake by +/- versus +/+ animals. Taking into account the
higher caloric content of the HF diet, male +/- mice consumed +57% and females +49%
more energy on the HF diet than on the LF diet. By contrast, +/+ mice consumed only +20%
(males) or +21% (females) more energy on the HF diet than on the LF diet.
91

92
The mice were then switched back to the LF diet. Food intake decreased
substantially, with no significant difference between +/- and +/+ mice. This drop in food
consumption was presumably due to decreased palatability. Food consumption gradually
returned to normal over the next week. When the mice were rechallenged with the HF diet
for one week, the same abnormal feeding response was observed in +/- mice of either sex.
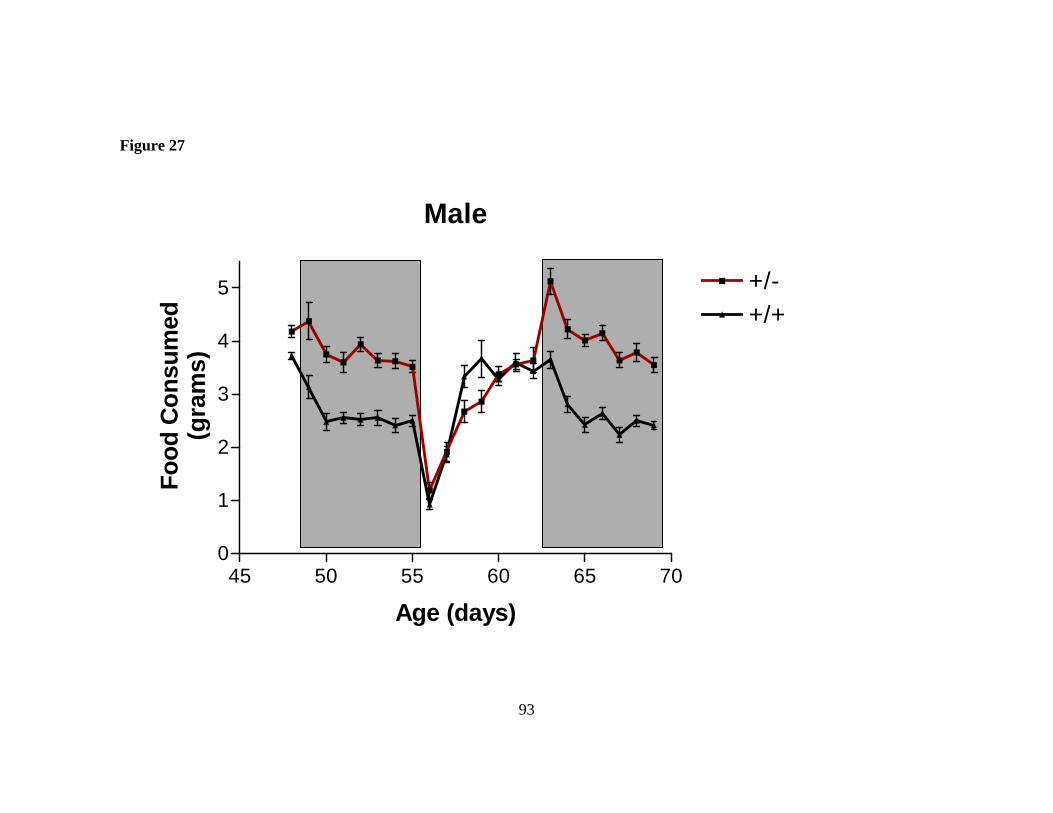
93
Male
45 50 55 60 65 700
1
2
3
4
5 +/-+/+
Age (days)
Food
Con
sum
ed(g
ram
s)
Figure 27

94
Figure 27 Male Sim1 deficient mice are hyperphagic.
Food intake of Sim1 +/- and +/+ mice was measure on a daily basis. The first data point represents the daily average of five days on the LF diet. The shaded regions represent food intake on the HF diet. +/- n=8, +/+ n=9. All points are mean +/- SEM.

95
Female
45 50 55 60 65 700
1
2
3
4
5 +/-+/+
Age (days)
Food
Con
sum
ed(g
ram
s)
Figure 28

Figure 28 Female Sim1 deficient mice are hyperphagic.
Food intake of Sim1 +/- and +/+ mice was measure on a daily basis. The first data point represents the daily average of five days on the LF diet. The shaded regions represent food intake on the HF diet. +/- n=10, +/+ n=9. All points are mean +/- SEM.
96

Increased feeding efficiency and normal activity of Sim1 +/- mice
Feeding efficiency was increased in mice fed either the LF or HF diet (Fig. 29). Male
+/- mice had 2.5-fold or 1.9-fold greater feeding efficiency than male +/+ littermates on the
LF or HF diet, respectively. Female +/- mice had twofold or threefold greater feeding
efficiency than female +/+ littermates on the LF or HF diet, respectively. Sim1 +/- mice of
either sex showed modestly decreased wheel-running activity on both the LF and HF diets
(Fig. 30); the differences were not statistically significant.
97
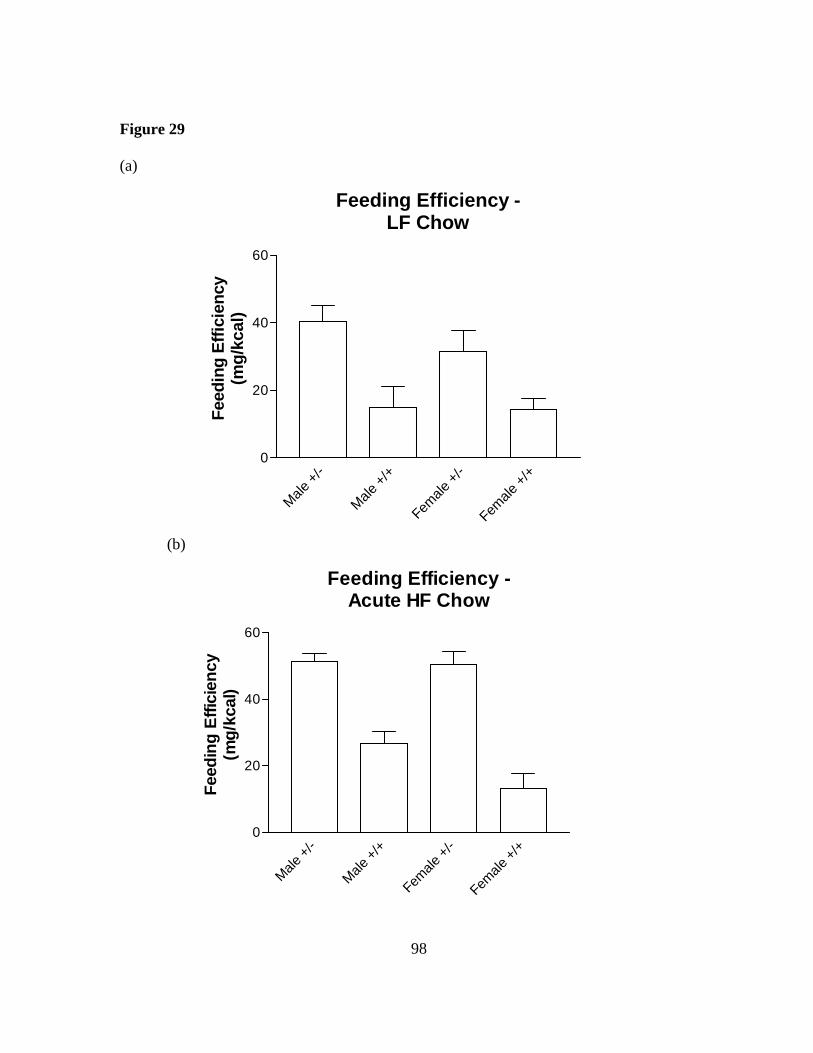
Figure 29 (a)
(b)
Feeding Efficiency -LF Chow
Male +/
-
Male +/
+
Female
+/-
Female
+/+
0
20
40
60
Feed
ing
Effic
ienc
y(m
g/kc
al)
Feeding Efficiency -Acute HF Chow
Male +/
-
Male +/
+
Female
+/-
Female
+/+
0
20
40
60
Feed
ing
Effic
ienc
y(m
g/kc
al)
98

Figure 29 Sim1 deficient mice have altered feeding efficiency. (a) Male +/-, n=9; male +/+, n=6, p=.01; female +/-, n=7; female +/+, n=10, p=.02 (b) Male +/-, n=8; male +/+, n=9, p<.001; female +/-, n=10; female +/+, n=9, p<.001. Bars are mean +/- SEM.
99

Figure 30
(a)
Wheel Running - LF Chow
Male +/
-
Male +/
+
Female
+/-
Female
+/+
0
50000
100000
150000
200000
Rev
olut
ions
(b)
Wheel Running - HF Chow
Male +/
-
Male +/
+
Female
+/-
Female
+/+
0
50000
100000
150000
200000
Rev
olut
ions
100

Figure 30 Activity of Sim1 deficient mice. Activity of Sim1 deficient and wild-type littermates was determined by voluntary wheel running. Data was collected over a five day period on both the LF(a) and HF(b) diets. Male +/- n=4, male +/+ n=4, female +/- n=5 and female +/+ n=5.
101

Elevated serum insulin and leptin levels in Sim1 +/- mice
Serum glucose levels of six month old Sim1 +/- or +/+ mice on the LF diet were not
significantly different (Fig. 31). Female but not male +/- mice weaned onto the HF diet had
slightly, yet significantly, elevated serum glucose levels compared with +/+ littermates (185
± 10 mg/dL vs. 162 ± 7 mg/dL; Fig 31b). Sim1 +/- mice had elevated serum insulin levels on
the LF diet compared with +/+ littermates (Fig 32a). Weaning onto the HF chow diet
increased the serum insulin levels of both +/- and +/+ mice; they did not differ significantly
(Fig. 32b). Serum leptin levels were elevated in Sim1 +/- mice on the LF diet compared to
+/+ littermates (Fig. 33a). On the HF diet, there was no difference between Sim1 +/- males
and +/+ males (Fig. 33b). There was a tendency of elevated serum Leptin for the female +/-
mice versus Sim1 +/+.
102
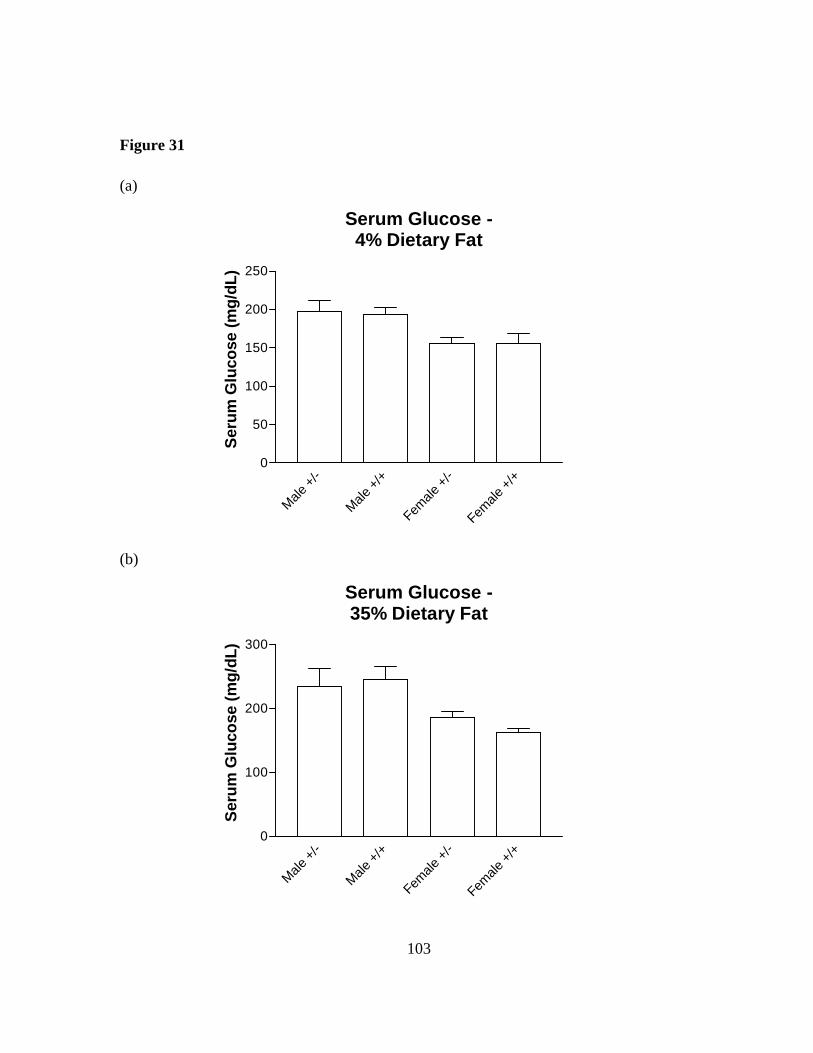
Figure 31 (a)
Serum Glucose -4% Dietary Fat
Male +/
-
Male +/
+
Female
+/-
Female
+/+
0
50
100
150
200
250
Seru
m G
luco
se (m
g/dL
)
(b)
Serum Glucose -35% Dietary Fat
Male +/
-
Male +/
+
Female
+/-
Female
+/+
0
100
200
300
Seru
m G
luco
se (m
g/dL
)
103

Figure 31. Serum glucose in Sim1 deficient mice.
Serum glucose was determined in male and female mice fed either (a) LF chow (six months old), male +/- n=8, male +/+ n=12, female +/- n=8, female +/+ n=10 or (b) HF chow (four months old) male +/- n=8, male +/+ n=10, female +/- n=8, female +/+ n=10, p<.05. Bars are the mean +/- SEM.
104

Figure 32 (a)
Serum Insulin - LF Chow
Male +/
-
Male +/
+
Female
+/-
Female
+/+
0
10
20
30Se
rum
Insu
lin (n
g/m
L)
(b)
Serum Insulin - HF Chow
Male +/
-
Male +/
+
Female
+/-
Female
+/+
0
100
200
300
400
Seru
m In
sulin
(ng/
mL)
105

Figure 32. Serum insulin is elevated in Sim1 deficient mice.
Serum insulin was determined in male and female mice fed either (a) LF chow (six months old), male +/- n=10, male +/+ n=10, p<.01, female +/- n=8, female +/+ n=10, p<.01 or (b) HF chow (four months old) male +/- n=9, male +/+ n=10, female +/- n=8, female +/+ n=10. Bars are the mean +/- SEM.
106
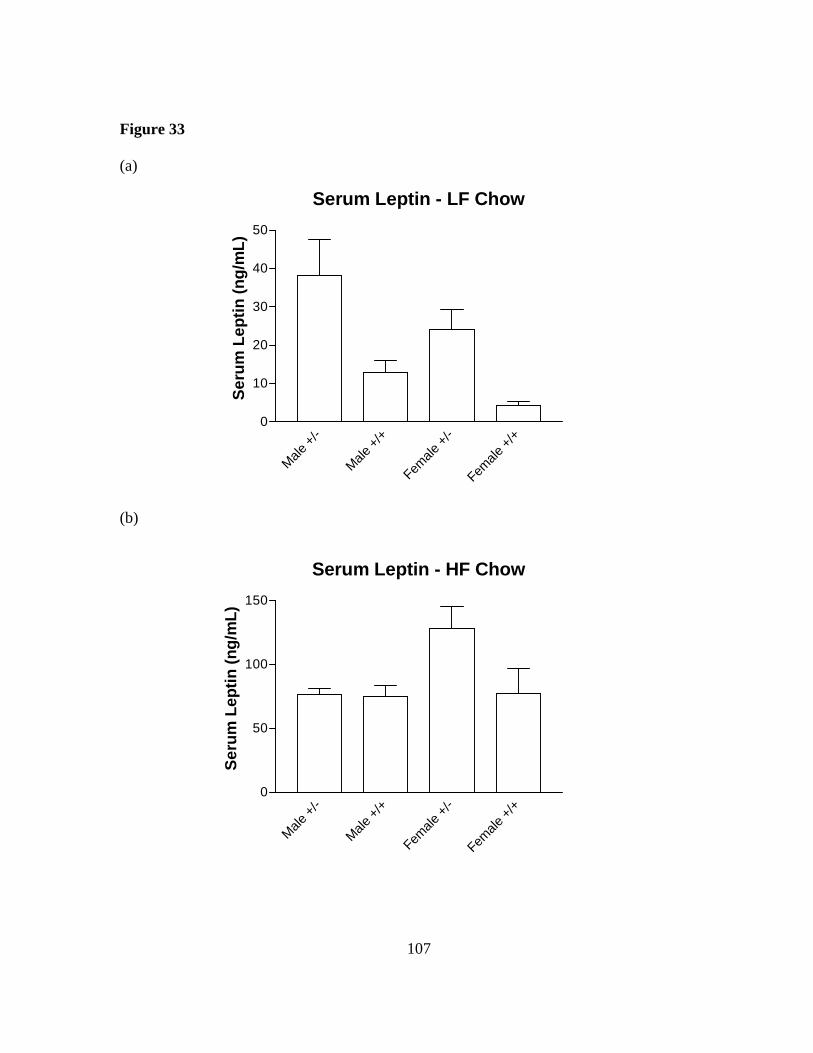
Figure 33 (a)
Serum Leptin - LF Chow
Male +/
-
Male +/
+
Female
+/-
Female
+/+
0
10
20
30
40
50Se
rum
Lep
tin (n
g/m
L)
(b)
Serum Leptin - HF Chow
Male +/
-
Male +/
+
Female
+/-
Female
+/+
0
50
100
150
Seru
m L
eptin
(ng/
mL)
107

Figure 33. Serum leptin is ELEVATED in Sim1 deficient mice.
Serum leptin was determined in male and female mice fed either (a) LF chow (six months old), male +/- n=8, male +/+ n=12, p<.01, female +/- n=6, female +/+ n=8, p<.001 or (b) HF chow (four months old) male +/- n=9, male +/+ n=9, female +/- n=8, female +/+ n=10. Bars are the mean +/- SEM.
108

Expression of Sim1 in the hypothalamus
Michaud and colleagues reported that in newborn mice, Sim1 expression in the
hypothalami of mice is limited to the PVH and SON (Michaud, Rosenquist et al. 1998).
Subsequent reports suggested that Sim1 was also expressed in other regions of the
hypothalamus in adult mice . In collaboration with Ralph DiLeone (Psychiatry, UT
Southwestern), the expression pattern of Sim1 in the mouse hypothalamus was investigated
by RNA in situ hybridization (Fig. 34). In addition to the PVH and SON, Sim1 expression
was identified in the hypothalamus within the lateral hypothalamic area (LHA) as well as the
dorsal medial hypothalamus (DMH). As discussed in Chapter 1, both of these nuclei have
been implicated in regulation of proper weight regulation and feeding behavior.
109

Figure 34
(a)
(b)
110

Figure 34. Sim1 expression in the adult mouse DMH and LHA
Sim1 expression by RNA in situ hybridization in the (a) DMH and (b) LHA. Cells stained blue express Sim1.
111

Discussion Sim1 haploinsufficiency causes obesity in mice. The phenotype initially appeared to
be milder than that we observed in SW116, whose growth curve was comparable to those of
humans with other monogenic forms of obesity. For example, the girl became obese during
infancy, whereas obesity was not evident in Sim1 +/- mice fed a standard rodent chow diet
until around the time of sexual maturity (~5-6 weeks of age). However, weaning the mutant
mice on a high-fat diet significantly enhanced the obesity phenotype. I surmise that high
dietary fat content also played a role in our patient’s obesity, although her food intake could
not be accurately measured. In addition to the diet effect, there was also a gender difference
in the hyperphagia of Sim1-deficient mice, with females more severely affected than males.
The gender of our patient with a heterozygous SIM1 mutation may have been a factor in the
severity of her phenotype, although this cannot be examined unless other humans with SIM1
mutations are identified.
Although mutations in many genes have been shown to cause obesity in mice,
interactions of these genes with the environment have only recently been intensively studied.
Mc4r-deficient mice are also exquisitely sensitive to an acute increase in dietary fat (Butler,
Marks et al. 2001). Homozygotes significantly increase their caloric intake when acutely
provided a diet with moderately elevated fat, while wild-type controls remain isocaloric. By
contrast, leptin deficient mice respond normally to an acute increase in dietary fat (Butler,
Marks et al. 2001). Sim1 +/- mice similarly have a dramatic rise in caloric consumption when
switched from the LF to HF chow diet compared with wild-type littermates. When examining
the mass of food consumed, wild-type mice decreased the mass of food they consumed
112

substantially when switched from the LF chow to the HF chow. Sim1 +/- mice decreased the
mass of food they consumed only slightly compared with wild-type littermates; therefore,
Sim1 deficient mice appear to be somewhat resistant to the normal homeostatic response to
elevated dietary fat.
Sim1 and Mc4r deficient mice are the only mice reported with obesity, increased
linear growth and altered response to elevated dietary fat (Table III). By contrast, leptin-
deficient mice show stunted linear growth and a normal response to dietary fat. Leptin
deficient mice also show increased bone mineral density (BMD). Our patient with a
heterozygous SIM1 mutation had an elevated bone mineral density at age 67 months (t-score
+2.3 S.D., age matched), while the Sim1 +/- mice had normal BMD. Interestingly, a similar
species difference may be true for MC4R signaling defects: patients with MC4R mutations
generally have elevated BMD (Farooqi, Yeo et al. 2000), while BMD is normal in Ay mice
(Ducy, Amling et al. 2000), which are deficient in central melanocortin signaling.
There are some differences between the mouse Sim1 and Mc4r mutant phenotypes.
Metabolic rate was significantly lower in Mc4r deficient mice compared to controls, as
reflected by their markedly increased feeding efficiency (Butler, Marks et al. 2001). By
contrast, feeding efficiency of Sim1 +/- mice was only modestly increased. Furthermore, the
metabolic abnormality of Mc4r-deficient mice but not Sim1-deficient mice was exacerbated
by an acute increase in dietary fat (Butler, Marks et al. 2001). Mc4r -/- mice on a moderate
fat diet showed decreased wheel running activity versus controls (Butler, Marks et al. 2001),
whereas Sim1 +/- mice on either a HF or LF diet did not show significant decreases in
activity although there was a trend for decreased activity.
113

Table IV. Comparison of Sim1 deficient mice with Mc4r and leptin deficient mice
Sim1 Mc4r leptin Obesity Moderate Moderate Severe Linear growth Long Long Short Feeding Hyperphagic Hyperphagic Hyperphagic Energy expenditure ?????? Hypometabolic Hypometabolic Insulin Elevated Elevated Elevated Glucose Normal Elevated Elevated Acute high dietary fat food intake
Abnormal Abnormal Normal
Bone Mineral Content
Normal Normal Elevated
The similar growth and feeding behavior phenotypes of Sim1 and Mc4r mutant mice
strengthens the notion that these two genes may act within the same hypothalamic pathway(s)
(Holder, Butte et al. 2000). Whether there is a molecular interaction between the two genes is
not known. Mc4r mRNA levels in the hypothalami of Sim1 +/- mice appear to be normal
(unpublished data), suggesting that Mc4r is not a direct Sim1 transcriptional target. In P1
mice, Sim1 is expressed in the paraventricular (PVH) and supraoptic nuclei (SON) of the
hypothalamus. The PVH has been implicated in regulation of feeding by lesioning studies.
Interestingly, rats with hyperphagic obesity due to electrolytic PVH lesions showed the same
diet and gender effects as Sim1 +/- mice (Kirchgessner and Sclafani 1988). However, Sim1
may act outside the PVH to influence feeding behavior. We detected Sim1 expression in adult
mice in the PVH as well as the lateral (LHA) and dorsomedial hypothalamus (DMH) and the
amygdala, brain regions that are also implicated in feeding behavior. The PVH, SON, DMH
114

and LHA all express Mc4r (Mountjoy, Mortrud et al. 1994). Whether Sim1 and Mc4r are
coexpressed in neurons is unknown and warrants further study.
The phenotype of an independent mouse Sim1 null mutation has been previously
reported (Michaud, Boucher et al. 2001). Heterozygotes developed hyperphagic obesity, with
normal activity and energy expenditure. The effects of dietary changes on the phenotype were
not examined. Homozygotes died shortly after birth (Michaud, Rosenquist et al. 1998). They
lacked all PVH neurons, as judged by the absence of CRH, TRH, oxytocin, vasopressin, or
somatostatin immunostaining. Heterozygotes were reported to have a 24% decrease in overall
PVH cellularity compared to controls, with no specific neuronal subtype affected; the +/-
phenotype was attributed to this PVH hypocellularity.
However, there are reasons to doubt that diminution in PVH cells is the sole cause of
obesity in these mice. First, even complete bilateral PVH lesions in weanling female rats did
not result in hyperphagia or increased linear growth, suggesting that the newborn
hypothalamus has functional plasticity and can compensate for congenital lesions with regard
to energy balance (Bernardis 1984). Second, mutations in necdin, a Prader-Willi syndrome
candidate gene, reduced the number of neurons of the PVH without causing hyperphagia or
obesity (Muscatelli, Abrous et al. 2000). Third, as noted previously, we detected Sim1
expression in regions of the brain outside the PVH that also influence feeding behavior.
Selective inactivation of Sim1 using a cre-loxP system (Tsien, Chen et al. 1996) might tease
apart its function in different hypothalamic and brain regions. Regardless of the precise
mechanism of obesity in Sim1 +/- mice, these animals provide an excellent model for human
115

hyperphagic obesity and gene x environment interactions that influence the propensity toward
obesity in response to a high fat diet.
116

Chapter 6
Conclusions and Future Directions
SIM1 is a novel obesity gene
The combined evidence from the human subject with a mutation in SIM1 and the
mice engineered to be deficient for Sim1 strongly indicates that SIM1 is a novel obesity gene.
Both the human and mouse phenotypes suggest that the obesity is primarily due to
hyperphagia and not metabolic deficiency. This obesity is due to a dominant
haploinsufficieny in contrast to most monogenic obesities which are due to recessive loss of
function mutations such as leptin and the leptin receptor. In fact, only mutations in MC4R
and SIM1 are known dominant causes of obesity. This suggests that changes in dosages in
these genes, at least a fifty percent decrease, can result in dramatic changes in weight, such as
the early-onset obesity observed in humans with SIM1 or MC4R mutations. Common
polymorphisms either in the coding region of these genes that cause subtle differences in
molecular activity or in the promoters that subtly change expression levels could be
responsible, in part, for elevated susceptibility to common obesity. It would be of interest to
screen a large population of individuals with common obesity for association with a SIM1
polymorphism.
In addition to obesity, Sim1 deficient mice are significantly longer than wild-type
mice which parallels the elevated linear growth of SW116. The mechanism of this increase in
linear growth is not clear. Not all mice with early-onset obesity are longer than wild-type
mice. Leptin deficient mice are significantly shorter while Mc4r deficient mice are longer
117

than wild-type littermates. Ay mice are also significantly longer than wild-type mice, and it
has been reported that there is a transient increase in IGF-1 levels in these mice at four weeks
of age (Wolff, Kodell et al. 1999). It has been proposed that this transient elevation causes
the increased length of Ay mice. IGF-1 expression is regulated by the pulsatile release of
growth hormone from the pituitary, and IGF-1 is released primarily by the liver. Growth
hormone release is regulated by growth hormone releasing hormone from the hypothalamus.
How deficiency of MC4R causes changes in this pathway and whether similar changes occur
in Sim1 deficient mice is unknown.
Sim1 and Diet Induced Obesity
The recent rise in the prevalence of obesity in the United States and other developed
countries has been due in large part to change in amount and composition of food consumed.
Caloric-dense food rich in triglycerides have become a much larger proportion of the diet of
most in the United States possibly due to easy access of fast foods. Because of this, mouse
models of diet-induced obesity are potentially particularly useful in examining the
physiology and genetics of hyperphagia and obesity.
One mouse model of diet-induced obesity is the C57bl/6J inbred strain (Lin, Thomas
et al. 2000). These mice display a significant rise in mass and adiposity when chronically
place on a high fat diet. The obesity is due in large part to hyperphagia as displayed by
elevated caloric intake. Recently, the molecular consequences of an acute shift to a high fat
diet were examined in C57bl/6J mice (Ziotopoulou, Mantzoros et al. 2000). When mice of
this strain were shifted to a high fat diet for two days, no significant change in body weight
118

was observed. However, careful examination of the expression of transcripts encoding both
orexigenic and anorexigenic peptides revealed changes that are an apparent attempt to remain
isocaloric. Npy expression decreased to 30% of normal and Agrp levels fell to 50% of that of
mice chronically fed a low fat diet. Both Npy and Agrp are orexigenic neuropeptides that are
largely coexpressed in the same neurons of the arcuate nucleus. The mechanism of this
transcriptional control in response to an acute elevation in dietary fat is unknown.
It would be interesting to examine the expression of Npy and Agrp in Sim1 deficient
mice acutely fed a high fat diet. As demonstrated in chapter 5, Sim1 deficient mice fail to
adequately suppress the mass of food they consume when acutely switched to the high fat
diet. Whether this is because of a lack of normal suppression of Npy or Agrp expression is
not known and deserves further investigation. The resistance of Sim1 deficient mice could
also be due to inability of these mice to properly respond to changes in Npy or Agrp
concentrations. This seems a more likely explanation as both Npy and Agrp are expressed in
the arcuate nucleus were Sim1 is not expressed. Receptors for both Npy (Npy1r and Npy5r)
and Agrp (Mc4r) are expressed in the PVH where Sim1 is highly expressed. Either changes
of expression of these receptors or downstream signaling components could possibly explain
the resistance of Sim1 deficient mice to elevated dietary fat. Indeed as discussed earlier, Mc4r
deficient mice have a similar syndrome of resistance to elevated dietary fat.
It is not clear what the signal from the periphery to the hypothalumus is that causes
the changes in neuropeptide expression mentioned above. It has been demonstrated that
leptin levels are slightly elevated two days after an acute shift to a high fat diet (Ziotopoulou,
Mantzoros et al. 2000). Elevated leptin levels would be consistent with a decrease in
119
expression of Npy and Agrp as intracerbroventricular injection of leptin causes reduced
expression of Npy and Agrp (Korner, Savontaus et al. 2001). However, ob/ob mice deficient
in leptin respond normally to elevated dietary fat (Butler, Marks et al. 2001). This suggests
that leptin is not necessary for the normal acute homeostatic response to dietary fat.
Future Directions
One important question not answered by this work is the mechanism by which SIM1
deficiency results in hyperphagia and obesity. No transcriptional targets of SIM1 have been
identified. Chapter 4 outlines one approach for identifying genes whose transcription are
regulated by SIM1. Other approaches might also address this problem.
Tissue from Sim1 deficient mice could be used in cDNA microarray or subtractive
hybridization experiments. Dissected hypothalami from Sim1 heterozygous deficient mice
and wild-type littermates might be used as a source of RNA for these expression profiling
experiments. Heterozygous null mice would be preferred over homozygous null mice due to
the incorrect development of the paraventricular hypothalamus of null mice. However, direct
targets of Sim1 might only have a fifty percent reduction of expression within the neurons
which coexpress the target gene and Sim1. Even in the context of dissected hypothalami,
neurons might express the target gene and not Sim1. This would cause significant
background expression which would make interpreting microarray or subtractive
hybridization experiments difficult. Another option is to examine expression in kidney from
Sim1 null mice versus wild-type littermates. Although Sim1 null mice die within twenty-four
hours of birth, there is not an obvious defect in kidney structure in newborn mice. This is in
120
contrast to the brain of Sim1 null mice which lack the neurons of the PVH and SON. The
kidney is also a simpler structure than the brain with fewer unique cell types potentially
simplifying problems with background expression. Although the kidney is an attractive
option as a source of tissue for expression profiling, Sim1 target genes in the kidney could
potentially be different than target genes in the hypothalamus. Nevertheless, cDNA
microarray or subtractive hybridization experiments could complement cell culture
experiments for identifying Sim1 transcriptional targets.
Another option for searching for target genes would be to create mice that over-
express Sim1 in the correct tissue specific pattern as endogenous expression. This might best
be done using BAC transgenesis as no promoter has been characterized with precisely the
same expression pattern as Sim1. A BAC transgene with sufficient sequence 5’ to the first
exon of Sim1 and 3’ to the untranslated region might express the transgene in the correct
nuclei of the hypothalamus (Heintz 2001). Use of BAC transgenes has previously been
demonstrated to be useful for precise overexpression in mice (Yang, Wynder et al. 1999).
With integration of multiple copies of the transgene, Sim1 expression might be greatly
elevated and more dramatically change the expression of target genes in the hypothalamus
compared with wild-type littermates. It would also be of interest to study the physiology of
mice which overexpress Sim1 with respect to whole body mass, feeding behavior and linear
growth which are all significantly altered in Sim1 deficient mice. Over-expression of Sim1
could result in a converse phenotype to the deficient mice including decreased mass and
length compared with wild-type littermates and depressed food consumption.
121

The biochemistry of Sim1 has not been studied in detail and could yield insight into
its function in feeding behavior and weight regulation. Many PAS proteins have ligands
which are critical to their function. For mammalian PAS proteins, this is best exemplified by
the Aryl hydrocarbon receptor (Ahr). The Ahr binds cyclic hydrocarbons in the liver such as
the toxin dioxin to activate the transcription of detoxification enzymes (Gu, Hogenesch et al.
2000). Within the CNS, NPAS2 has been shown to bind lactate to regulate its transcriptional
activity (Rutter, Reick et al. 2001). Whether Sim1 binds a ligand to regulate its
transcriptional activity is not known. Although it behaves as a transcriptional activator in cell
culture without a specific activator added, the ligand could be a metabolic factor, such as
lactate for NPAS2, which is present in the cell culture media or manufactured within the cell
in sufficient quantities to allow Sim1 to act as a transcriptional activator in this assay.
Mammalian PAS proteins have been shown to be regulated by phosphorylation to
control its activity. The PER2 (Period) protein is phosphorylated by casein kinase I ε and
humans with mutations in a CKIε phosphorylation site of PER2 have a sleep disturbance
known as Famalial Advanced Sleep Phase Syndrome (Toh, Jones et al. 2001). These
individuals have an advanced circadian rhythm such that they tend to begin sleeping earlier
than unaffected individuals and wake earlier. Whether SIM1 is phosphorylated in some
physiologic circumstances for regulation of its functions has not been studied in detail.
Further studies of SIM1’s biochemistry and identification of genes whose expression
are regulated by SIM1 as outlined in this chapter could clarify its role in feeding behavior
and body weight regulation.
122

Bibliography
Abbott, C. R., M. Rossi, et al. (2001). "Evidence of an orexigenic role for cocaine- and
amphetamine-regulated transcript after administration into discrete hypothalamic nuclei."
Endocrinology 142(8): 3457-63.
Ahima, R. S. and S. M. Hileman (2000). "Postnatal regulation of hypothalamic neuropeptide
expression by leptin: implications for energy balance and body weight regulation." Regul
Pept 92(1-3): 1-7.
Bernardis, L. L. (1984). "Paraventricular nucleus lesions in weanling female rats result in
normophagia, normal body weight and composition, linear growth and normal levels of
several plasma substrates." Physiol Behav 32(3): 507-10.
Boggon, T. J., W. S. Shan, et al. (1999). "Implication of tubby proteins as transcription
factors by structure- based functional analysis." Science 286(5447): 2119-25.
Butler, A. A., D. L. Marks, et al. (2001). "Melanocortin-4 receptor is required for acute
homeostatic responses to increased dietary fat." Nat Neurosci 4(6): 605-11.
Chen, A. S., D. J. Marsh, et al. (2000). "Inactivation of the mouse melanocortin-3 receptor
results in increased fat mass and reduced lean body mass." Nat Genet 26(1): 97-102.
123

Chrast, R., H. S. Scott, et al. (1997). "Cloning of two human homologs of the Drosophila
single-minded gene SIM1 on chromosome 6q and SIM2 on 21q within the Down syndrome
chromosomal region." Genome Res 7(6): 615-24.
Clement, K., C. Vaisse, et al. (1998). "A mutation in the human leptin receptor gene causes
obesity and pituitary dysfunction." Nature 392(6674): 398-401.
Coleman, D. L. (1973). "Effects of parabiosis of obese with diabetes and normal mice."
Diabetologia 9(4): 294-8.
Coleman, D. L. and K. P. Hummel (1969). "Effects of parabiosis of normal with genetically
diabetic mice." Am J Physiol 217(5): 1298-304.
De Simone, M., G. Farello, et al. (1995). "Growth charts, growth velocity and bone
development in childhood obesity." Int J Obes Relat Metab Disord 19(12): 851-7.
Ducy, P., M. Amling, et al. (2000). "Leptin inhibits bone formation through a hypothalamic
relay: a central control of bone mass." Cell 100(2): 197-207.
Elmquist, J. K., R. S. Ahima, et al. (1997). "Leptin activates neurons in ventrobasal
hypothalamus and brainstem." Endocrinology 138(2): 839-42.
124

Elmquist, J. K., C. F. Elias, et al. (1999). "From lesions to leptin: hypothalamic control of
food intake and body weight." Neuron 22(2): 221-32.
Ema, M., M. Morita, et al. (1996). "Two new members of the murine Sim gene family are
transcriptional repressors and show different expression patterns during mouse
embryogenesis." Mol Cell Biol 16(10): 5865-75.
Fan, C. M., E. Kuwana, et al. (1996). "Expression patterns of two murine homologs of
Drosophila single-minded suggest possible roles in embryonic patterning and in the
pathogenesis of Down syndrome." Mol Cell Neurosci 7(1): 1-16.
Farooqi, I. S., G. S. Yeo, et al. (2000). "Dominant and recessive inheritance of morbid
obesity associated with melanocortin 4 receptor deficiency." J Clin Invest 106(2): 271-9.
Garcia-Mayor, R. V., M. A. Andrade, et al. (1997). "Serum leptin levels in normal children:
relationship to age, gender, body mass index, pituitary-gonadal hormones, and pubertal
stage." J Clin Endocrinol Metab 82(9): 2849-55.
Gerald, C., M. W. Walker, et al. (1996). "A receptor subtype involved in neuropeptide-Y-
induced food intake." Nature 382(6587): 168-71.
125

Gilhuis, H. J., C. M. van Ravenswaaij, et al. (2000). "Interstitial 6q deletion with a Prader-
Willi-like phenotype: a new case and review of the literature." Europ J Paediatr Neurol 4(1):
39-43.
Good, D. J., F. D. Porter, et al. (1997). "Hypogonadism and obesity in mice with a targeted
deletion of the Nhlh2 gene." Nat Genet 15(4): 397-401.
Gu, Y. Z., J. B. Hogenesch, et al. (2000). "The PAS superfamily: sensors of environmental
and developmental signals." Annu Rev Pharmacol Toxicol 40: 519-61.
Gundlach, A. L. and T. C. Burazin (1998). "Galanin-galanin receptor systems in the
hypothalamic paraventricular and supraoptic nuclei. Some recent findings and future
challenges." Ann N Y Acad Sci 863: 241-51.
Heintz, N. (2001). "BAC to the future: the use of bac transgenic mice for neuroscience
research." Nat Rev Neurosci 2(12): 861-70.
Holder, J. L., Jr., N. F. Butte, et al. (2000). "Profound obesity associated with a balanced
translocation that disrupts the SIM1 gene." Hum Mol Genet 9(1): 101-8.
126

Hosoda, K., R. E. Hammer, et al. (1994). "Targeted and natural (piebald-lethal) mutations of
endothelin-B receptor gene produce megacolon associated with spotted coat color in mice."
Cell 79(7): 1267-76.
Huszar, D., C. A. Lynch, et al. (1997). "Targeted disruption of the melanocortin-4 receptor
results in obesity in mice." Cell 88(1): 131-41.
Jackson, R. S., J. W. Creemers, et al. (1997). "Obesity and impaired prohormone processing
associated with mutations in the human prohormone convertase 1 gene." Nat Genet 16(3):
303-6.
Jacques, D., Y. Tong, et al. (1996). "Expression of the neuropeptide Y Y1 receptor mRNA in
the human brain: an in situ hybridization study." Neuroreport 7(5): 1053-6.
Kirchgessner, A. L. and A. Sclafani (1988). "PVN-hindbrain pathway involved in the
hypothalamic hyperphagia-obesity syndrome." Physiol Behav 42(6): 517-28.
Kleyn, P. W., W. Fan, et al. (1996). "Identification and characterization of the mouse obesity
gene tubby: a member of a novel gene family." Cell 85(2): 281-90.
Korner, J., E. Savontaus, et al. (2001). "Leptin regulation of Agrp and Npy mRNA in the rat
hypothalamus." J Neuroendocrinol 13(11): 959-66.
127
Krude, H., H. Biebermann, et al. (1998). "Severe early-onset obesity, adrenal insufficiency
and red hair pigmentation caused by POMC mutations in humans." Nat Genet 19(2): 155-7.
Kushi, A., H. Sasai, et al. (1998). "Obesity and mild hyperinsulinemia found in neuropeptide
Y-Y1 receptor- deficient mice." Proc Natl Acad Sci U S A 95(26): 15659-64.
Lin, S., T. C. Thomas, et al. (2000). "Development of high fat diet-induced obesity and leptin
resistance in C57Bl/6J mice." Int J Obes Relat Metab Disord 24(5): 639-46.
Lowrey, P. L. and J. S. Takahashi (2000). "Genetics of the mammalian circadian system:
Photic entrainment, circadian pacemaker mechanisms, and posttranslational regulation."
Annu Rev Genet 34: 533-562.
Ludwig, D. S., N. A. Tritos, et al. (2001). "Melanin-concentrating hormone overexpression in
transgenic mice leads to obesity and insulin resistance." J Clin Invest 107(3): 379-86.
Majdic, G., M. Young, et al. (2002). "Knockout mice lacking steroidogenic factor 1 are a
novel genetic model of hypothalamic obesity." Endocrinology 143(2): 607-14.
128

Mercer, J. G., N. Hoggard, et al. (1996). "Localization of leptin receptor mRNA and the long
form splice variant (Ob-Rb) in mouse hypothalamus and adjacent brain regions by in situ
hybridization." FEBS Lett 387(2-3): 113-6.
Michaud, J. L., F. Boucher, et al. (2001). "Sim1 haploinsufficiency causes hyperphagia,
obesity and reduction of the paraventricular nucleus of the hypothalamus." Hum Mol Genet
10(14): 1465-73.
Michaud, J. L., T. Rosenquist, et al. (1998). "Development of neuroendocrine lineages
requires the bHLH-PAS transcription factor SIM1." Genes Dev 12(20): 3264-75.
Miller, M. W., D. M. Duhl, et al. (1993). "Cloning of the mouse agouti gene predicts a
secreted protein ubiquitously expressed in mice carrying the lethal yellow mutation." Genes
Dev 7(3): 454-67.
Moffett, P. and J. Pelletier (2000). "Different transcriptional properties of mSim-1 and
mSim-2." FEBS Lett 466(1): 80-6.
Montague, C. T., I. S. Farooqi, et al. (1997). "Congenital leptin deficiency is associated with
severe early-onset obesity in humans." Nature 387(6636): 903-8.
129
Mountjoy, K. G., M. T. Mortrud, et al. (1994). "Localization of the melanocortin-4 receptor
(MC4-R) in neuroendocrine and autonomic control circuits in the brain." Mol Endocrinol
8(10): 1298-308.
Muscatelli, F., D. N. Abrous, et al. (2000). "Disruption of the mouse Necdin gene results in
hypothalamic and behavioral alterations reminiscent of the human Prader-Willi syndrome."
Hum Mol Genet 9(20): 3101-10.
Naggert, J. K., L. D. Fricker, et al. (1995). "Hyperproinsulinaemia in obese fat/fat mice
associated with a carboxypeptidase E mutation which reduces enzyme activity." Nat Genet
10(2): 135-42.
Nestler, E. J. (2001). "Molecular neurobiology of addiction." Am J Addict 10(3): 201-17.
Norman, R. A., P. A. Tataranni, et al. (1998). "Autosomal genomic scan for loci linked to
obesity and energy metabolism in Pima Indians." Am J Hum Genet 62(3): 659-68.
Probst, M. R., C. M. Fan, et al. (1997). "Two murine homologs of the Drosophila single-
minded protein that interact with the mouse aryl hydrocarbon receptor nuclear translocator
protein." J Biol Chem 272(7): 4451-7.
130

Puffenberger, E. G., K. Hosoda, et al. (1994). "A missense mutation of the endothelin-B
receptor gene in multigenic Hirschsprung's disease." Cell 79(7): 1257-66.
Qu, D., D. S. Ludwig, et al. (1996). "A role for melanin-concentrating hormone in the central
regulation of feeding behaviour." Nature 380(6571): 243-7.
Rankinen, T., L. Perusse, et al. (2002). "The human obesity gene map: the 2001 update."
Obes Res 10(3): 196-243.
Reick, M., J. A. Garcia, et al. (2001). "NPAS2: an analog of clock operative in the
mammalian forebrain." Science 293(5529): 506-9.
Richard, D., R. Rivest, et al. (1996). "Expression of corticotropin-releasing factor and its
receptors in the brain of lean and obese Zucker rats." Endocrinology 137(11): 4786-95.
Robinson, S. W., D. M. Dinulescu, et al. (2000). "Genetic models of obesity and energy
balance in the mouse." Annu Rev Genet 34: 687-745.
Roessler, E., E. Belloni, et al. (1996). "Mutations in the human Sonic Hedgehog gene cause
holoprosencephaly." Nat Genet 14(3): 357-60.
131

Rutter, J., M. Reick, et al. (2001). "Regulation of clock and NPAS2 DNA binding by the
redox state of NAD cofactors." Science 293(5529): 510-4.
Sainsbury, A., C. Schwarzer, et al. (2002). "Important role of hypothalamic Y2 receptors in
body weight regulation revealed in conditional knockout mice." Proc Natl Acad Sci U S A
99(13): 8938-43.
Sambrook J, Fritsch EF and Maniatis T. Molecular cloning: a laboratory manual. 1989.
Sato, S., M. Nakamura, et al. (2002). "Identification of transcriptional targets for Six5:
implication for the pathogenesis of myotonic dystrophy type 1." Hum Mol Genet 11(9):
1045-58.
Schwartz, M. W., R. J. Seeley, et al. (1996). "Identification of targets of leptin action in rat
hypothalamus." J Clin Invest 98(5): 1101-6.
Shimada, M., N. A. Tritos, et al. (1998). "Mice lacking melanin-concentrating hormone are
hypophagic and lean." Nature 396(6712): 670-4.
Stunkard, A. J. (1991). "Genetic contributions to human obesity." Res Publ Assoc Res Nerv
Ment Dis 69: 205-18.
132

Stunkard, A. J., T. I. Sorensen, et al. (1986). "An adoption study of human obesity." N Engl J
Med 314(4): 193-8.
Tartaglia, L. A., M. Dembski, et al. (1995). "Identification and expression cloning of a leptin
receptor, OB-R." Cell 83(7): 1263-71.
Thomas, J. B., S. T. Crews, et al. (1988). "Molecular genetics of the single-minded locus: a
gene involved in the development of the Drosophila nervous system." Cell 52(1): 133-41.
Toh, K. L., C. R. Jones, et al. (2001). "An hPer2 phosphorylation site mutation in familial
advanced sleep phase syndrome." Science 291(5506): 1040-3.
Trivedi, P., H. Yu, et al. (1998). "Distribution of orexin receptor mRNA in the rat brain."
FEBS Lett 438(1-2): 71-5.
Tsien, J. Z., D. F. Chen, et al. (1996). "Subregion- and cell type-restricted gene knockout in
mouse brain." Cell 87(7): 1317-26.
Turleau, C., G. Demay, et al. (1988). "6q1 monosomy: a distinctive syndrome." Clin Genet
34(1): 38-42.
133

Verrotti, A., F. Basciani, et al. (1998). "Leptin levels in non-obese and obese children and
young adults with type 1 diabetes mellitus." Eur J Endocrinol 139(1): 49-53.
Villa, A., M. Urioste, et al. (1995). "De novo interstitial deletion q16.2q21 on chromosome
6." Am J Med Genet 55(3): 379-83.
Wharton, K. A., Jr., R. G. Franks, et al. (1994). "Control of CNS midline transcription by
asymmetric E-box-like elements: similarity to xenobiotic responsive regulation."
Development 120(12): 3563-9.
Wolff, G. L., R. L. Kodell, et al. (1999). "Caloric restriction abolishes enhanced metabolic
efficiency induced by ectopic agouti protein in yellow mice." Proc Soc Exp Biol Med 221(2):
99-104.
Yang, X. W., C. Wynder, et al. (1999). "BAC-mediated gene-dosage analysis reveals a role
for Zipro1 (Ru49/Zfp38) in progenitor cell proliferation in cerebellum and skin." Nat Genet
22(4): 327-35.
Yaswen, L., N. Diehl, et al. (1999). "Obesity in the mouse model of pro-opiomelanocortin
deficiency responds to peripheral melanocortin." Nat Med 5(9): 1066-70.
Zelzer, E., P. Wappner, et al. (1997). "The PAS domain confers target gene specificity of
Drosophila bHLH/PAS proteins." Genes Dev 11(16): 2079-89.
134
Zhang, Y., R. Proenca, et al. (1994). "Positional cloning of the mouse obese gene and its
human homologue." Nature 372(6505): 425-32.
Ziotopoulou, M., C. S. Mantzoros, et al. (2000). "Differential expression of hypothalamic
neuropeptides in the early phase of diet-induced obesity in mice." Am J Physiol Endocrinol
Metab 279(4): E838-45.
135

VITAE
Jimmy Lloyd Holder, Jr. was born in Houston, Texas on May 15, 1974. He graduated from
Memorial High School Magna Cum Laudein May, 1992. He attended Johns Hopkins
University from 1992 to 1996. He graduated from Johns Hopkins University in May of 1996
with a Bachelor of Arts degree in Biology. In June of 1996, Jimmy entered the Graduate
School of Biomedical Sciences Division of Cell and Molecular Biology. After completing his
first year of graduate work, he entered the Medical Scientist Training Program. Jimmy will
begin a post-doctoral fellowship in the summer of 2005 in the lab of Louis Ptacek, MD at the
University of California San Francisco.
Permanent Address: 21031 Riverside Ridge Katy, TX 77449