the belgian labour market during and after the crisis
TRANSCRIPT
89
The Belgian laBour markeT during and afTer The crisis
The Belgian labour market during and after the crisis
J. de mulderm. druant
Introduction
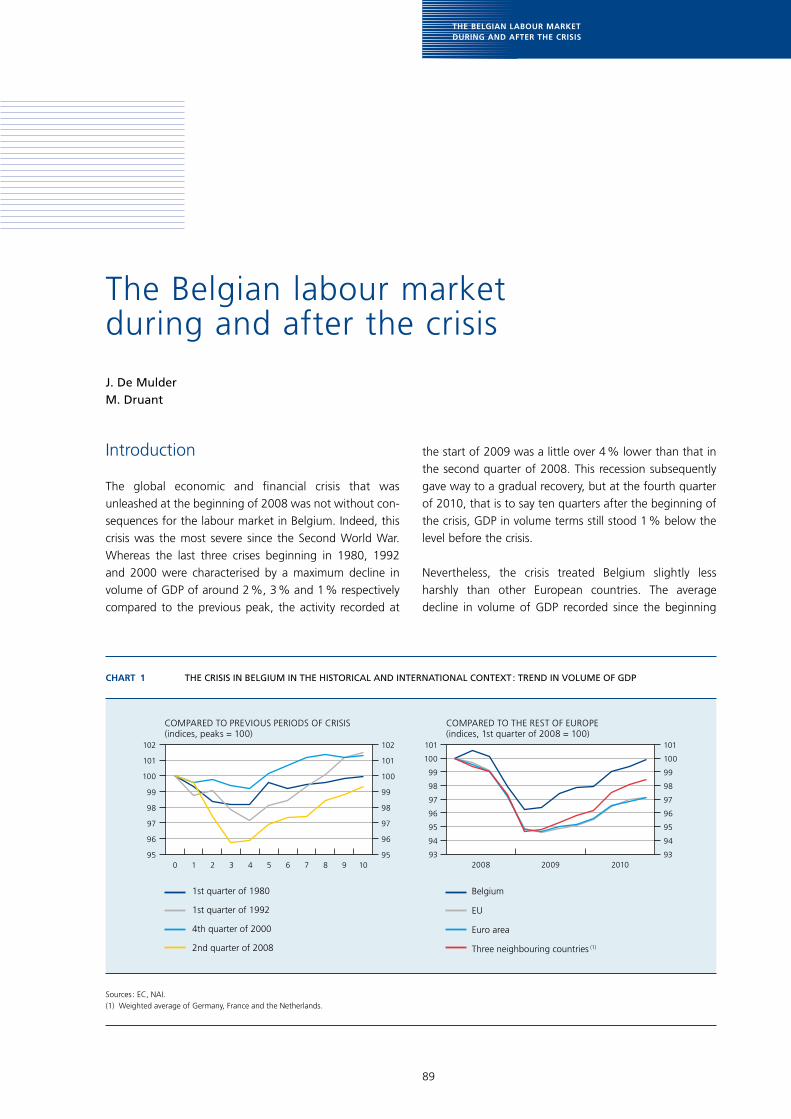
The global economic and financial crisis that was unleashed at the beginning of 2008 was not without con-sequences for the labour market in Belgium. Indeed, this crisis was the most severe since the Second World War. Whereas the last three crises beginning in 1980, 1992 and 2000 were characterised by a maximum decline in volume of GDP of around 2 %, 3 % and 1 % respectively compared to the previous peak, the activity recorded at
the start of 2009 was a little over 4 % lower than that in the second quarter of 2008. This recession subsequently gave way to a gradual recovery, but at the fourth quarter of 2010, that is to say ten quarters after the beginning of the crisis, GDP in volume terms still stood 1 % below the level before the crisis.
Nevertheless, the crisis treated Belgium slightly less harshly than other European countries. The average decline in volume of GDP recorded since the beginning
Chart 1 thE crisis in BElgium in thE historical and intErnational contExt : trEnd in volumE of gdp
10987654321095
96
97
98
99
100
101
102
95
96
97
98
99
100
101
102
2008 2009 201093
94
95
96
97
98
99
100
101
93
94
95
96
97
98
99
100
101
COMPARED TO PREVIOUS PERIODS OF CRISIS(indices, peaks = 100)
COMPARED TO THE REST OF EUROPE(indices, 1st quarter of 2008 = 100)
Belgium
EU
Euro area
Three neighbouring countries (1)
1st quarter of 1980
1st quarter of 1992
4th quarter of 2000
2nd quarter of 2008
Sources : EC, NAI.(1) Weighted average of Germany, France and the Netherlands.

90
of 2008 (1) within the EU, the euro area and Belgium’s three main neighbours – Germany, France and the Netherlands – was larger than in Belgium, amounting to more than 5 %. Activity has subsequently recovered but although growth has been stronger recently in the three neighbouring countries, it has remained less favourable within the European reference areas than in Belgium. Furthermore, the period over which GDP has showed a downturn in Belgium, which extends over three quarters, is a little shorter than in the rest of Europe.
This article looks at the impact that the crisis had on the Belgian labour market and whether that impact differs from the impact in other countries (2), whilst taking account of the differences in terms of scope and duration of the economic recession. The negative demand shock that characterised the crisis forced enterprises to reduce their costs, and more particularly to cut back on those for labour, which often constitutes the main cost factor. The article also looks into the way in which the cost of labour has been reduced : was this done by way of an adjustment in salaries or in the volume of labour ? What were the conse-quences of a possible adaptation of the volume of labour on productivity and employment ? The results of a recent study based on surveys carried out amongst enterprises established in various European countries deserve to be mentioned In this context. The results of these surveys, carried out during a period of normal growth, reveal that when faced with a decrease in demand, Belgian enterprises have a tendency to revise their prices and/or their costs downwards. A reduction in costs is mainly realised via a contraction in the volume of labour in terms of number of persons and/or number of hours per person, the reaction for salaries being, for its part, virtually zero. This type of tendency seems to be much more marked in Belgium than in the other European countries studied (cf. Dhyne and Druant, 2010). The question now is whether these results have been confirmed during the recent crisis.
Not all branches of activity and all groups of workers have been affected to the same extent by the crisis. This article attempts to determine whether the crisis has led to a fundamental alteration in the composition of employ-ment or not.
Lastly, labour – together with the stock of capital actually available and the total factor productivity – constitutes one of the three channels by which the crisis may have a
downward effect on the growth potential of the economy. In fact, there is a risk that part of the rise in unemploy-ment due to the business cycle may turn into a structural rise. This phenomenon, which is referred to as the hys-teresis effect, is explained by the fact that those persons leaving the labour market for a relatively long period see their human capital decrease, are of less interest to poten-tial employers and look less actively for a new job. Their reintegration into the labour market therefore becomes a more complicated matter. Furthermore, an unfavourable economic context may discourage potential participants in the labour market, such as young people and house-wives, therefore bringing about a fall in the activity rate. However, these unfavourable circumstances may likewise contribute to a rise in the activity rate, in that they may prompt the second non-working member of a household to join the labour market when the household in question experiences a fall in income owing to the crisis.
1. Effects of the crisis on employment
1.1 Trends in Belgium
The decline in economic activity on an annual basis was strongest during the first half of 2009, when the volume of GDP was 3.9 % lower than in the previous year. The total number of hours worked in the economy likewise showed a clear downturn during that year, of around 2 % compared to the previous year. Employment expressed as the number of persons responded after a certain time lag as is customary : the lowest level was recorded during the second half of 2009, with 0.8 % fewer workers compared to the corresponding period of the previous year.
As a result, the decline in resources used in the labour market, both in terms of number of hours of work and number of persons, proved to be much less pronounced than that in GDP. Therefore, productivity (of labour), which represents the volume of production generated per unit of the factor labour mobilised, was subject to a downward influence following the crisis. In 2008, a year characterised by GDP growth that was still positive on average, productivity per hour worked had already decreased, which is the reason why the slowdown in the rise in the total volume of labour proved markedly weaker than that for GDP. The fall in productivity continued at the start of 2009, at the height of the crisis, thus damping down the impact of the crisis on the volume of labour. From the second half of that year onwards, productivity went back to the upward structural tendency, anticipating the trend in the other variables relating to activity and the labour market.
(1) For the purpose of international comparisons, the first quarter of 2008 has been taken as the common reference point ; this corresponds to the quarter when GDP in volume was at its maximum both in the EU and the euro area and also within the three main neighbouring countries.
(2) The choice of reference countries – EU, euro area or the three neighbouring countries (Germany, Netherlands and France) – is dependent on the topic being examined.

91
The Belgian laBour markeT during and afTer The crisis
In other respects, enterprises similarly revised the duration of work per employee downwards during the crisis, which allowed the number of employed persons to evolve in a more favourable manner than the volume of labour in 2008 and 2009. When activity decreases, an enterprise has several options at its disposal in order to adapt its utilisation of labour and, consequently, labour costs. So as not to compromise the future production potential of the enterprise, an attempt is normally made to keep the workforce unchanged (labour hoarding or the practice of retaining the workforce) at the beginning of a period of economic slowdown, owing to the uncertainties sur-rounding its scope and duration, and not to make redun-dancies until the slowdown shows a tendency to persist. This is explained in particular by the fact that redundan-cies, and also possible (re-)engagements when activity picks up again, entail costs, but also by the difficulty of recruiting qualified staff for certain functions (“critical functions”) ; this problem will certainly not be improving, given demographic ageing. Naturally, a strategy of this kind can only work if the activity of the enterprise is only reduced in temporary fashion and the enterprise is suf-ficiently well-equipped to be able to exercise a profitable economic activity again once the crisis has passed.
In the first instance, enterprises can opt for a relatively natural reduction in the total volume of labour, by way of a steady decrease in the overtime hours regularly worked and the taking of days of holiday saved up previously, etc. If the slowdown in activity continues, the existing systems for reducing working time can be used (in a more intensive manner), such as part-time working and the time-credit scheme. In order to keep the permanent workers, who constitute the core enabling activity to con-tinue, enterprises will prefer to opt for the non-renewal of temporary employment contracts, including agency staff contracts, for example.
To avoid having to make redundancies amongst the staff employed on a permanent employment contract, Belgian legislation since long provides for the option of plac-ing blue-collar workers in temporary unemployment. In addition, a certain number of supplementary measures to combat the crisis were introduced at the beginning of 2009 and extended in several stages up to the end of 2011 : the “temporary collective scheme for total or partial suspension of employment contracts”, a measure which could be described as temporary unemployment for white-collar workers ; the “crisis time credit” scheme, which is aimed at an individual and temporary reduc-tion in work commitments for a fixed period ; and the “ temporary adjustment to working time in a crisis”, which consists of a fall in working time applied to all the workers in an enterprise or a specific category amongst them.
As a last resort, if the enterprise is forced to reduce its permanent workforce, it can make its workers redundant individually or collectively. Under certain conditions, it is possible in this case to make use of pre-pensions for the elderly workers.
During the crisis, Belgian enterprises turned to these different devices to various degrees. The system of tem-porary unemployment for economic reasons is the one which has been most used, and which reached a peak in the first half of 2009 affecting some 200 000 workers at that time, that is to say more than twice the number before the crisis. The similar new system applicable to white-collar workers has met with a much more qualified success : at its maximum level at the beginning of 2010, only around 8 000 persons were involved. Employers likewise only had limited recourse to the crisis time credit and the temporary adjustment to working time, which only involved some 2 500 and 2 000 persons respectively
Table 1 Activity, volume of lAbour And employment
(percentage changes compared to the corresponding half of the previous year)
2008
2009
2010
1st half year
2nd half year
1st half year
2nd half year
1st half year
2nd half year
GDP in volume terms . . . . . . . . . . . . . . . . . . . . . . . 1.7 –0.1 –3.9 –1.4 2.2 2.0
Volume of labour (1) . . . . . . . . . . . . . . . . . . . . . . . 2.1 0.8 –1.7 –2.0 0.3 1.4
Employment . . . . . . . . . . . . . . . . . . . . . . . . . . . 1.9 1.6 0.1 –0.8 0.2 1.2
Hours worked per person . . . . . . . . . . . . . . . . 0.2 –0.8 –1.9 –1.1 0.1 0.2
Productivity per hour worked . . . . . . . . . . . . . . . –0.4 –0.9 –2.2 0.6 1.9 0.7
Sources : NAI, NBB.(1) Total hours worked, that is to say the sum of the volume of labour of employees as published by the NAI and the volume of labour estimated for the self-employed.
92
at the end of 2009. With the end of the crisis, the use of these devices is in clear decline.
The number of those taking early retirement on a full-time basis has shown little growth (1) since the beginning of the recession, rising from 115 000 at the start of 2008 to 121 000 in the first quarter of 2011. Around 3 700 of these persons were not exempted from registering as job-seekers ; at the start of 2008, barely 900 workers were involved. The different systems and the use made of them by Belgian enterprises are described in more detail in box 4 of the Bank’s Report for 2010 (National Bank of Belgium, 2011).
1.2 International comparison
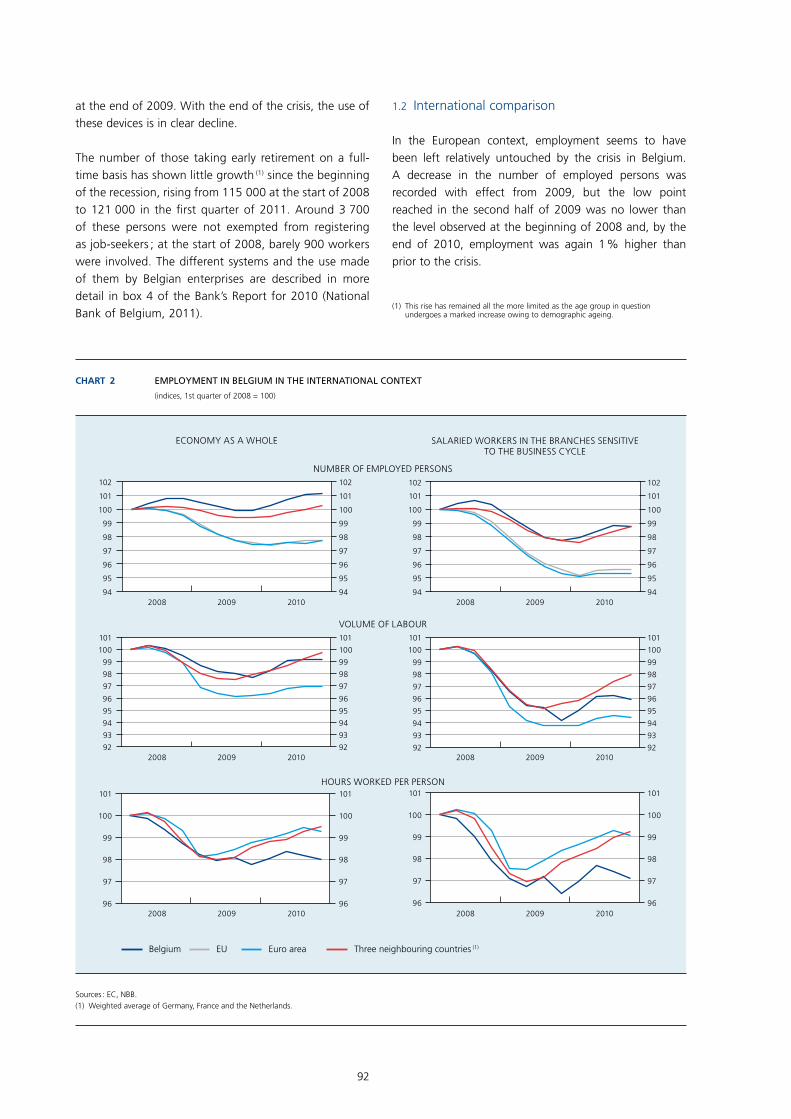
In the European context, employment seems to have been left relatively untouched by the crisis in Belgium. A decrease in the number of employed persons was recorded with effect from 2009, but the low point reached in the second half of 2009 was no lower than the level observed at the beginning of 2008 and, by the end of 2010, employment was again 1 % higher than prior to the crisis.
Chart 2 EmploymEnt in BElgium in thE intErnational contExt
(indices, 1st quarter of 2008 = 100)
2008 2009 201094
95
96
97
98
99
100
101
102
94
95
96
97
98
99
100
101
102
2008 2009 201094
95
96
97
98
99
100
101
102
94
95
96
97
98
99
100
101
102
92
93
94
95
96
97
98
99
100
101
92
93
94
95
96
97
98
99
100
101
92
93
94
95
96
97
98
99
100
101
92
93
94
95
96
97
98
99
100
101
96
97
98
99
100
101 101
96
97
98
99
100
96
97
98
99
100
101
96
97
98
99
100
101
2008 2009 20102008 2009 2010
2008 2009 20102008 2009 2010
SALARIED WORKERS IN THE BRANCHES SENSITIVETO THE BUSINESS CYCLE
Belgium EU Euro area Three neighbouring countries (1)
ECONOMY AS A WHOLE
NUMBER OF EMPLOYED PERSONS
VOLUME OF LABOUR
HOURS WORKED PER PERSON
Sources : EC, NBB.(1) Weighted average of Germany, France and the Netherlands.
(1) This rise has remained all the more limited as the age group in question undergoes a marked increase owing to demographic ageing.

93
The Belgian laBour markeT during and afTer The crisis
Employment evolved in a similar way in Germany, due in particular to the very widespread recourse to measures allowing the average duration of work to be reduced, such as short-time working (Kurzarbeit). Following the decline in the number of jobs in the Netherlands and especially in France, the average fall within the three neighbouring countries was nevertheless slightly higher than that recorded in Belgium. The impact of the crisis was even more significant on average in the EU and the euro area, given that the number of employed persons there decreased by some 2.5 % at most.
Despite the less pronounced slowdown in activity referred to above, the fall in the total volume of labour in Belgium is similar to that observed on average in the neighbouring countries. The fact that employment might have suffered less in Belgium than in the three neighbouring countries may therefore be explained by the slightly higher correction in the duration of work per person. The reduction in the number of hours of work per employed person found on average in the euro area (1) was comparable to that in the three neigh-bouring countries.
In certain branches of activity such as the public admin-istrations and health care, which is subsidised by the public authorities, employment is less sensitive to the changes in the business cycle ; the differences between the countries in terms of employment structure may therefore exert an influence on the overall impact of the crisis. If salaried employment in the branches of activity sensitive to the business cycle (2) is taken as the basis, the impact of the crisis has been much more pronounced in the latter than in the economy as a whole, both in Belgium and in the rest of Europe. The gap between Belgium and the other European countries in the area of adapting individual work duration has similarly been more marked in those branches ; furthermore, the downward correction continued over a longer period in Belgium, an aspect which reflects the significant recourse to measures for reducing the duration of work.
1.3 Effects on the structure of employment in Belgium
This section of the article draws a comparison between the data relating to the first half of 2008, 2009 and 2010, which correspond respectively to the situation before, during and at the end of the crisis. To be able to evalu-ate the impact of the crisis on employment correctly, it is necessary in principle to use the comprehensive data of the national accounts. In particular, these include a breakdown according to the branch of activity. However, there are no statistics in the national accounts for certain other breakdowns of interest, like by gender, age and educational level, and it is appropriate in this case to refer to the data in the labour force survey (LFS) (3).
According to the data in the national accounts, total employment in Belgium reached a level more or less identical to that before the crisis (4) during the first half of 2009 and 2010. However, this virtual stabilisation on average hides divergent trends between the different branches of activity. Whilst employment in non-market services continued to expand, the number of jobs within the branches of activity sensitive to the business cycle decreased considerably, by 0.6 to 0.7 % in both periods, mainly by virtue of the pronounced decline in industry.
Table 2 EmploymEnt in BElgium : BrEakdown By Branch of activity
(percentage changes compared to the corresponding half of the previous year and, in parentheses, percentage changes in added value compared to the corresponding half of the previous year)
1st half of 2008
1st half of 2009
1st half of 2010
Total . . . . . . . . . . . . . . . . . . . . . . . . 1.9 0.1 0.2(2.1) (–3.8) (2.0)
Branches sensitive to the business cycle (1) . . . . . . . . . 2.2 –0.7 –0.6
(2.2) (–5.3) (2.1)
of which :
Industry . . . . . . . . . . . . . . . 0.0 –2.9 –4.5(1.4) (–9.7) (3.8)
Construction . . . . . . . . . . . 2.9 0.0 0.0(–0.9) (–4.1) (–1.7)
Market services (2) . . . . . . . 3.0 –0.1 0.5(3.0) (–3.7) (1.9)
Non-market services (3) . . . . . . . 1.4 1.8 1.7(1.6) (1.2) (1.5)
Source : EC.(1) The branches “agriculture and fishing”, industry, construction, “commerce,
hotels & restaurants and transport” and “financial and real-estate services”.(2) The branches “commerce, hotels & restaurants and transport” and
“financial and real-estate services”.(3) The branches “public administration and education” and non-market private
services.
(1) There are no data available for the EU average with regard to the volume of labour and, consequently, the duration of work per person, in particular owing to the absence of statistics for the United Kingdom.
(2) This involves the branches “agriculture and fishing“, industry, construction, “commerce, hotels & restaurants and transport“ and “financial and real-estate services“.
(3) In other respects, there are no seasonally adjusted data available at all for the LFS, with the result that comparisons over time must necessarily refer to the corresponding period of the previous years. This does not pose a problem in the context of the present analysis, therefore, which refers systematically to the first half year.
(4) However, this virtual stabilisation hides a clear downward tendency in 2009 as well as an equally marked upward tendency in 2010.

94
Consequently, it seems appropriate to draw a distinction between the branches of activity that are sensitive to the business cycle and the non-market services in order to analyse the trend in employment.
The differing employment trend in the various branches of activity is linked to differences in terms of the trend in the activity. Thus, added value in industry suffered a fall amounting to 10 %, whilst in construction and market services it was around 4 %. On the other hand, the added value in non-market services has continued to increase. In industry and construction primarily, it proved possible to moderate the consequences of the clear slowdown in activity on employment by means of a marked reduction in the number of hours worked per person.
Based on the data relating to employment by branch of activity available from the LFS, it is possible to infer, alongside the general trend, the trend arising within the branches of activity sensitive to the business cycle. As might be expected, the trend in employment during the crisis was markedly less favourable in those branches than in the economy as a whole ; at the end of the crisis, the two movements largely converge.
The available data indicate a diverging trend in employ-ment according to age. Employment amongst young people showed a marked decline during the crisis and this tendency continued subsequently. This age group is traditionally much more sensitive to fluctuations in the business cycle, given that young people frequently
Chart 3 EmploymEnt in BElgium : BrEakdoWn according to various critEria
(data relating to the first half of the years under consideration ; percentage changes compared to the corresponding half of the previous year)
2009 2010 2009 2010 2009 2010–10
–5
0
5
10
–10
–5
0
5
10
2009 2010 2009 2010 2009 2010–6
–4
–2
0
2
4
6
–6
–4
–2
0
2
4
6
2009 2010 2009 2010–5
–4
–3
–2
–1
0
1
2
–5
–4
–3
–2
–1
0
1
2
2009 2010 2009 2010–10
–8
–6
–4
–2
0
2
–10
–8
–6
–4
–2
0
2
2009 2010 2009 2010–4
–2
0
2
4
6
–4
–2
0
2
4
6
ACCORDING TO AGE ACCORDING TO EDUCATIONAL LEVEL
15-24 years old 25-54 years old 55-64 years old Low Medium High
ACCORDING TO GENDER
Males Females Temporary Permanent
ACCORDING TO WORK ARRANGEMENT
Part-time Full-time
Total Branches sensitive to the business cycle
ACCORDING TO EMPLOYMENT CONTRACT (1)
Source : EC.(1) Employees only.

95
The Belgian laBour markeT during and afTer The crisis
do not yet have a permanent job or only have a small amount of professional experience. Even highly quali-fied young people were not spared, either in 2009 or in 2010. On the other hand, employment amongst persons between 55 and 64 years of age increased considerably during these two periods, thus perpetuating the upward structural tendency observed for a number of years. This is linked in particular to the increase in the legal pension age for women, the measures taken in the context of the Generation Pact and the greater recourse to part-time working, for example by way of the time credit system, in order to remain active up to an older age.
Furthermore, the level of education proves once again to be critical. As early as the beginning of 2008, employment amongst persons with few qualifications had suffered the repercussions of the slowdown in the business cycle, with the result that the fall observed during the first half of 2009 remained fairly limited. At this highest point of the crisis, it was employment amongst persons with medium qualifications that recorded the most marked decline ; within this group, employment decreased again at the beginning of 2010. On the other hand, employ-ment amongst highly-qualified workers grew during and after the crisis. An inverse relationship can consequently be observed during the crisis between the sensitivity of employment to the business cycle and the level of educa-tion : the least qualified workers are the first to suffer the consequences of the fluctuations in activity and are the most severely affected. The most qualified workers, for their part, are often in possession of specific knowledge and expertise and are less easily replaced. They are only made redundant as a last resort, therefore, if the fall in activity persists and there is no immediate prospect of recovery.
Within the branches of activity sensitive to the business cycle, employment amongst women has declined more markedly than amongst men during the crisis. However, since these branches have a majority of male workers, the impact of this decrease on the employment of women as a whole remained relatively limited and the latter therefore continued to grow. On the other hand, the total number of male workers has decreased, given the considerable representation of the branches of activity sensitive to the business cycle amongst men. With regard to women, the structural tendency seen in the past has thus continued : their employment rate has in fact stead-ily increased, due in particular to the raising of the legal pension age, but also owing to a cohort effect since those women with a higher level of education are more active on the labour market and remain so up to an older age. During the first half of 2010, employment amongst both women and men increased.
During the crisis, the number of full-time jobs decreased but this decline was partially offset by an increase in part-time employment. However, within the branches of activity sensitive to the business cycle, both these working arrangements declined in a similar way. In the course of the first half of 2010, the number of part-time jobs never-theless turned markedly upwards again, unlike full-time employment : thus, according to the data, the upturn in employment seems to have been primarily stimulated by part-time work.
Lastly, the breakdown according to employment contract naturally only refers to salaried employment. As might be expected, it is essentially those employees with a tempo-rary contract who have been affected by the crisis in the branches of activity sensitive to the business cycle : the fall in their employment in these branches was more than twice as high as for employment of staff on a permanent contract. Even if it could be expected that temporary employment contracts, including agency staff contracts, would, due to their flexibility, be used all the more when activity took off again, the trend in employment has contin-ued to be more unfavourable for temporary workers up to the first half of 2010, according to the data from the LFS.
2. Effects of the crisis on the demand for labour
It is particularly difficult to evaluate the precise scope of the total demand for labour, owing to several factors. Indeed, employers have different channels at their disposal, both formal and informal, to (attempt to) fill their job vacancies and the regional placement services each use their own methodology with regard to the registration of job vacan-cies. It is therefore impossible to gain a complete picture of the total demand for labour in Belgium.
Given this fact, estimating the trend in the demand for labour during the crisis is a particularly difficult task. The indi-cators coming out of the Bank’s business cycle surveys and the statistics of the regional placement services with regard to the number of job vacancies must in fact be seen as purely indicative, given the limits inherent to the data sources.
In the context of the Bank’s monthly business cycle sur-veys, the entreprises in the different branches of activ-ity covered by these surveys – manufacturing industry, building industry, trade and business-related services – are asked to state their expectations regarding the trend in employment. The corresponding results can then be combined – by proceeding in the same way as for aggregating the synthetic curves for each branch of activity and obtaining the Bank’s overall synthetic curve

96
for the business cycle – into an overall curve relating to employment prospects.
Even if this curve had already begun to falter in mid-2007, it was in the course of the second half of 2008 that it showed the most marked decline, falling back well below the lowest levels recorded since the start of 1995, the year from which it is possible to calculate this combined curve. In other respects, it has turned out to be a good indicator of the trend in employment within the Belgian economy in the past. Moreover, the weakening of this curve during the crisis allowed a fairly precise estimate of the extent to which employment was going to decrease, with a time lag of around two quarters. Having reached its lowest point at the beginning of 2009, the smoothed curve, which reflects the underlying tendency, has shown nothing but substantial growth. The raw data continue to indicate a favourable trend in the demand for labour up to the beginning of 2011.
The quarterly surveys organised by the Bank also provide useful information on the demand for labour. The survey relating to the use of production capacity includes a ques-tion on the obstacles to production arising from a lack of qualified labour, an aspect that provides an indication of
the tensions present on the labour market owing to the existence of an unsatisfied demand for labour, for which there is no corresponding supply. These distortions began to fade away with effect from the end of 2007 in all the branches of activity covered by the survey. In 2009, the different branches of activity reported very few obstacles to production linked to labour, but with effect from 2010, these curves turned markedly upwards again. In fact, a number of employers suspended their search for quali-fied labour during the recession and then started looking for staff again when activity started up again ; they were then faced with the same problems as before the crisis. Since employers were continuing to resort widely to the system of temporary unemployment in particular, the addi-tional supply of labour remained insufficient to meet this demand. Thus, the system of temporary unemployment allowed a collapse in employment to be avoided, but at the same time certain enterprises postponed the necessary restructuring measures or abandoned them. Furthermore, this system prevented a reorientation of employment towards activities looking to the future or activities where there is a shortage of labour, as shown by the persisting structural problem of the critical functions.
In fact, according to a study by the VDAB (VDAB, 2010), the crisis had practically no effect at all on the list of criti-cal functions : during 2009, the year characterised by the crisis, this service recorded 194 critical functions, thus representing a quarter of the overall set of professions for which the VDAB receives job offers and corresponding to half the total number of job offers received. Moreover, the offers relating to these professions showed a less signifi-cant decrease than those relating to the other professions during the crisis, a fact which shows once again that this involves a persistent structural problem.
3. Effects of the crisis on the supply of labour
The actual supply of labour can likewise be affected in the event of an economic recession. In fact, faced with difficulties in finding work, there is a possibility that the unemployed look less actively for a job. In any case, that is what is indicated by the data from the LFS, in the context of which these persons are no longer regarded as job-seekers in accordance with the criteria of the International Labour Office (ILO) (1). The crisis may therefore affect the activity rate recorded, which represents the share of the active population within the population of working age (2).
(1) According to the criteria of the ILO, a person must satisfy three conditions to be regarded as a job-seeker : the person must not be in employment, must be available for the labour market and must be actively looking for a job.
(2) This involves the population of 15 to 64 year-olds.
Chart 4 EmploymEnt prospEcts in BElgium according to thE Bank’s BusinEss cyclE survEys (1)
(seasonally adjusted data)
2005 2006 2007 2008 2009 2010 2011–1
0
1
2
3
–35
–30
–25
–20
–15
–10
–5
0
5
10
15
JJJJJJJJ
JJ
J
J
J
JJ
JJJJJJJJJJ
J
JJJJJJJJJJJJ
J
JJJJJ
J
J
J
J
J
JJJJ
JJJJ
J
JJJJ
JJJ
J
JJJJJ
JJJJJJ
Employment (percentage changes compared to the corresponding quarter of the previous year) (left-hand scale)
Employment prospects (right-hand scale)
smoothed
seasonally adjusted
Sources : NAI, NBB.(1) Weighted average of employment prospects in manufacturing industry (65 %),
building industry (15 %), trade (5 %) and business-related services (15 %).

97
The Belgian laBour markeT during and afTer The crisis
Since the active population encompasses all workers and job-seekers, the activity rate corresponds to the sum of the employment rate and the unemployment rate expressed as a percentage of the population of working age. Based on the data from the LFS, it is furthermore possible to analyse the inherent trends by group of population. The data used refer once again to the first half of 2008, 2009 and 2010 and therefore to the situation before, during and at the end of the crisis.
In 2009, the activity rate remained relatively stable : the fall in employment following the crisis therefore had been almost entirely reflected in an increase in unemployment at the time. In parallel with the recovery in economic activ-ity, the activity rate turned upwards again during the first half of 2010. Thus, although the number of jobs stopped declining, unemployment increased considerably again.
The different age groups were affected to various degrees by the crisis. The activity rate among young people fell both during and after the crisis, implying that the decrease in the number of young workers referred to above was not reflected in a proportional rise in unemployment. However, it was for this age group that unemployment recorded the strongest rise in the course of these two periods. This emphasises once again the relatively greater sensitivity of the labour market situation of young people to the business cycle.
The group of 55-64 year-olds is the only one whose activ-ity rate and employment rate increased during the crisis. This upward movement continued vigorously in the sub-sequent period, once the worst of the crisis was over. The group of elderly workers is likewise the only one whose unemployment rate decreased in 2010. The economic crisis did not therefore interrupt the upward tendency that has characterised the participation of senior citizens in the labour market for a number of years. This does not take away the fact that fewer than four in ten persons between the ages of 55 and 64 were active in the labour market in Belgium in the first half of 2010.
Moreover, the crisis not only had an effect on the unem-ployment rate but also on the distribution of the number of job-seekers according to the length of their period of unemployment. In order to illustrate this, reference is made to an unemployment ratio which relates the number of job-seekers to the total population of work-ing age and not to the active population, as is generally the case. In effect, as indicated before, the latter is itself influenced by the business cycle, an aspect which could skew the conclusions. In the first half of 2008, prior to the outbreak of the crisis, 4.5 % of the population of working age was looking for a job in Belgium. One year later, this
ratio had increased to 5.2 %. In fact, the crisis brought about a greater influx of newly unemployed in the wake of the redundancies and the non-renewal of temporary contracts, as well as the arrival on the labour market of young people who had not found a job at the conclusion of their studies. In effect, the proportion of the population of working age recording a period of unemployment of short duration (six months at the most) climbed substan-tially from 1.5 to 2.1 %, whilst the effect on the other groups, broken down as a function of the duration of unemployment, remained limited initially. The situation changed over the course of time, given that a greater number of persons remained unemployed owing to the smaller number of employment opportunities and there-fore steadily joined the groups characterised by a longer duration of unemployment. This situation was expressed in a rise amongst all the groups showing at least six months’ duration of unemployment. Notwithstanding the decrease in the influx of newly unemployed, the total unemployment ratio continued its rise in the course of the first half of 2010, reaching 5.7 % of the population of working age. However, the rise in the overall unemploy-ment rate observed in Belgium was relatively limited in comparison to that recorded in the other Member States
Chart 5 activity ratE and contriButions of EmploymEnt and unEmploymEnt : total and BrokEn doWn according to agE
(population of working age ; changes in percentage points compared to the corresponding half of the previous year)
B
B
B
B
B
B
JJ
J
JJ
J
2009 2010 2009 2010 2009 2010–3
–2
–1
0
1
2
3
–3
–2
–1
0
1
2
3
Activity rate, of which contribution from :
Employment (1)
Unemployment (2)
Total 15-24 years old 55-64 years old
Source : EC.(1) This contribution is equal to the change in the employment rate.(2) This contribution differs from the change in the traditional unemployment rate,
given that the latter is expressed in % of the corresponding active population and not, as is the case here, in % of the corresponding population.

98
of the EU : between the first half of 2008 and the corre-sponding period of 2010, unemployment expressed as a percentage of the population of working age increased by 1.2 percentage points in Belgium as against 2.1 percent-age points on average in the EU.
The share of very long-term unemployment, for two years or more, which is an indication of structural unem-ployment, remained markedly lower within the EU, at 1.2 % of the population of working age in the first half of 2010, compared to Belgium where it reached 1.7 %. Even when the economy picks up again, these long-term unemployed encounter the greatest problems in rejoining the labour market : not only might they have lost certain skills and abilities that are necessary in order to match up to the conditions of the demand for labour, but in addi-tion there is a possibility that certain employers – starting from the principle that this will in fact be the case – use long-term unemployment as a negative selection criterion and therefore give preference to other job-seekers. Faced with so few employment opportunities, the long-term unemployed may become discouraged and reduce their efforts to look for a job.
4. Effects of the crisis at the regional level
According to the administrative data of the NEO, the rise in the number of unemployed job-seekers on an annual basis stopped accelerating with effect from mid-2009, but it was necessary to wait for the beginning of 2010 for it to slow down significantly, and it was only with effect from October 2010 that the number of unemployed was lower than one year before. The decline in unemployment was most marked in Flanders, but it was also in this region that the impact of the crisis made itself felt the most : in 2009, the number of unemployed there had exceeded the level of the previous year by a fifth whereas in Brussels and Wallonia, this expansion had been limited to 8 and 3.5 % respectively. Indeed, since the share of employment in the branches of activity sensitive to the business cycle is more significant in Flanders than in the other two regions, the labour market there is therefore more sensitive to step changes in the busi-ness cycle. Nevertheless, it was Wallonia that was the first to record a fall in the number of unemployed on an annual basis : with effect from April 2010, unemployment there was lower than in the previous year ; in Flanders, this only became the case with effect from September. In Brussels, the rise in unemployment slowed down considerably with effect from mid-2010, but at the start of 2011, the number of unemployed job-seekers there was still higher than in the previous year.
Chart 6 unEmploymEnt according to duration in BElgium
(data relating to the first half of the years under consideration ; in % of the population of working age)
2008 2009 20100
1
2
3
4
5
6 6
0
1
2
3
4
5
Less than 6 months
Between 6 and 11 months
Between 12 and 23 months
2 years or more
1.5
0.7
0.7
1.5
1.7
1.5
0.8
0.8
2.1
1.0
1.1
1.8
Total
Source : EC.
Chart 7 unEmploymEnt in BElgium and thE rEgions
(percentage changes of the number of unemployed job-seekers compared to the corresponding month of the previous year)
–152008 2009 2010 2011
–10
–5
0
5
10
15
20
25
–15
–10
–5
0
5
10
15
20
25
–15
Belgium
Brussels
Flanders
Wallonia
Source : NEO.

99
The Belgian laBour markeT during and afTer The crisis
In April 2011, the month for which the most recent obser-vations are available, there were some 188 000 unem-ployed job-seekers in Flanders, which represents 35 % of the total number of unemployed job-seekers in Belgium. Wallonia recorded the highest number of unemployed at 238 000 persons ; at the same time, 105 000 unemployed persons were recorded in Brussels. The harmonised unem-ployment rate for 15-64 year-olds, expressed as a percent-age of the active population of working age and calculated on the basis of the results of the LFS, amounted to 4.2 % in Flanders in the fourth quarter of 2010 (most recent obser-vations). This percentage was much higher at the time in Wallonia (11.7 %) and especially Brussels (17.4 %).
5. Has the crisis had an impact on labour costs ?
This section of the article attempts to determine whether the crisis which forced enterprises to reduce their costs, and more particularly their labour costs, likewise brought with it a reaction with regard to salaries. The analysis relates to the sector that is most sensitive to the business-cycle, namely the private sector. In the absence of equiva-lent statistics, the business sector is used in order to be able to establish an international comparison. In fact, this sector includes manufacturing industry, construction and market services and therefore constitutes an approxima-tion to the private sector. The latter includes not only the
branches mentioned but also agriculture and fishing, as well as private non-market services.
The decrease in the volume of labour resulting from the crisis automatically led to a slowdown in the increase in labour costs for employers. Furthermore, the way that the overall wage bill responded was proportionally less significant than might have been expected on the basis of the trend in the volume of labour. This is explained by the fact that many employers paid the workers placed in temporary unemployment, whose numbers were increas-ing strongly, supplements on top of their unemployment benefit payments. Although no data are available regard-ing the overall impact of these payments on the trend in labour costs, it emerges from the information of the SPF Employment, Labour and Social Dialogue that many sector agreements contain provisions on the subject of payments granted to manual workers placed in temporary unemployment. The specific measures adopted during the crisis with a view to extending the system of temporary unemployment to employees provide for the disburse-ment of payments similar to those granted to manual workers, or the sum of €5 per non-working day if no addi-tional payment is envisaged for the latter. The crisis has also affected the social contributions paid by employers for their staff ; more particularly, it has resulted in a strong increase in redundancy payments. As mentioned in this article, the main consequence of the crisis has been a fall in the volume of labour in terms of hours worked, whilst
Chart 8 laBour costs, Working timE and laBour productivity in thE privatE sEctor
( annual change in %)
2006 2007 2008 2009–3
–2
–1
0
1
2
3
4
5
–3
–2
–1
0
1
2
3
4
5
2006 2007 2008 2009–3
–2
–1
0
1
2
3
4
5
–3
–2
–1
0
1
2
3
4
5
Labour costs per employee
Hours worked per employee
Labour costs per hour
Unit labour costs
Labour productivity per hour (1)
Labour costs per hour
2010 e 2010 e
Sources : NAI, NBB.(1) A negative sign means that labour productivity increased and thus had a moderating effect on unit labour costs.

100
the number of employees only declined to a lesser extent. This means that the increase in labour costs per person slowed down between 2008 and 2009, falling back from 3.1 % to 1.8 %, whilst the growth in hourly labour costs speeded up, increasing from 3.6 % to 3.9 %.
In 2010, a new rise in the hours worked per employee was recorded. The growth in hourly labour costs then slowed down considerably and is expected to come to 0.6 % on average in 2010, this percentage being lower than that relating to the trend in labour costs per employee. The upward effect of the factors linked to the crisis referred to above on the trend in labour costs has in fact ended up petering out. Redundancy payments have decreased, in spite of the closure of the Opel plant at Antwerp, as well as temporary unemployment payments as a result of the downturn in its usage. The lower rise in hourly labour costs between 2009 and 2010 is mainly attributable to the automatic indexation mechanism. It was in 2010 that the impact of the marked slowdown in inflation observed in 2009 was fully visible in terms of the automatic indexa-tion of salaries, which amounted on average to a fifth of that of the previous year. In fact, the adaptation of salaries to the trend in purchasing power, measured by means
of the health index, takes effect with a certain time lag. However, in general terms, the slowdown in inflation did not result in negative indexations. Thus, the application of the system of indexation is not perfectly symmetrical : some of the joint committees which use the indexation mechanism at fixed intervals and with a high frequency in fact excluded or limited negative indexations. In Belgium, hourly labour costs grew by 4.5 % in cumulative terms over the period covered by the central agreement for 2009-2010.
Notwithstanding the decrease in the number of hours worked per person and, to a lesser degree, the contrac-tion of the workforce, enterprises were not able to pass on the whole of the fall in production to the volume of labour. Consequently, the hourly productivity of labour declined by 0.8 % in 2009. This resulted in a considerable rise in unit labour costs, of 4.7 %. The slowdown in the growth of hourly labour costs in 2010, combined with the cyclical recovery in the productivity of labour, subse-quently brought about a decline in unit labour costs.
Similarly in the three neighbouring countries, which have to be used as the reference for tracking the
Chart 9 laBour costs and laBour productivity in thE BusinEss sEctor in BElgium and thE thrEE nEighBouring countriEs
(average change in % compared to the corresponding quarter of the previous year)
0 –5 –4 –3 –2 –1–3 –2 –1 0 1 2 3 4 0 1 2 31 2 3 4 5 6 7 8
LLLL
LL
LL
LL
LL
LLL
L
LLNB : euro area
3 Neighbouringcountries
Netherlands
France
Germany
Belgium
1996 Q1-2008 Q2 2008 Q3-2009 Q4 2010 Q1-Q4
Labour costs per hour Labour productivity per hour (1) Unit labour costs
Source : OECD.(1) A negative sign means that labour productivity increased and thus had a moderating effect on unit labour costs .
101
The Belgian laBour markeT during and afTer The crisis
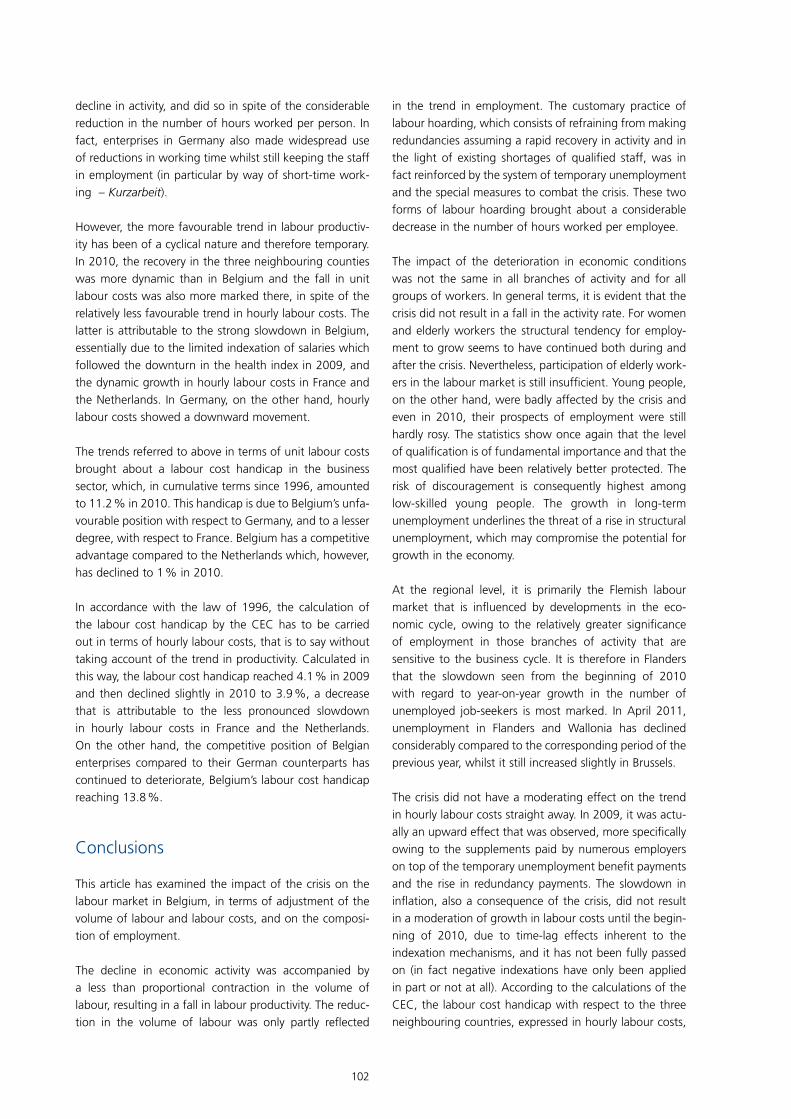
competitiveness of the Belgian economy in accordance with the 1996 law, the trends in hourly labour costs, in labour productivity and in unit labour costs all suffered the consequences of the crisis but not always to the same extent as in Belgium.
During the period extending from the first quarter of 1996 to the second quarter of 2008, hourly labour costs in Belgium enterprises grew by 2.5 % on average, that is to say at a pace that is virtually identical to that in the three neighbouring countries. Since the growth in pro-ductivity was weaker in Belgium (1.2 % as against 2.1 % in the three neighbouring countries), unit labour costs increased more rapidly, by 0.8 percentage points on aver-age. The competitive handicap in terms of unit labour costs could be attributed essentially to the unfavour-able position of Belgium compared to Germany, which recorded a fall in unit labour costs on average during this period, since the very moderate increase in hourly labour costs there was more than offset by the strong growth in labour productivity. Indeed, with effect from the second half of the 1990s, Germany operated a policy of modera-tion with regard to salaries. In addition, two important trends have left their mark on the labour market over these last ten years. The laws Hartz I to IV, which came into effect between 2002 and 2005, had the objective of
increasing the flexibility of the labour market and putting more people into work. In parallel, substantial changes came about with regard to the process of setting salaries. Clauses allowing divergent arrangements at the enter-prise level proliferated in the collective pay agreements concluded at the sector level. In addition, the share of enterprises where negotiations are conducted at the level of the enterprise increased. All these factors favoured very limited growth in labour costs. Unit labour costs also increased more rapidly in Belgium than in France, even if the difference is much less marked than with respect to Germany. On the other hand, Belgium has a competitive advantage compared to the Netherlands.
During the crisis, which held sway from the third quarter of 2008 to the fourth quarter of 2009 inclusive, the cards were reshuffled. It was no longer a question of a competi-tive handicap in terms of unit labour costs in the business sector. The less unfavourable trend in productivity com-pared to the three neighbouring countries in fact offset the growing handicap with regard to hourly labour costs. The less pronounced productivity decline in Belgium com-pared to the three neighbouring countries is to a large extent explained by the developments in Germany. There, the adaptation of the total volume of labour remained relatively limited in the face of the particularly significant
Chart 10 laBour cost handicap of BElgian EntErprisEs
(differences in % compared to the index relating to the three main neighbouring countries, cumulative since 1996)
199
6
199
8
200
0
2002
200
4
200
6
200
8
–15
–10
–5
0
5
10
15
20
25
199
6
199
8
200
0
2002
200
4
200
6
200
8
–15
–10
–5
0
5
10
15
20
25
Three most important neighbouring countries
Germany
France
Netherlands
2010
eHOURLY LABOUR COST HANDICAP IN THE PRIVATE SECTOR ACCORDING TO THE CEC
HANDICAP RELATING TO UNIT LABOUR COSTS IN THE BUSINESS SECTOR ACCORDING TO THE OECD
2010
e
Sources : OECD, CEC.
102
decline in activity, and did so in spite of the considerable reduction in the number of hours worked per person. In fact, enterprises in Germany also made widespread use of reductions in working time whilst still keeping the staff in employment (in particular by way of short-time work-ing – Kurzarbeit).
However, the more favourable trend in labour productiv-ity has been of a cyclical nature and therefore temporary. In 2010, the recovery in the three neighbouring counties was more dynamic than in Belgium and the fall in unit labour costs was also more marked there, in spite of the relatively less favourable trend in hourly labour costs. The latter is attributable to the strong slowdown in Belgium, essentially due to the limited indexation of salaries which followed the downturn in the health index in 2009, and the dynamic growth in hourly labour costs in France and the Netherlands. In Germany, on the other hand, hourly labour costs showed a downward movement.
The trends referred to above in terms of unit labour costs brought about a labour cost handicap in the business sector, which, in cumulative terms since 1996, amounted to 11.2 % in 2010. This handicap is due to Belgium’s unfa-vourable position with respect to Germany, and to a lesser degree, with respect to France. Belgium has a competitive advantage compared to the Netherlands which, however, has declined to 1 % in 2010.
In accordance with the law of 1996, the calculation of the labour cost handicap by the CEC has to be carried out in terms of hourly labour costs, that is to say without taking account of the trend in productivity. Calculated in this way, the labour cost handicap reached 4.1 % in 2009 and then declined slightly in 2010 to 3.9 %, a decrease that is attributable to the less pronounced slowdown in hourly labour costs in France and the Netherlands. On the other hand, the competitive position of Belgian enterprises compared to their German counterparts has continued to deteriorate, Belgium’s labour cost handicap reaching 13.8 %.
Conclusions
This article has examined the impact of the crisis on the labour market in Belgium, in terms of adjustment of the volume of labour and labour costs, and on the composi-tion of employment.
The decline in economic activity was accompanied by a less than proportional contraction in the volume of labour, resulting in a fall in labour productivity. The reduc-tion in the volume of labour was only partly reflected
in the trend in employment. The customary practice of labour hoarding, which consists of refraining from making redundancies assuming a rapid recovery in activity and in the light of existing shortages of qualified staff, was in fact reinforced by the system of temporary unemployment and the special measures to combat the crisis. These two forms of labour hoarding brought about a considerable decrease in the number of hours worked per employee.
The impact of the deterioration in economic conditions was not the same in all branches of activity and for all groups of workers. In general terms, it is evident that the crisis did not result in a fall in the activity rate. For women and elderly workers the structural tendency for employ-ment to grow seems to have continued both during and after the crisis. Nevertheless, participation of elderly work-ers in the labour market is still insufficient. Young people, on the other hand, were badly affected by the crisis and even in 2010, their prospects of employment were still hardly rosy. The statistics show once again that the level of qualification is of fundamental importance and that the most qualified have been relatively better protected. The risk of discouragement is consequently highest among low-skilled young people. The growth in long-term unemployment underlines the threat of a rise in structural unemployment, which may compromise the potential for growth in the economy.
At the regional level, it is primarily the Flemish labour market that is influenced by developments in the eco-nomic cycle, owing to the relatively greater significance of employment in those branches of activity that are sensitive to the business cycle. It is therefore in Flanders that the slowdown seen from the beginning of 2010 with regard to year-on-year growth in the number of unemployed job-seekers is most marked. In April 2011, unemployment in Flanders and Wallonia has declined considerably compared to the corresponding period of the previous year, whilst it still increased slightly in Brussels.
The crisis did not have a moderating effect on the trend in hourly labour costs straight away. In 2009, it was actu-ally an upward effect that was observed, more specifically owing to the supplements paid by numerous employers on top of the temporary unemployment benefit payments and the rise in redundancy payments. The slowdown in inflation, also a consequence of the crisis, did not result in a moderation of growth in labour costs until the begin-ning of 2010, due to time-lag effects inherent to the indexation mechanisms, and it has not been fully passed on (in fact negative indexations have only been applied in part or not at all). According to the calculations of the CEC, the labour cost handicap with respect to the three neighbouring countries, expressed in hourly labour costs,

103
The Belgian laBour markeT during and afTer The crisis
reached 4.1 % in 2009 and decreased slightly in 2010, falling back to 3.9 %. After allowing for the productivity trend, the labour cost handicap, expressed in unit labour costs, narrowed in 2009. This was only a temporary phenomenon, however, due to the more marked busi-ness cycle linked decline in productivity in Germany than in Belgium. This handicap has deteriorated once again in 2010.

104
Bibliography
National Bank of Belgium (2011), Report 2010, Brussels.
Dhyne E. and M. Druant (2010), Wages, labor or prices : How do firms react to shocks ?, NBB, Working Paper 193.
VDAB (2010), Analyse Vacatures 2009, Knelpuntberoepen – Kansenberoepen, Brussels.