the bdc discussion - reutersshare.thomsonreuters.com/.../4.00_wells_fargo.pdf · the bdc discussion...
TRANSCRIPT
The BDC Discussion Thomson Reuters 3rd Annual Middle Market Loan Conference
Jonathan Bock, Senior Analyst | [email protected] | (704) 410-1874
May 6, 2015 All estimates/forecasts are as of April 27, 2015 unless otherwise stated.
Please see page 14 for rating definitions, important disclosures and required analyst certifications.
Wells Fargo Securities, LLC does and seeks to do business with companies covered in its research reports. As a result, investors should be aware that the firm may have a conflict of interest that could affect the objectivity of the report and investors should consider this report as only a single factor in making their investment decision.
2
A look at our panel…
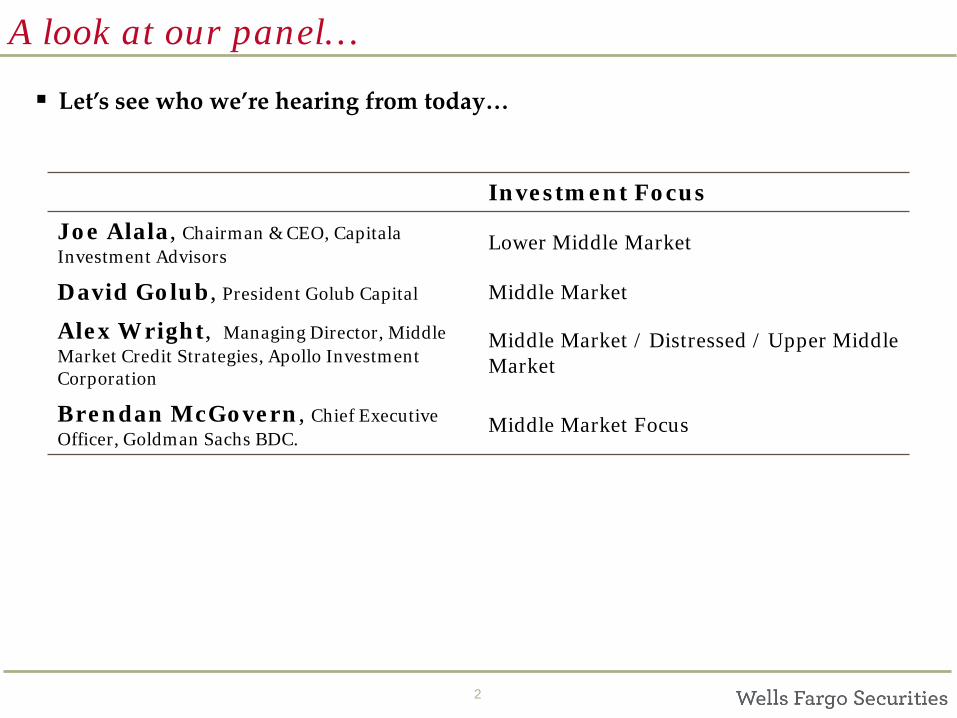
Let’s see who we’re hearing from today…
Investment Focus
Joe Alala, Chairman & CEO, Capitala Investment Advisors
Lower Middle Market
David Golub, President Golub Capital Middle Market
Alex Wright, Managing Director, Middle Market Credit Strategies, Apollo Investment Corporation
Middle Market / Distressed / Upper Middle Market
Brendan McGovern, Chief Executive Officer, Goldman Sachs BDC.
Middle Market Focus
3
This Space is Getting Bigger
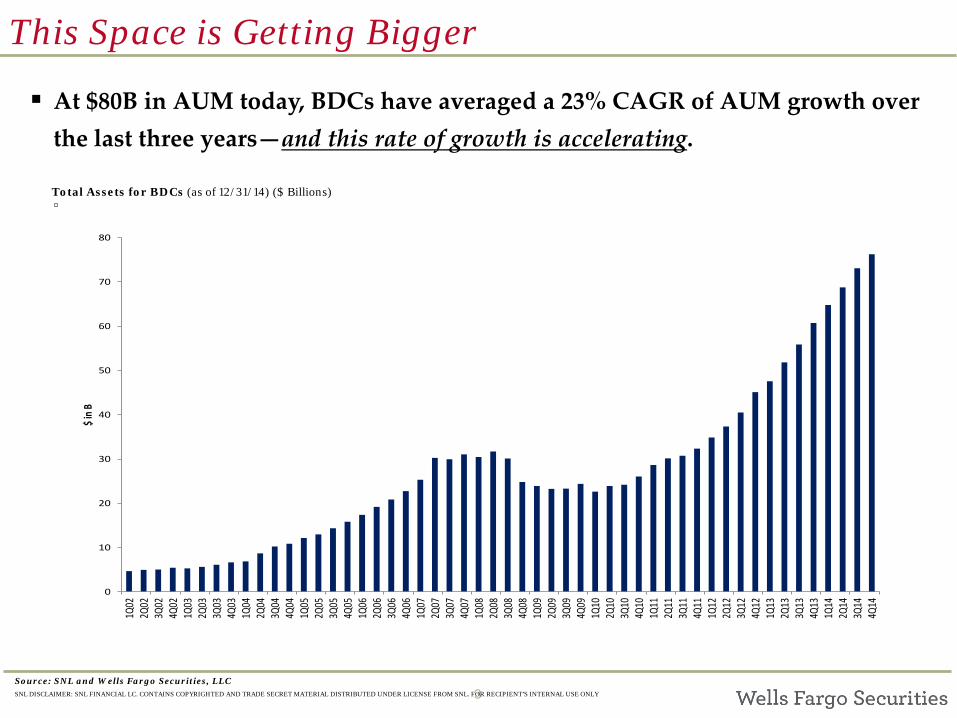
At $80B in AUM today, BDCs have averaged a 23% CAGR of AUM growth over the last three years—and this rate of growth is accelerating.
Total Assets for BDCs (as of 12/31/14) ($ Billions)
Source: SNL and Wells Fargo Securities, LLC
0
10
20
30
40
50
60
70
80
1Q02
2Q02
3Q02
4Q02
1Q03
2Q03
3Q03
4Q03
1Q04
2Q04
3Q04
4Q04
1Q05
2Q05
3Q05
4Q05
1Q06
2Q06
3Q06
4Q06
1Q07
2Q07
3Q07
4Q07
1Q08
2Q08
3Q08
4Q08
1Q09
2Q09
3Q09
4Q09
1Q10
2Q10
3Q10
4Q10
1Q11
2Q11
3Q11
4Q11
1Q12
2Q12
3Q12
4Q12
1Q13
2Q13
3Q13
4Q13
1Q14
2Q14
3Q14
4Q14
$ in B
SNL DISCLAIMER: SNL FINANCIAL LC. CONTAINS COPYRIGHTED AND TRADE SECRET MATERIAL DISTRIBUTED UNDER LICENSE FROM SNL. FOR RECIPIENT’S INTERNAL USE ONLY
4
This long-term disintermediation trend is intact…
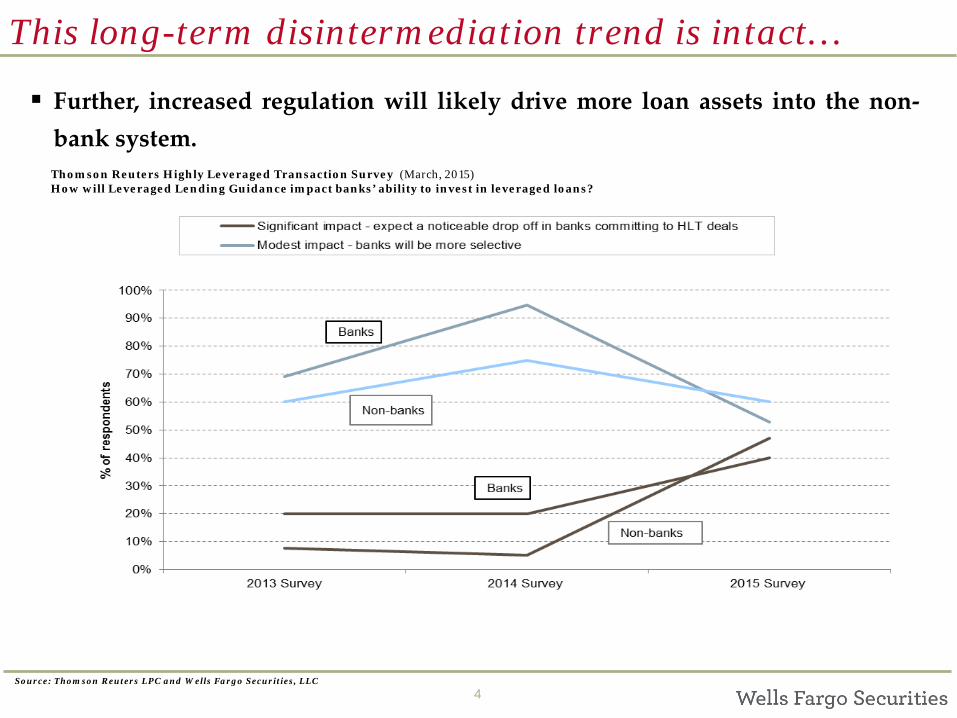
Further, increased regulation will likely drive more loan assets into the non-bank system. Thomson Reuters Highly Leveraged Transaction Survey (March, 2015) How will Leveraged Lending Guidance impact banks’ ability to invest in leveraged loans?
Source: Thomson Reuters LPC and Wells Fargo Securities, LLC
5
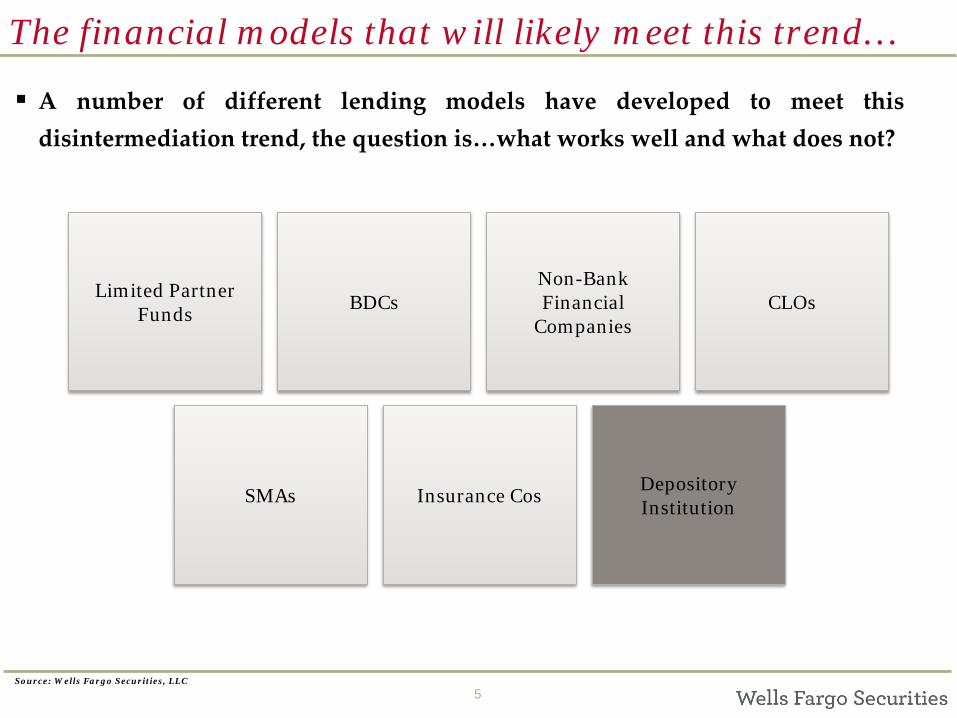
The financial models that will likely meet this trend…
A number of different lending models have developed to meet this disintermediation trend, the question is…what works well and what does not?
Source: Wells Fargo Securities, LLC
Limited Partner Funds BDCs
Non-Bank Financial
Companies CLOs
SMAs Insurance Cos Depository Institution
6
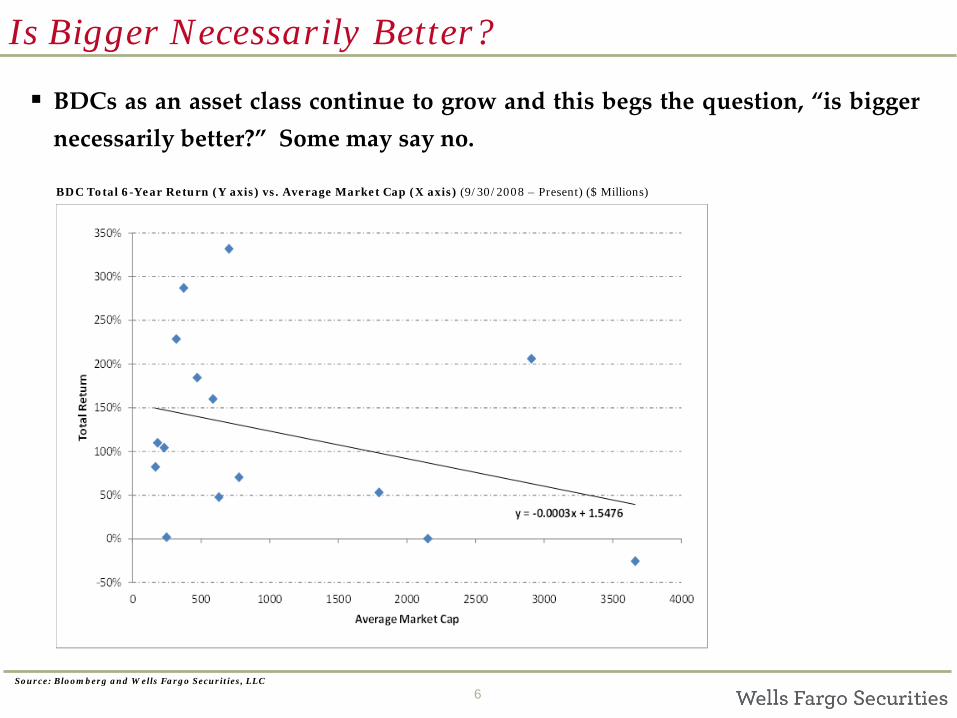
Is Bigger Necessarily Better?
Source: Bloomberg and Wells Fargo Securities, LLC
BDCs as an asset class continue to grow and this begs the question, “is bigger necessarily better?” Some may say no. BDC Total 6-Year Return (Y axis) vs. Average Market Cap (X axis) (9/30/2008 – Present) ($ Millions)
7
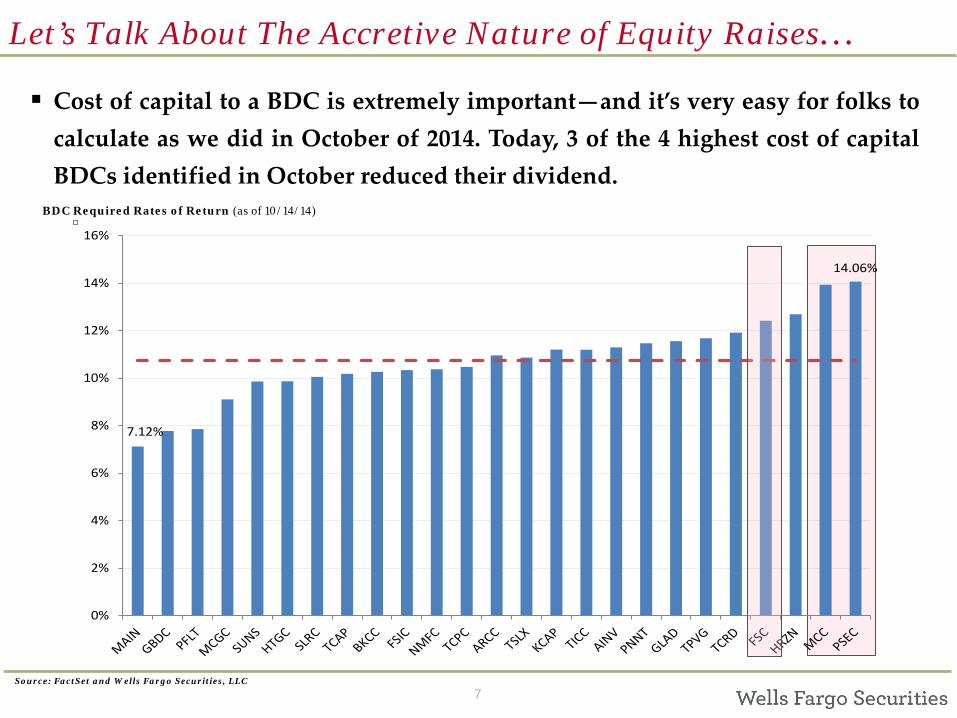
Let’s Talk About The Accretive Nature of Equity Raises…
BDC Required Rates of Return (as of 10/14/14)
Source: FactSet and Wells Fargo Securities, LLC
Cost of capital to a BDC is extremely important—and it’s very easy for folks to calculate as we did in October of 2014. Today, 3 of the 4 highest cost of capital BDCs identified in October reduced their dividend.
7.12%
14.06%
0%
2%
4%
6%
8%
10%
12%
14%
16%
8
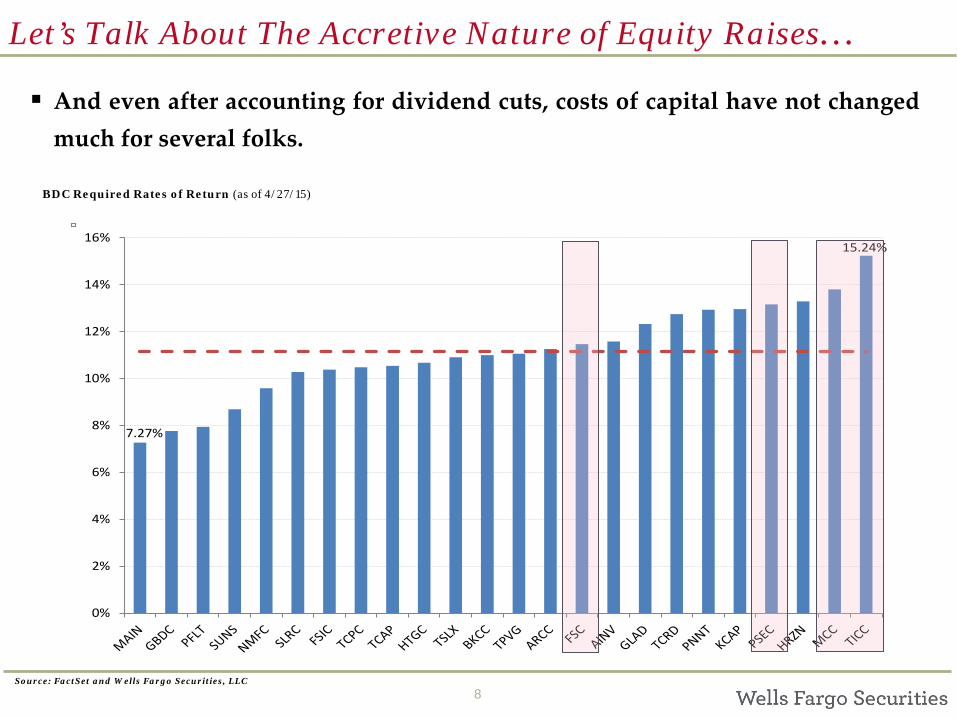
Let’s Talk About The Accretive Nature of Equity Raises…
BDC Required Rates of Return (as of 4/27/15)
Source: FactSet and Wells Fargo Securities, LLC
And even after accounting for dividend cuts, costs of capital have not changed much for several folks.
7.27%
15.24%
0%
2%
4%
6%
8%
10%
12%
14%
16%

9
Our view: a move into the wrong asset…Structured Products
BDC Structured Product Exposure (as of 12/31/14) ($ millions)
Source: Company Reports and Wells Fargo Securities, LLC
With cost of capital pressuring some BDCs to generate higher yields…many are finding themselves investing in CLOs (as up front cash flows are high), but volatility may be even higher over time…
COMPOSITION OF PORTFOLIO
Cost FV Struct. Product
TICC 1,020.5 297.2 267.4 29%BDCA 1,873.4 359.1 359.2 19%ACSF 295.2 50.6 50.4 17%PSEC 6,501.2 1054.4 1104.3 16%ACAS 6,416.9 565.2 547.0 9%AINV 3,589.6 299.9 306.7 8%TCRD 779.0 26.0 26.7 3%TCPC 1,189.5 28.3 29.9 2%FSIC 4,182.1 84.9 98.6 2%FSC 2,768.9 22.0 21.8 1%
Total 28616.3 2787.6 2812.0
BDCPortfolio value at
Cost
Structured Products Portfolio (CLOs)
10
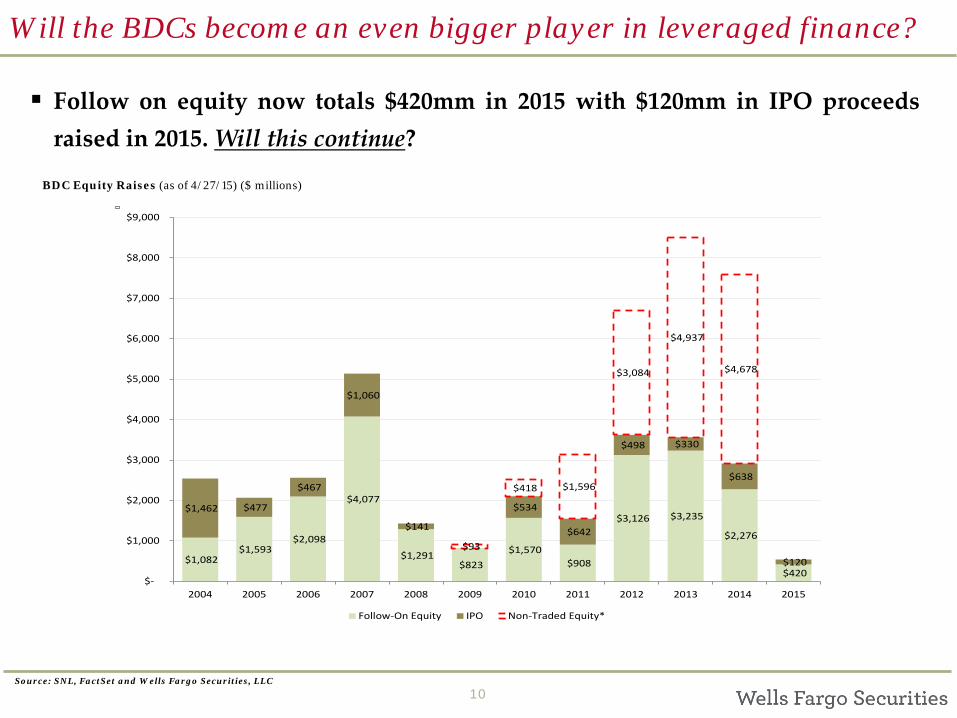
Will the BDCs become an even bigger player in leveraged finance?
BDC Equity Raises (as of 4/27/15) ($ millions)
Source: SNL, FactSet and Wells Fargo Securities, LLC
Follow on equity now totals $420mm in 2015 with $120mm in IPO proceeds raised in 2015. Will this continue?
$1,082 $1,593
$2,098
$4,077
$1,291 $823
$1,570 $908
$3,126 $3,235
$2,276
$420
$1,462 $477
$467
$1,060
$141
$534
$642
$498 $330
$638
$120 $93
$418 $1,596
$3,084
$4,937
$4,678
$-
$1,000
$2,000
$3,000
$4,000
$5,000
$6,000
$7,000
$8,000
$9,000
2004 2005 2006 2007 2008 2009 2010 2011 2012 2013 2014 2015
Follow-On Equity IPO Non-Traded Equity*
11
Disclosures
Source: Wells Fargo Securities, LLC Estimates
To view price charts for all companies rated in this document, please go to https://www.wellsfargo.com/research or write to
7 Saint Paul Street, 1st Floor, R1230-011, Baltimore, MD 21202 ATTN: Research Publications
Additional Information Available Upon Request I certify that: 1) All views expressed in this research report accurately reflect my personal views about any and all of the subject securities or issuers discussed; and 2) No part of my compensation was, is, or will be, directly or indirectly, related to the specific recommendations or views expressed by me in this research report.

12
Disclosures
Source: Wells Fargo Securities, LLC Estimates
STOCK RATING 1=Outperform: The stock appears attractively valued, and we believe the stock's total return will exceed that of the market over the next 12 months. BUY 2=Market Perform: The stock appears appropriately valued, and we believe the stock's total return will be in line with the market over the next 12 months. HOLD 3=Underperform: The stock appears overvalued, and we believe the stock's total return will be below the market over the next 12 months. SELL
SECTOR RATING O=Overweight: Industry expected to outperform the relevant broad market benchmark over the next 12 months. M=Market Weight: Industry expected to perform in-line with the relevant broad market benchmark over the next 12 months. U=Underweight: Industry expected to underperform the relevant broad market benchmark over the next 12 months.
VOLATILITY RATING V = A stock is defined as volatile if the stock price has fluctuated by +/-20% or greater in at least 8 of the past 24 months or if the analyst expects significant volatility. All IPO stocks are automatically rated volatile within the first 24 months of trading.
As of: 4/28/2015
43% of companies covered by Wells Fargo Securities, LLC Equity Research are rated Outperform.
Wells Fargo Securities, LLC has provided investment banking services for 43% of its Equity Research Outperform-rated companies.
55% of companies covered by Wells Fargo Securities, LLC Equity Research are rated Market Perform.
Wells Fargo Securities, LLC has provided investment banking services for 31% of its Equity Research Market Perform-rated companies.
2% of companies covered by Wells Fargo Securities, LLC Equity Research are rated Underperform.
Wells Fargo Securities, LLC has provided investment banking services for 29% of its Equity Research Underperform-rated companies.
13
Disclosures
Source: Wells Fargo Securities, LLC Estimates
Important Disclosure for International Clients
EEA – The securities and related financial instruments described herein may not be eligible for sale in all jurisdictions or to certain categories of investors. For recipients in the EEA, this report is distributed by Wells Fargo Securities International Limited (“WFSIL”). WFSIL is a U.K. incorporated investment firm authorized and regulated by the Financial Conduct Authority. For the purposes of Section 21 of the UK Financial Services and Markets Act 2000 (“the Act”), the content of this report has been approved by WFSIL a regulated person under the Act. WFSIL does not deal with retail clients as defined in the Markets in Financial Instruments Directive 2007. The FCA rules made under the Financial Services and Markets Act 2000 for the protection of retail clients will therefore not apply, nor will the Financial Services Compensation Scheme be available. This report is not intended for, and should not be relied upon by, retail clients.
Australia – Wells Fargo Securities, LLC is exempt from the requirements to hold an Australian financial services license in respect of the financial services it provides to wholesale clients in Australia. Wells Fargo Securities, LLC is regulated under U.S. laws which differ from Australian laws. Any offer or documentation provided to Australian recipients by Wells Fargo Securities, LLC in the course of providing the financial services will be prepared in accordance with the laws of the United States and not Australian laws.
Canada – This report is distributed in Canada by Wells Fargo Securities Canada, Ltd., a registered investment dealer in Canada and member of the Investment Industry Regulatory Organization of Canada (IIROC) and Canadian Investor Protection Fund (CIPF).
Hong Kong – This report is issued and distributed in Hong Kong by Wells Fargo Securities Asia Limited (“WFSAL”), a Hong Kong incorporated investment firm licensed and regulated by the Securities and Futures Commission of Hong Kong (“the SFC”) to carry on types 1, 4, 6 and 9 regulated activities (as defined in the Securities and Futures Ordinance (Cap. 571 of The Laws of Hong Kong), “the SFO”). This report is not intended for, and should not be relied on by, any person other than professional investors (as defined in the SFO). Any securities and related financial instruments described herein are not intended for sale, nor will be sold, to any person other than professional investors (as defined in the SFO). The author or authors of this report is or are not licensed by the SFC. Professional investors who receive this report should direct any queries regarding its contents to Mark Jones at WFSAL (email: [email protected] ).
Japan – This report is distributed in Japan by Wells Fargo Securities (Japan) Co., Ltd, registered with the Kanto Local Finance Bureau to conduct broking and dealing of type 1 and type 2 financial instruments and agency or intermediary service for entry into investment advisory or discretionary investment contracts. This report is intended for distribution only to professional investors (Tokutei Toushika) and is not intended for, and should not be relied upon by, ordinary customers (Ippan Toushika).
The ratings stated on the document are not provided by rating agencies registered with the Financial Services Agency of Japan (JFSA) but by group companies of JFSA-registered rating agencies. These group companies may include Moody’s Investors Services Inc., Standard & Poor’s Rating Services and/or Fitch Ratings. Any decisions to invest in securities or transactions should be made after reviewing policies and methodologies used for assigning credit ratings and assumptions, significance and limitations of the credit ratings stated on the respective rating agencies’ websites.
About Wells Fargo Securities Wells Fargo Securities is the trade name for the capital markets and investment banking services of Wells Fargo & Company and its subsidiaries, including but not limited to Wells Fargo Securities, LLC, a U.S. broker-dealer registered with the U.S. Securities and Exchange Commission and a member of NYSE, FINRA, NFA and SIPC, Wells Fargo Institutional Securities, LLC, a member of FINRA and SIPC, Wells Fargo Prime Services, LLC, a member of FINRA, NFA and SIPC, Wells Fargo Securities Canada, Ltd., a member of IIROC and CIPF, Wells Fargo Bank, N.A. and Wells Fargo Securities International Limited, authorized and regulated by the Financial Conduct Authority.
This report is for your information only and is not an offer to sell, or a solicitation of an offer to buy, the securities or instruments named or described in this report. Interested parties are advised to contact the entity with which they deal, or the entity that provided this report to them, if they desire further information. The information in this report has been obtained or derived from sources believed by Wells Fargo Securities, LLC, to be reliable, but Wells Fargo Securities, LLC does not represent that this information is accurate or complete. Any opinions or estimates contained in this report represent the judgment of Wells Fargo Securities, LLC, at this time, and are subject to change without notice. For the purposes of the U.K. Financial Conduct Authority's rules, this report constitutes impartial investment research. Each of Wells Fargo Securities, LLC and Wells Fargo Securities International Limited is a separate legal entity and distinct from affiliated banks. Copyright © 2015 Wells Fargo Securities, LLC.
SECURITIES: NOT FDIC-INSURED/NOT BANK-GUARANTEED/MAY LOSE VALUE