the babylon-syndrome - ifbsoft
TRANSCRIPT
Line-Array Simulation White Paper2006 April 1st by Volker Löwer IFBsoftEleonorentr. 11 65474 BischofsheimGermany
The Babylon-SyndromeThere is a lot of literature and dicussion going on on Line-Arrays. So this may just be another one.
Well, unfortunately there is no common standard on Line-Array data or algorithm for Line-Array behaviour prediction in CAAD simulation software.
At the time being the methods for Line-Array behaviour prediction are quite different and most of the data and methods used for prediction are not transparent to the user or can not be understood thoroughly.
And to our experience it gets really tough when it comes to ask speaker manufacturers for meaningful speaker data of a single Line-Array element.
During the recent years members of our company advised several diploma thesis which dealt with the investigation of Line-Array behaviour prediction in CAAD simulation software. In order to get meaningful single Line Array Element data for research, if we at least got any, our company had to sign a lot of wide-range nondisclosure agreements.
But what is so secret about speaker data?
So the question arises wheter the properties of a Line-Array may be determined by the properties of its elements, or not. But, if the properties are not located in the elements, where else are these properties located?
Meanwhile we see an accumulation of cases in our consulting business where a Line-Array simulation is required for a project. And surprisingly, the Line-Array of manufacturer A can only be simulated in Software X, while the Line-Array of manufacturer B can only be simulated in Software Y, because the data and methods for a specific Line Array are only available for a certain software package.
But, how do you compare the simulation results of this different methods and data? Comparabilty now becomes very questionable, we think. If you just think of the possible differences in data gathering for single loudspeaker elements and of different methods for calculation, how do we evaluate the simulation results and make up up a serious and meaningful decison for a project?
In one of our ongoing consulting projects it went even further: We had to evaluate a sound reinforcement design where a special Line-Array had been proposed by a contractor including some SPL, STI etc. mappings created by a simulation software.We posted some memo that we could not clearly reconstruct how the presented results had been generated and that we had no clear indication on which kind of speaker data it was based.We further noted that the presented simulation result showed a sigificant Hi-SPL hot-spot near the Line-Array compared to the far throw areas to be covered.
The response came in return.
It said, that the software-modules for this kind of speaker were still in progress and the the real world results would look pretty different from the simulation. And it additionally stated, that by variation of parameter settings the speaker array would be able to produce almost any kind of desired coverage and behaviour within a certain range.
Okay, if almost any kind of desired coverage and behaviour within a certain range can be produced CAAD simulation may become obsolete.
If the contractor would simply state (in writing) that he could produce almost any kind of desired coverage
1
Line-Array Simulation White Paper2006 April 1st by Volker Löwer IFBsoftEleonorentr. 11 65474 BischofsheimGermany
and behaviour within a certain range, then a simple painting software featuring a nice colour-palette would do for presentation of expected results.
CAAD Simulation, an Engineering and Design Tool?
We would like to engage ourselves so CAAD simulation continues being used as an engineering and design tool for prediction and planning purposes.
In order to obtain this goal it is indispensable that the speaker data used for simulation are transparent to the user and the methods of calculation can be understood, in principle, at least.
Just looking at single non-Line-Array speakers this goal is hard to reach, because different methods of data gathering, data formats, software packages and calculation methods coexist.
But in this case the simulation results are clearly generated from the input data (Speaker balloons that you can have a look at and check for plausibility) by applying the calculation procedures of the particular CAAD software.
For many of the Line-Array simulation software programs the user neither knows the input data (speaker properties, balloons etc.), nor does he know the methods how the overall properties, especially the directivity properties, are calculated.
This very much limits validity and plausibility checks and the evaluation of the calculated results, or in excess, makes evaluation or plausibility checks impossible.
The current situation may be called dissatisfying.
A User Transparent Approach
In order to overcome this dilemma IFBsoft tried to find a user transparent approach within the ULYSSES Software. The approximation of Line-Array behaviour has basically been available in the ULYSSES Software for a long time (A nice document is available on http://www.ifbsoft.de, e_line_array_diploma_thesis.pdf by Volker Holtmeyer).
For the most simple straight forward approach every speaker element of a Line-Array is represented by a point source balloon of this element measured in the far field. The far-field mentioned here is the far-field of one single Line Array element and must not be confused with the so called far-field of entire Line-Arrays often used in Line-Array terminology.
The level calculation (in octave-bandwidth mode11) includes relative phase calculated from path lenght difference vs. freqeuncy and results may be used for estimation on level distribution and other acoustical parameters to be expected.
Because the distances of the point sources representing the Line-Array are not small compared to the higher frequency wavelenghts of the audio spectrum some inaccuracies will occur at these frequencies. But in this case there is a clearly visible causal relationship between the input data, the method used for calculation and the results. So these inaccuracies can be detected, determined and interpreted. This method of interpreting and evaluating modeling result is a commonly used process in many engineering disciplines. No myth at all.
This approach is quite the controry to any black-box modeling simulation concept where the user is not able
1 Refer to ULYSSES online-Help for Octave Bandwith Method, http:/www.ifbsoft.de
2
Line-Array Simulation White Paper2006 April 1st by Volker Löwer IFBsoftEleonorentr. 11 65474 BischofsheimGermany
to decide which parts of the predicted results are simply generated by input and method, or by hidden, unknown or secret components.
At the time being IFBsoft works on refining the method of Line Array prediction in accuracy by representing every speaker element of a Line-Array by a number of vertically lined-up point source balloons.
But even such refinement approaches have to be derived from the single element balloon by a user transparent method and necessarily need the single balloon data as an input.
So this refinements will still have inaccuracies, but they will be determinable and a matter of engineering interpretation.We do not know yet exactly how sucessful and accurate it will turn out at the end of the day.
Real World Accuracy and Interpretation of Results
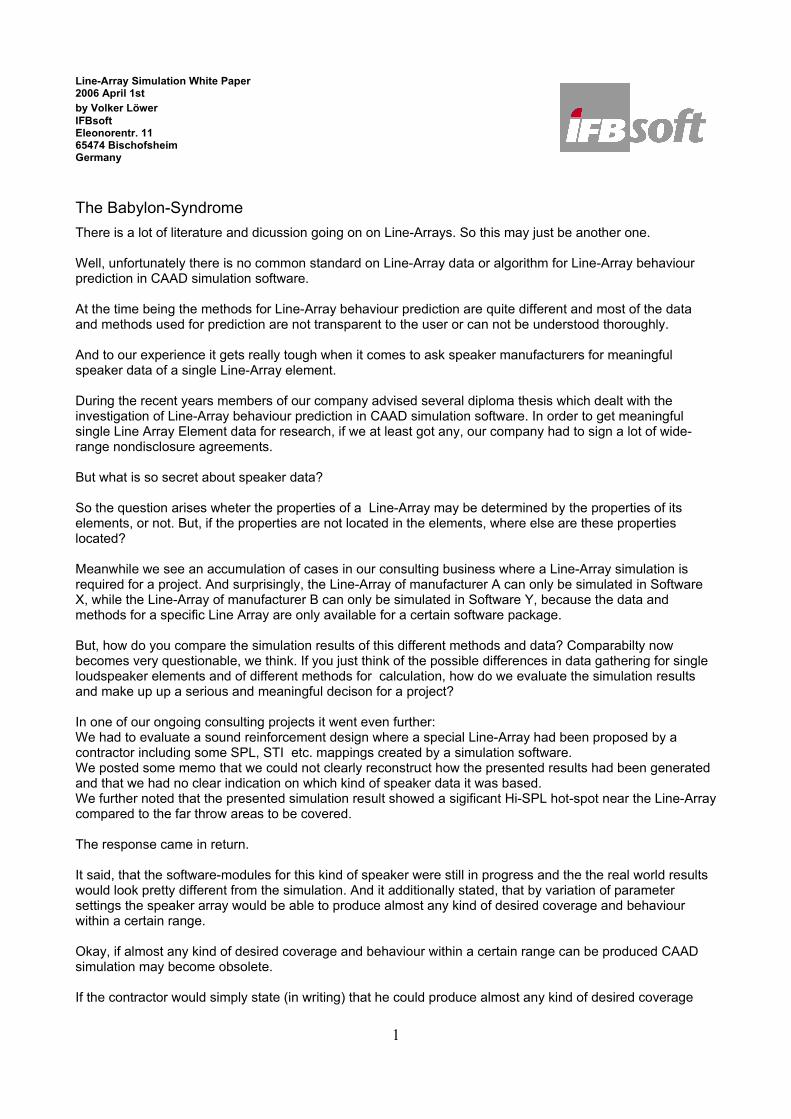
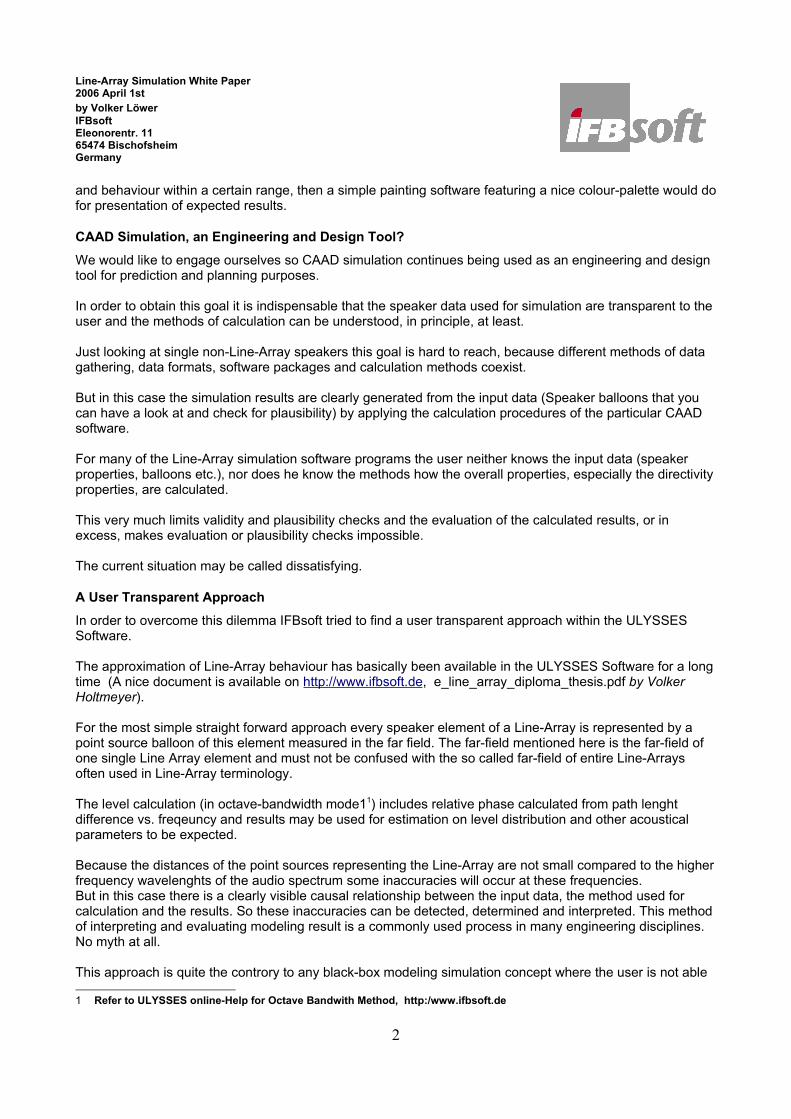
Fortunatlely one of our diploma candidates had the chance to compare the user transparent method of Line-Array simulation used in ULYSSES with real measurements.
In total Line-Arrays from 3 different manufacturers have been measured at exactly the same position in the same venue during 3 days, one manufacturer a day.
3
Image 1: The Venue
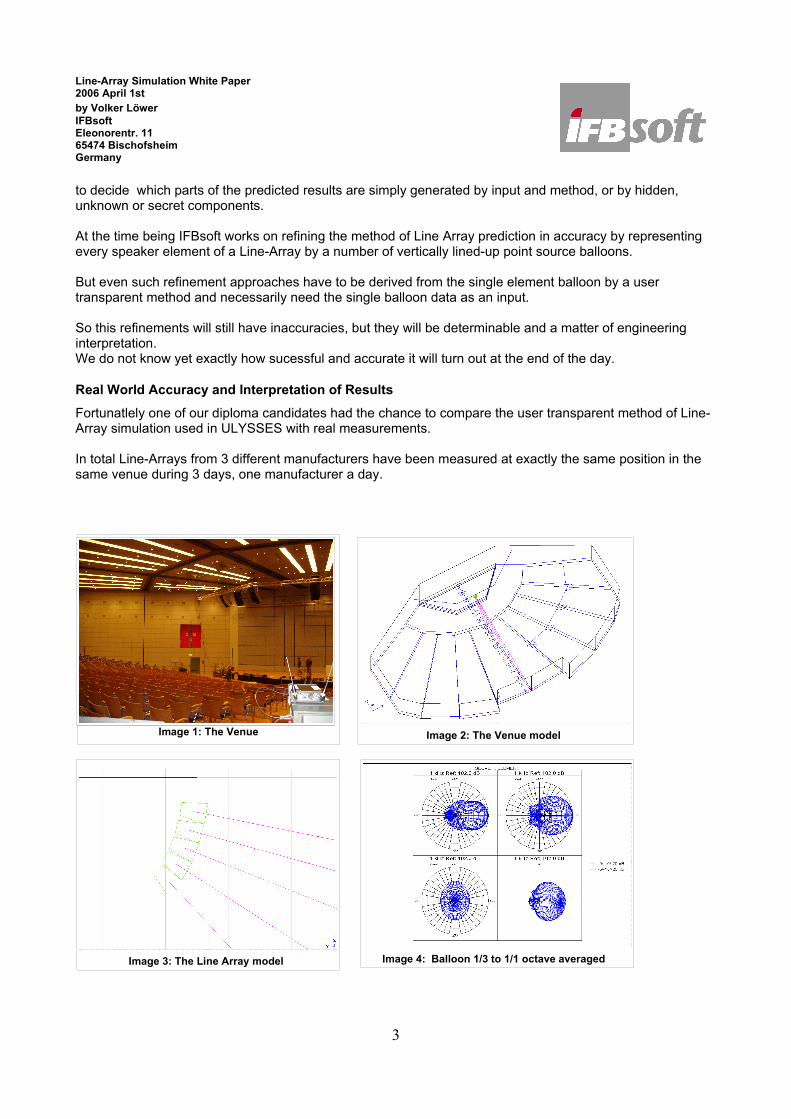
Image 3: The Line Array model Image 4: Balloon 1/3 to 1/1 octave averaged
Image 2: The Venue model
Line-Array Simulation White Paper2006 April 1st by Volker Löwer IFBsoftEleonorentr. 11 65474 BischofsheimGermany
In the simulated and measured set-up 5 Line-Array elements were used.
The manufacturer provided sufficient data for simulation (balloons etc.).
As we did before we signed another non-disclosure agreement not to produce this data to third parties or to pass it along for third party use.
Consequently the manufacturers name and the Line Array model or type will not be mentioned in this document.
The 1/3 octave data received from the manufaturer was averaged to 1/1 octave data.
The stacking, curving and orientation were determined by the manufacturer using his particular Line Array prediction spreadsheet. It was set-up for best coverage of the center audience area, so intentionally not covering the very far left and right part.
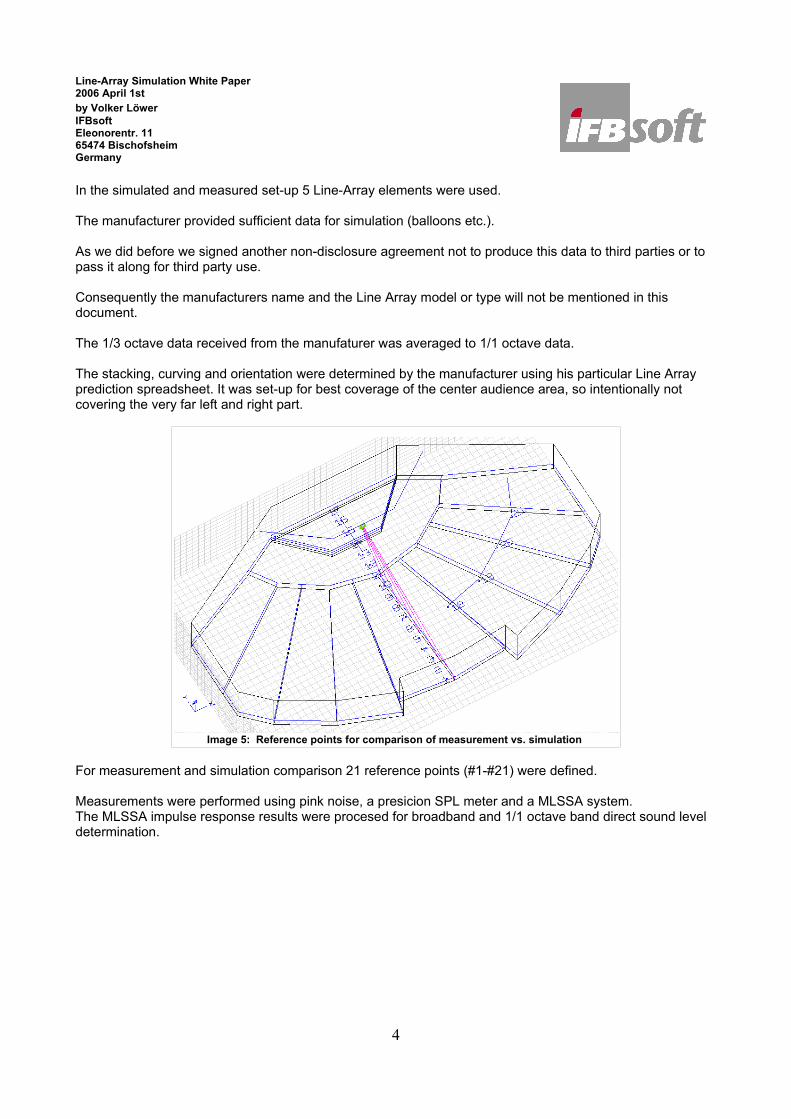
For measurement and simulation comparison 21 reference points (#1-#21) were defined.
Measurements were performed using pink noise, a presicion SPL meter and a MLSSA system. The MLSSA impulse response results were procesed for broadband and 1/1 octave band direct sound level determination.
4
Image 5: Reference points for comparison of measurement vs. simulation
Line-Array Simulation White Paper2006 April 1st by Volker Löwer IFBsoftEleonorentr. 11 65474 BischofsheimGermany
5
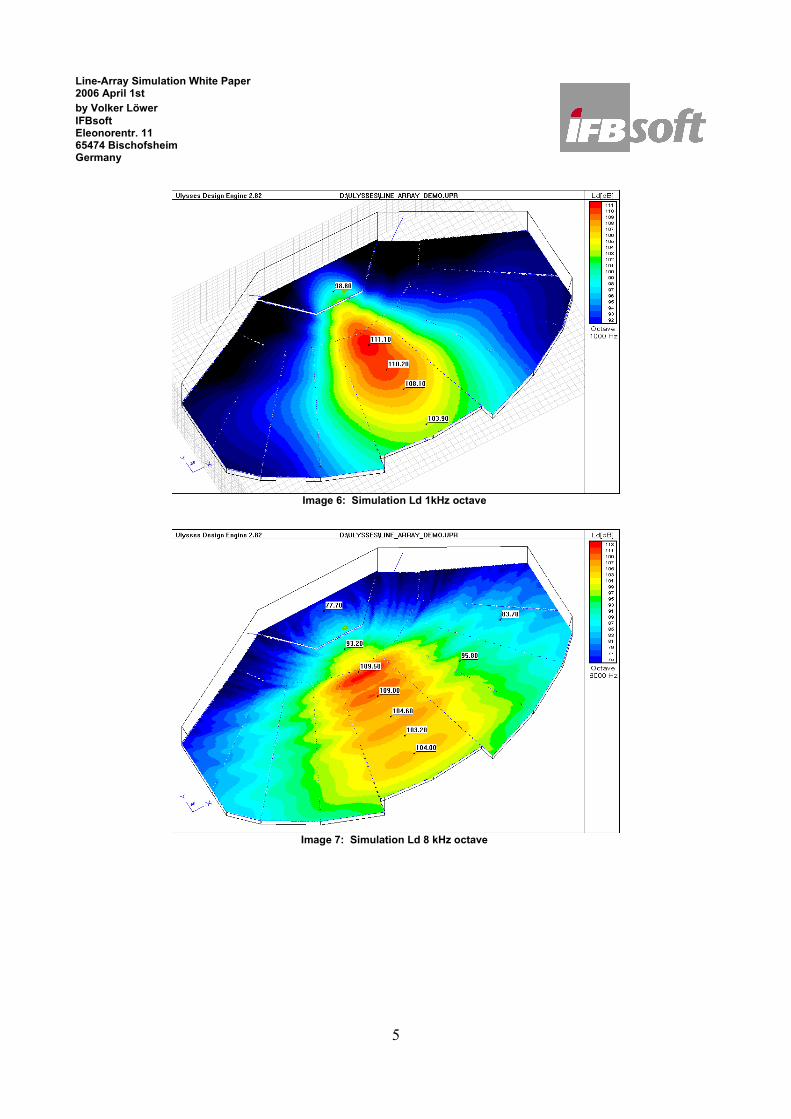
Image 6: Simulation Ld 1kHz octave
Image 7: Simulation Ld 8 kHz octave
Line-Array Simulation White Paper2006 April 1st by Volker Löwer IFBsoftEleonorentr. 11 65474 BischofsheimGermany
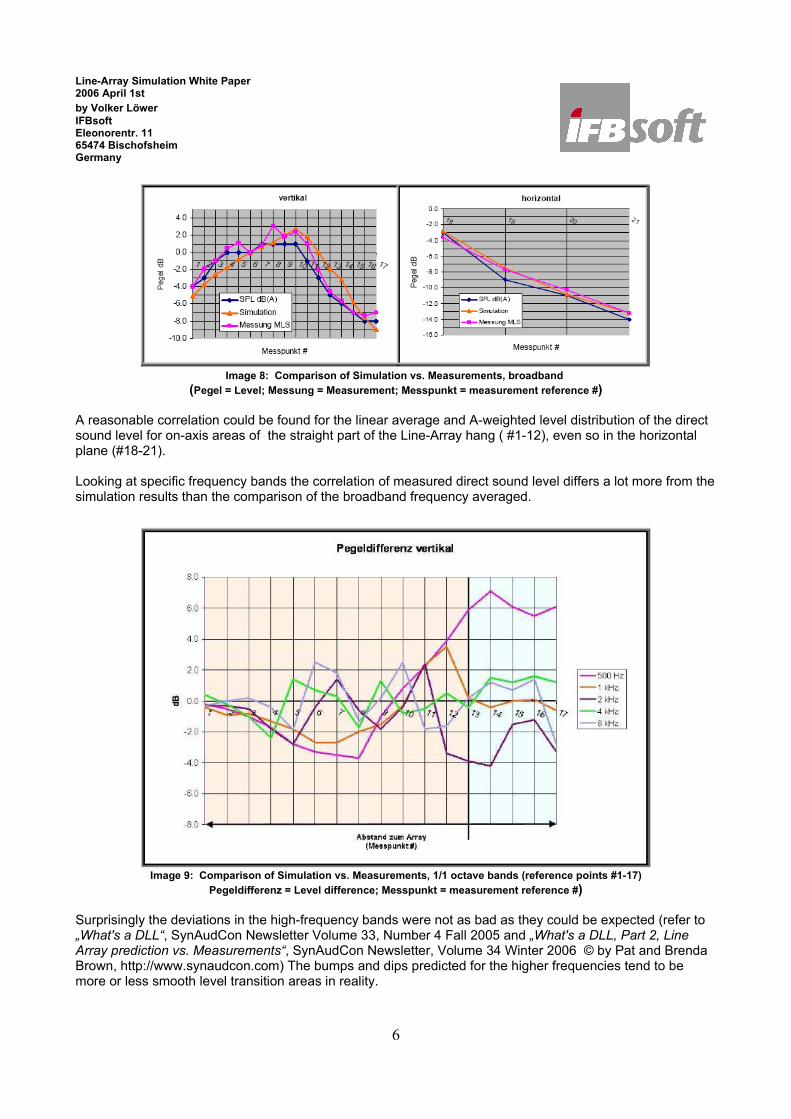
A reasonable correlation could be found for the linear average and A-weighted level distribution of the direct sound level for on-axis areas of the straight part of the Line-Array hang ( #1-12), even so in the horizontal plane (#18-21).
Looking at specific frequency bands the correlation of measured direct sound level differs a lot more from the simulation results than the comparison of the broadband frequency averaged.
Surprisingly the deviations in the high-frequency bands were not as bad as they could be expected (refer to „What's a DLL“, SynAudCon Newsletter Volume 33, Number 4 Fall 2005 and „What's a DLL, Part 2, Line Array prediction vs. Measurements“, SynAudCon Newsletter, Volume 34 Winter 2006 © by Pat and Brenda Brown, http://www.synaudcon.com) The bumps and dips predicted for the higher frequencies tend to be more or less smooth level transition areas in reality.
6
Image 8: Comparison of Simulation vs. Measurements, broadband (Pegel = Level; Messung = Measurement; Messpunkt = measurement reference #)
Image 9: Comparison of Simulation vs. Measurements, 1/1 octave bands (reference points #1-17) Pegeldifferenz = Level difference; Messpunkt = measurement reference #)
Line-Array Simulation White Paper2006 April 1st by Volker Löwer IFBsoftEleonorentr. 11 65474 BischofsheimGermany
The largest deviation can be seen for the lowest frequency displayed (due to physical restrictions in anechoic time window available) especially directly underneath the array (#12-13) and at its back side (#13-17). This is a well known artifact by this kind of point source simulation method producing backside lobes at the low end (refer to: „Berechnung der Schallpegelverteilung und der für die Schallimmission relevantenWerte mit Hilfe von Computersimulationen am Beispiel eines großen Stadions“ issued CAVIS 2003, Frankfurt/M. by Anselm Goertz, Audio & Acoustics Consulting Aachen ; http:/www.anselmgoertz.de).
We also know that some manufacturers use dummy speaker elements on top of and below a single line array element while measuring single element balloons to „compensate“ or „anticipate“ for the increased baffling and loading occuring when a common Line-Array configuration is made up of several Line-Array elements. To our understanding the intention of this dummy adding technique is to compensate the single element ballon for the backlobe tendency at the low frequencies when used in Line-Arrays. An interesting approach.
Recommendation
For Line-Array simulations with ULYSSES we recommend:
- point source balloons of this element measured in the far field- use of identical speaker elements (balloons) in the same Line-Array
Regarding Line-Array simulation results please note:
- perform level calculation in octave-bandwidth mode which will include relative phase
- Especially the higher frequency octave calculation results show some bumps and dips in direct sound level (and parameters derived from direct sound) in the main coverage area.
Measurements in real world scenarios did show less steep local bumps and dips.
The calculated results should not be over-interpreted by just looking at single octave bands. A more broadband look at midrange frequency bands average is closer to real world measurements.
- The calculation results will tend to show higher levels at the back side of the arrays for very low and low-mid frequency range compared to real world measurements (like in some other Line-Array prediction tools).
7

Line-Array Simulation White Paper2006 April 1st by Volker Löwer IFBsoftEleonorentr. 11 65474 BischofsheimGermany
Summary
In our consulting business we gained some experience with this user transparent approach prediction method for Line-Arrays in several projects.
The bottom line is that for the coverage area the predicted results generally indicated somewhat worse figures and parameters than the real world measurements (lower direct to reverberant ratios, higher ALCons and lower STI figures, higher level variation in some high frequency areas etc.).
But this turned out to be only valid when the Line Array could really perform like an array by design and appropriate set-up.
And simulation generally showed some back lobes for the low frequency end, which did not occur in real world scenarios with the intensity predicted by simulation. So it is possible to obtain meaningful prediction results which are transparent, reconstructable and compareable. But this is only possible, if the manusfacturers provide sufficient data for this purpose.
References/Credits2:
Diploma Thesis Draft: by Benjamin Lampert„Praxisnahe Simulation von Line-Array-Lautsprechersystemen mittels Directivity-Balloons“Referent: Prof. Dr.-Ing. Christof RickenKorreferent: Dipl.-Ing. Phys. Volker LöwerDraft issued: 2006 March 24
***
2 All pictures, models and figures courtesy of Benjamin Lampert
8