the australian online landscape review .... 2 welcome to the august 2014 edition of nielsen’s...
TRANSCRIPT
THE AUSTRALIAN ONLINE LANDSCAPE REVIEW AUGUST 2014
Co
pyr
igh
t ©
2014
Th
e N
iels
en C
om
pan
y. C
on
fid
enti
al a
nd
pro
pri
etar
y.
2
Welcome to the August 2014 edition of Nielsen’s Online Landscape Review. In August we deep dive into the categories of: • Education & Careers with a focus on career development sites. • Computers & Consumer Electronics – which saw high levels of growth in traffic;
this may have been influenced by the anticipation around the new product releases from Samsung, Apple, etc.
The online landscape in August saw Australians spend 37 hours online over 61 sessions; with nearly 32 billion minutes spent online with 32 billion pages viewed. Also, please note the updates for this month: 1. How to use custom roll ups 2. Nielsen Australian eGeneration Report 3. Southeast Asia Cross Platform series If you’d like to know more about any of the insights presented within this report, contact your Nielsen Account Manager directly or email [email protected].
STATE OF THE ONLINE LANDSCAPE
Source: Nielsen Online Ratings – Hybrid, August 2014; Nielsen Market Intelligence, August 2014
August 2014

HIGHLIGHTS NIELSEN ONLINE RATINGS: HYBRID

Co
pyr
igh
t ©
2014
Th
e N
iels
en C
om
pan
y. C
on
fid
enti
al a
nd
pro
pri
etar
y.
4
AT A GLANCE: THE ONLINE LANDSCAPE August 2014
32 billion viewed pages.
39 billion minutes spent.
37 hours spent online, across 61 sessions.
Source: Nielsen Online Ratings – Hybrid, August 2014 Indicates growth or decline based on the previous month
17,610,000 people were actively surfing online.
-

Co
pyr
igh
t ©
2014
Th
e N
iels
en C
om
pan
y. C
on
fid
enti
al a
nd
pro
pri
etar
y.
5
TOP 10 BRANDS AND THEIR ENGAGEMENT
Source: Nielsen Online Ratings – Hybrid, August 2014
August 2014
Including web-based applications
Unique Audience
Rank Brands
Unique Audience
(000s)
Page Views (000s)
Active Reach (%)
Sessions Per Person
Time Per Person (hh:mm:ss)
1 Google 15,064 3,812,808 85.54 28.34 03:05:41
2 Facebook 11,175 2,851,294 63.46 25.83 08:55:47
3 Mi9 10,954 1,432,098 62.20 19.18 02:32:35
4 YouTube 9,591 789,968 54.47 9.82 02:55:27
5 Microsoft 8,795 44,154 49.94 7.93 01:11:47
6 Yahoo!7 7,261 403,604 41.23 11.60 01:21:55
7 eBay 7,240 970,222 41.11 10.00 01:53:46
8 Wikipedia 7,063 206,934 40.11 6.20 00:36:43
9 Apple 5,811 27,555 33.00 7.71 00:50:11
10 PayPal 4,486 105,281 25.47 4.26 00:11:03

Co
pyr
igh
t ©
2014
Th
e N
iels
en C
om
pan
y. C
on
fid
enti
al a
nd
pro
pri
etar
y.
6
0
10
20
30
40
50
60
70
80
90
100
0 5 10 15 20 25 30 35 40
Act
ive
Rea
ch (
%)
Sessions per Person
Mi9
YouTube
Microsoft
Yahoo!7
eBay
Wikipedia
Apple
PayPal
TOP 10 BRANDS AND THEIR ENGAGEMENT
Bubble Size = Time per Person
Source: Nielsen Online Ratings – Hybrid, August 2014
August 2014
PayPal moved into the top 10 brands in August – they had a 4% increase in unique audience or a jump of 182,000 online Australians.
Co
pyr
igh
t ©
2014
Th
e N
iels
en C
om
pan
y. C
on
fid
enti
al a
nd
pro
pri
etar
y.
7
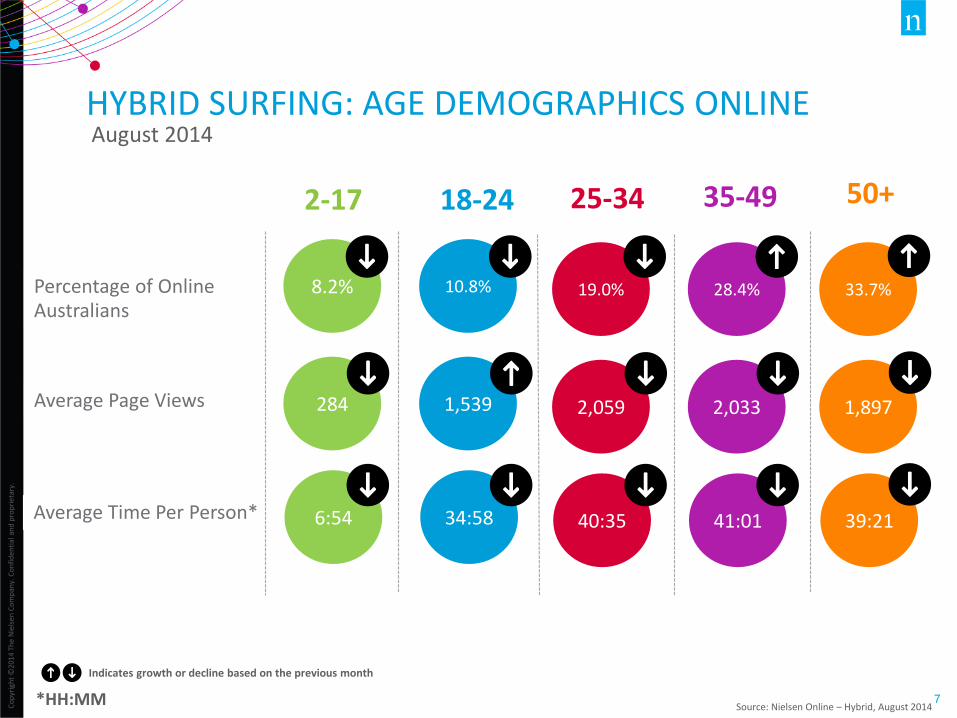
Average Time Per Person*
Average Page Views
2-17 18-24 25-34 35-49 50+
Percentage of Online Australians
HYBRID SURFING: AGE DEMOGRAPHICS ONLINE
1,640
37:03
*HH:MM Source: Nielsen Online – Hybrid, August 2014
August 2014
2,059
40:35
19.0%
2,033
41:01
28.4%
1,897
39:21
33.7%
284
6:54
8.2%
1,539
34:58
10.8%
Indicates growth or decline based on the previous month

Co
pyr
igh
t ©
2014
Th
e N
iels
en C
om
pan
y. C
on
fid
enti
al a
nd
pro
pri
etar
y.
8
8,970,000 UA 8,640,000 UA
GENDER BREAKDOWN – ACTIVE UNIVERSE
33%
29%
19%
11%
8% 50+
35-49
25-34
18-24
2-17
34%
28%
19%
10%
9% 50+
35-49
25-34
18-24
2-17
For Females – the slight increase of overall online female Australians was attributed by the 35-49 age demographic – the age group demographic had a bump of an additional 15,000 female individuals.
The increase in the active universe was contributed to the increased online activity from the 50+ age group – +3% or +79,000 male Australians aged 50+.
CATEGORY SPOTLIGHT: EDUCATION & CAREERS
Co
pyr
igh
t ©
2014
Th
e N
iels
en C
om
pan
y. C
on
fid
enti
al a
nd
pro
pri
etar
y.
10
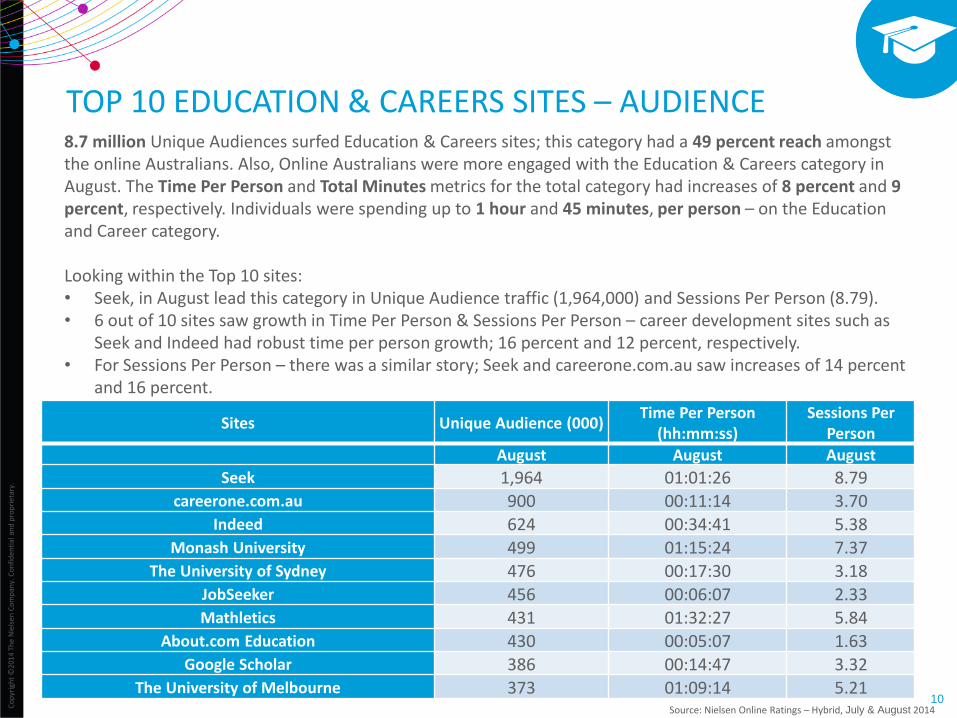
TOP 10 EDUCATION & CAREERS SITES – AUDIENCE
Source: Nielsen Online Ratings – Hybrid, July & August 2014
8.7 million Unique Audiences surfed Education & Careers sites; this category had a 49 percent reach amongst the online Australians. Also, Online Australians were more engaged with the Education & Careers category in August. The Time Per Person and Total Minutes metrics for the total category had increases of 8 percent and 9 percent, respectively. Individuals were spending up to 1 hour and 45 minutes, per person – on the Education and Career category. Looking within the Top 10 sites: • Seek, in August lead this category in Unique Audience traffic (1,964,000) and Sessions Per Person (8.79). • 6 out of 10 sites saw growth in Time Per Person & Sessions Per Person – career development sites such as
Seek and Indeed had robust time per person growth; 16 percent and 12 percent, respectively. • For Sessions Per Person – there was a similar story; Seek and careerone.com.au saw increases of 14 percent
and 16 percent.
Sites Unique Audience (000) Time Per Person
(hh:mm:ss) Sessions Per
Person
August August August
Seek 1,964 01:01:26 8.79 careerone.com.au 900 00:11:14 3.70
Indeed 624 00:34:41 5.38 Monash University 499 01:15:24 7.37
The University of Sydney 476 00:17:30 3.18 JobSeeker 456 00:06:07 2.33 Mathletics 431 01:32:27 5.84
About.com Education 430 00:05:07 1.63 Google Scholar 386 00:14:47 3.32
The University of Melbourne 373 01:09:14 5.21
Co
pyr
igh
t ©
2014
Th
e N
iels
en C
om
pan
y. C
on
fid
enti
al a
nd
pro
pri
etar
y.
11
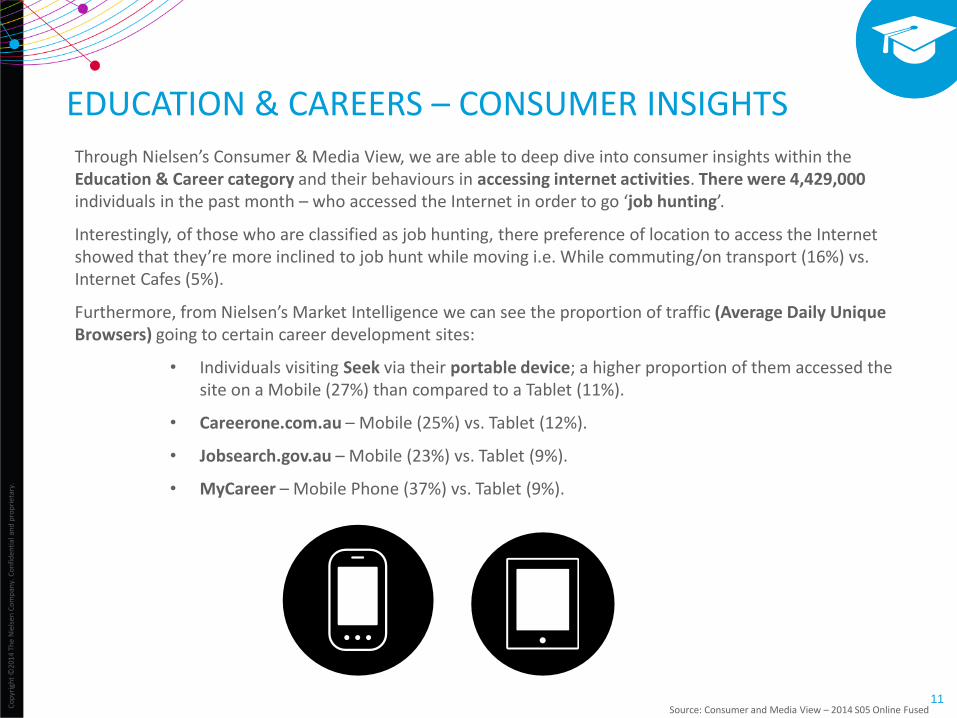
EDUCATION & CAREERS – CONSUMER INSIGHTS
Source: Consumer and Media View – 2014 S05 Online Fused
Through Nielsen’s Consumer & Media View, we are able to deep dive into consumer insights within the Education & Career category and their behaviours in accessing internet activities. There were 4,429,000 individuals in the past month – who accessed the Internet in order to go ‘job hunting’.
Interestingly, of those who are classified as job hunting, there preference of location to access the Internet showed that they’re more inclined to job hunt while moving i.e. While commuting/on transport (16%) vs. Internet Cafes (5%).
Furthermore, from Nielsen’s Market Intelligence we can see the proportion of traffic (Average Daily Unique Browsers) going to certain career development sites:
• Individuals visiting Seek via their portable device; a higher proportion of them accessed the site on a Mobile (27%) than compared to a Tablet (11%).
• Careerone.com.au – Mobile (25%) vs. Tablet (12%).
• Jobsearch.gov.au – Mobile (23%) vs. Tablet (9%).
• MyCareer – Mobile Phone (37%) vs. Tablet (9%).

HIGHLIGHTS NIELSEN ONLINE RATINGS: HYBRID STREAMING

Co
pyr
igh
t ©
2014
Th
e N
iels
en C
om
pan
y. C
on
fid
enti
al a
nd
pro
pri
etar
y.
13
7 hours and 47 minutes spent streaming per person.
13,214,000 people were actively streaming online.
HYBRID STREAMING KEY ONLINE STATISTICS August 2014
2.8 billion streams watched.
6.2 billion minutes streamed.
Source: Nielsen Online Ratings – Hybrid, August 2014 Indicates growth or decline based on the previous month

Co
pyr
igh
t ©
2014
Th
e N
iels
en C
om
pan
y. C
on
fid
enti
al a
nd
pro
pri
etar
y.
14
August 2014
TOP BRANDS COMPARISON - STREAMING
11,072
6,100
3,558
2,526
2,292
1,559
1,517
1,269
1,108
1,037
YOUTUBE
VEVO
THE COLLEGEHUMOR NETWORK
MI9
SMH.COM.AU
NEWS.COM.AU
ABC ONLINE NETWORK
YAHOO!7
TELSTRA MEDIA
August
11,486
5,959
4,030
2,579
2,595
1,436
1,747
1,109
1,302
930
YOUTUBE
VEVO
THE COLLEGEHUMOR NETWORK
MI9
SMH.COM.AU
NEWS.COM.AU
ABC ONLINE NETWORK
YAHOO!7
TELSTRA MEDIA
July
-4%
+2%
-12%
-2%
-12%
+9%
-13%
+14%
-15%
1
2
3
4
5
6
7
8
9
10 +12%

Co
pyr
igh
t ©
2014
Th
e N
iels
en C
om
pan
y. C
on
fid
enti
al a
nd
pro
pri
etar
y.
15
HYBRID STREAMING: TOP 10 BRANDS BY AUDIENCE
Source: Nielsen Online Ratings – Hybrid, August 2014
August 2014
Including web-based applications
Unique Audience
Rank Brand Unique Audience (000s) Total Streams
Time Per Person (hh:mm:ss)
1 YouTube 11,072 1,477,821 04:38:03
2 Facebook 6,100 167,084 01:31:36
3 VEVO 3,558 98,860 01:08:33
4 The CollegeHumor
Network 2,526 8,692 00:14:07
5 Mi9 2,292 31,443 00:20:27
6 smh.com.au 1,559 4,887 00:05:31
7 news.com.au 1,517 10,199 00:10:10
8 ABC Online
Network 1,269 8,990 02:35:18
9 Yahoo!7 1,108 10,996 00:45:57
10 Telstra Media 1,037 8,480 00:35:39

Co
pyr
igh
t ©
2014
Th
e N
iels
en C
om
pan
y. C
on
fid
enti
al a
nd
pro
pri
etar
y.
16
GENDER BREAKDOWN – HYBRID STREAMING
6,679,000 Number of Streaming Australians
1,091,653
163
7:00:33 Time Per Person (HH:MM:SS)
Total Streams Viewed (000s)
Streams per person
6,534,000
1,687,777
258
8:34:19
As an overall – Australians were streaming less in August. However – looking into the specifics; the frequency of streaming grew for males. Male Australians had double digit growth for Total Streams and Streams Per Person; 13% and 10%, respectively.

Co
pyr
igh
t ©
2014
Th
e N
iels
en C
om
pan
y. C
on
fid
enti
al a
nd
pro
pri
etar
y.
17
Average Time Per Person*
Average Streams
2-17 18-24 25-34 35-49 50+
Percentage of Online Australians
HYBRID STREAMING: AGE DEMOGRAPHICS ONLINE
1,640
37:03
Source: Nielsen Online – Hybrid, August 2014
August 2014
253
9:06
20.2%
207
7:29
29.0%
156
6:20
34.4%
185
5:01
6.2%
332
12:34
10.2%
*HH:MM
Indicates growth or decline based on the previous month

DEVICE HIGHLIGHTS NIELSEN ONLINE RATINGS: MARKET INTELLIGENCE
Co
pyr
igh
t ©
2014
Th
e N
iels
en C
om
pan
y. C
on
fid
enti
al a
nd
pro
pri
etar
y.
19
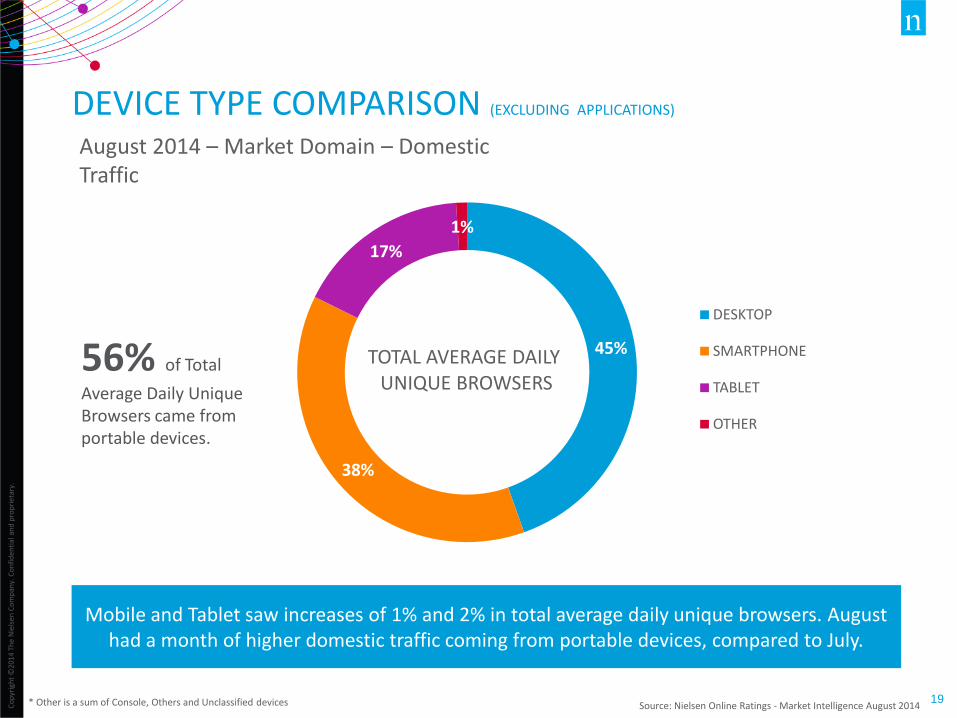
45%
38%
17%
1%
TOTAL AVERAGE DAILY UNIQUE BROWSERS
DESKTOP
SMARTPHONE
TABLET
OTHER
August 2014 – Market Domain – Domestic Traffic
DEVICE TYPE COMPARISON (EXCLUDING APPLICATIONS)
* Other is a sum of Console, Others and Unclassified devices Source: Nielsen Online Ratings - Market Intelligence August 2014
56% of Total
Average Daily Unique Browsers came from portable devices.
Mobile and Tablet saw increases of 1% and 2% in total average daily unique browsers. August had a month of higher domestic traffic coming from portable devices, compared to July.
CATEGORY SPOTLIGHT: COMPUTERS & CONSUMER ELECTRONICS
Co
pyr
igh
t ©
2014
Th
e N
iels
en C
om
pan
y. C
on
fid
enti
al a
nd
pro
pri
etar
y.
21 Source: Nielsen Online Ratings – Hybrid, August 2014
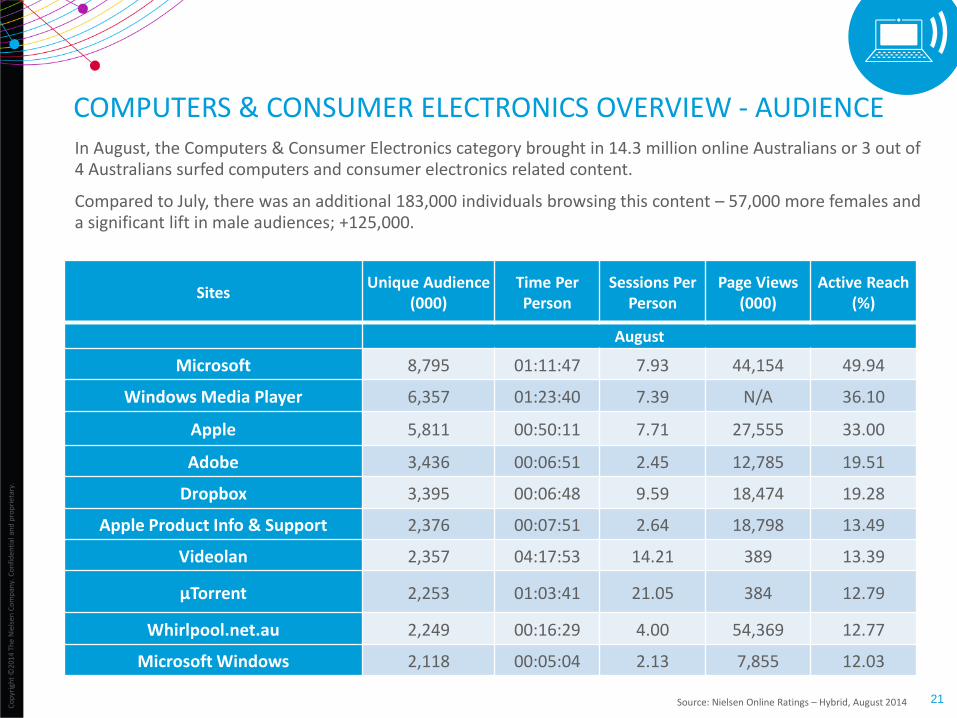
In August, the Computers & Consumer Electronics category brought in 14.3 million online Australians or 3 out of 4 Australians surfed computers and consumer electronics related content.
Compared to July, there was an additional 183,000 individuals browsing this content – 57,000 more females and a significant lift in male audiences; +125,000.
Sites Unique Audience
(000) Time Per Person
Sessions Per Person
Page Views (000)
Active Reach (%)
August
Microsoft 8,795 01:11:47 7.93 44,154 49.94
Windows Media Player 6,357 01:23:40 7.39 N/A 36.10
Apple 5,811 00:50:11 7.71 27,555 33.00
Adobe 3,436 00:06:51 2.45 12,785 19.51
Dropbox 3,395 00:06:48 9.59 18,474 19.28
Apple Product Info & Support 2,376 00:07:51 2.64 18,798 13.49
Videolan 2,357 04:17:53 14.21 389 13.39
µTorrent 2,253 01:03:41 21.05 384 12.79
Whirlpool.net.au 2,249 00:16:29 4.00 54,369 12.77
Microsoft Windows 2,118 00:05:04 2.13 7,855 12.03
COMPUTERS & CONSUMER ELECTRONICS OVERVIEW - AUDIENCE
Co
pyr
igh
t ©
2014
Th
e N
iels
en C
om
pan
y. C
on
fid
enti
al a
nd
pro
pri
etar
y.
22
GENDER BREAKDOWN – COMPUTERS & CONSUMER ELECTRONICS
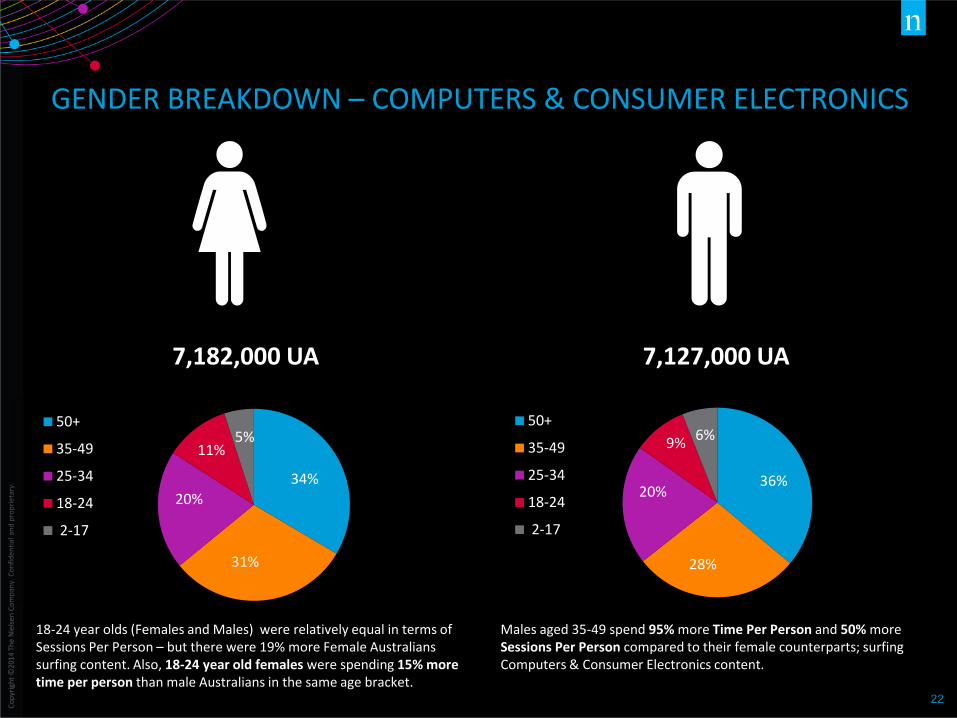
7,182,000 UA 7,127,000 UA
34%
31%
20%
11% 5%
50+
35-49
25-34
18-24
2-17
36%
28%
20%
9% 6%
50+
35-49
25-34
18-24
2-17
18-24 year olds (Females and Males) were relatively equal in terms of Sessions Per Person – but there were 19% more Female Australians surfing content. Also, 18-24 year old females were spending 15% more time per person than male Australians in the same age bracket.
Males aged 35-49 spend 95% more Time Per Person and 50% more Sessions Per Person compared to their female counterparts; surfing Computers & Consumer Electronics content.
Co
pyr
igh
t ©
2014
Th
e N
iels
en C
om
pan
y. C
on
fid
enti
al a
nd
pro
pri
etar
y.
23 Source: Nielsen Market Intelligence , July & August 2014
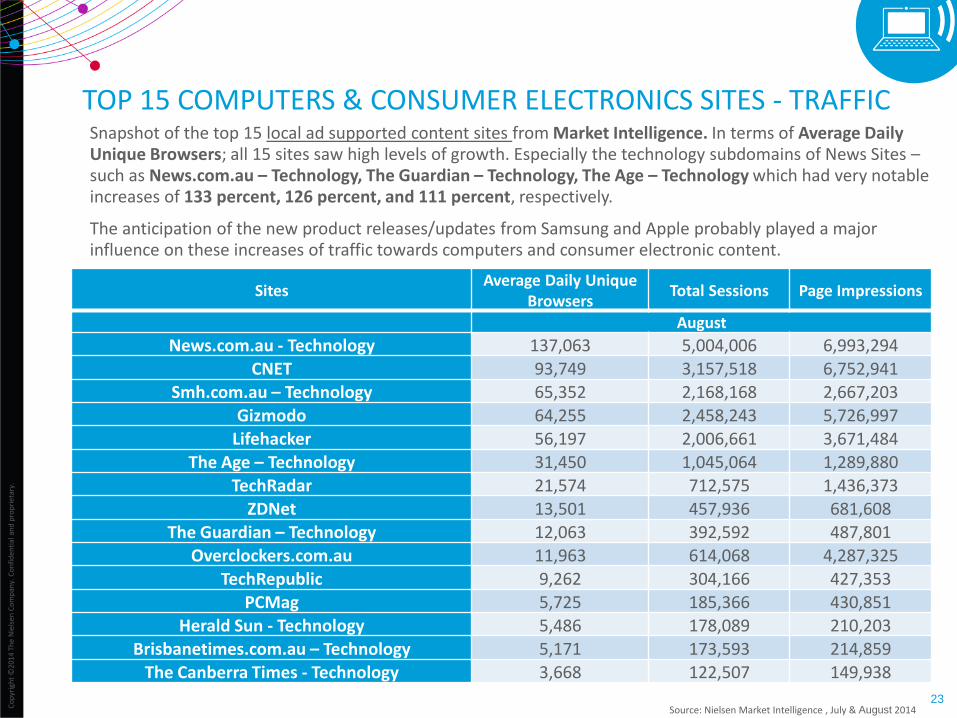
Snapshot of the top 15 local ad supported content sites from Market Intelligence. In terms of Average Daily Unique Browsers; all 15 sites saw high levels of growth. Especially the technology subdomains of News Sites – such as News.com.au – Technology, The Guardian – Technology, The Age – Technology which had very notable increases of 133 percent, 126 percent, and 111 percent, respectively.
The anticipation of the new product releases/updates from Samsung and Apple probably played a major influence on these increases of traffic towards computers and consumer electronic content.
Sites Average Daily Unique
Browsers Total Sessions Page Impressions
August
News.com.au - Technology 137,063 5,004,006 6,993,294 CNET 93,749 3,157,518 6,752,941
Smh.com.au – Technology 65,352 2,168,168 2,667,203
Gizmodo 64,255 2,458,243 5,726,997 Lifehacker 56,197 2,006,661 3,671,484
The Age – Technology 31,450 1,045,064 1,289,880
TechRadar 21,574 712,575 1,436,373
ZDNet 13,501 457,936 681,608 The Guardian – Technology 12,063 392,592 487,801
Overclockers.com.au 11,963 614,068 4,287,325
TechRepublic 9,262 304,166 427,353 PCMag 5,725 185,366 430,851
Herald Sun - Technology 5,486 178,089 210,203 Brisbanetimes.com.au – Technology 5,171 173,593 214,859
The Canberra Times - Technology 3,668 122,507 149,938
TOP 15 COMPUTERS & CONSUMER ELECTRONICS SITES - TRAFFIC

PRODUCT UPDATES FOR THIS MONTH:

Co
pyr
igh
t ©
2014
Th
e N
iels
en C
om
pan
y. C
on
fid
enti
al a
nd
pro
pri
etar
y.
25
Custom rollups are used by publishers for two reasons: 1. To combine multiple sites and sections across any category to create a de-duplicated number. This is often required for Ad Network reporting or for publisher sales teams to aggregate content in the way they sell it. Example: MCN MCN wanted to regularly report on a de-duplicated figure for all their entertainment sites. This custom rollup is called MCN-Entertainment. MCN have also made custom rollups for their lifestyle sites, music and youth sites as well as their news sites. This makes it quicker and easier for MCN to run reports each month.
2. A site may not fit into Nielsen’s categorisation or hierarchy rules so a Custom Rollup is required to appropriately report the site. Example: The West Australian The West Australian is a sub-domain of the Yahoo!7 News site. This limits their ability to be an individual brand or channel listed in the News & Information category amongst their competitors. A custom rollup was created by The West Australian to accurately show their site’s metrics to the market.
Things to remember when using Custom Rollups: Categorisation: Custom rollups do not automatically appear when running category reports. You need to run them separately out of the search functionality. State-based data: Custom rollups do appear in Nielsen’s state-based reports located at the bottom of the Nielsen Answers homepage after you login. URL Report: Custom rollups have a report showing all the URLS which contribute to each. This is also located at the bottom of the Nielsen Answers homepage. If you ever have any questions about your custom rollups or those of a competitor, please reach out to your Nielsen representative.
NIELSEN – USING CUSTOM ROLL UPS
Co
pyr
igh
t ©
2014
Th
e N
iels
en C
om
pan
y. C
on
fid
enti
al a
nd
pro
pri
etar
y.
26
IT’S CHILD’S PLAY! TODAY’S CONNECTED KIDS AND TEENS Australian eGeneration Report
Australian households with kids and teens have the highest number of connected devices in the home. Three-in-five (60%) households with primary school age children own a tablet, and half have an internet connected TV in the home. With penetration growing every year, digital platforms are increasingly becoming an ideal way to talk to and reach Australians kids and teens. How marketers and brands connect, educate and engage this consumer now, is vital for their future. Want to know more? Reach out to your Nielsen account manager if you are interested in more information about how you can be involved with this report. There is also a special discounted rate for clients subscribing to the report in September!

SOUTH ASIA CROSS PLATFORM SERIES
Co
pyr
igh
t ©
20
14
Th
e N
iels
en
Co
mp
any.
Co
nfi
de
nti
al a
nd
pro
pri
eta
ry.
28
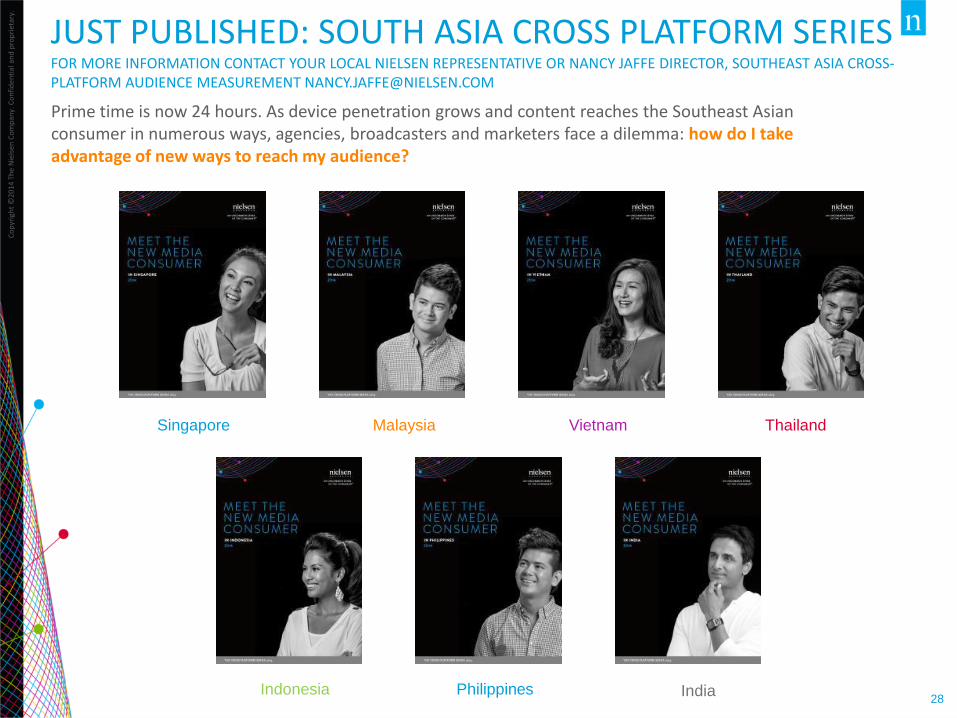
JUST PUBLISHED: SOUTH ASIA CROSS PLATFORM SERIES FOR MORE INFORMATION CONTACT YOUR LOCAL NIELSEN REPRESENTATIVE OR NANCY JAFFE DIRECTOR, SOUTHEAST ASIA CROSS-PLATFORM AUDIENCE MEASUREMENT [email protected]
Singapore Vietnam
Indonesia
Thailand Malaysia
India Philippines
Prime time is now 24 hours. As device penetration grows and content reaches the Southeast Asian consumer in numerous ways, agencies, broadcasters and marketers face a dilemma: how do I take advantage of new ways to reach my audience?
