the ausaid wash programme monitoring and evaluation review ... · pdf filethe ausaid wash...
TRANSCRIPT
The AusAID WASH Programme Monitoring and Evaluation
Review Report
February 2013
Killian Mutiro
2
Table of Contents List of Acronyms ............................................................................................................................................ 3
Executive Summary ....................................................................................................................................... 4
1.0 Introduction and Background ................................................................................................................. 7
2.0 Objectives of the M&E Systems Review ................................................................................................. 7
3.0 Analytical Framework for the Review ..................................................................................................... 8
Methods ........................................................................................................................................................ 9
3.1 Desk Review of Logframes and Project Documents ..................................................................... 9
3.2 Key Informant Interviews (KII) and Consultative Meetings with Partner M&E Staff.................... 9
3.3 Key Informant Interviews (KII) and Consultative Meetings with AusAID Staff ........................... 10
4.0 Review Findings..................................................................................................................................... 10
4.1 The AusAID WASH Program Theory of Change................................................................................. 10
4.2 Status of the Monitoring and Evaluation System ............................................................................. 17
4.2 Progress Monitoring Systems ........................................................................................................... 17
4.3 Outcome Tracking systems ............................................................................................................... 18
4.2 Indicators and Data Collection Processes ........................................................................................ 19
4.3 Information Management ................................................................................................................ 22
5. Conclusions and Recommendations ....................................................................................................... 23
6. Annexes ................................................................................................................................................... 25
Appendix 1: African Development Bank ................................................................................................. 25
Appendix 2: GIZ ....................................................................................................................................... 29
Appendix 3: World Bank ......................................................................................................................... 33
Appendix 4: UNICEF ................................................................................................................................ 36
Appendix 5: World Vision ....................................................................................................................... 43
3
List of Acronyms
1. ER&RR Emergency Rehabilitation and Risk Reduction Programme 2. IP Implementing Partner 3. IPTT Indicator Performance Tracking Table 4. ITT Indicator Tracking Template 5. KII Key Informant Interview 6. M&E Monitoring and Evaluation 7. NCU National Coordination Unit 8. NGO Non-governmental Organization 9. PAF Performance Assessment Framework 10. PHHE Participatory Health and Hygiene Education 11. SMART Specific Measurable Achievable Relevant Time bound 12. TOR Terms of Reference 13. VHW Village Health Worker 14. WASH Water Sanitation and Hygiene 15. WHO World Health Organization 16. ZINWA Zimbabwe National Water Authority
4
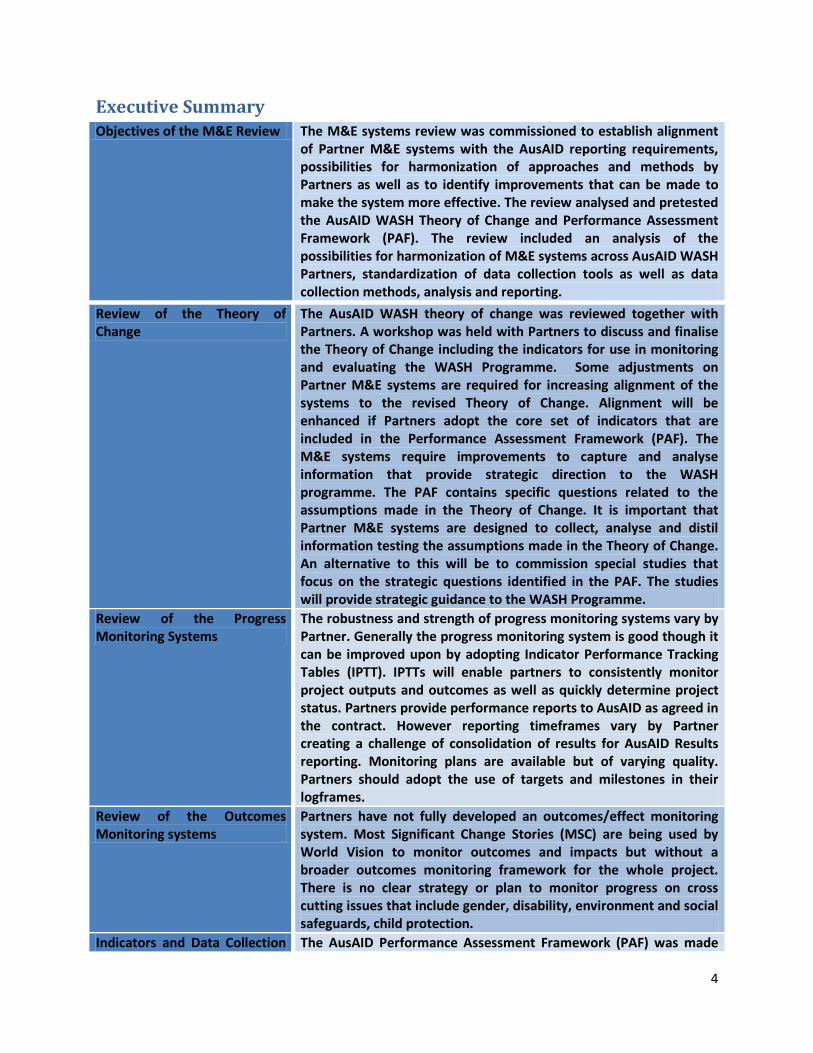
Executive Summary Objectives of the M&E Review The M&E systems review was commissioned to establish alignment
of Partner M&E systems with the AusAID reporting requirements, possibilities for harmonization of approaches and methods by Partners as well as to identify improvements that can be made to make the system more effective. The review analysed and pretested the AusAID WASH Theory of Change and Performance Assessment Framework (PAF). The review included an analysis of the possibilities for harmonization of M&E systems across AusAID WASH Partners, standardization of data collection tools as well as data collection methods, analysis and reporting.
Review of the Theory of Change
The AusAID WASH theory of change was reviewed together with Partners. A workshop was held with Partners to discuss and finalise the Theory of Change including the indicators for use in monitoring and evaluating the WASH Programme. Some adjustments on Partner M&E systems are required for increasing alignment of the systems to the revised Theory of Change. Alignment will be enhanced if Partners adopt the core set of indicators that are included in the Performance Assessment Framework (PAF). The M&E systems require improvements to capture and analyse information that provide strategic direction to the WASH programme. The PAF contains specific questions related to the assumptions made in the Theory of Change. It is important that Partner M&E systems are designed to collect, analyse and distil information testing the assumptions made in the Theory of Change. An alternative to this will be to commission special studies that focus on the strategic questions identified in the PAF. The studies will provide strategic guidance to the WASH Programme.
Review of the Progress Monitoring Systems
The robustness and strength of progress monitoring systems vary by Partner. Generally the progress monitoring system is good though it can be improved upon by adopting Indicator Performance Tracking Tables (IPTT). IPTTs will enable partners to consistently monitor project outputs and outcomes as well as quickly determine project status. Partners provide performance reports to AusAID as agreed in the contract. However reporting timeframes vary by Partner creating a challenge of consolidation of results for AusAID Results reporting. Monitoring plans are available but of varying quality. Partners should adopt the use of targets and milestones in their logframes.
Review of the Outcomes Monitoring systems
Partners have not fully developed an outcomes/effect monitoring system. Most Significant Change Stories (MSC) are being used by World Vision to monitor outcomes and impacts but without a broader outcomes monitoring framework for the whole project. There is no clear strategy or plan to monitor progress on cross cutting issues that include gender, disability, environment and social safeguards, child protection.
Indicators and Data Collection The AusAID Performance Assessment Framework (PAF) was made
5
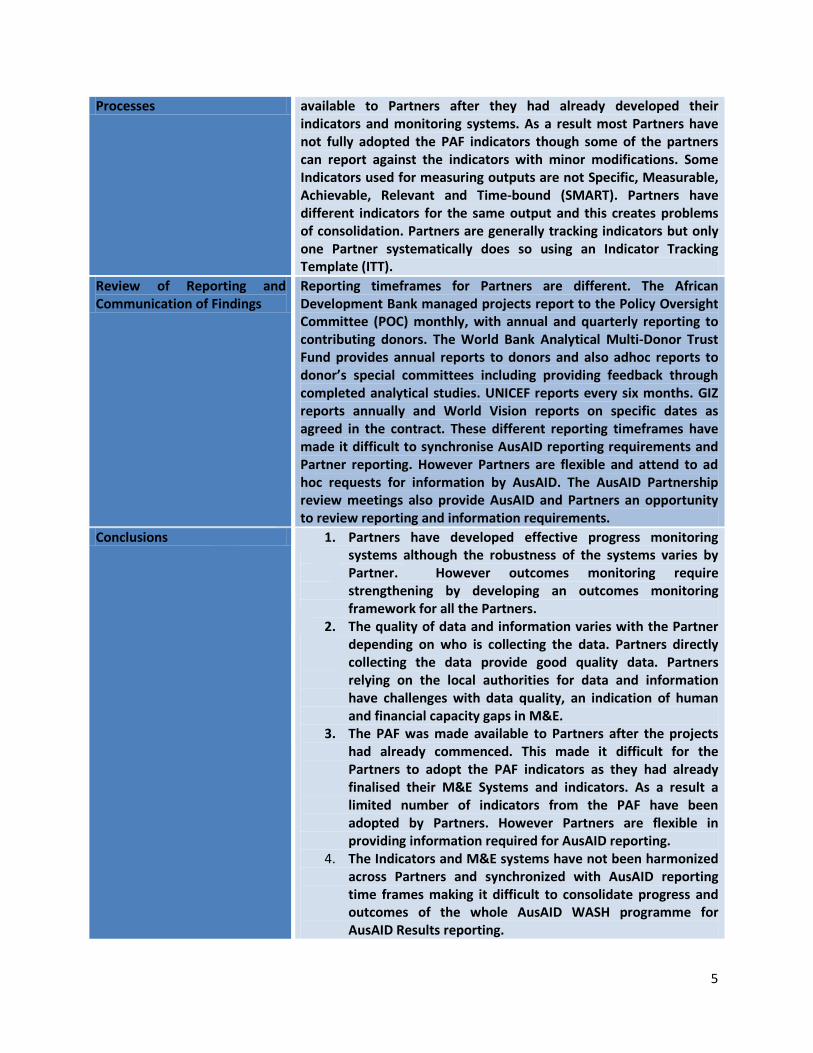
Processes available to Partners after they had already developed their indicators and monitoring systems. As a result most Partners have not fully adopted the PAF indicators though some of the partners can report against the indicators with minor modifications. Some Indicators used for measuring outputs are not Specific, Measurable, Achievable, Relevant and Time-bound (SMART). Partners have different indicators for the same output and this creates problems of consolidation. Partners are generally tracking indicators but only one Partner systematically does so using an Indicator Tracking Template (ITT).
Review of Reporting and Communication of Findings
Reporting timeframes for Partners are different. The African Development Bank managed projects report to the Policy Oversight Committee (POC) monthly, with annual and quarterly reporting to contributing donors. The World Bank Analytical Multi-Donor Trust Fund provides annual reports to donors and also adhoc reports to donor’s special committees including providing feedback through completed analytical studies. UNICEF reports every six months. GIZ reports annually and World Vision reports on specific dates as agreed in the contract. These different reporting timeframes have made it difficult to synchronise AusAID reporting requirements and Partner reporting. However Partners are flexible and attend to ad hoc requests for information by AusAID. The AusAID Partnership review meetings also provide AusAID and Partners an opportunity to review reporting and information requirements.
Conclusions 1. Partners have developed effective progress monitoring systems although the robustness of the systems varies by Partner. However outcomes monitoring require strengthening by developing an outcomes monitoring framework for all the Partners.
2. The quality of data and information varies with the Partner depending on who is collecting the data. Partners directly collecting the data provide good quality data. Partners relying on the local authorities for data and information have challenges with data quality, an indication of human and financial capacity gaps in M&E.
3. The PAF was made available to Partners after the projects had already commenced. This made it difficult for the Partners to adopt the PAF indicators as they had already finalised their M&E Systems and indicators. As a result a limited number of indicators from the PAF have been adopted by Partners. However Partners are flexible in providing information required for AusAID reporting.
4. The Indicators and M&E systems have not been harmonized across Partners and synchronized with AusAID reporting time frames making it difficult to consolidate progress and outcomes of the whole AusAID WASH programme for AusAID Results reporting.
6
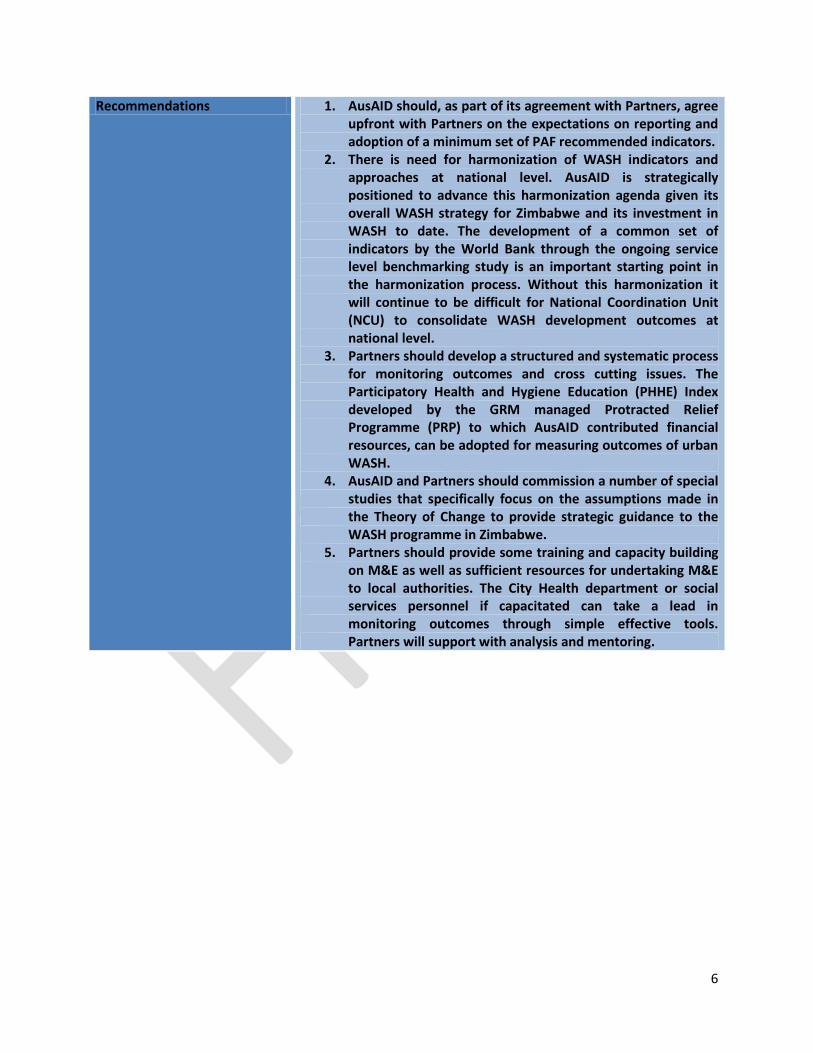
Recommendations 1. AusAID should, as part of its agreement with Partners, agree upfront with Partners on the expectations on reporting and adoption of a minimum set of PAF recommended indicators.
2. There is need for harmonization of WASH indicators and approaches at national level. AusAID is strategically positioned to advance this harmonization agenda given its overall WASH strategy for Zimbabwe and its investment in WASH to date. The development of a common set of indicators by the World Bank through the ongoing service level benchmarking study is an important starting point in the harmonization process. Without this harmonization it will continue to be difficult for National Coordination Unit (NCU) to consolidate WASH development outcomes at national level.
3. Partners should develop a structured and systematic process for monitoring outcomes and cross cutting issues. The Participatory Health and Hygiene Education (PHHE) Index developed by the GRM managed Protracted Relief Programme (PRP) to which AusAID contributed financial resources, can be adopted for measuring outcomes of urban WASH.
4. AusAID and Partners should commission a number of special studies that specifically focus on the assumptions made in the Theory of Change to provide strategic guidance to the WASH programme in Zimbabwe.
5. Partners should provide some training and capacity building on M&E as well as sufficient resources for undertaking M&E to local authorities. The City Health department or social services personnel if capacitated can take a lead in monitoring outcomes through simple effective tools. Partners will support with analysis and mentoring.
7
1.0 Introduction and Background Zimbabwe has since 2000 experienced a marked decline in access to safe drinking water and basic sanitation in both rural and urban communities, a result of the poor economic situation, reduced institutional capacity, lack of asset investment and maintenance, increased frequency of droughts and the effect of the high prevalence of HIV/AIDS. The cholera epidemic of 2008 in which 4,282* deaths were recorded is evidence of the deteriorating access to safe drinking water and basic sanitation in Zimbabwe. The Zimbabwe AusAID Wash Strategy that aims to mitigate the risk to loss of life and physical assets as well as rehabilitate existing capacity and improve financial viability is a response to these challenges. The AusAID WASH delivery strategy for Zimbabwe therefore seeks to increase the capacity of the local governments in medium and small towns to improve services and increase access to safe drinking water and improved sanitation outcomes. This improvement in service provision is expected to increase the willingness of communities to pay for services thereby increasing revenue flows for local authorities, a key ingredient in the financial sustainability of service delivery. Financial sustainability is also hinged on the ring fencing of collected WASH revenues by local authorities.
In October 2012, AusAID commissioned a review of its WASH Programme in Zimbabwe. This review is aimed at taking stock of the key achievements, impacts, lessons learnt and challenges as well as provide advise on future directions for the AusAID Zimbabwe WASH programme. Within this overall programme review, AusAID commissioned an in depth analysis of the Monitoring and Evaluation (M&E) systems that have been developed by Partners with the view of harmonizing and standardizing the systems for ease of progress reporting as well as tracking of outcomes and impact. The M&E review also sought to establish how best to harmonise information requirements for AusAID and that of the implementing partners.
This report presents the findings of the Monitoring and Evaluation (M&E) systems review.
2.0 Objectives of the M&E Systems Review The specific objectives of the Monitoring and Evaluation Systems review as outlined in the TORs are;
• Review of Partner M&E frameworks and systems and how these are fit for purpose and adequate for reporting at both Partner and AusAID levels
• Make recommendations on harmonization of M&E Indicators and systems across Partners • Standardise tools and methods for collecting and analyzing data on the same indicators • Review reporting for headline figures in a way that feeds into the overall AusAID reporting
framework and requirements and • Conduct an M&E workshop for AusAID Partners to increase their appreciation and reporting
requirements of the WASH Performance Assessment Framework (PAF).
Appendix 1 provides additional details on the Terms of Reference (TOR) for the M&E systems review.
8
3.0 Analytical Framework for the Review The review of the monitoring and evaluation system focussed on three important aspects of an M&E system;
a) The design of the system and its alignment with the theory of change b) Operationalization of the M&E system including the descriptive and prescriptive role of the
monitoring and evaluation system and c) The capability of the M&E system to provide strategic direction to the AusAID WASH
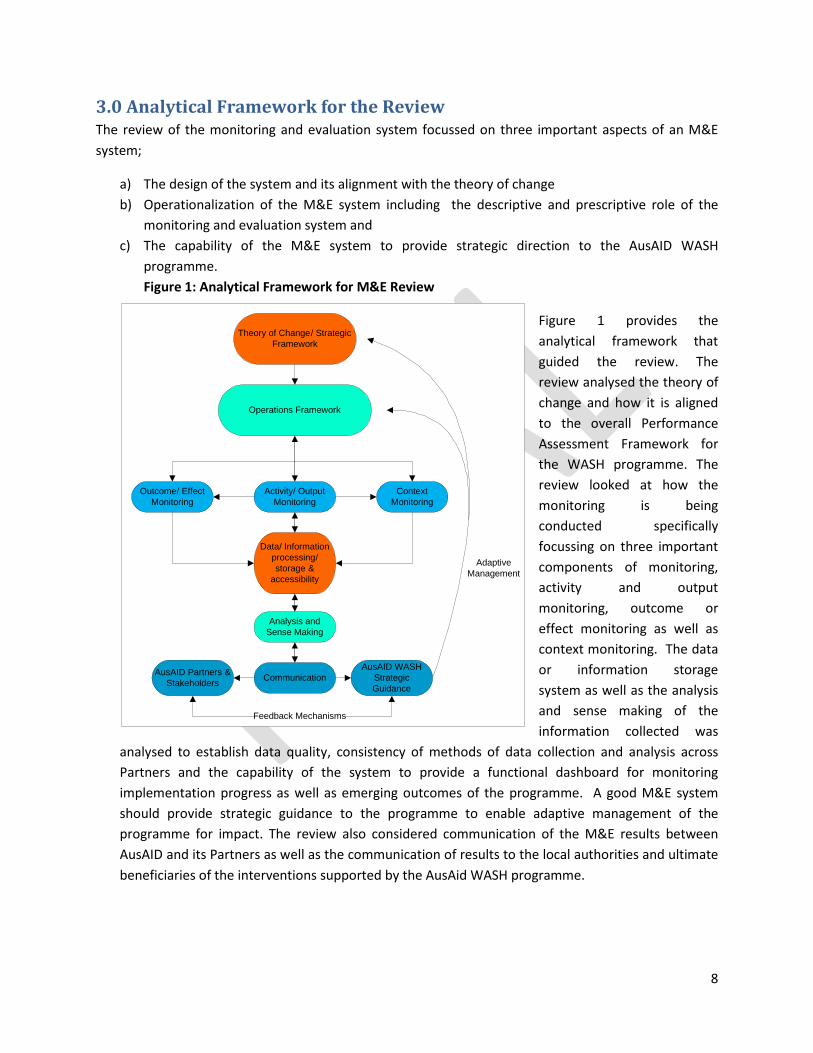
programme. Figure 1: Analytical Framework for M&E Review
Figure 1 provides the analytical framework that guided the review. The review analysed the theory of change and how it is aligned to the overall Performance Assessment Framework for the WASH programme. The review looked at how the monitoring is being conducted specifically focussing on three important components of monitoring, activity and output monitoring, outcome or effect monitoring as well as context monitoring. The data or information storage system as well as the analysis and sense making of the information collected was
analysed to establish data quality, consistency of methods of data collection and analysis across Partners and the capability of the system to provide a functional dashboard for monitoring implementation progress as well as emerging outcomes of the programme. A good M&E system should provide strategic guidance to the programme to enable adaptive management of the programme for impact. The review also considered communication of the M&E results between AusAID and its Partners as well as the communication of results to the local authorities and ultimate beneficiaries of the interventions supported by the AusAid WASH programme.
Theory of Change/ Strategic Framework
Operations Framework
Activity/ Output Monitoring
Outcome/ Effect Monitoring
Context Monitoring
Data/ Information processing/ storage &
accessibility
Analysis and Sense Making
CommunicationAusAID Partners & Stakeholders
AusAID WASH Strategic Guidance
Feedback Mechanisms
Adaptive Management
9
3.0 Methods A mixed method approach was employed in undertaking the review.
The specific tools used included;
a) Desk review of logframes and project documents b) Key Informant Interviews and consultative meetings with Partner M&E staff and c) Key Informant Interviews and consultative meetings with AusAID Staff
3.1 Desk Review of Logframes and Project Documents A critical desk review of Partner logframes, indicators, data collection systems as well as reporting systems was conducted. Project proposal documents provided information on the theory of change upon which the monitoring and evaluation framework is hinged. Objectively Verifiable Indicators (OVIs) were critically reviewed to establish if adequate and SMART at all levels, from inputs, activities, outputs, outcomes and impact. The indicators were assessed for sufficiency, relevance, measurability, insightfulness and practicality. The review of indicators also considered three important factors, construct, purpose and utilization. AusAID WASH developed a comprehensive list of about 32 indicators out of which Partners were supposed to select core indicators for their specific projects. Of these 32 indicators, four (4) indicators are important for feeding into the AusAID Annual Programme Performance Assessment and these are; Number (x) of people provided with increased access to safe water, Number (x) of additional people with increased access to basic sanitation, Number(x) of people with increased knowledge of hygiene practices and Percentage of water and sanitation management committee members who are women. The review analysed the relationship or lack thereof between the indicators being used by the Partners and the AusAID global WASH Indicators.
3.2 Key Informant Interviews (KII) and Consultative Meetings with Partner M&E Staff
Key Informant Interviews and discussions were held with the Partner focal persons on Monitoring and Evaluation. The purpose of the consultations with Partner focal persons on M&E were to understand the M&E systems being used, including data collection processes and tools, data analysis, reporting, data quality control as well as alignment with the AusAID WASH Performance Assessment Framework. The discussions also included approaches being used on impact monitoring for both qualitative and quantitative impact and how Partners are making use of guidelines provided by AusAID on the measurement of social aspects and calculation of the headline results.
Another major component of the discussions with Partners was indicator construct, purpose and utilization with the objective of gathering enough information to make judgments on the sufficiency, relevance, measurability, purpose and utilization of each indicator in the Performance Assessment Framework (PAF). An indicator critical appraisal sheet was used in the indicator assessment process. For each of the indicators that have been added to the PAF, an Indicator Protocol was developed.
10
3.3 Key Informant Interviews (KII) and Consultative Meetings with AusAID Staff
Consultative meetings were held with AusAID WASH programme staff to gather more information on the Performance Assessment Framework (PAF), the AusAID Theory of Change as well the minimum requirements for meeting AusAID programme reporting requirements.
1.0 Consolidated Review Findings The report has been structured such that the first section provides the consolidated review findings and Annexes provide full details and status of the M&E system for each AusAID supported Partner.
4.1 The AusAID WASH Programme Theory of Change The cholera outbreak of 2008 was the peak of the deteriorating access to safe drinking water and basic sanitation in Zimbabwe. A total of 4,282 deaths were recorded in the outbreak with 98,000 cholera cases. Since then sporadic cases of cholera and typhoid have continued to be experienced in Zimbabwe with urban households the most affected. The AusAID theory of change is based on the need to address key challenges afflicting the WASH Sector in Zimbabwe;
• Need for effective sector leadership and coordination • Development of sector policies • Consolidation of gains made from the emergency rehabilitation works • Development of more sustainable WASH systems • Prioritization of the required investments in the sector • Capacity building programmes to develop human resources in the sector and • Addressing the power shortages impacting on the sustainable delivery of WASH services.
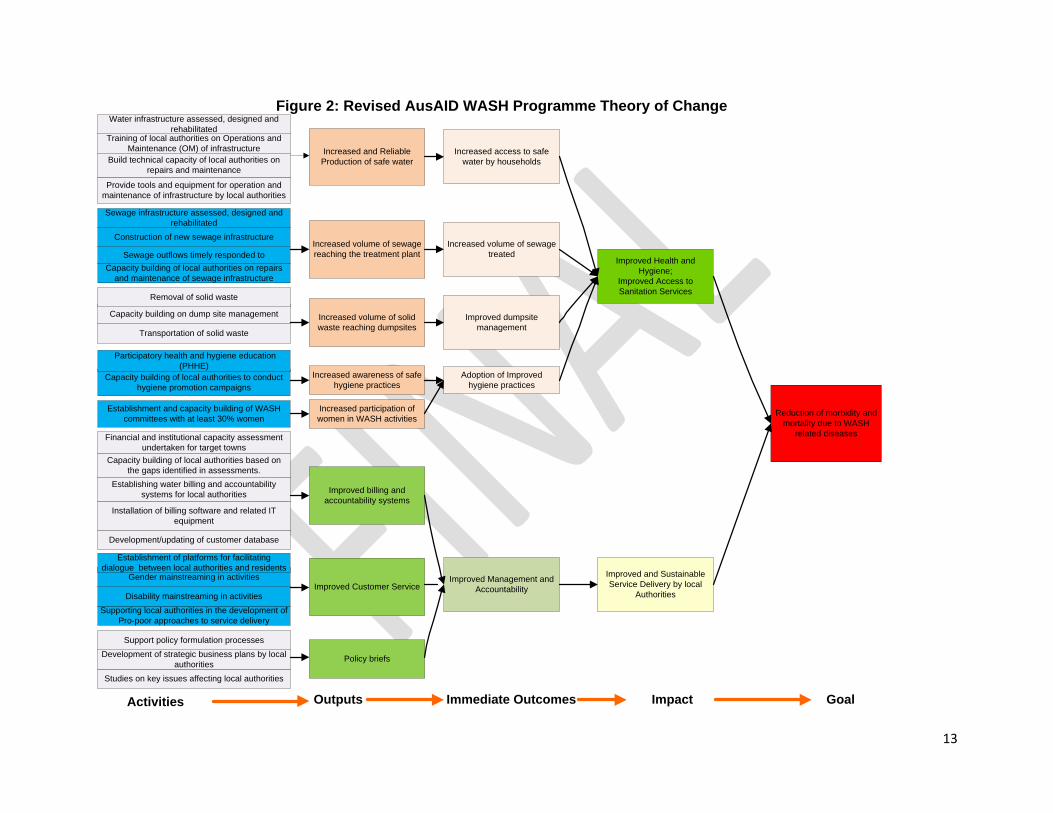
The main goal of the AusAID WASH Programme in Zimbabwe is to save lives that could be lost due to WASH related diseases and illnesses (Figure 2). The theory of change identifies three key actions that should be undertaken to achieve this goal;
a) Improving the capacity of local authorities to sustainably produce safe water and improve access to safe water by residents and communities
b) Improving the management of sewage and solid waste to reduce sewage outflows within residential areas as well as improve sewage and solid waste treatment and reduce the environmental hazard posed by poorly managed sewage and solid waste and
c) Improving the management and accountability of local authorities as well as the development of a supportive policy environment.
The AusAID Theory of change has these three dimensions that were developed to guide strategic action. The first dimension focuses on the set of actions required to improve the capacity of local authorities to increase the production of safe water so as to improve access to clean and safe water by residents and
11
communities. The specific set of actions include the rehabilitation and construction of infrastructure, capacity building of local authorities for repairs and maintenance as well as ring fencing of water revenue to improve the sustainability of clean and safe water supply. The water production infrastructure has been neglected for more than a decade because of limited capacity, both financial and in terms of human resources and the necessary expertise. However the theory of change focuses on primarily the production and supply side of the equation of improving access to water. It is assumed on this dimension that the distribution infrastructure is able to cope with the increased production of safe water. However recent experiences across the urban centres being supported have shown that the distribution system is in need of major rehabilitation as the losses in the system can account for as much as 50% non-revenue water for large urban centres like Harare. As a result of this, just improving production of safe water will not necessarily result in increased access if the losses in the distribution system have not been minimised. It is important to note that AusAID has started to support the rehabilitation of the distribution system in some towns and that this will be included as a priority area in future AusAID funded WASH programmes in Zimbabwe. Already GIZ will be addressing the distribution challenges in the next project cycle.
The second dimension of the theory of change focuses on hygiene. This dimension has three important components, sewage outflows, treatment and management, solid waste management and hygiene promotion. The low income residential areas of most urban centres have been failing to cope with sewage outflows as the system has been overstretched by the growing population and lack of resources for operations and maintenance. Raw sewage has been discharged into waterways, polluting water sources and posing serious environmental hazards. The project seeks to increase the flow of sewage from residential areas to the designated sewage treatment plants and capacitate the local authorities to partially or fully treat the sewage before discharging into waterways. It is envisaged that improvements in sewage and solid waste management coupled with hygiene promotion will result in improved health and hygiene outcomes. The assumptions on this dimension are that the local authorities are willing to invest resources in continuously improving sewage and solid waste management and that residents will be willing to adopt improved or new hygiene practices and techniques.
The third dimension of the theory of change focuses on building the capacity of local authorities as well as the development of appropriate policies to support sustainable and equitable service delivery. This dimension also looks at building the capacity of communities to demand service as well as be encouraged to pay for services provided. Three main components are important, development of billing and accountability systems by local authorities, improved customer care and the development of supportive policies through policy dialogue and special studies. The outcome of these processes will be improved management and accountability by local authorities and the impact will be improved and sustainable service delivery by local authorities. The assumptions made are that local authorities will be willing to adopt and put in place recommended systems that will improve billing and revenue collection systems. It is also assumed that the local authorities will be willing to adopt key recommendations from the various special studies to be commissioned as well as results from the policy dialogue with government. Customer service is at the centre of revenue collection. It is assumed that the local authorities will be willing to put in place measures meant to improve customer service and response
12
mechanisms to attend to residents’ complaints. It is also assumed that with the improvements in customer care, more residents will be willing to pay for the services provided by the local authorities’ thereby increasing revenue for local authorities. However this assumption is complicated by the fact that some residents might be willing to pay but do not have the means or resources to pay. This brings to the fore the importance of pro-poor service provision, to enable the very poor to afford the services especially water, provided by the local authorities.
The revision of the Theory of Change required that a minimum set of core indicators be identified at each level to ensure that there is adequate reporting on progress and impacts. Partners should be recommended to adopt the minimum set of core indicators (Table 1) but with flexibility to add more indicators for their own internal reporting and analysis. The revision of the Performance Assessment Framework (PAF) identified the same core set of indicators that should be reported on by Partners.
In line with the requirements of a sound monitoring and evaluation system, strategic questions were identified at each level to provide guidance for adaptive management for impact. The Performance Assessment Framework (PAF) also provides strategic questions that should guide revision of approaches and strategies for the AusAID WASH programme. As the AusAID WASH programme M&E systems are already in place, some of the important strategic questions will have to be dealt with through special studies. The M&E system for follow up programmes will need to incorporate the information requirements for such strategic questions in the design. Table 1 provides a summary of the indicators and the strategic questions, given the revised theory of change.
It is important to prioritise the strategic questions as resources may not allow all questions to be covered through the recommended studies. Some of the key strategic question for which information is sought for strategic guidance to the AusAID WASH Programme in Zimbabwe include;
• Is the strategy being employed by Partners effective in influencing behavior of residents and resulting in the adoption of recommended hygiene practices?
• Does the increase in service delivery automatically translate into improved payments for services by residents? What other factors are important? What pro-poor approaches can be adopted by local authorities?
• Are the studies and reviews being conducted providing sufficient guidance on policy? What recommendations are being adopted as policy wholesomely or in parts by the local authorities?
• What have been the most and least successful approaches to hygiene promotion? To what extent has institutional capacity been developed to implement large-scale hygiene promotion?
• How has the capacity of civil society been increased to support their role in social accountability, facilitation and advocacy for better water, sanitation and hygiene services?
• To what extent is AusAID’s approach to M&E enhancing partner government systems for M&E and supporting greater consistency for global measurement systems?
• What is the relative efficiency and effectiveness of the different modalities being employed by AusAID to achieve results for the poor and vulnerable?
13
Provide tools and equipment for operation and maintenance of infrastructure by local authorities
Training of local authorities on Operations and Maintenance (OM) of infrastructure
Build technical capacity of local authorities on repairs and maintenance
Water infrastructure assessed, designed and rehabilitated
Sewage outflows timely responded toCapacity building of local authorities on repairs
and maintenance of sewage infrastructure
Sewage infrastructure assessed, designed and rehabilitated
Construction of new sewage infrastructure
Transportation of solid waste
Capacity building on dump site management
Removal of solid waste
Capacity building of local authorities to conduct hygiene promotion campaigns
Participatory health and hygiene education (PHHE)
Establishing water billing and accountability systems for local authorities
Capacity building of local authorities based on the gaps identified in assessments.
Installation of billing software and related IT equipment
Financial and institutional capacity assessment undertaken for target towns
Development/updating of customer database
Supporting local authorities in the development of Pro-poor approaches to service delivery
Disability mainstreaming in activities
Gender mainstreaming in activities
Establishment of platforms for facilitating dialogue between local authorities and residents
Studies on key issues affecting local authorities
Development of strategic business plans by local authorities
Support policy formulation processes
Increased and Reliable Production of safe water
Increased access to safe water by households
Increased volume of sewage reaching the treatment plant
Increased volume of solid waste reaching dumpsites
Increased awareness of safe hygiene practices
Improved billing and accountability systems
Improved Customer Service
Policy briefs
Adoption of Improved hygiene practices
Increased volume of sewage treated
Improved dumpsite management
Improved Management and Accountability
Improved and Sustainable Service Delivery by local
Authorities
Improved Health and Hygiene;
Improved Access to Sanitation Services
Reduction of morbidity and mortality due to WASH
related diseases
Activities Outputs Immediate Outcomes Impact Goal
Figure 2: Revised AusAID WASH Programme Theory of Change
Establishment and capacity building of WASH committees with at least 30% women
Increased participation of women in WASH activities
14
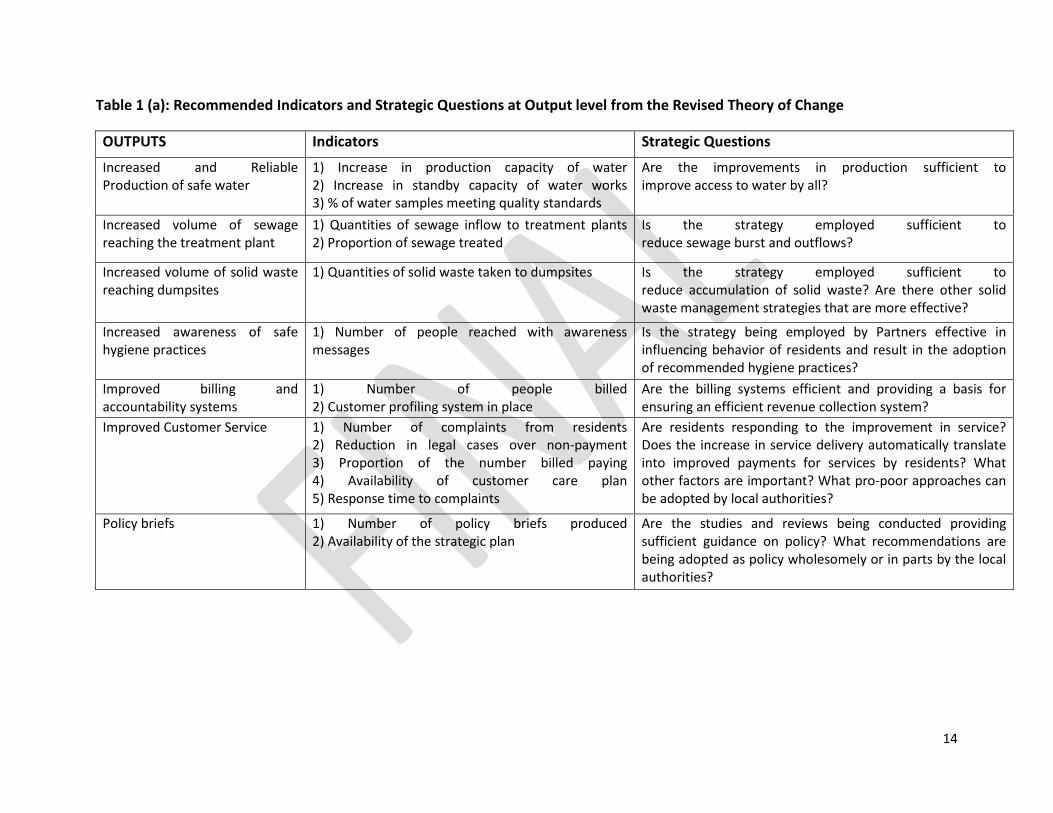
Table 1 (a): Recommended Indicators and Strategic Questions at Output level from the Revised Theory of Change
OUTPUTS Indicators Strategic Questions
Increased and Reliable Production of safe water
1) Increase in production capacity of water 2) Increase in standby capacity of water works 3) % of water samples meeting quality standards
Are the improvements in production sufficient to improve access to water by all?
Increased volume of sewage reaching the treatment plant
1) Quantities of sewage inflow to treatment plants 2) Proportion of sewage treated
Is the strategy employed sufficient to reduce sewage burst and outflows?
Increased volume of solid waste reaching dumpsites
1) Quantities of solid waste taken to dumpsites Is the strategy employed sufficient to reduce accumulation of solid waste? Are there other solid waste management strategies that are more effective?
Increased awareness of safe hygiene practices
1) Number of people reached with awareness messages
Is the strategy being employed by Partners effective in influencing behavior of residents and result in the adoption of recommended hygiene practices?
Improved billing and accountability systems
1) Number of people billed 2) Customer profiling system in place
Are the billing systems efficient and providing a basis for ensuring an efficient revenue collection system?
Improved Customer Service 1) Number of complaints from residents 2) Reduction in legal cases over non-payment 3) Proportion of the number billed paying 4) Availability of customer care plan 5) Response time to complaints
Are residents responding to the improvement in service? Does the increase in service delivery automatically translate into improved payments for services by residents? What other factors are important? What pro-poor approaches can be adopted by local authorities?
Policy briefs 1) Number of policy briefs produced 2) Availability of the strategic plan
Are the studies and reviews being conducted providing sufficient guidance on policy? What recommendations are being adopted as policy wholesomely or in parts by the local authorities?
15
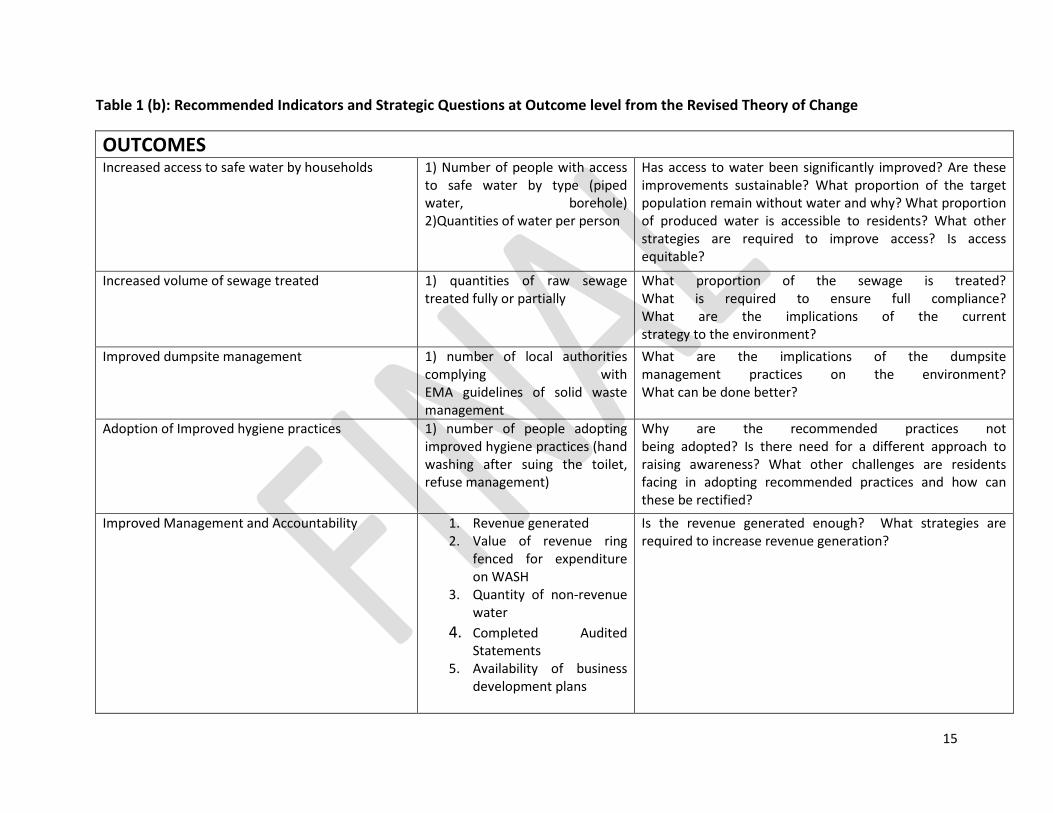
Table 1 (b): Recommended Indicators and Strategic Questions at Outcome level from the Revised Theory of Change
OUTCOMES Increased access to safe water by households 1) Number of people with access
to safe water by type (piped water, borehole) 2)Quantities of water per person
Has access to water been significantly improved? Are these improvements sustainable? What proportion of the target population remain without water and why? What proportion of produced water is accessible to residents? What other strategies are required to improve access? Is access equitable?
Increased volume of sewage treated 1) quantities of raw sewage treated fully or partially
What proportion of the sewage is treated? What is required to ensure full compliance? What are the implications of the current strategy to the environment?
Improved dumpsite management 1) number of local authorities complying with EMA guidelines of solid waste management
What are the implications of the dumpsite management practices on the environment? What can be done better?
Adoption of Improved hygiene practices 1) number of people adopting improved hygiene practices (hand washing after suing the toilet, refuse management)
Why are the recommended practices not being adopted? Is there need for a different approach to raising awareness? What other challenges are residents facing in adopting recommended practices and how can these be rectified?
Improved Management and Accountability 1. Revenue generated 2. Value of revenue ring
fenced for expenditure on WASH
3. Quantity of non-revenue water
4. Completed Audited Statements
5. Availability of business development plans
Is the revenue generated enough? What strategies are required to increase revenue generation?
16
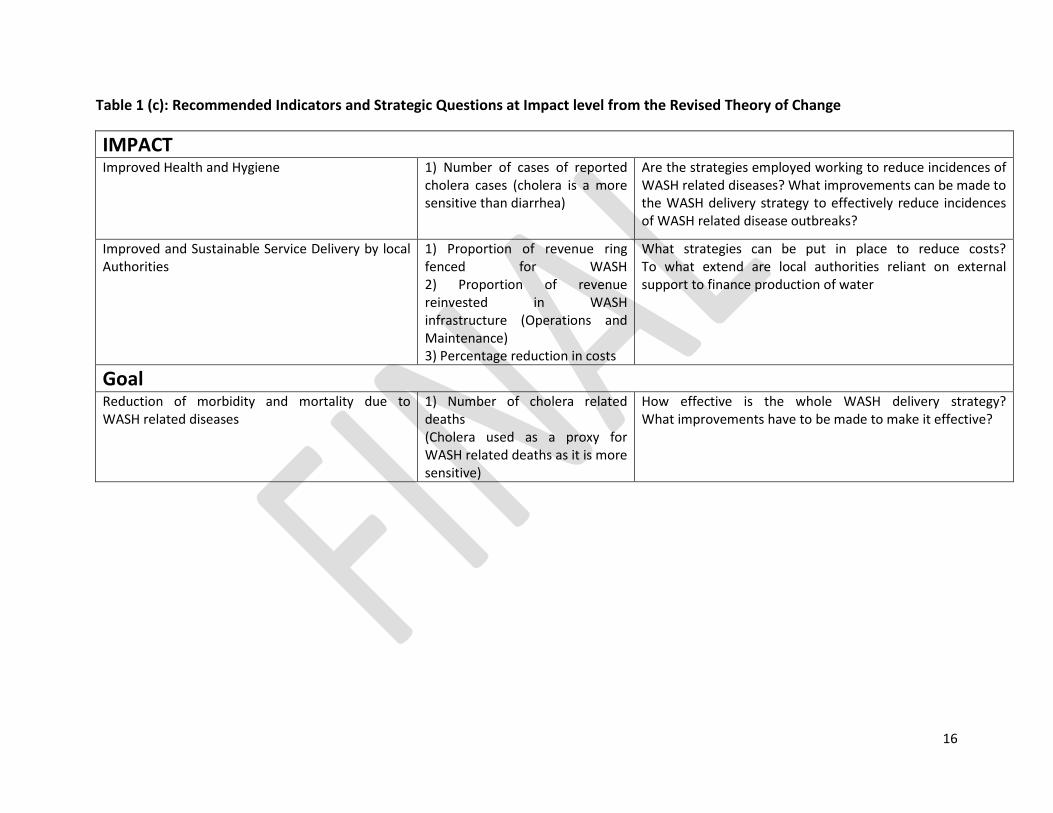
Table 1 (c): Recommended Indicators and Strategic Questions at Impact level from the Revised Theory of Change
IMPACT Improved Health and Hygiene 1) Number of cases of reported
cholera cases (cholera is a more sensitive than diarrhea)
Are the strategies employed working to reduce incidences of WASH related diseases? What improvements can be made to the WASH delivery strategy to effectively reduce incidences of WASH related disease outbreaks?
Improved and Sustainable Service Delivery by local Authorities
1) Proportion of revenue ring fenced for WASH 2) Proportion of revenue reinvested in WASH infrastructure (Operations and Maintenance) 3) Percentage reduction in costs
What strategies can be put in place to reduce costs? To what extend are local authorities reliant on external support to finance production of water
Goal Reduction of morbidity and mortality due to WASH related diseases
1) Number of cholera related deaths (Cholera used as a proxy for WASH related deaths as it is more sensitive)
How effective is the whole WASH delivery strategy? What improvements have to be made to make it effective?
17
4.2 Status of the Monitoring and Evaluation System All partners have developed a logframe with indicators specified at the various levels, activities, outputs, outcomes and at goal level as part of the M&E framework. There is no standardization of the M&E system across partners, with each Partner developing a system and a set of indicators specific to the project. There are differences in the methods of measurement for the indicators as well as the frequencies of measurement. However there is scope for requesting Partners to adopt a core set of indicators, critical for AusAID reporting as well as for accounting for progress and impact. This core set of indicators is in the revised PAF and the revised Theory of Change.
4.2 Progress Monitoring Systems Partners have put in place systems for progress monitoring. The effectiveness and robustness of the systems vary, some partners have good systems and some have systems that require strengthening. Across the Partners there were good elements adopted in the M&E system though there was no uniformity on what to adopt. One partner had a clear monitoring plan but did not have the other important elements like the indicator performance or tracking template and there were no milestones or targets in the logframe or monitoring plan. GIZ has invested in a computerised information system that generates reliable and timely information on project outputs. The system provides for 15 minute updates on the production of water. The computerised billing system also provides good quality information on the numbers of residents billed, revenues generated, percentage of billed residents paying their bills and a lot more other important information. Such a good system can be adopted widely across Partners to improve the quality and reliability of the information collected.
Other specific observations on progress monitoring include;
a) Monitoring plans Only one partner had a clearly defined monitoring plan that operationalized the M&E framework. The M&E plan shows, for each indicator, what data to be collected when by whom and with which method. The monitoring plan has to be linked to the reporting plan to ensure that reports are available when needed. Monitoring plans should be developed by all Partners and reporting should be synchronised with the AusAID reporting timeframes.
b) Indicator Tracking Tracking of progress on the achievement of outputs is being conducted but not in a systematic and structured way by all Partners. Only one partner, World Vision, uses an Indicator Tracking Template to track each of the project indicators. Indicator performance or tracking templates are best practice on M&E and provide detail on the performance of each of the project indicators. Indicator Performance/Tracking templates make it possible for Partners to manage for results.
c) Milestones and Targets Milestones and targets are commonly used to assess progress made in multi-year projects. Partners have project targets on completion of the project and in the absence of milestones it becomes difficult to assess performance towards achievement of the stated targets. It is
18
important that Partners consider including milestones in their logical frameworks as this will improve performance monitoring and assessment. The nature of the WASH projects where a lot of time and investment is made before the actual production of water commences makes it difficult to measure progress in the absence of set targets and milestones. The African Development Bank is an example of how difficult it is to understand progress being made in the absence of set targets and milestones.
d) Progress Reporting Partners have different reporting frameworks. The WB AMDTF provides annual reports to donors as well as adhoc reports to donor’s special committees including providing feedback through completed analytical studies. Unicef reports twice, half year and annually. Both reports provide details on the progress made. GIZ reports annually to the German Government and a copy of the same report translated into English is also shared with AusAID. World Vision reports on specific dates as agreed in the contract. The stipulated dates for reporting are 31 August 2011 and 31 January 2012 for progress reports and the project completion reports submitted six weeks after completion of the project.
Reporting has not been synchronised with the AusAID reporting requirements including what is to be reported and in which timeframe. It therefore becomes a challenge for AusAID to consolidate results across all the AusAID funded projects and establish progress being made. Analysis of project performance is further complicated by the absence of milestones for the specific reporting time frames.
4.3 Outcome Tracking systems Outcome indicators have been identified in the logframes of most Partners. However there is no clear structured system for monitoring and tracking project outcomes across all the Partners. The focus is primarily on output level indicators. Whilst this is understandable as the programmes were started as emergency programmes, there should be progression towards more developmental monitoring and evaluation that places emphasis on outcomes. World Vision has made an attempt to monitor outcomes through the development of the Most Significant Change approach (MSC), where stories of change are collected from Bulawayo residents. The stories collected to date have shown the positive changes that the AusAID WASH programme has brought to Bulawayo residents. Negative stories, primarily meant for organizational learning should be collected as well. Most Significant Change should be complemented with a broader outcomes monitoring framework. When used in isolation of other outcome monitoring approaches, MSC may not provide a project wide picture on the achievement of outcomes. The review of the projects highlighted the importance of having an outcomes monitoring framework as most of the good achievements on outcomes have not been systematically documented and reported on.
Other observations are that;
• There is no clear strategy or plan to monitor progress on cross cutting issues that include gender, disability, environment, child protection. This makes it difficult for AusAID to consolidate results to provide a programme wide picture on the status of cross cutting issues. Methodologies or approaches to capturing information for cross cutting issues should be
19
standardised for easier consolidation and analysis. The strategy for monitoring progress on cross cutting issues should be based on clearly defined indicators.
• The monitoring of what is being adopted by councils as best practice from the assessments and studies conducted is weak and requires strengthening. The World Bank studies have produced good reports with recommendations that can be adopted by councils. However there is need for monitoring to establish the usage and application of the knowledge generated and the lessons learned by Partners.
• The documentation of progress made on outcomes require improvements. The AusAID WASH Programme review observed that there is under reporting of some of the good work being done by Partners. Examples given include the zero defecation achieved in one community of Hwange but has not been widely shared for wider lesson sharing and learning. A publication on this was recently produced by the Institute of Water and Sanitation Development (IWSD) titled “Human Interest Stories – Changing Mindsets, Creating Health Villages for Binga and Hwange Districts”. Such publications will be important in documenting experiences and promoting wider sharing and lesson learning.
Related to the monitoring of outcomes is the collection and analysis of information that provide evidence and answers to the strategic questions given the theory of change. Some of the questions from the theory of change require that the projects commission special studies that provide an in depth analysis of the project assumptions and approaches in a way to establish best practice in addressing sustainable and equitable access to safe drinking water in urban areas, effective and sustainable solid and sewage waste management in urban areas and approaches to improve service delivery and customer satisfaction. Such studies will be critical in shaping approaches and strategies on WASH in urban and semi-urban settings. These studies can be commissioned at AusAID level or at Partner level or be commissioned by the World Bank as it has been mandated to coordinate the studies.
4.2 Indicators and Data Collection Processes The AusAID Performance Assessment Framework (PAF) provides a list of indicators that can be adopted and adapted for measuring impact and outcomes of the WASH projects at the various levels. Most Partners did not adopt the PAF Indicators as these were made available later in the project cycle. However some of the indicators being used by the Partners can be easily modified to provide information for reporting on PAF indicators. The synchronization of the Partner logframes and PAF has been made difficult by several factors that include;
• Where AusAID WASH funding was provided to an already existing project in the case of GIZ the indicators for the project were already agreed upon prior to AusAID providing funding. However the GIZ M&E system is capable of providing information required for AusAID reporting purposes.
• Where there is a pooled funding mechanism as is the case with the projects funded under the MDTF (World Bank and AfDB), the Indicators do not particularly align to any Donors’ performance assessment framework as well as reporting requirements.
• Some of the indicators in the PAF are more developmental and not very appropriate in an emergency project as was the case with the UNICEF project. Some indicators on the PAF were
20
therefore adopted with modification creating challenges for consolidation across Partners projects.
The quality of Objectively Verifiable Indicators (OVI) indicators vary by Partner but generally require improvement. Key observations on the indicators include;
1. There are differences in the choice of OVIs that are supposed to measure the same objective. This creates a challenge on consolidation as the indicators and frameworks are not harmonised across Partners.
2. A significant number of Indicators are not SMART.
3. There are too many indicators, resulting in others not being tracked or measured or reported on.
4. Some objectives have no indicators to measure progress or outcomes, a result of the capacity of both Partner and local authorities and methodological complications.
5. Some OVIs should be reviewed where assumptions have changed and there is new information from the assessments made as is the case for AfDB.
Data Sources
Data collection is primarily conducted by the councils for most indicators. For the more complicated indicators, the responsibility for collecting information is for Partners. Data collection and analysis methods vary by Partner for similar or closely related indicators creating a consolidation problem across Partners. Information on the quantities of portable water produced, the sewage flows to treatment plants, solid waste collection and management, revenues from water, customers billed and customers actually paying as well as revenues ring fenced for water is mainly provided by councils. There are concerns on the quality of information, given the limited capacity of councils to provide such information. For GIZ the situation is different as quantities of water produced are automatically generated by the pump station every 15 minutes and are very accurate and reliable. GIZ has also supported the development of computerized billing systems that provide accurate and reliable information on number of customers billed, revenues generated among others.
There are Partner instituted data collection systems, primarily using questionnaires and forms that are completed by the local authorities and beneficiary communities. This data is more reliable as the Partners invest significant amounts of time in data cleaning and analysis.
Health related data, cholera, diarrhea and typhoid, is obtained from WHO and the council clinics. This data is reliable. It is important to note that cholera is a much better indicator of WASH related diseases compared to diarrhea and typhoid as it is very sensitive to changes in hygiene and access to safe drinking water.
21
Data Quality
The quality of the data varies with the indicator with most data collected by councils reported to be of poor quality, a result of M&E capacity issues within councils.
The main observations on data quality are;
• Data quality varies by indicator depending on the Institution responsible for collecting the data. The information provided by councils requires more cleaning to make it more reliable and some of it is based on estimates generated from the historical figures held when the system was still very functional. Significant improvements in data quality will require capacity building of local authorities.
• The information or data directly collected by the Partners is reliable as Partners invest significant time in designing better approaches for collecting the data as well as cleaning and managing the data. Portable water production figures provided by GIZ are generated by the pump and made available every 15 minutes. Such data is very reliable. The information on revenues and billing accounts is reliable for local authorities where new computer systems have been installed and can generate summary reports.
• Health related data including the number of cholera, typhoid and diarrhea cases and mortalities is reliable and accurate. This data is provided by the World Health Organization (WHO) and the council run clinics and hospitals.
• The AusAID WASH programme requires that the number of people assisted be accounted for and an attribution case be made depending on the proportion of resources provided by AusAID. Partners have been using 2002 census figures to estimate the number of people assisted by AusAID. The estimated figures are less reliable as the census figures are now out of date. However with the preliminary 2012 census results now published, Partners will need to revise all the estimates with actual figures and provide an update to AusAID. These figures will have to be disaggregated by gender, disability as well as show the number of children accessing safe water in the supported urban centers.
Availability of Baseline Data
Most Partners did not undertake baseline studies at the commencement of the projects. Some baselines were conducted midway through the implementation of the projects. Benchmarking of indicators was therefore not done. However Partners have gone ahead to establish baseline studies, World Vision, Unicef and GIZ. The African Development Bank will need to conduct a baseline study before commencing the actual implementation of the project. The assessments conducted so far by AfDB have been important in informing the design of the M&E. Partners were also innovative in creating baseline information using the historical records provided by the local authorities. With this baseline information it will be easier to analyse the changes that have been brought about through the AusAID WASH supported projects.
22
Attribution of Changes to AusAID Support
AusAID provided Partners with guidance on how to make an attribution case for AusAID funding. Partners did not have any problem with the method for making the attribution case as recommended by AusAID. However the attribution of the positive changes in the status of WASH in the supported towns and cities is complicated by;
a) Combined investment by local authority and Partners on different components in the water production and distribution process. Local authorities will have to account for all resources used from the different sources to be able to make a reliable attribution case. This process is complicated by the activities and personnel shared between WASH activities and other council operations.
b) One of the Indicators identified for measuring the impact of improved customer care and support is the willingness to pay. The use of this indicator is complicated by the limited ability of the very poor urban residents to pay for services and utilities even when they are willing, overall improvement in the economy and incomes that improves ability to pay and the increase in number of people paying bills (but could be a result of an improved database with additional people now being billed)
c) There are other NGOs that have been funding urban WASH programmes including hygiene and education promotions. The Protracted Relief Programme (PRP) is one such programme. This scenario makes it difficult to attribute all changes to AusAID support. However the AusAID contribution to the achievements can be articulated.
Budgetary Support for M&E
Monitoring and Evaluation requires adequate budgetary support to ensure that processes are not compromised. Only one Partner, World Vision confirmed to having limitations on the budgeted allocation for M&E and as such could not develop a comprehensive outcomes monitoring system. The other Partners seemed to have adequate resources to conduct M&E.
Two (2) out of the 5 Partners have M&E Officers, in the other three there is no dedicated M&E person. AfDB plans to hire an M&E consultant to develop the M&E system as well as roll out the M&E system to its Partners. This will work in the short term but going forward it might be worthwhile for AfDB to consider recruiting a dedicated M&E Officer. For GIZ, M&E is mainstreamed. For UNICEF there is no dedicated M&E Officer but that M&E is conducted by the UNICEF core M&E team shared by a number of other projects and programmes.
4.3 Information Management and Communications of Results A lot of the good work that has been conducted by Partners has not been adequately reported on. The report of the review conducted by Ross and Victoria show that a lot of the lessons learnt have not been written up and communicated for wider lesson learning and sharing. Examples of such good work include the zero defecation achievement in Hwange, the improvements in customer care and reduction
23
in complaints in Bulawayo. The communication of lessons should also be downwards to ensure lesson learning by residents and local authorities as well. Such downward communication will enable local authorities to make improvements depending on the results that the M&E system is generating.
5. Conclusions and Recommendations The following conclusions are made from this review;
5. Partners have developed effective progress monitoring systems although the robustness of the systems varies by Partner. However outcomes monitoring require strengthening by developing an outcomes monitoring framework for all the Partners.
6. The quality of data and information varies with the Partner depending on who is collecting the data. Partners directly collecting the data provide good quality data. Partners relying on the local authorities for data and information have challenges with the data provided by local authorities, an indication of human and financial capacity gaps in M&E.
7. The PAF was made available to Partners after the projects were already in motion as a result very few indicators from the PAF have been adopted by Partners. However Partners are flexible in providing information to AusAID for Headline Results reporting.
8. The Indicators and M&E systems have not been harmonized across Partners and synchronized with AusAID reporting time frames making it difficult to consolidate progress and outcomes of the whole AusAID WASH programme for Headline Results reporting.
Recommendations
AusAID should, as part of its agreement with Partners, agree upfront with Partners on the expectations on reporting and adoption of recommended indicators from the PAF. This should not be prescriptive but based on identifying the minimum set of indicators a Partner needs to adopt to aid AusAID reporting requirements.
There is need for harmonization of WASH indicators and approaches at national level. AusAID is strategically positioned to advance this harmonization agenda given its overall WASH strategy for Zimbabwe and its investment in WASH to date. Without this harmonization it will continue to be difficult for NCU to consolidate results of the work being supported at national level. The development of a common set of indicators by the World Bank is the starting point in the harmonization process. UNICEF through the WASH Cluster made an attempt to develop a common set of tools for use in the monitoring of WASH. The harmonization process can build on this earlier effort and have the WASH Cluster or the NCU coordinate the development and adoption of a harmonized set of indicators, approaches and methodologies for monitoring and reviewing WASH in Zimbabwe. AusAiD can consider providing resources for the development of a core set of indicators, data collection and analysis templates.
Partners should develop a structured and systematic process for monitoring Outcomes and cross cutting issues. There are options that Partners can pursue. The first one is the Participatory Health and Hygiene Education Index (PHHE Index) that was developed by PRP. It
24
was primarily developed for rural areas where health clubs have been formed. It requires modification for application in urban centers where health clubs are few and the dynamics different. The City Health departments could coordinate the data collection processes with training. Its main advantage is that it is participatory, with the community actively involved in collection and preliminary analysis of information. The data collection, entry and analysis templates have been developed and could be modified easily for adoption by Partners. The second option is the Knowledge Attitudes and Practices (KAP) surveys that could be conducted half yearly or yearly to monitor the achievement of outcomes by Partners. Lastly Partners can come up with a survey implemented half yearly or quarterly to collect information for the outcome indicators. It is important to note that the PHHE developed by PRP has been used by a number of NGOs funded under PRP and the NCU expressed interest in having it developed further for use nationally.
The local authorities require capacity building on M&E as well as sufficient resources for undertaking M&E. The City Health department or social services personnel can take a lead in monitoring outcomes through simple effective tools. Partners will support with analysis and mentoring. Partners should conduct an M&E capacity assessment of the local authorities to determine the capacity needs of the local authorities. From the capacity assessment conducted by Partners AusAID can coordinate and provide resources for capacity building of the local authorities.
AusAID and Partners should commission some special studies that specifically focus on the assumptions in the Theory of Change to provide strategic guidance to the WASH programme in Zimbabwe.
25
6. Annexes
Appendix 1: African Development Bank Background and Overview:
The African Development Bank manages the Zimfund, a pooled funding mechanism set up by Donors to support the production and supply of safe water in six urban centres namely Harare, Chitungwiza, Mutare, Chegutu, Masvingo andKwekwe.The pooled funding mechanism is meant to have a coordinated approach to assistance with the hope of having a larger impact on WASH in Zimbabwe. The goal of the project is to “To improve the health and social well being ofthe population through equitable provision ofadequate water supply and sanitation services”. The project has two components, support to the Energy sector to ensure reliable electricity supply and support to the Water and Sanitation sector. The M&E review primarily covered the Water Supply and Sanitation Rehabilitation Project. Status of the Monitoring and Evaluation System
Theory of Change The goal of the project is “To improve the health and social well being ofthe population through equitable provision ofadequate water supply and sanitation services”. The project has two specific objectives, a) To provide urgent support for restoration andstabilization of water supply and sanitation services in the six Municipalities of Harare,Chitungwiza, Mutare, Chegutu, Masvingo and Kwekwe and b) To improve service delivery in the projectareas. A set of actions have been developed to ensure achievement of the stated project purpose. A monitoring and evaluation matrix is available outlining the defined goals, purpose, assumptions and set of activities meant to achieve the stated objectives. The matrix will be used to systematically assess progress against set objectives and indicators. The matrix does not provide the assumptions being made for the project, a major weakness. The risks to the project are outlined but the mitigation strategies should be well articulated to provide guidance in the event that the risk is encountered.Significant changes have happened since 2010 when the project was conceptualized. This requires that the theory of change be revisited with particular focus on the risks and assumptions for the project. M&E Operations Framework The monitoring and evaluation matrix/framework is operationalised through the development of a monitoring plan. The AfDB still has to develop a monitoring plan for the project. The monitoring plan will outline the monitoring and evaluation mechanisms that should be put in place for effective M&E. An M&E plan outlines;
a) Scope of M&E b) Information needs for M&E c) Methods and sources of information d) Roles and responsibilities for M&E
26
e) Use of M&E findings and f) Capacities and conditions for M&E
This will enable better capturing and articulating of outcomes and emerging impact. The proposed M&E consultancy by AfDB should consider these issues when setting up the system. Activity/Output Monitoring The project has primarily spent most of the time to date on the background work necessary for the project to begin the actual implementation. Progress monitoring is hindered by the lack of an M&E plan with identified milestones. The AfDB currently does not have a clearly defined performance assessment framework with defined milestones and this makes it difficult to track progress on project implementation. AfDB does not have a dedicated M&E Officer. The supported local authorities do not have any designated officer for M&E even though they are expected to provide information for the monitoring and evaluation of the project. Given the size and nature of the project it is critical that, resources permitting, an M&E Officer is hired by the Bank.
Outcome/ Effect Monitoring The actual project implementation has not yet started and only the background work to the project, assessments and hiring consulting firms to implement the project. No outcomes monitoring plan has been developed as part of the overall M&E. It is important that this be developed before the actual implementation starts. Context Monitoring The assessments being done in the urban centres targeted by the project will provide context information important for revisiting the theory of change as well as the assumptions and risks of the project. The assessments have largely been completed as shown in the Technical Design Report of May 2012. A system will have to be put in place as part of the overall monitoring plan to monitor changes in the context and how these impact on the achievement of project objectives. Indicators These indicators are drawn from the phase 1 project documents. Level Statement Indicator Impact/GOAL Reduce incidence of Water borne
Diseases in urban areas 1. Incidence of Water borne Diseases 2. Coverage of safe drinking water and adequate
sanitation Outcome/Purpose
Increased reliability, quality and availability of water supply in the project areas;
1. Production of potable water 2. Treated wastewater 3. Incidence of cholera and other waterborne diseases 4. Revenue collection, efficiency and reduction of
non revenue water 5. No. of Staff trained (disaggregated by sex)
Increase Access to Improved Quality Sanitation Wastewater treatment capacity restored;
Output
Power availability to water and sanitation infrastructure
1. Rehabilitated facilities. 2. Cost of water treatment and cost of water supply
service 3. Public campaigns conducted 4. Training sessions held with communities on proper
hygiene and sanitation
Rehabilitated sub-T&D network Increased reliability, quality and availability of water supply in the project areas;
27
Wastewater treatment capacity restored
5. Trained professional staff of the Municipalities 6. Community participation in the curtailing sewage
overflows in high density areas Reduced incidence of cholera and other water related diseases. Improved operational performance and efficiency
Some indicators are not SMART and also not at the right level. Number of staff trained for example is a lower level indicator and should be at Output level and not at Outcome level. It is also a repetition of the output level indicator, “Trained Professional staff of municipalities”. The same applies to “Production of potable water” and “Treated wastewater” as these appear to be output level indicators and not outcome level indicators as presented in the M&E matrix. “Revenue collection, efficiency and reduction of non-revenue water” is a complex indicator and is not easily measurable as it is composite. The same applies to “Rehabilitated facilities” and “Coverage of safe drinking water and adequate sanitation”. “Incidence of cholera and water related diseases” is repeated at both Outcome and Goal level. The whole M&E system requires a review, aligning it to the theory of change, revisiting assumptions and risks as well aligning indicators to the right levels. Additional indicators to consider include tariff collection efficiency, cost of sanitation services and % of water samples meeting quality standards. The indicator on portable water production can be modified to include the time dimension, eg potable water production per hour or per day. Baseline values for the identified indicators were provided where possible by local authorities. However the information provided by the local authorities is not of high quality for most indicators. The assessments that have been conducted as part of the preparatory work for the project will also provide baseline information for the indicators. Adoption of AusAID WASH Performance Assessment Framework (PAF) Indicators At the time of proposal development, AfDB was not aware of the existence of the PAF. However some of the indicators in the AfDB framework can be modified to provide information to AusAID for its Annual reporting. Indicators that are almost the same or could be easily changed to suit the ones in the PAF include;
• Incidence of cholera and water related diseases • Coverage of safe drinking water and adequate sanitation • Revenue collection, efficiency and reduction of non revenue water
It is important to note that the M&E system was not designed to meet the reporting requirements of any specific donor but can be made flexible enough to accommodate specific requests for information from donors.
Progress to Date
An annual report is produced for the Policy Oversight Committee (POC). The POC is made up of Partners and representatives from the Government of Zimbabwe.
28
Achievements to date include;
• Expression of Interest (EOI) for NGOs detailed Assessment to inform works • Identification of a procurement agent for the project • Identification of an implementing Entity • Assessments and design work has been completed • Contractors have been identified for the infrastructure and • NGOs have been selected for the hygiene promotion works
Reporting:
Annual reports as well as quarterly updates are provided to donors through the POC. The reporting requirements and frequencies were made in agreement with the POC also taking into account the Bank’s internal information requirements. However, without milestones and a clear M&E plan it is difficult to assess progress being made. More regular reporting will be important once the actual implementation has started. It will be important to get an idea of reporting expectations from Donors and internal AfDB requirements and use this as a guide on the information requirements for the project. The proposed consultancy on M&E should consider engaging donors to establish information requirements and ensure the M&E system is aligned to such information requirements.
A reporting and communication strategy has to be developed to align the M&E system to the reporting and information needs of the project and Partners.
Conclusions and Recommendations
The current M&E system requires a major revision for the project to be able to track progress towards achievement of project objectives. The following recommendations are made to improve the M&E system;
1. AfDB should speed up the process of recruiting the Monitoring and Evaluation consultant to be responsible for developing the monitoring and evaluation system before the actual implementation of project activities commences.
2. A clear performance measurement system with SMART indicators at the right level, clearly identified milestones and clearly defined methods and sources of data collection is required to track progress being made on the project and this will entail revisiting the theory of change to ensure alignment with the M&E system.
3. A reporting and communication strategy has to be developed to align the M&E system to the reporting and information needs of the project and Partners.
4. The indicators proposed by the World Bank study should be adopted to ensure harmonization of systems across towns being supported by the AusAID WASH Programme.
29
5. Standardisation on implementation, monitoring and evaluation of software components by the different NGOs will be required. This will provide the first step towards harmonization of systems.
Appendix 2: GIZ
Background and Overview
The GIZ in implementing a project titled “Urban Water Supply and Sanitation in Zimbabwe”. The project aims to improve water supply and sanitation services as well as solid waste management in at least four medium size towns in Zimbabwe. The Overall objective of the project is Water supply and sanitation services as well as solid waste management in at least four selected medium size towns are improved. The project identifies four specific components that are important in achieving this overall objective namely;
Component 1: Stabilization of drinking water supply, sanitation and waste disposal Component 2: Capacity development for water administrations Component 3: Sector-policy advice Component 4: Strategic investment planning Status of the Monitoring and Evaluation System Theory of Change The project’s overall objective is to improve the water supply and sanitation services as well as solid waste management in at least four medium sized town of Zimbabwe. There are four specific objectives (components) that should be achieved to increase the likelihood of achieving the overall objective of the project and these are;
• Stabilization of drinking water supply, sanitation and waste disposal • Capacity development for water administrations • Sector-policy advice • Strategic investment planning
The objectives and indicators at various levels are summarized in a Table. The risks and assumptions upon which achievement of the project activities are premised are not stated. The components identified as critical to achieving the overall objective are logical and relevant as well as the actions to be implemented. M&E Operations Framework There is no specific focal person for M&E but that M&E in mainstreamed across the project activities. The information to be collected is clearly understood and measures have been put in place to collect that information including performing quality checks on the collected data. There is evidence to show that the information being collected and analysed is being used to shape and
30
manage the project. However there was no documented M&E plan clearly laying out who collects what information, using what methods, timing and frequency of data collection and responsibilities for information management and sharing. Activity/Output Monitoring A computerized system has been put in place to monitor project outputs. The system can easily provide information on quantities of water produced by urban area and for a specified time period. The new billing system established for the councils has been set up in such a way that updates are obtained easily and the information is of high quality.
GIZ does not use milestones in their performance monitoring system. Rather, GIZ reports to German Government annually and in that report, for each indicator progress is assessed based on the difference between the baseline value and the new annual achievement value. Reference is made to the target for the indicator and a judgment made on whether, given the annual performance, the overall project target will be achieved or not. Where the target has to be changed or modified, reasons are provided. The report also provides all the evidence for the achievements claimed.
Outcome/Effect Monitoring Outcomes monitoring is being conducted but the results of this do not appear to be widely shared for lesson learning. Context Monitoring Context monitoring is an ongoing process and contributes towards ensuring that project objectives are met. It also directly feeds into Component 3 on sector policy advice as this is done on a case by case basis. There is evidence that the project is continually monitoring the context in which the project is being implemented and this is being done at two levels, at the national level and at the localized level working with local councils. Indicators
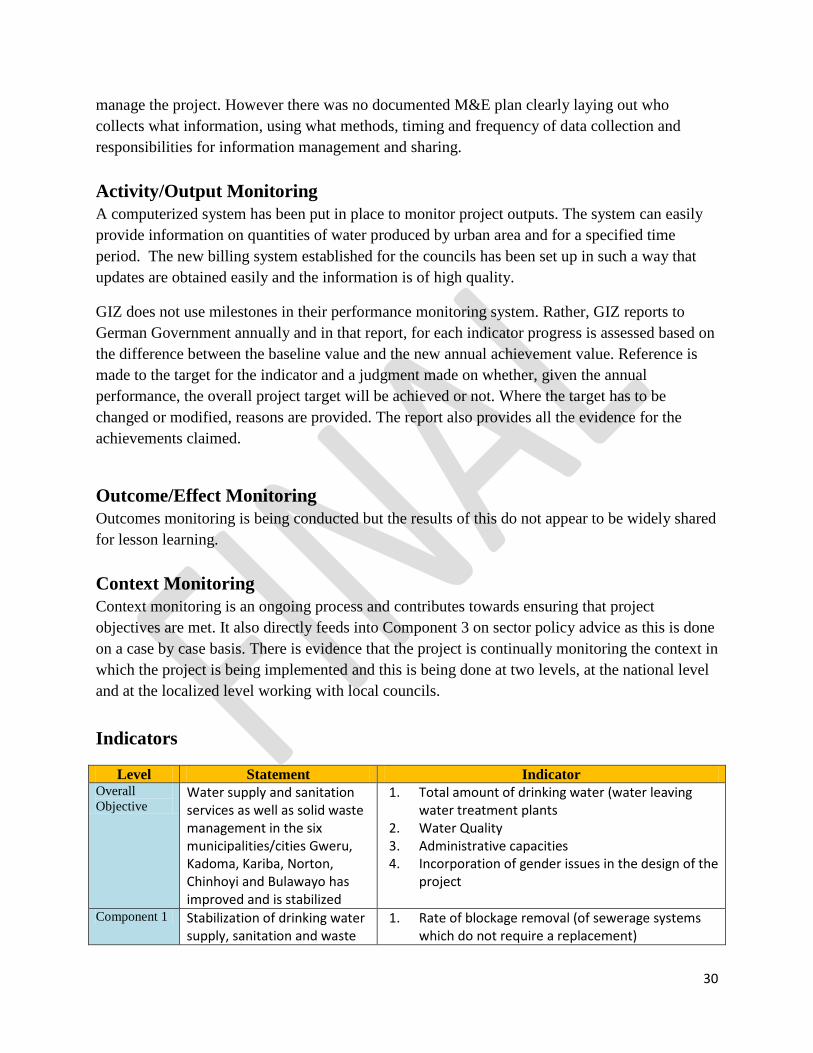
Level Statement Indicator Overall Objective
Water supply and sanitation services as well as solid waste management in the six municipalities/cities Gweru, Kadoma, Kariba, Norton, Chinhoyi and Bulawayo has improved and is stabilized
1. Total amount of drinking water (water leaving water treatment plants
2. Water Quality 3. Administrative capacities 4. Incorporation of gender issues in the design of the
project
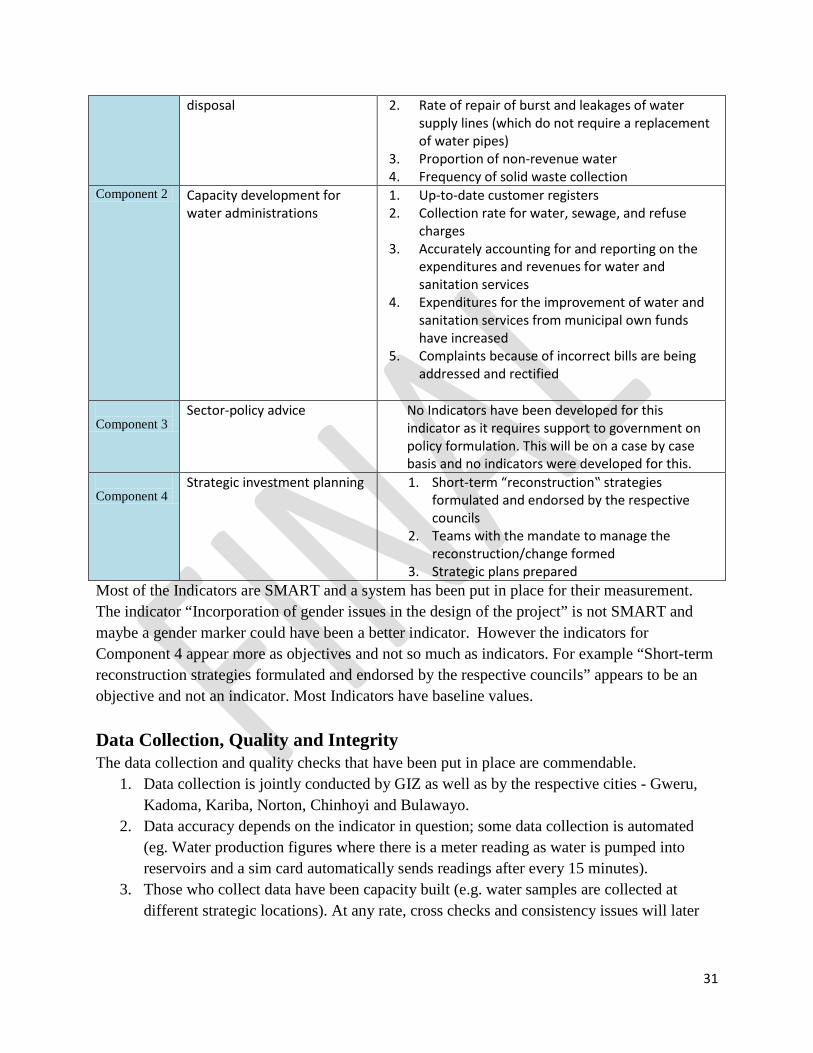
Component 1 Stabilization of drinking water supply, sanitation and waste
1. Rate of blockage removal (of sewerage systems which do not require a replacement)
31
disposal 2. Rate of repair of burst and leakages of water supply lines (which do not require a replacement of water pipes)
3. Proportion of non-revenue water 4. Frequency of solid waste collection
Component 2 Capacity development for water administrations
1. Up-to-date customer registers 2. Collection rate for water, sewage, and refuse
charges 3. Accurately accounting for and reporting on the
expenditures and revenues for water and sanitation services
4. Expenditures for the improvement of water and sanitation services from municipal own funds have increased
5. Complaints because of incorrect bills are being addressed and rectified
Component 3
Sector-policy advice No Indicators have been developed for this indicator as it requires support to government on policy formulation. This will be on a case by case basis and no indicators were developed for this.
Component 4
Strategic investment planning 1. Short-term “reconstruction‟ strategies formulated and endorsed by the respective councils
2. Teams with the mandate to manage the reconstruction/change formed
3. Strategic plans prepared Most of the Indicators are SMART and a system has been put in place for their measurement. The indicator “Incorporation of gender issues in the design of the project” is not SMART and maybe a gender marker could have been a better indicator. However the indicators for Component 4 appear more as objectives and not so much as indicators. For example “Short-term reconstruction strategies formulated and endorsed by the respective councils” appears to be an objective and not an indicator. Most Indicators have baseline values. Data Collection, Quality and Integrity The data collection and quality checks that have been put in place are commendable.
1. Data collection is jointly conducted by GIZ as well as by the respective cities - Gweru, Kadoma, Kariba, Norton, Chinhoyi and Bulawayo.
2. Data accuracy depends on the indicator in question; some data collection is automated (eg. Water production figures where there is a meter reading as water is pumped into reservoirs and a sim card automatically sends readings after every 15 minutes).
3. Those who collect data have been capacity built (e.g. water samples are collected at different strategic locations). At any rate, cross checks and consistency issues will later
32
on show faulty data should any data collector decide to compromise the rigorous data collection procedures where these can be tampered with.
4. Computer modules have also been created such that data is collected as it is being entered and cannot be tempered with since the quality checks are inbuilt and does not allow manipulation without leaving a trail. System administrators have no source code such that they cannot remove the trail of what has been done to the system.
5. Loss of data is prevented through backing up and the backup copies are not kept at the same place as the main systems – system administrators have received training on relevant modules and backing up
6. Water sample for reporting on the quality of water were collected during the first year and GIZ used to get reports. But now no more need since for a long time the samples were testing negative on the e-coli and such serious impurities.
Challenges
1. Customer databases are always a challenge, constantly being updated. 2. The population estimates being used to establish the actual population within a given
urban area are based on outdated 2002 census figures. A more accurate picture will be obtained once the 2012 Census results are available.
3. Attribution gap – issues such as willingness to pay are a headache. It s difficult to separate increase in revenue as a result of willingness to pay due to improved services and that as a result of improvement in household liquidity or lack of it.
4. Some indicators such as component 2.4 and 2.5 have not yet been collected and reported on due to capacity issues. But now the capacity is there and information will soon be coming in. As such, there are no results yet.
Adoption of AusAID WASH Performance Assessment Framework (PAF) Indicators AusAID funding came on stream when the project had already been set up and as such indicators and reporting requirements had already been agreed upon by GIZ and the German Government. There were discussions held between GIZ and AusAID on the indicators and reporting requirements. An agreement was reached that GIZ would provide all the necessary information required by AusAID for reporting but the original reporting agreement with the German Government would stand. As a result of this background;
1. No one single indicator from the AusAID Performance Assessment Framework has been included in the set of indicators being used by GIZ.
2. GIZ is able to provide the necessary information required by AusAID for reporting purposes and this has happened in the past.
3. It will be a challenge for GIZ to change its M&E system at this stage of the project and start reporting on indicators that were not part of the original agreement with the German Government.
33
Conclusions and Recommendations
GIZ has put in place a useful M&E system that speaks to the project’s theory of change as well as generates useful information to guide project implementation. The system is not data heavy and the information generated is used to provide direction to the project. The following recommendations are made;
1. The monitoring of outcomes should be documented and widely shared with the other Partners being supported by AusAID.
2. Revise indicators for component 4 that appear to be objectives and not indicators. 3. Develop assumptions and risk matrix for the project.
Appendix 3: World Bank Background and Overview The World Bank is spearheading work for the Analytical Multiple Donor Trust Fund. Its core mandate is to contribute towards creating an enabling policy environment for the water and sanitation sector by undertaking studies and assessments that form the background materials required for policy formulation. Status of the Monitoring and Evaluation System Theory of Change The overall objective of the World Bank work is to contribute towards informed debate and evidence based policy formulation processes in the water sector of Zimbabwe. A series of studies have been lined up as background work necessary for policy and strategy formulation for the WASH sector. Some of the studies that have been undertaken to date include;
1. Policy Support – The World Bank (WB) produced a consolidated background paper that the Government has used as part of the background papers to formulate a water sector policy. The policy has been drafted and is now being commented on by senior Government officials before it is taken to Cabinet for approval. Through policy support, WB is creating an environment for future work in the water sector.
2. Dam Safety Study: This study stems from the fact that Zimbabwe has now gone for over 10-15 years with minimum support to infrastructural development. Large dams require regular maintenance. The study focuses on 25 major dams managed by ZINWA. The report is currently being finalized and it will classify actions into 3 areas: a) Areas needing immediate attention, b) Areas that should be attended to in the near future, and c) Areas to be noted for possible action in future.
3. Technical Assistance to Harare: The World Bank brought in well experienced engineers to Harare City Council, one for Waste Water and another for Water Production. These undertook a thorough study of Harare water and the report is now in its final draft. It is all
34
about establishing whether or not it is a fact that Harare does not have enough water or it is an issue of management.
4. Tariff Study: This was meant to create a model of how urban centers can set up water tariffs. It looked at 7 municipalities to come up with the model.
There are other studies that are still to be undertaken or are now in the process of being conducted. These studies include;
1. Harare Strategic Plan: Looks at institutional arrangements, water sources, and relationships between Harare and its satellite towns. Asks the question, what kind of institutional model should be followed by Harare and its satellite towns.
2. Water Quality Strategy: The study seeks to establish how many water bodies throughout the country are currently polluted or being polluted. So much attention has been on Lake Chivero and yet the case may be that some other water bodies are being polluted while all attention is going to Chibero. This pollution could be from mining (especially small miners using mercury), urban effluent pollution, and pollution from agriculture.
3. Water Forum – Flexible Technical Assistance: This is a fund to respond to requests covering water and sanitation as well as energy infrastructure. The water forum is there to ensure that Zimbabwean experiences are shared with the world and that Zimbabwe gets to appreciate experiences from other corners of the world.
4. Benchmarking of Urban Water Utilities: This will be for 32 urban local authorities. The study looks at a set of indicators for urban local authorities and establishes a common understanding of some of the terms used. This is an important step towards harmonization of indicators and systems. Already there was a meeting in October that sought to have common definitions, e.g. definition of Access. There is need to look at issues such as non-revenue water, rate of collection of bills (bins), staff per thousand connections, waste water, solid waste in an effort to harmonise methods and tools for data collection. This will result in a Reliability Index. The question here is how reliable is data on indicators. It has been noted that most of the data that is available are estimates with questionable accuracy.
5. Water Sector Investment Framework: This is to support GoZ to be able to prioritize project within and across sectors. What has been happening is that decisions on which water projects to fund have been based on political expedience rather than on a clear analysis of the project’s economic benefits. The sector investment framework is supposed to guide government in the allocation of available resources to the different projects.
M&E Operations Framework
Overall Objective
Output Outcome Comment
Analytical Background studies that
Background papers
Influence adoption of Policies and
WB has concentrated on Outputs and feels they cannot directly influence
35
have a bearing on water policies and frameworks
Frameworks by Government and local authorities
policy finalization. Some of the findings in Background papers have already been taken up by various stakeholders and used in programming but WB has not documented the experiences from the use of such information.
Activity/Output Monitoring
The outputs of the project are the various reports produced by the World Bank. Most of these studies have a 7 month timeline. The timeline is crafted in an attempt to inform specific in-country events such as the national budget. The reports form the important background materials critical as up-front material for use in crafting national policies.
Outcome/Effect Monitoring
From the studies that have been undertaken to date there is anecdotal evidence of Government and local authorities adopting some recommendations and strategies identified by the studies. This is an important outcome but unfortunately this is not being monitored and documented. It is important as part of the Outcomes monitoring framework to track what, from the studies, has already been put to use in designing and implementing some programmes in the country by government, local authorities as well as non-governmental organizations.
Reporting
Synthesized reports from each study are shared first at ITRG (Infrastructure Technical Review Group), and then with the Policy Committee that is mainly composed of Donors. Reporting is not tailored to suit any specific donor.
Conclusions and Recommendations
The World Bank M&E framework as well as the monitoring and evaluation plan have to be documented. This will make it easier to assess progress on the various studies as well as progress towards achieving the intended objective of contributing towards establishment on an enabling policy environment for the water and sanitation sector. The system can also include the milestones for each of the studies.
The following recommendation is made;
1. The World Bank needs to improve the monitoring of outcomes and to document what aspects from the background papers have been taken up by who and what have been the
36
experiences. It is important to monitor whether the knowledge created through the studies and frameworks is being utilized to improve performance. This is best done by a consultant.
Appendix 4: UNICEF
Background and Overview
UNICEF has been implementing the Emergency Rehabilitation and Risk Reduction Programme (ER&RR) since 2008. The ER&RR is a multi-donor funded programme being implemented in more than 20 urban councils including Harare and Bulawayo. The overall goal of the ER&RR is to “reduce the number of cholera and or other diarrhea cases through support to the supply of essential water treatment chemicals and emergency rehabilitation of water and sanitation systems”. The project has three specific objectives namely;
• Improving water and sanitation services in at least 20 urban councils and critical rural small towns and growth points through emergency rehabilitation interventions
• Ensure that 23 targeted urban councils and ZINWA are able to provide clean potable water to all residents and
• Ensure that health institutions, schools and communities in most “at risk” districts have access to reliable water, sanitation and hygiene (WASH).
The expected result of the project is that “over 4.5million vulnerable women, men, girls and boys , most of whom reside in urban areas, will have improved access to safe drinking water , basic sanitation and hygiene services , significantly have access to safe drinking water , basic sanitation and hygiene services, significantly reducing the risk of cholera”.
Status of the Monitoring and Evaluation System Theory of Change The 2008 cholera outbreak required emergency response to ensure that cholera outbreaks and WASH related deaths were reduced and brought under control. The capacity of the councils and local authorities to respond to the cholera outbreak as well as the intermittent outbreaks of both cholera and typhoid thereafter was compromised by the lack of resources to purchase water treatment chemicals as well as to conduct repairs and maintenance of collapsing water production systems. The goal of this emergency project is to reduce the number of cholera and or other diarrhea cases through support to the supply of essential water treatment chemicals and emergency rehabilitation of water and sanitation systems. The project therefore sought to address this challenge through three main actions, improving water and sanitation services through emergency rehabilitation interventions, increase the production of clean potable water by ZINWA and the targeted urban councils and improving access to reliable water and sanitation services at institutions (health centers, schools) and in communities that were identified to be most at risk of cholera. The set of actions required to achieve the outcomes of this project are clearly laid out and guided by the assessments that were jointly undertaken by UNICEF, AusAID and other WASH partners that included GIZ and French Redcross. The assessment highlighted the priorities for investment
37
by the project in the short to immediate term. A comprehensive list of risks and assumptions is provided as well as the strategies for mitigating the effects of the risks identified. M&E Operations Framework A log frame is available for the project and outlines the objectives and indicators to be used for measuring the achievement or progress towards achievement of the project goals. A monitoring plan outlining the different monitoring and evaluation activities as well as their timing is provided as well as the data sources for each of the identified indicators. Activity/Output Monitoring As this project was designed as an emergency project, most of the emphasis on monitoring and evaluation has been on activity and output monitoring. The monitoring plan provided a guide on when each of the indicators is monitored but no responsibilities for data collection on the indicator were identified, whether it is the council or UNICEF or implementing Partner (IP).The use of an Indicator Tracking Table (ITT) or Indicator Performance Tracking Table (IPTT)will be important in tracking progress on the achievement of outputs. Outcome/Effect Monitoring The project did not develop an outcome monitoring system as the project was classified as an emergency and not developmental. The emphasis has therefore been on the monitoring of outputs although there are notable outcomes that have been achieved by the project, for example the zero open defecation achieved in one community in Hwange. Other examples of good work achieved by the programme include the integration and mainstreaming of disability and other cross cutting issues observed on ZIMCATS. This good work has not been well documented and brought to the fore for wider lesson learning. With a defined outcomes monitoring and reporting framework, such an achievement could have been well documented and available for lesson learning on the strategies employed. The Outcome monitoring would have helped answer some of the strategic questions that include;
• Has the training of Village Health Workers on gender sensitive hygiene education resulted in improved hygiene and sanitation outcomes?
• How effective have been the gender sensitive Health Clubs in improving hygiene practices and the zero open defecation strategy?
• How effective have been the developed PHHE messages in changing hygiene and sanitation practices?
• How effective has been the technical capacity building of the council engineers in managing potable water production, sewage blockages and leakages?
Whilst this is an emergency project some level of outcome monitoring with clearly defined baseline indicators is important in as far as it answers strategic questions on project strategy and informs the design of future related projects.
Context Monitoring
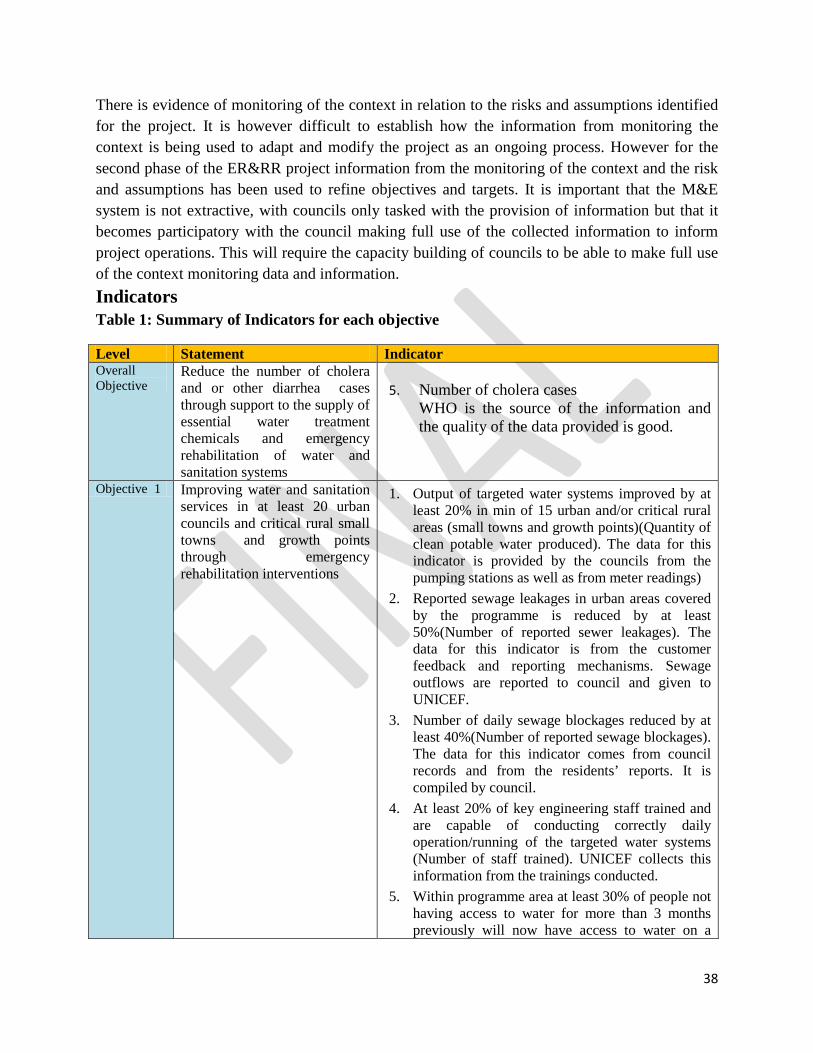
38
There is evidence of monitoring of the context in relation to the risks and assumptions identified for the project. It is however difficult to establish how the information from monitoring the context is being used to adapt and modify the project as an ongoing process. However for the second phase of the ER&RR project information from the monitoring of the context and the risk and assumptions has been used to refine objectives and targets. It is important that the M&E system is not extractive, with councils only tasked with the provision of information but that it becomes participatory with the council making full use of the collected information to inform project operations. This will require the capacity building of councils to be able to make full use of the context monitoring data and information. Indicators Table 1: Summary of Indicators for each objective
Level Statement Indicator Overall Objective
Reduce the number of cholera and or other diarrhea cases through support to the supply of essential water treatment chemicals and emergency rehabilitation of water and sanitation systems
5. Number of cholera cases
WHO is the source of the information and the quality of the data provided is good.
Objective 1 Improving water and sanitation services in at least 20 urban councils and critical rural small towns and growth points through emergency rehabilitation interventions
1. Output of targeted water systems improved by at least 20% in min of 15 urban and/or critical rural areas (small towns and growth points)(Quantity of clean potable water produced). The data for this indicator is provided by the councils from the pumping stations as well as from meter readings)
2. Reported sewage leakages in urban areas covered by the programme is reduced by at least 50%(Number of reported sewer leakages). The data for this indicator is from the customer feedback and reporting mechanisms. Sewage outflows are reported to council and given to UNICEF.
3. Number of daily sewage blockages reduced by at least 40%(Number of reported sewage blockages). The data for this indicator comes from council records and from the residents’ reports. It is compiled by council.
4. At least 20% of key engineering staff trained and are capable of conducting correctly daily operation/running of the targeted water systems (Number of staff trained). UNICEF collects this information from the trainings conducted.
5. Within programme area at least 30% of people not having access to water for more than 3 months previously will now have access to water on a
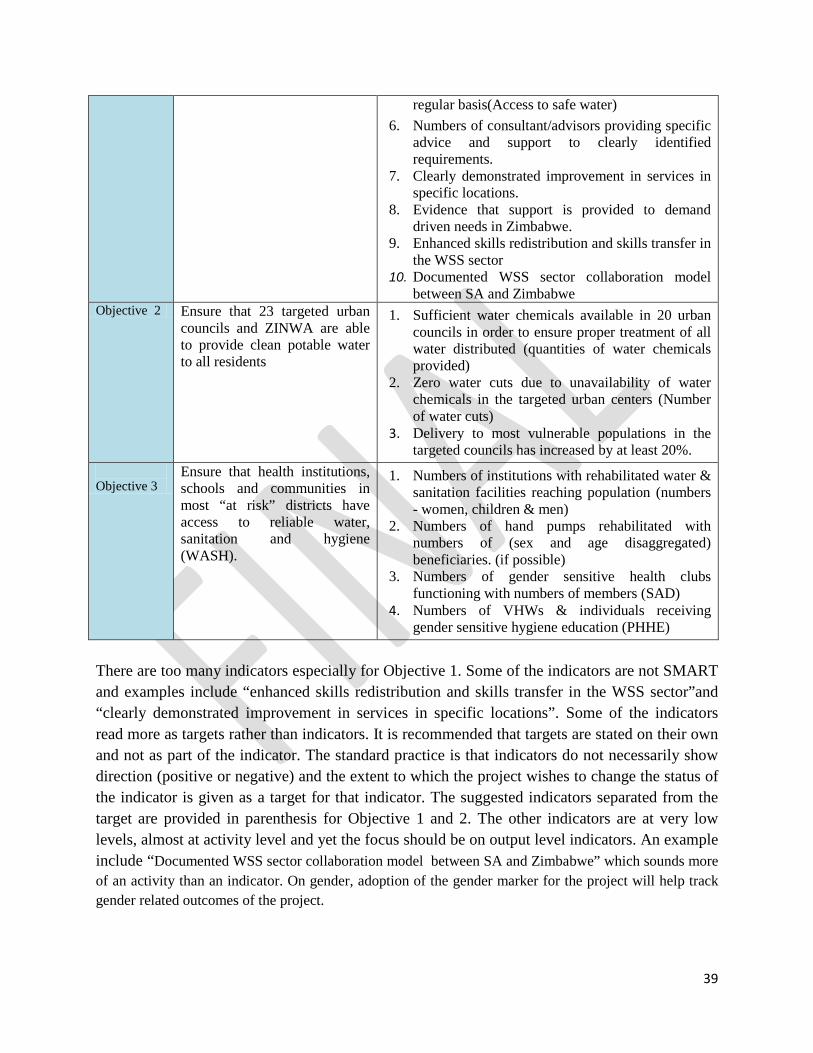
39
regular basis(Access to safe water) 6. Numbers of consultant/advisors providing specific
advice and support to clearly identified requirements.
7. Clearly demonstrated improvement in services in specific locations.
8. Evidence that support is provided to demand driven needs in Zimbabwe.
9. Enhanced skills redistribution and skills transfer in the WSS sector
10. Documented WSS sector collaboration model between SA and Zimbabwe
Objective 2 Ensure that 23 targeted urban councils and ZINWA are able to provide clean potable water to all residents
1. Sufficient water chemicals available in 20 urban councils in order to ensure proper treatment of all water distributed (quantities of water chemicals provided)
2. Zero water cuts due to unavailability of water chemicals in the targeted urban centers (Number of water cuts)
3. Delivery to most vulnerable populations in the targeted councils has increased by at least 20%.
Objective 3
Ensure that health institutions, schools and communities in most “at risk” districts have access to reliable water, sanitation and hygiene (WASH).
1. Numbers of institutions with rehabilitated water & sanitation facilities reaching population (numbers - women, children & men)
2. Numbers of hand pumps rehabilitated with numbers of (sex and age disaggregated) beneficiaries. (if possible)
3. Numbers of gender sensitive health clubs functioning with numbers of members (SAD)
4. Numbers of VHWs & individuals receiving gender sensitive hygiene education (PHHE)
There are too many indicators especially for Objective 1. Some of the indicators are not SMART and examples include “enhanced skills redistribution and skills transfer in the WSS sector”and “clearly demonstrated improvement in services in specific locations”. Some of the indicators read more as targets rather than indicators. It is recommended that targets are stated on their own and not as part of the indicator. The standard practice is that indicators do not necessarily show direction (positive or negative) and the extent to which the project wishes to change the status of the indicator is given as a target for that indicator. The suggested indicators separated from the target are provided in parenthesis for Objective 1 and 2. The other indicators are at very low levels, almost at activity level and yet the focus should be on output level indicators. An example include “Documented WSS sector collaboration model between SA and Zimbabwe” which sounds more of an activity than an indicator. On gender, adoption of the gender marker for the project will help track gender related outcomes of the project.
40
Baseline values for some indicators were constructed from the information provided by the Councils and local authorities and from the assessments that were conducted by AusAID and UNICEF. The baseline figures for number of people with access to safe water should be revised in line with the preliminary census results for 2012. The technical assessments conducted in the project towns and growth points were also important in establishing baseline values for some indicators. However a more structured baseline was necessary, covering the software components of the project. It is important to note that for the second phase such a baseline will be conducted and the tools have already been developed. The log frame and indicators for the second phase of the project have been significantly improved addressing some of the shortcomings of the first phase. The indicators have been trimmed and aligned to the AusAID Performance Assessment Framework. Data Collection, Quality and Integrity There are inconsistencies in the quality of the data provided by the councils, an indication of the capacity gap in monitoring and evaluation. For some of the indicators the data is of high quality, for example the data on cholera cases from the World Health Organization (WHO) and that of cases of diarrhea from the council clinics. There is need to build the capacity of the councils to collect the technical data required for the project. If councils are capacitated to also utilize the information they are collecting they will find value in investing in more efficient and reliable data collection systems that will provide high quality data and information. The data and information collected by the implementing partners of UNICEF is of good quality however the NGOs lack the experience of collecting technical data as their experience and expertise is more on the software component of the project. Urban WASH programming is new for most NGOs in Zimbabwe and as such there is need for capacity building and lessons sharing across board. There is scope in providing some training to the NGOs so that they can provide data quality control checks to the councils before the data is send to UNICEF. UNICEF invests a significant amount of time in data quality checks and this process could be improved by having the NGOs also assisting with the data quality checks at field level before the data and information is send to UNICEF. As part of the process of improving data quality, UNICEF trained 440 operators in reading meters as an effort towards improving data quality. It is critical that the impact of the capacity building activities be monitored. In the theory of change an assumption is made that if the councils have their capacity build, the operations of the council will improve. Given this assumption, it is important to identify which capacity building initiatives have had the most significant effect on the achievement of outcomes. It is also important to identify the challenges hindering the application of the improved capacity and how these challenges have limited the achievement of outcomes. Reporting
41
UNICEF produces two reports, an annual report covering progress on implementation and achievement of project targets as well as a six month/half year report that provides an update on implementation. Given the nature of the project activities, UNICEF does not see the need to report on a monthly basis and the agreed reporting timelines suit the project well. The challenge with this approach in the absence of milestones established prior to project implementation is that it becomes difficult to measure and understand the progress being made. The lack of a clear outcomes monitoring and reporting framework has meant that a lot of the good work being done by the project is being under reported, a case in point being the achievement of zero open defecation in one community and the integration of cross cutting issues in WASH. The review team identified a number of important lessons learned by the implementing partners but the reporting and documentation has been limited. It is important that the M&E function is clearly linked to the reporting needs of the project and that the reporting requirements are shared with other project partners. The reports have to go beyond the reporting of outputs but to include more analysis of the achievements and outcomes. This becomes difficult in the absence of a clear plan to monitor outcomes and information required to answer strategic questions on the theory of change for the programme. Challenges
1. The quality of the data provided by the councils has been inconsistent, a result of the capacity of the councils on M&E. As a result UNICEF spends a significant amount of time cleaning and trying to make sense of the data before analysis. To overcome this challenge UNICEF should consider setting up steering committees in supported towns for coordination and information sharing. This will also provide required capacity strengthening of local authorities.
2. The project was designed as an emergency project and the focus was just on getting water to the people as a result the development of the comprehensive M&E system lagged behind and the focus was on activities and outputs. Special studies can be an option for generating information and evidence to answer the strategic questions on the theory of change. This will also be important for informing the design of other AusAID supported WASH projects.
3. Attribution is one of the challenges given that the councils are also providing their own resources to rehabilitate the water production and distribution infrastructure as well as the infrastructure for solid waste and sewage management. Other partners and Government through PSIP are also providing support to the councils and this further complicates the attribution. However AusAID provides some guidelines on how calculations can be made of the contribution of AusAID resources towards achievement of project objectives. Coordination committees at the council level will be important in understanding who is doing what and make the attribution case easier.
42
4. In this first phase of the project it was difficult for UNICEF to get a dedicated M&E person as the contract was going to only be for a year renewable if funding becomes available. However the M&E function was provided by the centralized M&E personnel in UNICEF.
5. The lack of a harmonized set of indicators for the Wash sector in Zimbabwe is making it difficult to report to donors (different indicators) and feed into the national system. The work being done by the World Bank on bench marking the indicators that councils and local authorities can use is key to solving this challenge.
Adoption of AusAID WASH Performance Assessment Framework (PAF) Indicators At the time of the development of the proposal reference was not made to the AusAID Performance Assessment Framework (PAF). As a result not much was adopted from the PAF although the information being collected could be used to generate results for some of the PAF indicators. It is also important to highlight that as the ER&RR is a multi-donor fund, it is difficult for UNICEF to adopt the performance indicators of all donors or that of one single donor and this further emphasizes the need to have indicators harmonized at sector, national (NCU) or donor level. The AusAID PAF indicators that can be computed from the available information include the;
• number of people with access to safe water • number of people with access to sanitation • incidence of cholera cases disaggregated by gender • quantities of safe water per person
The challenge on the number of people with access to safe water and sanitation services has been that the Census figures available are out of date as they are from the 2002 national census. However these figures will be revised once the census results of the 2012 national census are available.
Conclusions and Recommendations
The M&E system developed for this project focused mainly on activities and outputs, a characteristic of most emergency/relief projects. The system needed to be strengthened with the transition to a more recovery/developmental phase by developing a clear outcomes monitoring framework and documenting the lessons learnt. The M&E framework for the second phase of ER&RR shred by UNICEF with the consultants showed very significant improvements over the phase one system.
The following recommendations are made;
1. UNICEF has to develop an outcomes monitoring and reporting framework so as to be able to document the impact of the software component of the project. Special studies
43
focusing on strategic questions are also key in generating information that provides strategic guidance to the project. UNICEF should also capturing life changing stories to communicate some iof the important achievements being made by the project in the absence of an outcomes monitoring framework.
2. UNICEF can improve the tracking of outputs by adopting the Indicator Tracking Tables (ITT) or Indicator or Performance Tracking Tables (IPTT).
3. As the WASH Cluster lead UNICEF is better placed to spearhead the harmonization of indicators for the WASH sector in Zimbabwe.
4. UNICEF should provide training and capacity building to the councils so as to improve the quality of data and information collected by the councils.
5. For the second phase of the project, it will be important for UNICEF to consider hiring a dedicated M&E person to develop the M&E system that should meet the reporting requirements and monitoring of outcomes.
Appendix 5: World Vision
Introduction and Overview The Bulawayo Water and Sewage Response (BOWSER) was a response to the deteriorating water supply and sewage reticulation systems in the city of Bulawayo. The World Vision led BOWSER project aims to reduce vulnerability of the residents of Bulawayo to the threat of waterborne diseases such as cholera through improved sewerage, water supply systems and capacity building to restore the council’s financial sustainability. BOWSER project has 3 partners, Bulawayo City Council (BCC), Dabane Trust and World Vision as the lead Agency. World Vision, as the lead Agency, oversees the roll out of the programme and also implements some activities.
The goal of the BOWSER project is to reduce vulnerability to waterborne diseases in Bulawayo through improved sewerage and water supply systems, improved customer care and financial sustainability of the City Council. The Project has four outcomes namely:
1. At least 450,000 residents in Bulawayo have access to a functioning sewerage system. 2. At least 450,000 residents in Bulawayo have improved access to clean water through the
city piped water systems. 3. City of Bulawayo residents and its council staff have improved water, sanitation and
hygiene practices to optimise available resources and services. 4. City of Bulawayo has increased financial sustainability in Water and Sanitation Services
and Improved Capacity to provide Customer Care to Residents. Status of the Monitoring and Evaluation System Theory of Change
The project’s overall objective is to reduce vulnerability to waterborne diseases in Bulawayo. This will be achieved through three key components, improving sewerage and water supply
44
systems, improving customer care and improving the financial stability and sustainability of the City Council of Bulawayo. The actions that are important in achieving the goal are clearly laid out in the logical framework as well as the assumptions made for the project. However there is no risk mitigation strategy provided for each of the identified assumptions/risks. It is important to have the risk mitigation strategies identified in case the risks become a reality and the project should have a plan in advance on how that risk can be managed in the event that it becomes reality. The other assumptions stated should actually not be assumptions but probably part of the project approach. For example the project assumes that “Partners recognise importance of having women involved in management of project”, and “Partners recognise importance of having women involved in management of hygiene awareness campaigns”. These two should actually be covered by the strategy on how the project will increase the participation of women in the project. The other assumptions are what could be project activities and not assumptions and examples include “Awareness campaigns will be conducted in both English and relevant local languages”, “Different methods such as social media, media and radio as well as billboards will be utilised for the entire city of Bulawayo”. These are within the Project’s control and should not be assumptions but project activities. These assumptions have to be revisited so that only those that are risks that threaten the achievement of project objectives are included as well as the mitigation strategies for the risks. There are other risks that are critical for the project but not stated and these include power outages that affect pumping of water and sewage, drying up of water sources and the losses in the distribution system.
The M&E system has not been designed to monitor and collect evidence to test the assumptions and provide answers to the strategic questions made on the theory of change. Examples of such questions include;
a) Have the strategies employed by the project enhanced the participation of women? b) Have the strategies employed by the project resulted in the equitable access to safe water? c) Does improvements in service result in the increase in willingness to pay for services
provided by the city council? d) Does the strategy employed by the project on participatory health and hygiene contribute
to the adoption of recommended health and hygiene practices? e) Does increasing the voice of residents on council matters increase the quality of service
delivery?
Some of these could be studies on their own or be part of the outcome monitoring framework.
M&E Operations Framework
The logframe is available with indicators specified at the different levels. The methods and sources of data are stated. The monitoring plan is also available clearly stating what information is collected when and by whom including the frequency of collection of such information.
45
During the first months of the project, the roles and responsibilities of the Partners on monitoring and evaluation were not clearly spelt out. Each partner operated as an independent unit using different approaches and methods. It was realized that the approaches and tools had to be harmonised and standardized across the Partners for easier reporting and consolidation, ensuring Partners tracked the same indicators. World Vision developed an Indicator Tracking Table/Template (ITT) for use by all Partners in tracking performance of the project. The ITT was initially resisted as partners felt they would be reporting about their own under-performance, but it was later accepted as a management tool. The ITT tracks “What has been done, When, by Who”. There are no milestones but a discussion is held to review progress and efforts are made to speed up activities where it is realised that the programme lags behind. So the ITT is used to inform programme implementation by each Partner and has proved useful as a performance management tool.
BOWSER mainly tracks activity indicators. There have been efforts to track changes in people’s quality of life through Most Significant Change stories and collection of resident’s complaints.
A baseline was carried out in November/December 2011 and the values for outcome indicators were established. There has been no budget for tracking outputs and outcomes so it is intended that the next data collection exercise for monitoring outputs and outcomes will be at end of project evaluation.
Activity/Output Monitoring
WV came up with inventory checks and an Indicator Tracking Table for tracking progress in the implementation of project activities as well as the quality of the outputs. The Indicator Tracking Table is the standard tool used to track achievement of outputs. The inventory or quality spot checks conducted by the M&E on Partners is a good addition to the M&E system as it provides an opportunity for monitoring the quality of outputs. Each implementing partner is required to fill in an Activity Template and WV does some quality checks by way of spot checks to verify some of the progress figures provided by the Partners. Monthly meetings are held with Partners to review progress and performance in relation to the tracking table (ITT) results.
Outcome/Effect Monitoring World Vision adopted the Most Significant Change (MSC) approach to measure qualitative outcomes of the project. The Accountability, Monitoring and Evaluation (AM&E) system was primarily designed to measure quantitative changes primarily at output level. The MSC approach is therefore a good approach to measure qualitative outcomes. However MSC is not robust enough to capture the depth and breadth of the outcomes of the project, and it should be used to complement other outcome measuring approaches. Whilst an MSC story can identify a positive change say improved cleanliness it does not go further than that and yet the other important is what proportion of residents see this change, those that do not see this change what is the challenge and where can improvements be made. It is therefore important to use the MSC
46
approach to complement other more robust approaches. The Participatory Health and Hygiene Education(PHHE) Index developed by the Protracted Relief Programme (PRP) to specifically measure the outcomes of PHHE could be a critical addition to the MSC approach being used by World Vision. The stories collected appear to be primarily positive. It is recommended that there be a deliberate effort to collect negative stories of change if available as these are important for identifying gaps in programming and impact and for organizational learning. Context Monitoring The monitoring of the context in which the project is being implemented is not systematic and structured although there is some evidence of monitoring. It is important that the context is monitored and documented in terms of how the changing context and assumptions made on the project are affecting the achievement of project activities. Indicators
The indicators presented in the logframe are too many and a significant number of them are not SMART. The M&E system has a total of 35 indicators. Most of these have not been reported on as some are not properly defined and as such are not easily measurable. Some of the indicators measure the same output or outcome but from a different angle. This makes the M&E system overly complex. The development of the M&E system did not take into account the AusAID Performance Assessment Framework as that could have provided more guidance on the selection of Indicators for the project.
Indicators at Activity/Output Level
These are too many and should be reduced to less than half of what is being tracked by the project.
1. 11 pump houses effectively moving sewerage through the reticulation system 2. 45 sand traps are cleared and functioning, with surrounding area cleared of excrement 3. % decrease in the number of pipe blockages 4. 800 meters of main outfall pipes repaired and functioning 5. Number of women and men actively engaging in and contributing to management and
oversight of the sewerage system 6. Decrease in the number of reported water leaks 7. Pumps at Ncema, Fernhill and Criterion are functioning and effectively pumping required
quantities of water 8. % of contractors, BCC staff and other institutions responsible for the management and
overseeing of water supply project work to be women 9. % of BCC staff who demonstrate improved knowledge and awareness of WASH issues 10. % of households with improved knowledge on the operation and maintenance of toilets 11. % increase in Accuracy of Property Information Database ; 12. % decrease in the average time taken for data capture ; 13. % decrease in the number of exception errors ;
47
14. % increase in accuracy of sampled records 15. % increase in the number of residents expressing satisfaction with BCC customer service
management procedures ; 16. % of sub offices able to provide point of payment account statements ; 17. % of BCC staff demonstrating competency in BIQ , system maintenance and
troubleshooting; 18. % district offices who report adequate IT support; 19. Call Centre functioning at least 4 months before the end of the project 20. Number of residents able to articulate one way to engage with BCC on water and sewage
matters 21. % increase in community participation in water conservation
Some of the indicators are not output level indicators but outcome level indicators especially indicators that measure behavioural change, for example, “staff demonstrating competencies” is an outcome of the capacity building process and as such it becomes an outcome level indicator. The same applies to “residents satisfaction”, “household improved knowledge”, and “number of men and women actively contributing to management oversight”. Outcome Level Indicators
The outcome level indicators are also too many and some are not SMART and are not clearly defined. Some of the indicators measure the same but from a different angle, an example being “% of households with improved access to safe water” and “% increase in safe water used by beneficiaries”. It is also recommended that indicators should be structured in such a way that they are non-directional. The direction will come from the analysis of project achievements. The other indicators are not clear what the intention is and an example include “% of households who report changed practice in the operation and maintenance of toilets” and “% of water supply systems repaired that are adequately operated and maintained”. Water supply systems is such a broad term and it becomes difficult to understand how the percentage of water systems can be computed. Another example of a vague indicator is “% increase in community participation in water conservation”. The list of outcome level indicators include;
1. % of Sewerage Systems repaired that are adequately operated and maintained by the BCC
2. % of communities with reduced sewage overflows in their communities 3. % of Water Supply systems repaired that are adequately operated and maintained 4. % of Households with improved access to safe water through the reticulated water supply 5. % increase in safe water used by beneficiaries in project areas 6. % of HHs who report changed practice in the operation and maintenance of toilets 7. % increase in the number of children under the age of 5 receiving ORS for treatment of
diarrhoeal disease, in catchment and project areas 8. % increase in Residents of Bulawayo demonstrating good hygiene practices and
especially handwashing with soap
48
9. % increase in community participation in water conservation 10. % of WASH funds directed to Hygiene activities 11. % women members of institutions responsible for planning overseeing operations and
management of water supply services 12. % change in revenue collected in a month 13. % women member of institutions responsible for planning and overseeing operations and
management of local sanitation services 14. % of non revenue water in piped water networks
The indicators have to be reduced and be made more precise and SMART. With such a large number of indicators there is an unnecessary load placed on the M&E and in most cases quality is compromised and a lot of the information collected in not really utilized. It is also important to note that when the project started there was no generally consensus between World Vision and its Partners in terms of what would be measured and why. The M&E roles and responsibilities for each of the BOWSER Partners should have been made clearer from the start. It was only after discussions and creating an M&E working group that the Partners started having the same understanding with World Vision on matters relating to M&E. There are no indicator definitions that were developed for the project and this made it difficult when the Project Manager resigned and another one was hired as it was difficult to understand some of the indicators (as highlighted in this report) and the rationale behind each of the selected indicators. It is important to have indicator definitions to ensure that the understanding of what the indicator is meant to capture is understood by all and in the absence of the original developers of the M&E system those who come in can easily relate to the indicators and the data collection processes. The monitoring has primarily been at output level with Most Significant Change Stories (MSC) used to report some of the stated outcomes. Whilst the MSC captures qualitative changes (positive or negative) in beneficiary’s lives it is not robust enough to provide an aggregate picture of the whole project. Another outcome monitoring approach should have been developed to measure changes in outcomes. Examples of such include the Knowledge Attitudes and Practices (KAP) survey or the Participatory Health and Hygiene Index (PHHE) developed by the Protracted Relief Programme (PRP). The reason provided for not developing an outcomes monitoring approach is that the M&E budget is not adequate to support a comprehensive outcomes monitoring framework. A mid-term evaluation would have been important in this case especially if it was to be structured in such a way that it could gather more information on the outcomes of the project interventions. In the absence of an outcomes monitoring system and mid-term evaluation the use of Most Significant Change stories (MSC) becomes inadequate in explaining achievement of outcomes by the project. The end of project evaluation will have to focus more on the outcomes
49
particularly the qualitative impact of the project as well as revisit the strategic questions from the theory of change. Data Collection, Quality and Integrity
The quality of data improved with the introduction of the ITT and the monthly meetings on M&E that ensured that the Partners have the same understanding on M&E. The quality of the data still varies depending on the indicator. For those indicators where the Council is the major source of the information, the quality was initially inconsistent during the first months of the project but gradually improved as the capacity of the council also increased with some guidance from World Vision. The budget for M&E is not adequate to provide intensive and structured capacity building support tor partners. Overall the quality of the information is fair.
Reporting When the project started, internal reporting was fortnightly but this proved to be difficult until the Partners agreed to a monthly reporting schedule. The M&E plan has made it easier to meet the reporting requirements of the project. Challenges The main challenges faced on M&E include;
1. Lack of adequate M&E resources to support the development of a more structured and robust outcomes monitoring and reporting system.
2. The limited capacity on M&E in the council and how that affects the quality of information collected
3. The development of the indicators and M&E framework was not consultative and in the absence of indicator definitions it is difficult to understand the rationale behind some of the indicators.
4. The establishment of the baseline was delayed and only conducted when the project activities had already started. This makes it difficult to clearly establish the before and after project scenarios and in some cases the actual baseline figures have to be reconstructed with estimates from the council.
Adoption of AusAID WASH Performance Assessment Framework (PAF) Indicators At the time of the development of the proposal, the AusAID PAF was not available for WV to adopt the indicators in the performance assessment framework. Conclusions and Recommendations
The M&E system has the three key requirements, the logframe, the monitoring plan and the Indicator Tracking Table (ITT). The information generated is of reasonable to good quality depending on the indicator. However there are too many indicators and that has created an
50
unnecessary burden on the M&E personnel. It is also difficult to establish how the information collected on all the stated indicators has been utilized by the project to date, hence the need to have a utilization focused M&E system.
The MSC approach on its own will not be robust and comprehensive enough to capture achievement of project outcomes. It can only complement another approach likes the KAP survey to provide a better picture for the overall project. However there are insufficient resources for M&E to enable World Vision to develop a comprehensive outcomes monitoring system.
The following recommendations are made;
1. The M&E should be utilization focused and collect only that information that is utilized by the project. World Vision should streamline the number of indicators and remain with a small set of indicators that are SMART.
2. AusAID should avail the Performance Assessment Framework (PAF) to Partners earlier in the project cycle to ensure that Partners adopt the relevant indicators from the PAF. That way Partners will be able to easily provide AusAID with information for reporting purposes.
3. World Vision should consider developing another approach to complement the MSC approach in the monitoring of project outcomes. A simple KAP survey will capture behavior change and other qualitative aspects.
4. It is important that adequate resources be provided for M&E for both capacity building of the Partners as well as for establishing a structured outcomes monitoring system to complement the MSC approach.
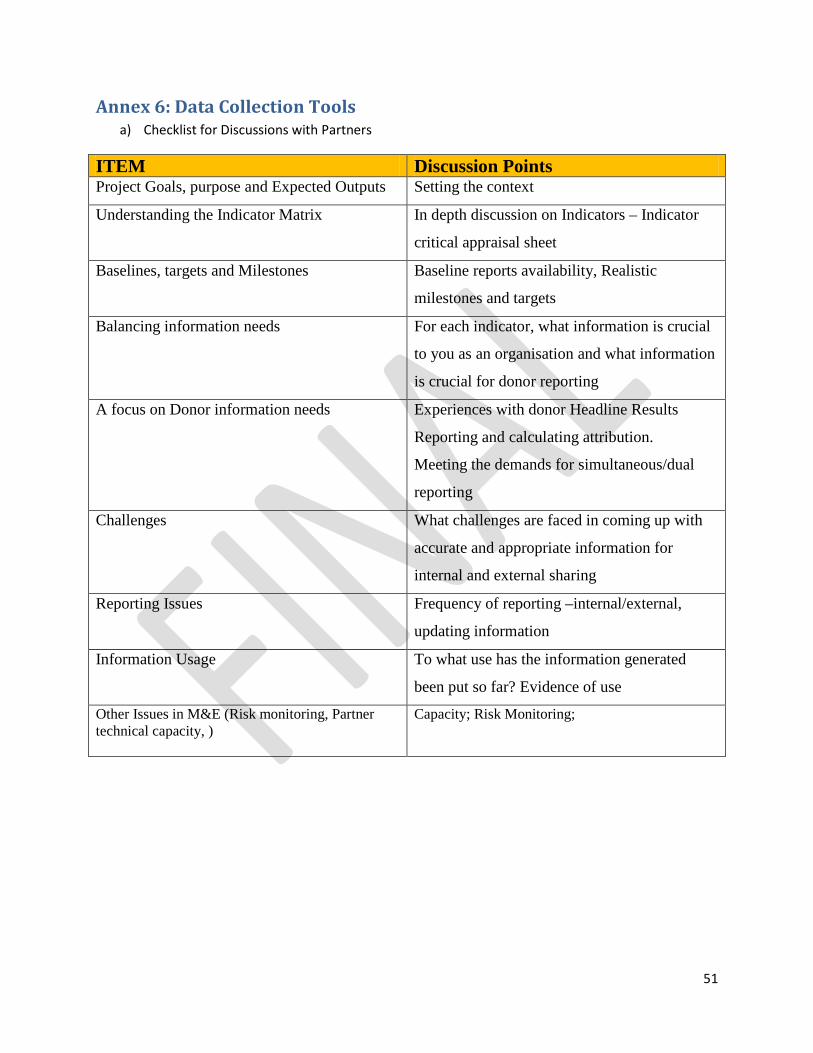
51
Annex 6: Data Collection Tools a) Checklist for Discussions with Partners
ITEM Discussion Points Project Goals, purpose and Expected Outputs Setting the context
Understanding the Indicator Matrix In depth discussion on Indicators – Indicator
critical appraisal sheet
Baselines, targets and Milestones Baseline reports availability, Realistic
milestones and targets
Balancing information needs For each indicator, what information is crucial
to you as an organisation and what information
is crucial for donor reporting
A focus on Donor information needs Experiences with donor Headline Results
Reporting and calculating attribution.
Meeting the demands for simultaneous/dual
reporting
Challenges What challenges are faced in coming up with
accurate and appropriate information for
internal and external sharing
Reporting Issues Frequency of reporting –internal/external,
updating information
Information Usage To what use has the information generated
been put so far? Evidence of use
Other Issues in M&E (Risk monitoring, Partner technical capacity, )
Capacity; Risk Monitoring;
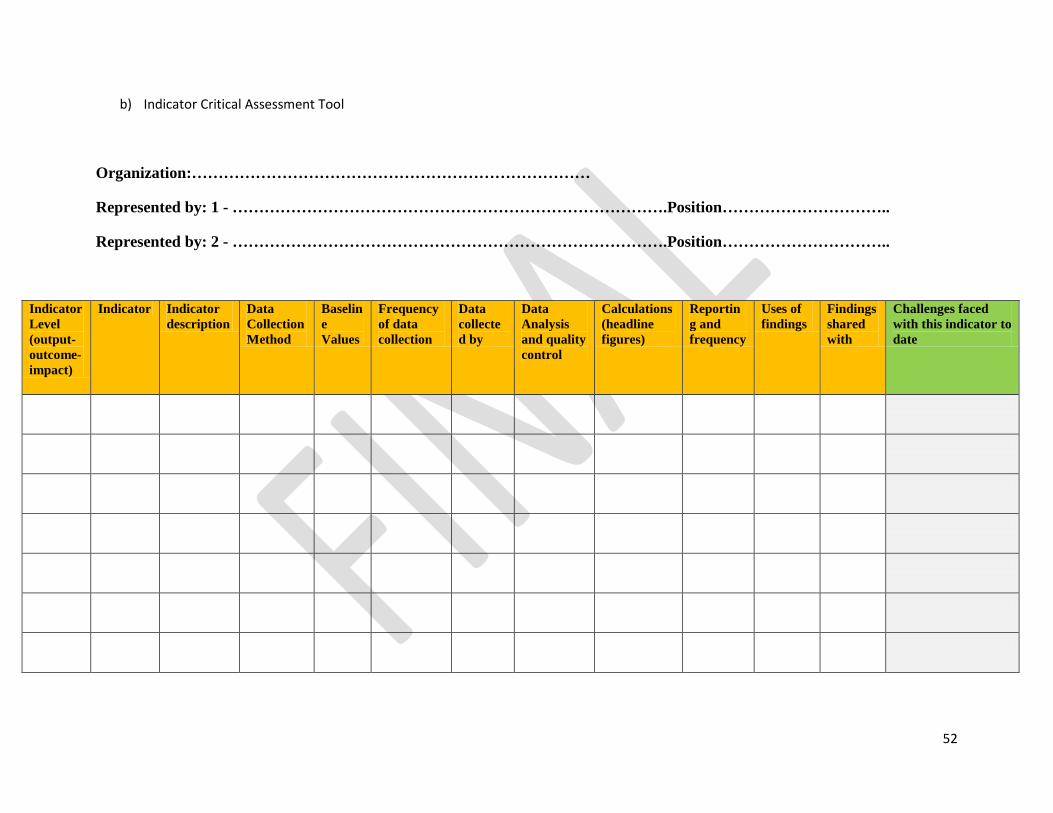
52
b) Indicator Critical Assessment Tool
Organization:…………………………………………………………………
Represented by: 1 - ……………………………………………………………………….Position…………………………..
Represented by: 2 - ……………………………………………………………………….Position…………………………..
Indicator Level (output-outcome-impact)
Indicator Indicator description
Data Collection Method
Baseline Values
Frequency of data collection
Data collected by
Data Analysis and quality control
Calculations (headline figures)
Reporting and frequency
Uses of findings
Findings shared with
Challenges faced with this indicator to date

53