the atlantic ocean and factors relating to cyclogenesis
TRANSCRIPT

The Atlantic Ocean And Factors Relating to Cyclogenesis
Dr. Liudmila Vanina-Dart
"Seeing Ear" Ltd, UK
Author | Atlantic from Space Workshop | 23-25/01/2019 | Slide 2
Abstract
The Atlantic Ocean (AO)has a unique feature. In the different hemispheres, it has completely different results of cyclogenesis. For example, in the Northern Hemisphere we observe hurricanes of varying severity, often leading to significant destruction. But in the Southern Hemisphere these hurricanes are practically absent. As we know, in the AO specific water circulation influences the temperature background of surface waters. Temperature is one of the most important characteristics of cyclogenesis formation. However, we observe the absence of tropical cyclones when the ocean surface is warm enough for hurricanes creation . Apparently there is clearly the presence of another possible factor - salinity. Salinity is the main component of another parameter – density of water. Water circulation is dependant on water density. The author used the data of the Aquarius/SAC-D mission, launched on June 10, 2011. The mission was a joint venture between NASA and the Argentinean Space Agency (CONAE). The mission featured the sea surface salinity sensor Aquarius and was the first mission with the primary goal of measuring sea surface salinity (SSS) from space. Using these data we can understand why in different hemispheres with huge salinity in both hemispheres we observe the different result in hurricanes formation.
Author | Atlantic from Space Workshop | 23-25/01/2019 | Slide 3
6 factors
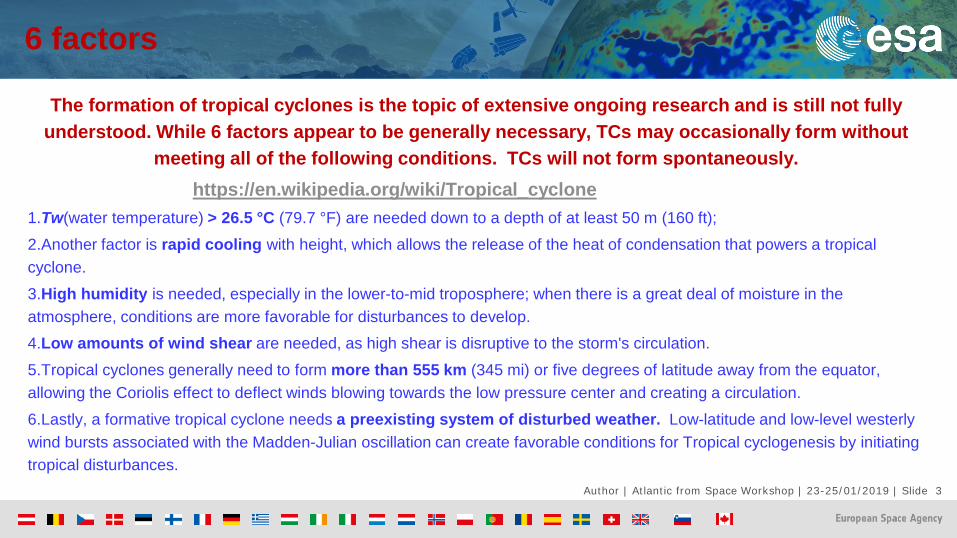
The formation of tropical cyclones is the topic of extensive ongoing research and is still not fully understood. While 6 factors appear to be generally necessary, TCs may occasionally form without
meeting all of the following conditions. TCs will not form spontaneously.https://en.wikipedia.org/wiki/Tropical_cyclone
1.Tw(water temperature) > 26.5 °C (79.7 °F) are needed down to a depth of at least 50 m (160 ft);2.Another factor is rapid cooling with height, which allows the release of the heat of condensation that powers a tropical cyclone.3.High humidity is needed, especially in the lower-to-mid troposphere; when there is a great deal of moisture in the atmosphere, conditions are more favorable for disturbances to develop.4.Low amounts of wind shear are needed, as high shear is disruptive to the storm's circulation.5.Tropical cyclones generally need to form more than 555 km (345 mi) or five degrees of latitude away from the equator, allowing the Coriolis effect to deflect winds blowing towards the low pressure center and creating a circulation.6.Lastly, a formative tropical cyclone needs a preexisting system of disturbed weather. Low-latitude and low-level westerly wind bursts associated with the Madden-Julian oscillation can create favorable conditions for Tropical cyclogenesis by initiating tropical disturbances.

Author | Atlantic from Space Workshop | 23-25/01/2019 | Slide 4
Until April 1991, it was thought that TCs did not develop within the South Atlantic. Very strongvertical wind shear in the troposphere is considered a deterrent. The Intertropical ConvergenceZone drops one to two degrees south of the equator, not far enough from the equator for theCoriolis force to aid development. Water temperatures in the tropics of the southern Atlantic arecooler than those in the tropical north Atlantic. (en.wikipedia.org)
A study was subsequently performed andpublished during 2012, which concluded thatthere had been 63 subtropical cyclones in theSouthern Atlantic between 1957 and 2007.
In 2011, the Brazilian Navy HydrographicCenter started to assign names to tropical andsubtropical cyclones that develop within its areaof responsibility, to the west of 20°W, when theyhave sustained wind speeds of at least 65 km/h(40 mph).

Author | Atlantic from Space Workshop | 23-25/01/2019 | Slide 5

Author | Atlantic from Space Workshop | 23-25/01/2019 | Slide 6
North Atlantic Ocean currents
In this illustration we can see the warm flow of the North Atlantic Gyre and North Atlantic current, as well as the cold deep backflow heading South, eventually crossing under the Gulf Stream.

Author | Atlantic from Space Workshop | 23-25/01/2019 | Slide 7
Atlantic Ocean currents
Author | Atlantic from Space Workshop | 23-25/01/2019 | Slide 8
2011 Atlantic hurricane season
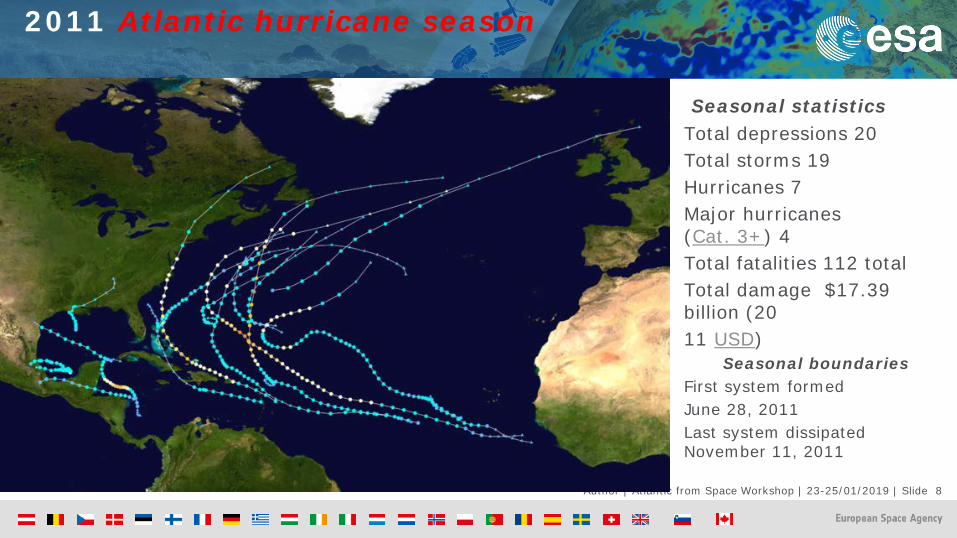
Seasonal statisticsTotal depressions 20Total storms 19Hurricanes 7Major hurricanes(Cat. 3+) 4Total fatalities 112 totalTotal damage $17.39 billion (2011 USD)
Seasonal boundariesFirst system formed June 28, 2011Last system dissipated November 11, 2011
Author | Atlantic from Space Workshop | 23-25/01/2019 | Slide 9
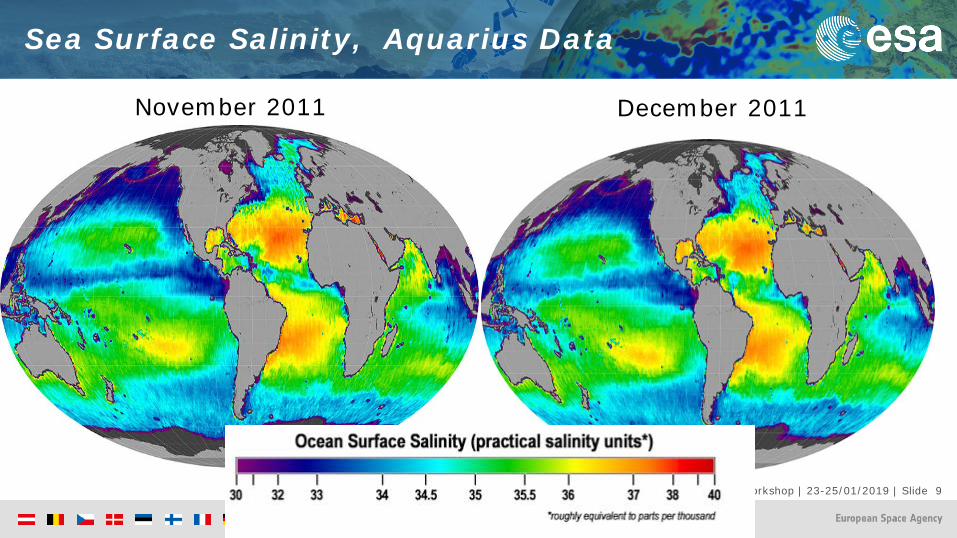
Sea Surface Salinity, Aquarius Data
November 2011 December 2011

Author | Atlantic from Space Workshop | 23-25/01/2019 | Slide 10
2012 Atlantic hurricane season
Seasonal statistics Total depressions 19 Total storms 19Hurricanes 10Major hurricanes(Cat. 3+) 2 Total fatalities 355 total Total damage≥ $72.32 billion (2012 USD)(Third-costliest tropical cyclone season on record)
Seasonal boundariesFirst system formedMay 19, 2012Last system dissipatedOctober 29, 2012

Author | Atlantic from Space Workshop | 23-25/01/2019 | Slide 11
Sea Surface Salinity, Aquarius Data
March 2012 April 2012 May 2012
June 2012 July 2012

Author | Atlantic from Space Workshop | 23-25/01/2019 | Slide 12
The Hamza and the Amazon are the two main drainage systems for the Amazon Basin. The reported flow rate of the Hamza, at approximately 3,000 cubic metres(110,000 cu ft) per second, is 3% of the Amazon's.[3] It runs west to east, some 4,000 metres (13,000 ft) below the Earth's surface, and follows roughly the path of the Amazon river.[6] The Hamza empties in theAtlanticOcean, deep under the surface. Its own water has a high salt content.[7]

Author | Atlantic from Space Workshop | 23-25/01/2019 | Slide 13
2013 Atlantic hurricane season
Seasonal statisticsTotal depressions1 5Total storms 14Hurricanes 2Major hurricanes(Cat. 3+) 0Total fatalities 54 totalTotal damage≥ $1.512 billion (2013 USD)Seasonal boundaries
First system formedJune 5, 2013Last system dissipatedDecember 7, 2013

Author | Atlantic from Space Workshop | 23-25/01/2019 | Slide 14
Sea Surface Salinity, Aquarius Data
April 2013 May 2013
June 2013

Author | Atlantic from Space Workshop | 23-25/01/2019 | Slide 15
2014 Atlantic hurricane season
Seasonal statistics Total depressions 9, 1 unofficial Total storms 8, 1 unofficialHurricanes 6Major hurricanes(Cat. 3+) 2Total fatalities 21 totalTotal damage≥ $343.1 million (2014 USD)
Seasonal boundariesFirst system formed July 1, 2014 Last system dissipated October 28, 2014
Author | Atlantic from Space Workshop | 23-25/01/2019 | Slide 16
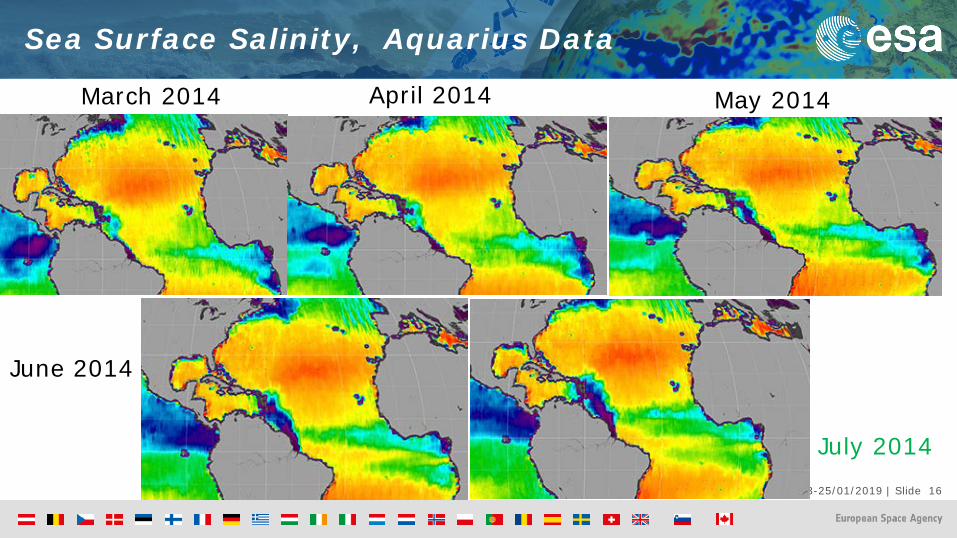
Sea Surface Salinity, Aquarius Data
April 2014 May 2014March 2014
June 2014
July 2014

Author | Atlantic from Space Workshop | 23-25/01/2019 | Slide 17
2015 Atlantic hurricane season
Seasonal statistics Total depressions 12 Total storms 11 Hurricanes 4 Major hurricanes(Cat. 3+)2 Total fatalities 89 total Total damage$731.8 million (2015 USD)
Seasonal boundaries First system formed May 8, 2015 Last system dissipated November 11, 2015
Author | Atlantic from Space Workshop | 23-25/01/2019 | Slide 18
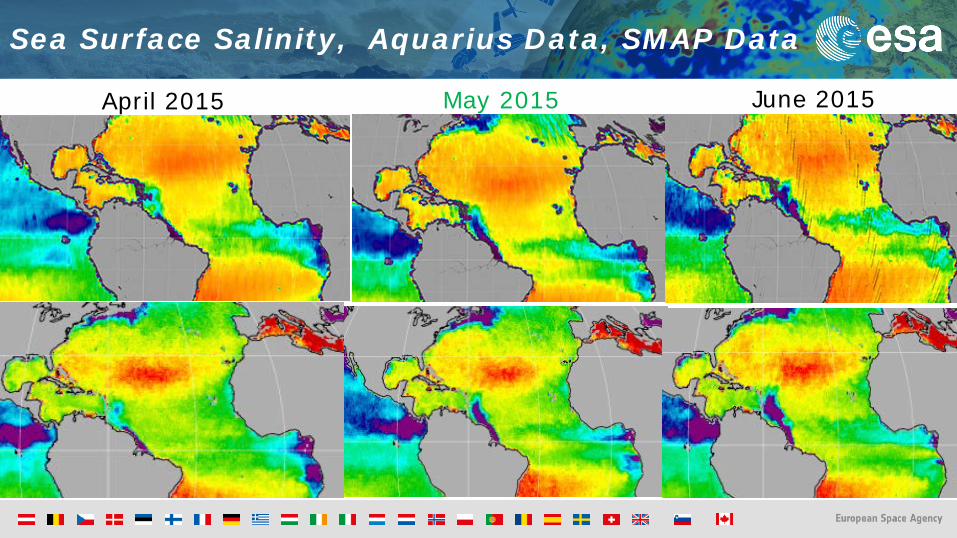
Sea Surface Salinity, Aquarius Data, SMAP Data
April 2015 May 2015 June 2015

Author | Atlantic from Space Workshop | 23-25/01/2019 | Slide 19
NASA's Soil Moisture Active Passive (SMAP) mission began collecting sea surface salinity data in April 2015, overlapping with Aquarius observations for approximately three months. Using the same frequency as Aquarius (L-band; 1.41 GHz), SMAP's global salinity measurements continue the time series that began with Aquarius in August 2011.
There are key differences between Aquarius and SMAP. Aquarius used three radiometers at fixed angles (25.8°, 33.8° and 40.3°), whereas SMAP scans earth using a spinning antenna. This scanning ability gives SMAP a 1000 km (621 mi) wide swath, providing global coverage every three days. Aquarius, on the other hand, had a 350 km (218 mi) wide swath that covered earth's surface in seven days. SMAP observations also have a smaller footprint (39 x 47 km; 24 x 29 mi) than Aquarius (150 x 150 km; 93 x 93 mi), providing opportunities to study salinity features at a higher spatial resolution but Aquarius had a radar (to help correct for roughness) and better thermal control.

Author | Atlantic from Space Workshop | 23-25/01/2019 | Slide 20
2016 Atlantic hurricane season
Seasonal statistics Total depressions 16, 1 unofficial Total storms15, 1 unofficial Hurricanes 7 Major hurricanes(Cat. 3+) 4 Total fatalities 748 totalTotal damage≥ $16.1 billion (2016 USD)
Seasonal boundariesFirst system formedJanuary 12, 2016Last system dissipatedNovember 25, 2016

Author | Atlantic from Space Workshop | 23-25/01/2019 | Slide 21
Sea Surface Salinity, SMAP Data
Duration January 12 – January 15, 2016
Category 1 hurricane (SSHWS)

Author | Atlantic from Space Workshop | 23-25/01/2019 | Slide 22
Sea Surface Salinity, SMAP Data
The season officially started on June 1May 27 – June 4
April 2016 May 2016 June 2016

Author | Atlantic from Space Workshop | 23-25/01/2019 | Slide 23
2017 Atlantic hurricane seasona hyperactive and catastrophic hurricane season
Seasonal statisticsTotal depressions 18 Total storms17 Hurricanes10Major hurricanes(Cat. 3+)6Total fatalities3 ,361 total Total damage≥ $282.27 billion (2017 USD) (Costliest tropical cyclone season on record)Seasonal boundariesFirst system formed April 19, 2017 . Last system dissipated November 9, 2017
Author | Atlantic from Space Workshop | 23-25/01/2019 | Slide 24
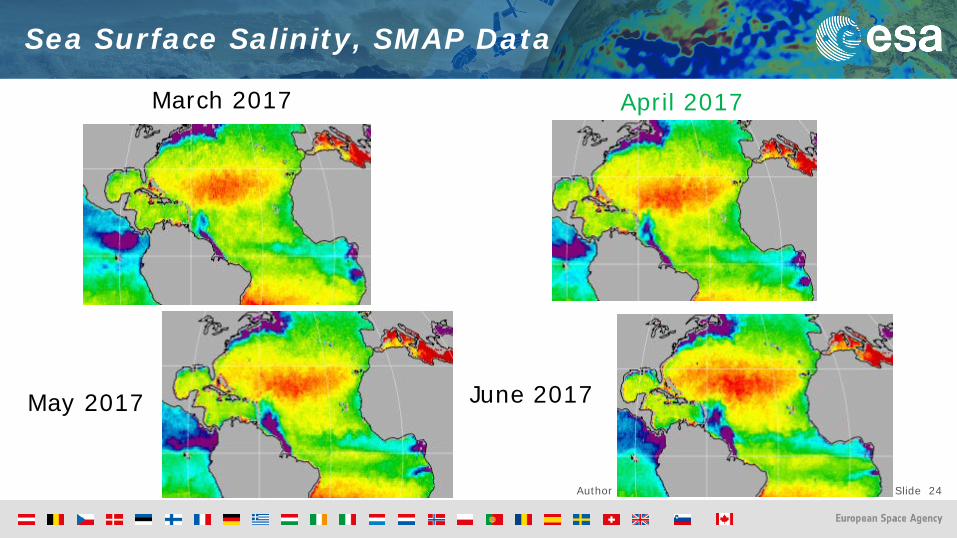
Sea Surface Salinity, SMAP Data
April 2017
May 2017 June 2017
March 2017

Author | Atlantic from Space Workshop | 23-25/01/2019 | Slide 25
Until April 1991, it was thought that TCs did not develop within the South Atlantic. Very strongvertical wind shear in the troposphere is considered a deterrent. The Intertropical ConvergenceZone drops one to two degrees south of the equator, not far enough from the equator for theCoriolis force to aid development. Water temperatures in the tropics of the southern Atlantic arecooler than those in the tropical north Atlantic. (en.wikipedia.org)
A study was subsequently performed andpublished during 2012, which concluded thatthere had been 63 subtropical cyclones in theSouthern Atlantic between 1957 and 2007.
In 2011, the Brazilian Navy HydrographicCenter started to assign names to tropical andsubtropical cyclones that develop within its areaof responsibility, to the west of 20°W, when theyhave sustained wind speeds of at least 65 km/h(40 mph).

Author | Atlantic from Space Workshop | 23-25/01/2019 | Slide 26
Global map of the born location of tropical cyclones in 2007-2011 y.y. www.planete.rssi.ru)

Author | Atlantic from Space Workshop | 23-25/01/2019 | Slide 27
Author | Atlantic from Space Workshop | 23-25/01/2019 | Slide 28
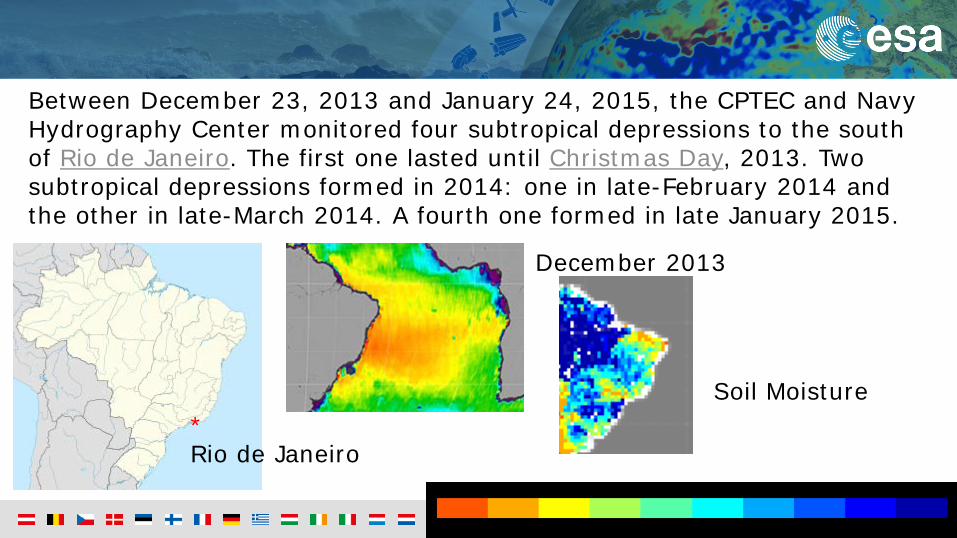
Between December 23, 2013 and January 24, 2015, the CPTEC and Navy Hydrography Center monitored four subtropical depressions to the south of Rio de Janeiro. The first one lasted until Christmas Day, 2013. Two subtropical depressions formed in 2014: one in late-February 2014 and the other in late-March 2014. A fourth one formed in late January 2015.
*Rio de Janeiro
December 2013
Soil Moisture

Author | Atlantic from Space Workshop | 23-25/01/2019 | Slide 29
Author | Atlantic from Space Workshop | 23-25/01/2019 | Slide 30

Author | Atlantic from Space Workshop | 23-25/01/2019 | Slide 31
Conclusions
1. Salinity is the valve of Ocean-Air interaction in cyclone genezis.

Author | Atlantic from Space Workshop | 23-25/01/2019 | Slide 32