the atlantic hurricane database reanalysis · the atlantic hurricane database reanalysis ... given...
TRANSCRIPT

The Atlantic Hurricane
Database Reanalysis
Chris Landsea, National Hurricane Center, Miami, USA
Supported by the NOAA Climate Program Office
October 2012
NOAA Climate Diagnostics and Prediction Workshop

HURDAT
The National Hurricane Center
maintains and updates annually the
North Atlantic Basin’s Hurricane
Database (HURDAT)
HURDAT provides from 1851 to 2011 for all
tropical storms, subtropical storms, and
hurricanes every 6 hours:
• Positions (to nearest 0.1 degree
latitude/longitude)
• Intensity (1 min surface winds to nearest
10 kt from 1851-1885, 5 kt from 1886
onward)
• Central pressure (to nearest 1 mb, when
observed)
• 34, 50, and 64 kt wind radii maximum
extent since 2004 (by quadrant, to nearest
10 nmi)

• HURDAT applications:
– Validation of official and model
predictions
– Climate trend assessment –
long term trends, seasonal
forecasts, etc.
– Building code standards and
insurance rates for coastal
communities
– Risk assessment for
emergency managers
(recurrence intervals)

Why revise HURDAT? • HURDAT contains many
systematic and random
errors
– 1938 Hurricane: Cat 3 at
landfall, but 85kts at last
offshore position
• “Missing storms”
• Lack of exact hurricane
landfall parameters
• Advances in the
understanding of hurricanes
and analysis techniques
Bias in early
major hurricanes

How is the reanalysis conducted?
• Search through all data sources to find all info/data that exist on storms
• Place all raw data into a single database
• Conduct synoptic analyses 1 to 4 times daily by plotting all observations (i.e. wind, pressure, etc.) on surface maps
• Determine track and intensity
• Document revisions (metadata file)
• After TCs for a year are reanalyzed, a search is conducted for missing storms

Observation Capabilities:
Huge Improvements over Time

Work of Jose Partagas:
Historical Reconstruction from 1851-1910

Data Sources Microfilm Historical Weather Maps
1947 Storm 8 1949 Storm 2

International
Comprehensive
Ocean-
Atmosphere
Dataset
(ICOADS)

Hurricane
Aircraft
Reconnaissance
in late 1940s and
early 1950s:
U.S. Navy’s
PB4Y2

U.S. Navy’s
PB4Y2:
•No night flights
•No central
pressure for
major hurricanes

Aircraft Reconnaissance Penetration: 1948 Storm 5

Given
aircraft fix
position
Flight track 1948 Storm 3 – August 29th Circumnavigation - typical technique for intense hurricanes
30 N
70 W
28 N
32 N
72 W 74 W 76 W

Neumann 1952

Raw Data 22-Oct ~16Z 989 SWAN IS. 175 842
22-Oct ~20Z 70 SW SWAN IS. 175 842
23-Oct ~22Z 941 EYE SHIP 215 855
24-Oct 8Z 959 70 E SHIP 240 852
Metadata The hurricane made landfall in southwest Florida with a central
pressure of 952 mb measured in Tarpon Springs at 1940-2040 UTC on the 25th.
952 mb suggests winds of 108 kt from the Gulf of Mexico pressure-wind
relationship. The new Brown et al. (2006) pressure-wind relationship suggests
103 kt from the north of 25N associations. Schwerdt et al. (1979) suggested an
Comments by/Replies to Best
Track Change Committee 1921 #8: Given the west wind of 20 kt found in the HWM, it is suggested that the
wind at 12Z on 10/20 be maintained at 35 kt. Please note that the observation
cited in the metadata for 10/23 (27.5, 85.6) appears to be either for some other
day, or the latitude is incorrect (21.5?). A major
“Best Track” Data 22590 10/20*123 801 35 0*131 804 35
0*137 806 35 0*143 809 40 0
Track Maps
Reanalysis Products

Original

Revised

1944 missing hurricane found New to HURDAT:
31895 10/11/1944 M= 7 12 SNBR= 707 NOT NAMED XING=0
31896 10/11*355 400 35 0*355 400 35 0*355 400 40 0*355 400 45 0*
31897 10/12*356 400 50 0*357 400 60 0*360 400 70 0*366 400 70 0*
31898 10/13*375 399 70 0*383 395 60 0*390 385 50 0*397 365 50 0*
31899 10/14*404 335 45 0*410 295 45 0*415 255 45 0*412 230 45 0*
31899 10/15*405 210 45 0*397 195 50 0*390 180 55 0*385 160 55 0*
31899 10/16*382 130 50 0*381 100 50 0*380 70 45 0*380 40 35 0*
31899 10/17*380 10 30 0* 0 0 0 0* 0 0 0 0* 0 0 0 0*
31960 HR
Oct 12, 1944 HWM Key observations: Date Time Pressure Wind (kt) Dir Air Temp SST Ob type Lat Lon Source Identifier
11-Oct 15Z 1005 25 NE 75 SHIP 375 415 COA 37016
11-Oct 19Z 1011 40 NNE 74 SHIP 365 405 COA
11-Oct 23Z 45 N 76 74 SHIP 365 415 COA 61132
11-Oct 23Z 1012 35 NE 74 75 SHIP 365 405 COA 14352
11-Oct 23Z 1011 35 NNE 75 76 SHIP 365 405 COA 61061
12-Oct 10Z 1000 65 S 73 73 SHIP 355 375 COA, HWM 14352
12-Oct 11Z 50 S 74 72 SHIP 355 395 COA 61132
12-Oct 11Z 998 45 SE 72 SHIP 365 395 COA
12-Oct 11Z 996 10 SE 73 74 SHIP 365 385 COA, HWM 61061
12-Oct 12Z 50 SW 74 SHIP 352 389 HWM
12-Oct 14Z 1010 70 S 74 74 SHIP 355 375 COA 14352
12-Oct 14Z 1006 45 S 75 74 SHIP 355 375 COA 61061
12-Oct 15Z 60 S 73 74 SHIP 355 395 COA 61132
12-Oct 15Z 1008 45 S 73 SHIP 365 385 COA

Tropical storms and hurricanes
Revised (avg = 12.0)
Original (avg = 9.9)
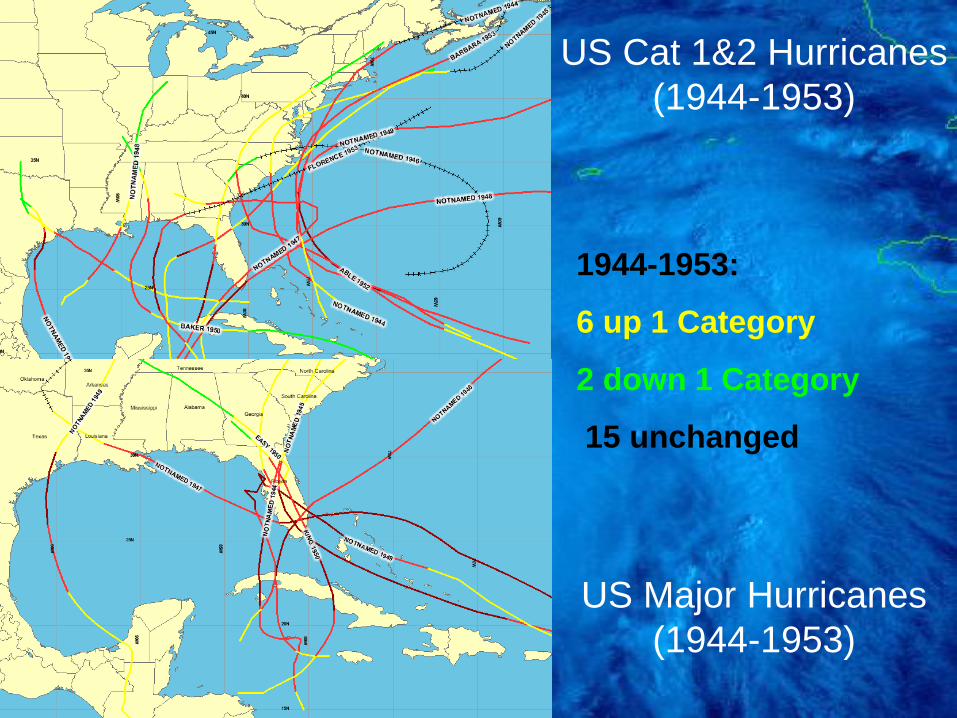
US Cat 1&2 Hurricanes
(1944-1953)
US Major Hurricanes
(1944-1953)
1944-1953:
6 up 1 Category
2 down 1 Category
15 unchanged
00


Accomplishments: 2000 – Added in 241 new TCs for 1851 to 1885
2002 – Reanalyzed 1992’s Hurricane Andrew
2003 – Reanalyzed 1886 to 1910 – Revised all existing 194 TCs,
added 23 new TCs, removing one TC
2005 – Reanalyzed 1911 to 1914 – Revised all 15 existing TCs,
added 5 new TCs.
2008 – Reanalyzed 1915 to 1920 – Revised all 34 existing TCs,
added 8 new TCs, removed one TC
2009 – Reanalyzed 1921 to 1925 – Revised all 27 existing TCs,
added in 10 new TCs, removed one TC
2010 – Reanalyzed 1926 to 1930 – All 29 TCs revised, 4 new TCs
2012 – Reanalyzed 1931 to 1935 – All 58 TCs revised, 15 new TCs,
4 removed TCs
2012 – Have submitted 1936 to 1954 reanalyses for consideration
Overall: Revised 357 existing tropical cyclones, added 316 new
systems, removed 8 tropical cyclones
http://www.aoml.noaa.gov/hrd/data_sub/re_anal.html

The Atlantic Hurricane
Database Reanalysis
Chris Landsea, National Hurricane Center, Miami, USA
Supported by the NOAA Climate Program Office
October 2012
NOAA Climate Diagnostics and Prediction Workshop

Reanalysis of NW Pacific
Typhoon Database
• Shifts in Typhoon Tracks over the western
North Pacific during the 20th century based
on the recovery of historical data
Hisayuki Kubota, Research Institute for
Global Change/ Japan Agency for Marine-
Earth Science and Technology, Yokosuka,
Japan; and J. C. L. Chan, J. Matsumoto, and
E. Ginn – American Meteorological Society
Hurricanes and Tropical Meteorology
Conference, April 2012

Revised HURDAT average position errors
Year US Landfalling (settled) Open ocean w/ AC Open ocean w/ no AC
1851-85 60 nmi N/A 120 nmi
1886-1920 60 nmi N/A 100 nmi
1944-1953 20 nmi 35 nmi 80 nmi
Late 1990s 12 nmi 15 nmi 25 nmi
Late 2000s 12 nmi 15 nmi 25 nmi
US Landfalling Open ocean w/ AC Open ocean w/ AC; Open ocean w/ no
Year (settled) central pressure no central pressure AC
1851-85 15 kt N/A N/A 25 kt
1886-1920 12 kt N/A N/A 20 kt
1944-1953 11 kt 13 kt 15 kt 20 kt
Late 1990s 10 kt 12 kt N/A 15 kt
Late 2000s 9 kt 10 kt N/A 12 kt
Revised HURDAT average intensity errors
1851-1920 numbers from Landsea et al. 2004, Landsea et al. 2008. Late 1990s and late 2000s estimates from
Landsea 2012
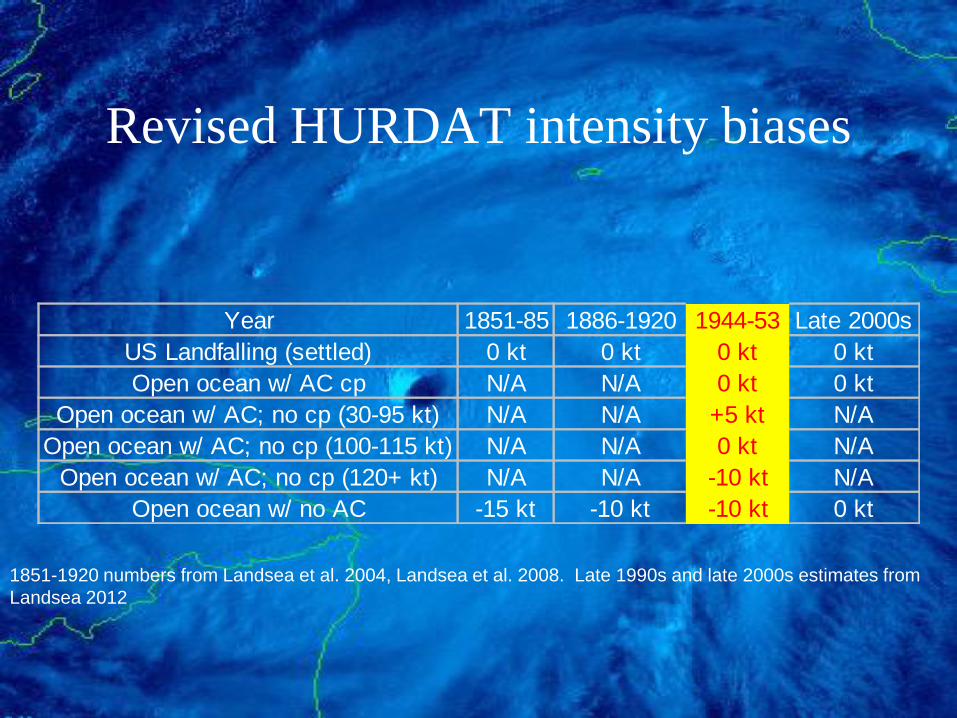
Revised HURDAT intensity biases
Year 1851-85 1886-1920 1944-53 Late 2000s
US Landfalling (settled) 0 kt 0 kt 0 kt 0 kt
Open ocean w/ AC cp N/A N/A 0 kt 0 kt
Open ocean w/ AC; no cp (30-95 kt) N/A N/A +5 kt N/A
Open ocean w/ AC; no cp (100-115 kt) N/A N/A 0 kt N/A
Open ocean w/ AC; no cp (120+ kt) N/A N/A -10 kt N/A
Open ocean w/ no AC -15 kt -10 kt -10 kt 0 kt
1851-1920 numbers from Landsea et al. 2004, Landsea et al. 2008. Late 1990s and late 2000s estimates from
Landsea 2012

Major hurricanes
Original (avg = 3.6)
Revised (avg = 2.6)

More data Sources date time pres wind (kt) dir T S type/place lat lon source ship #
18-Oct 13Z 1009 35 E 81 SHIP 265 805 COA 97082
18-Oct 14Z 999 35 NNE 79 80 SHIP 255 855 COA, HWM 89009
18-Oct 17Z 1009 35 E 85 82 SHIP 265 805 COA 97082
18-Oct 18Z 995 35 NNE 77 80 SHIP 255 855 COA 89009
19-Oct 1Z 1005 35 E 82 82 SHIP 265 805 COA 97082
19-Oct 2Z 986 77 80 SHIP 265 855 COA 89009
19-Oct 13Z 998 60 SE 81 82 SHIP 285 805 COA 97082
19-Oct 14Z 998 50 NW 79 80 SHIP 265 855 COA 89009
19-Oct 17Z 998 60 SE 82 82 SHIP 285 805 COA 97082
COADS Ship Observations
MWR Tracks of Lows Monthly Weather Review (MWR) post-
season summary articles
Navy, Army-Air Force, and Air Weather
Service post-season hurricane
summaries: These focus on aircraft
reconnaissance
Original Monthly Records and
Climatological Data Summaries of U.S.
coastal station observations
Several publications on case studies of
Atlantic hurricanes
Other useful data sources

Track analysis methodology
(with abundant recon fixes)
• All center fixes compiled
• Fixes plotted and interpolated to 6-hourly positions
• Ship and station data plotted against aircraft data
• Final revised positions are a consensus of all data
• When lack of data, significant changes are not implemented

• Ship, coastal stations, aircraft reconnaissance data
• Brown et al. (2006) pressure-wind relationships
• Vickery et al. (2000) climatological RMW values
• Kaplan and DeMaria (1995) inland decay model
• Schloemer (1954) equation
– Calculates central pressure given
a peripheral pressure measurement
• Ho et al. (1987) inland pressure decay model
– Estimates landfall central pressure based on a post-landfall central pressure measurement
• Neumann model from Schwerdt et al. (1979)
– Calculates extent of hurricane force winds
• Franklin et al. (2003) flight-level to sfc wind
Intensity analysis tools