the association between interleukin-10 gene promoter
TRANSCRIPT

American Journal of Clinical and Experimental Medicine 2016; 4(3): 81-87 http://www.sciencepublishinggroup.com/j/ajcem doi: 10.11648/j.ajcem.20160403.18 ISSN: 2330-8125 (Print); ISSN: 2330-8133 (Online)
The Association Between Interleukin-10 Gene Promoter Polymorphism and Insulin Resistance in Type 2 Diabetes Mellitus
Sally Said Donia1, *
, Eman Masoud Abd El Gayed2, Sally Mohamed El-Hefnawy
2, Ahmed Ragheb
3 1Medical Phsiyology Department, Faculty of Medicine - Menoufia University, Sheben AL-Kom, Egypt 2Medical Biochemistry Department, Faculty of medicine - Menoufia University, Sheben AL-Kom, Egypt 3Internal Medicine Department, Faculty of Medicine-Menoufia University, Sheben AL-Kom, Egypt
Email address:
[email protected] (A. Ragheb), [email protected] (E. M. A. E. Gayed), [email protected] (S. M. El-Hefnawy), [email protected] (S. S. Donia) *Corresponding author
To cite this article: Sally Said Donia, Eman Masoud Abd El Gayed, Sally Mohamed El-Hefnawy, Ahmed Ragheb. The Association Between Interleukin-10 Gene Promoter Polymorphism and Insulin Resistance in Type 2 Diabetes Mellitus. American Journal of Clinical and Experimental Medicine. Vol. 4, No. 3, 2016, pp. 81-87. doi: 10.11648/j.ajcem.20160403.18
Received: April 27, 2016; Accepted: May 16, 2016; Published: May 28, 2016
Abstract: Insulin resistance is a major characteristic of type 2 diabetes (T2DM). Inflammation plays an important role in increased insulin resistance, but the underlying mechanism remains unclear. Interleukin-10 (IL-10) is an anti-inflammatory cytokine with lower circulating levels in T2DM. We aimed to examine the association between IL-10 and insulin resistance, and to evaluate IL-10 gene promoter single nucleotide polymorphism (SNP) at position -592 C/A and serum IL-10 level as risk factors for insulin resistance and T2DM. This study was carried out on 200 subjects divided into 2 groups: 110 patients with T2DM (group I), and 90 healthy subjects served as controls (group II). All participants were investigated for; fasting and 2 hour post prandial blood glucose, serum lipids, glycated hemoglobin (HbA1c), serum IL-10 and fasting serum insulin. HOMA-IR was used for assessment of insulin resistance and β cell activity. Genotyping of -592 C/A (rs1800872) SNP of IL-10 gene promoter and genotype frequencies were analyzed using the polymerase chain reaction–restriction fragment length polymorphism technique (PCR-RFLP). The results of the present study showed significant statistical decrease in serum IL-10 levels in group I compared to group II. A significant negative correlation was found between serum IL-10 and HOMA-IR. Significant differences were observed for -592 C/A genotype distributions between both groups with increased frequency of the AA genotype in diabetic patients and increased frequency of CC genotype in controls. AA genotypes of -592 C/A was found to be a genetic risk factor for T2DM. Our results show that IL-10 has a positive association with insulin sensitivity, and
SNP-592 C/A of IL-10 gene promoter and its serum level can contribute to susceptibility to insulin resistance and T2DM.
Keywords: Type 2 Diabetes Mellitus, IL-10, Gene Polymorphism
1. Introduction
Diabetes mellitus is a major public health problem and the prevalence of T2DM is worldwide [1]. The frequency of diabetes mellitus is increasing and it is expected that it will affect 300 million people in 2025 [2]. It has been suggested that diabetes is an immune dependent disease in which the pattern of cytokine expression is changed [3]. Insulin resistance [IR] is a state in which a given concentration of
insulin produces less than expected biological effect [4]. Both insulin resistance and decreased insulin secretion are major features of the pathophysiology of type 2 diabetes [5, 6, 7].
Insulin resistance most often precedes the onset of type 2 diabetes by many years, It is clear that insulin resistance has a genetic component and acquired factors, such as obesity and sedentary lifestyle [5]. Initially, insulin resistance is compensated by hyperinsulinemia, through which normal glucose tolerance is preserved. At least 25% of non-diabetic individuals’ exhibit insulin resistance that is falls in the same

American Journal of Clinical and Experimental Medicine 2016; 4(3): 81-87 82
range of that seen in patients with type 2 diabetes. Deterioration into impaired glucose tolerance occurs when either the insulin resistance increases or the compensatory insulin secretory responses decrease, or when both occur. β-cells are responsible for sensing and secreting the appropriate amount of insulin in response to a glucose stimulus [8], its dysfunction is the result of prolonged exposure to high glucose, elevated FFA levels, or a combination of the two. There is considerable evidence that chronic hyperglycemia in patients with type 2 diabetes contributes to impaired β-cell function [9].
Several studies have reported that multiple cytokines may be involved in the regulation of the immune response but little is known about the associations between insulin action and anti-inflammatory cytokines, which may play a role in the pathogenesis of T2DM [10, 11]. Interleukins are a diverse constellation of small cell signaling protein molecules, or cytokines, that regulate the function of the immune system in humans [12, 13]. Interleukins are produced predominantly by T cells, monocytes, macrophages and endothelial cells [14]. Their functions include facilitating communications among immune cells, controlling genes, regulating transcription factors, and governing inflammation, differentiation, proliferation and the secretion of antibodies [15]. Some studies provided evidence that IL-10 might exert some beneficial metabolic effects. So far, no data are available regarding an association between circulating IL-10 and insulin action in humans [16, 17].
Genetic polymorphisms of interleukins play a critical role in their activity, and could alter cytokine function and dysregulate their expression [18]. Therefore, individual genetic differences may be closely related to the development of T2DM. IL-10 is a multifunctional regulatory cytokine involved in the inflammatory response that functions as a general inhibitor of the proliferative and cytokine response of both type 1 and type 2 helper T cells [19]. The gene encoding IL-10 is located on chromosome 1 [1q31–1q32] [20, 21]. Some previous studies reported that these IL-10 gene promoter polymorphisms were associated with the risk of T2DM [22, 23].
Three functional promoter single nucleotide polymorphisms [SNPs] in the IL-10 locus at –1082G/A (rs1800896), – 819 T/C (rs1800871) and –592 A/C (rs1800872) from the transcriptional start site have been confirmed, and there are indications that they influence IL-10 gene transcription [24]. In the current study we aimed to evaluate IL-10 gene promoter single nucleotide polymorphism (SNP) at position -592 C/A as well as serum IL-10 level as risk factors for insulin resistance and T2DM.
2. Methods
This case–control study included 200 subjects: 110 patients with T2DM [58 males and 52 females]. The diagnosis was based on the American Diabetes Association (ADA) criteria [25] and 90 unrelated healthy, age- and sex-matched subjects as a control group [51 males and 39
females]. Cases were selected from the Internal Medicine Outpatient Clinic, Menoufia University Hospital, Egypt during the period between August 2014 and December 2014.
All studied subjects were subjected to complete history taking, physical examination including anthropometric measurements. Weight was measured in kilograms with light clothes and height in meters without shoes. Waist circumference in centimeters was determined at the level of the umbilicus using a steel tape measure [26]. Estimation of body mass index [BMI] was done by dividing body weight in kilograms by (height in meter2) [27].
Laboratory investigations included estimation of lipid profile [serum total cholesterol (TC), triglycerides (TG), high density lipoprotein cholesterol (HDLc) and low density lipoprotein cholesterol (LDLc)]. Determination of fasting and 2 hours post prandial blood glucose levels, glycated hemoglobin (HbA1c), fasting serum insulin, serum interleukin-10 was done by ELISA. Insulin resistance was assessed by homeostatic model assessment of insulin resistance (HOMA-IR) [28] and genotyping of -592 C/A rs1800872) SNP of IL-10 gene promoter was analyzed using the polymerase chain reaction–restriction fragment length polymorphism technique (PCR-RFLP).
Prior to the collection of samples, written consent forms (approved by the Committee of Human Rights in Research at Menoufia University) were obtained from all studied cases and control subjects.
- After 12 hours overnight fasting, 10 ml of venous blood were withdrawn from every subject by sterile vein-puncture and divided into three tubes.
1- 4 ml of blood were transferred into two EDTA tubes: one of them was used for quantitative colorimetric determination of glycated hemoglobin as percent of total hemoglobin using kits supplied by Teco diagnostics, USA [29], the other EDTA tube was preserved in -20 for DNA extraction and further molecular analysis.
2- One ml of blood was transferred into sodium flouride tube and another sample of blood was collected after 2 hours for enzymatic colorimetric determination of blood glucose. Blood glucose was determined by enzymatic colorimetric test, using Spinreact kit, SPAIN [30].
3- 5 ml of blood were was transferred into a plain tube and allowed to clot at 37°C, centrifuged for 10 minutes at 4000 r.p.m. The clear supernatant serum was separated from the clot and kept frozen at -80°C until determination of serum TC [31], HDL [32], LDL [33],TG [34], serum level of IL-10 [35] and fasting serum insulin level [36].
Serum TC and TG were determined by enzymatic colorimetric test, using Spinreact kit, SPAIN. Serum HDL-c was determined by colorimetric method, using Human kit, GERMANY. LDL-c was calculated from TC concentration, HDL-c, TG according to [33].
Serum insulin was determined by enzyme linked immunosorbent assay method, using DRG® Insulin ELISA kit, GERMANY [36]. Assessment of insulin resistance was done by homeostatic model assessment (HOMA) according to [28]. HOMA- IR = fasting glucose (mg/dl) x fasting insulin (µIU/mL)
83 Sally Said Donia et al.: The Association Between Interleukin-10 Gene Promoter Polymorphism and Insulin Resistance in Type 2 Diabetes Mellitus
/405. Serum IL-10 was determined by enzyme linked immunosorbent assay method, using AviBion commercial ELISA kits (Orgenium Laboratories Business Unit, Vantaa, Finland) [35].
2.1. DNA Extraction and Amplification
DNA was extracted from whole blood using Thermo Scientific Gene JET Genomic DNA purification kit, Lithuania. DNA was eluted stored at -20°C for further PCR procedure.
2.2. Determination of IL-10 Gene Polymorphism
The IL-10 -592C/A genotype was determined by using a polymerase chain reaction-restriction fragment length polymorphism (PCR-RFLP) method. PCR for the IL-10 gene was carried out to a total volume of 25 µl, containing 10 µl genomic DNA; 1 µl of each primer; 12.5 ul of Master Mix using Thermo Scientific Dream Taq Green PCR Master Mix, USA and 0.5 ul distal water [37].
IL-10 gene was analyzed using the following designed primers Midland, Texas:
� Forward: 5'- GGTGAGCACTACCTGACTAGC -3' � Reverse: 5'- CCTAGGTCACAGTGACGTGG -3'. PCR amplification for IL-10 gene was performed
separately in using Applied Bio systems 2720 thermal cycler (Singapore).
* PCR condition consisted of: one cycle of amplification at 94°C for 5 minutes followed by 35 cycles at 94°C for 30 sec; 64°C for 45 sec; 72°C for 1 minute; and one final cycle of extension at 72°C for 10 minutes.
The amplification products were separated by electrophoresis through 3% agarose gel stained with and visualized ethidium bromide with positive band at 412 bp.
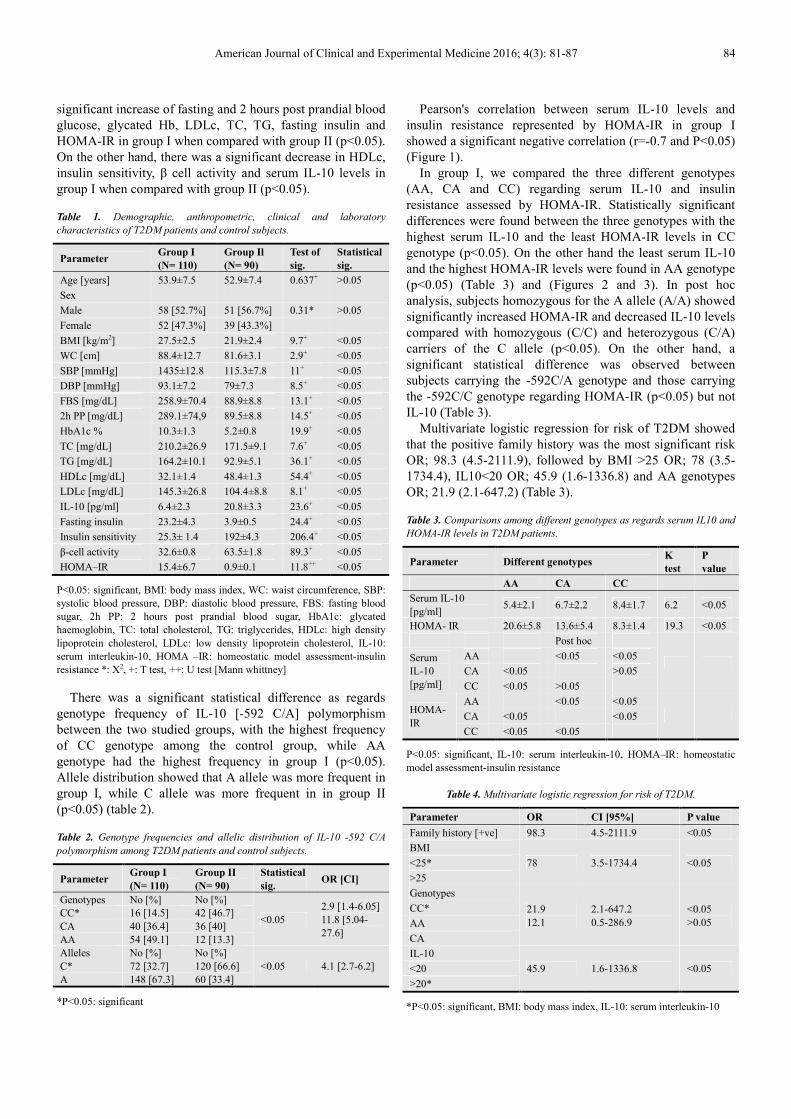
Figure 1. Agarose gel electrophoresis of amplification product of IL-10 gene
at 412 bp. Lane 1 shows 50bp ladder, Lane [2, 3, 4, 5, 6, 7, 8, 9,10 and 11]
show the amplification product of IL-10 gene at 412 bp.
Lane 1 shows 50bp ladder Lane [2, 3, 4, 5, 6, 7, 8, 9, 10 and 11] show the amplification product of IL-
10 gene at 412 bp. * The IL-10 – 592 C/A polymorphism using the restriction fragment length polymorphism (the RFLP) technique: 10 ul of the PCR products for the IL-10 were mixed with 1 ul [1 unit] of FastDigest® Rsa1 restriction enzyme (provided by Fermentas) with 6.5 µl nuclease-free water and 2.5 of 10X FastDigest® Buffer.
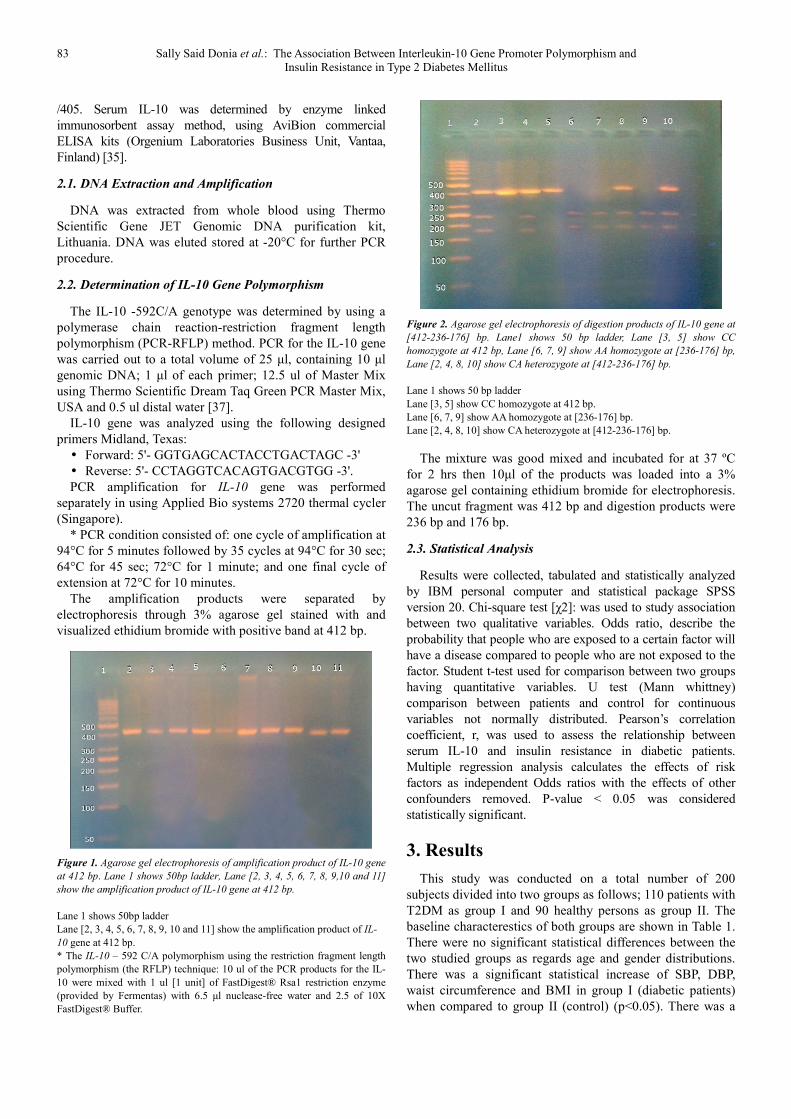
Figure 2. Agarose gel electrophoresis of digestion products of IL-10 gene at
[412-236-176] bp. Lane1 shows 50 bp ladder, Lane [3, 5] show CC
homozygote at 412 bp, Lane [6, 7, 9] show AA homozygote at [236-176] bp,
Lane [2, 4, 8, 10] show CA heterozygote at [412-236-176] bp.
Lane 1 shows 50 bp ladder Lane [3, 5] show CC homozygote at 412 bp. Lane [6, 7, 9] show AA homozygote at [236-176] bp. Lane [2, 4, 8, 10] show CA heterozygote at [412-236-176] bp.
The mixture was good mixed and incubated for at 37 ºC for 2 hrs then 10µl of the products was loaded into a 3% agarose gel containing ethidium bromide for electrophoresis. The uncut fragment was 412 bp and digestion products were 236 bp and 176 bp.
2.3. Statistical Analysis
Results were collected, tabulated and statistically analyzed by IBM personal computer and statistical package SPSS version 20. Chi-square test [χ2]: was used to study association between two qualitative variables. Odds ratio, describe the probability that people who are exposed to a certain factor will have a disease compared to people who are not exposed to the factor. Student t-test used for comparison between two groups having quantitative variables. U test (Mann whittney) comparison between patients and control for continuous variables not normally distributed. Pearson’s correlation coefficient, r, was used to assess the relationship between serum IL-10 and insulin resistance in diabetic patients. Multiple regression analysis calculates the effects of risk factors as independent Odds ratios with the effects of other confounders removed. P-value < 0.05 was considered statistically significant.
3. Results
This study was conducted on a total number of 200 subjects divided into two groups as follows; 110 patients with T2DM as group I and 90 healthy persons as group II. The baseline characterestics of both groups are shown in Table 1. There were no significant statistical differences between the two studied groups as regards age and gender distributions. There was a significant statistical increase of SBP, DBP, waist circumference and BMI in group I (diabetic patients) when compared to group II (control) (p<0.05). There was a
American Journal of Clinical and Experimental Medicine 2016; 4(3): 81-87 84
significant increase of fasting and 2 hours post prandial blood glucose, glycated Hb, LDLc, TC, TG, fasting insulin and HOMA-IR in group I when compared with group II (p<0.05). On the other hand, there was a significant decrease in HDLc, insulin sensitivity, β cell activity and serum IL-10 levels in group I when compared with group II (p<0.05).
Table 1. Demographic, anthropometric, clinical and laboratory
characteristics of T2DM patients and control subjects.
Parameter Group I
(N= 110)
Group Il
(N= 90)
Test of
sig.
Statistical
sig.
Age [years] 53.9±7.5 52.9±7.4 0.637+ >0.05
Sex
Male 58 [52.7%] 51 [56.7%] 0.31* >0.05
Female 52 [47.3%] 39 [43.3%]
BMI [kg/m2] 27.5±2.5 21.9±2.4 9.7+ <0.05
WC [cm] 88.4±12.7 81.6±3.1 2.9+ <0.05
SBP [mmHg] 1435±12.8 115.3±7.8 11+ <0.05
DBP [mmHg] 93.1±7.2 79±7.3 8.5+ <0.05
FBS [mg/dL] 258.9±70.4 88.9±8.8 13.1+ <0.05
2h PP [mg/dL] 289.1±74,9 89.5±8.8 14.5+ <0.05
HbA1c % 10.3±1.3 5.2±0.8 19.9+ <0.05
TC [mg/dL] 210.2±26.9 171.5±9.1 7.6+ <0.05
TG [mg/dL] 164.2±10.1 92.9±5.1 36.1+ <0.05
HDLc [mg/dL] 32.1±1.4 48.4±1.3 54.4+ <0.05
LDLc [mg/dL] 145.3±26.8 104.4±8.8 8.1+ <0.05
IL-10 [pg/ml] 6.4±2.3 20.8±3.3 23.6+ <0.05
Fasting insulin 23.2±4.3 3.9±0.5 24.4+ <0.05
Insulin sensitivity 25.3± 1.4 192±4.3 206.4+ <0.05
β-cell activity 32.6±0.8 63.5±1.8 89.3+ <0.05
HOMA–IR 15.4±6.7 0.9±0.1 11.8++ <0.05
P<0.05: significant, BMI: body mass index, WC: waist circumference, SBP: systolic blood pressure, DBP: diastolic blood pressure, FBS: fasting blood sugar, 2h PP: 2 hours post prandial blood sugar, HbA1c: glycated haemoglobin, TC: total cholesterol, TG: triglycerides, HDLc: high density lipoprotein cholesterol, LDLc: low density lipoprotein cholesterol, IL-10: serum interleukin-10, HOMA –IR: homeostatic model assessment-insulin resistance *: X2, +: T test, ++: U test [Mann whittney]
There was a significant statistical difference as regards genotype frequency of IL-10 [-592 C/A] polymorphism between the two studied groups, with the highest frequency of CC genotype among the control group, while AA genotype had the highest frequency in group I (p<0.05). Allele distribution showed that A allele was more frequent in group I, while C allele was more frequent in in group II (p<0.05) (table 2).
Table 2. Genotype frequencies and allelic distribution of IL-10 -592 C/A
polymorphism among T2DM patients and control subjects.
Parameter Group I
(N= 110)
Group II
(N= 90)
Statistical
sig. OR [CI]
Genotypes No [%] No [%]
<0.05 2.9 [1.4-6.05] 11.8 [5.04-27.6]
CC* 16 [14.5] 42 [46.7] CA 40 [36.4] 36 [40] AA 54 [49.1] 12 [13.3] Alleles No [%] No [%]
<0.05 4.1 [2.7-6.2] C* 72 [32.7] 120 [66.6] A 148 [67.3] 60 [33.4]
*P<0.05: significant
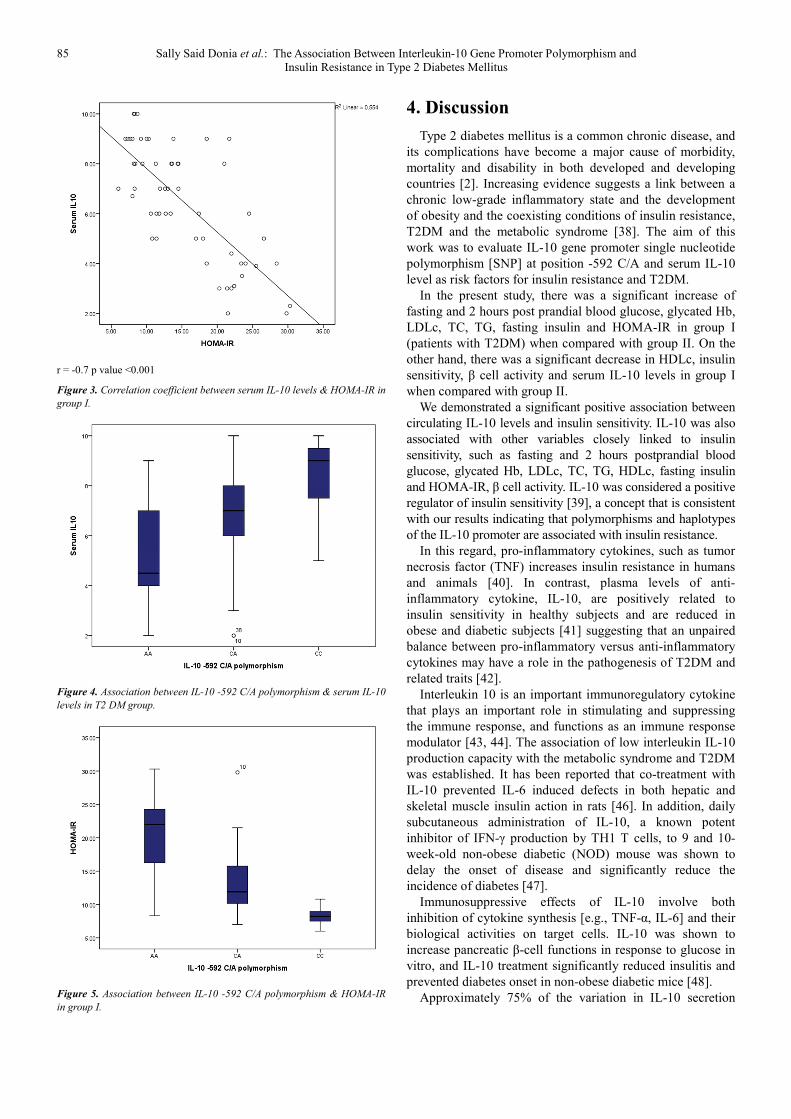
Pearson's correlation between serum IL-10 levels and insulin resistance represented by HOMA-IR in group I showed a significant negative correlation (r=-0.7 and P<0.05) (Figure 1).
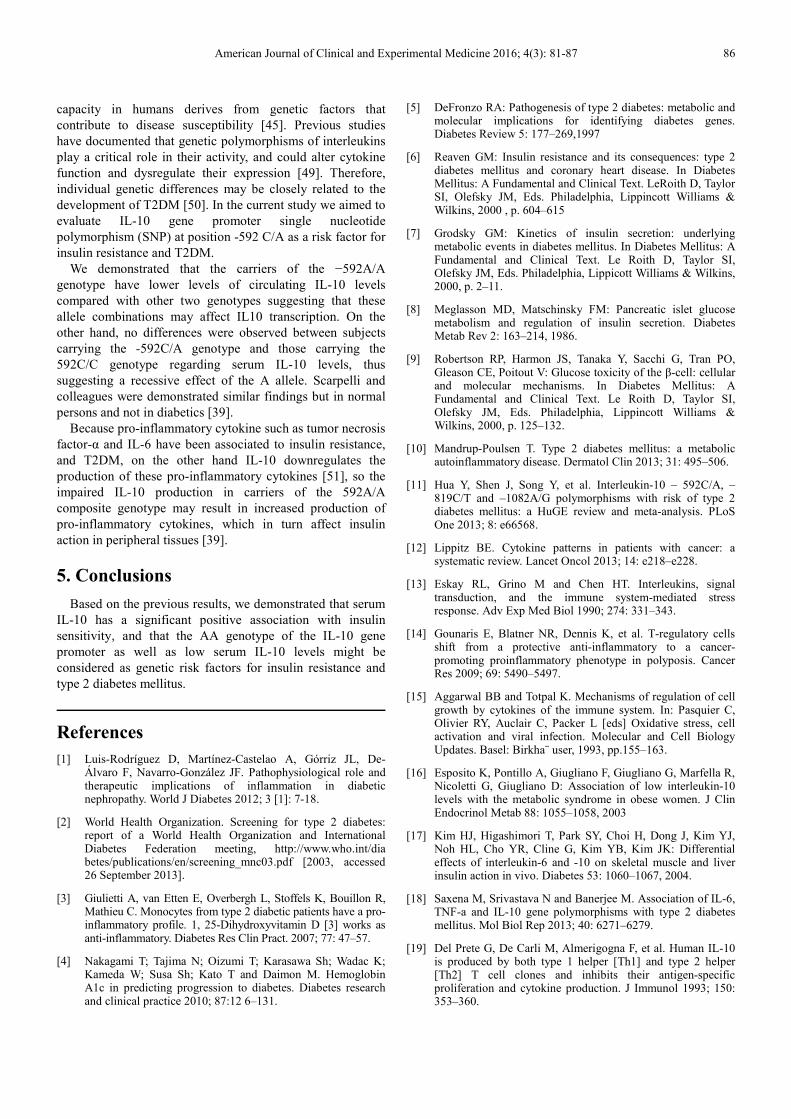
In group I, we compared the three different genotypes (AA, CA and CC) regarding serum IL-10 and insulin resistance assessed by HOMA-IR. Statistically significant differences were found between the three genotypes with the highest serum IL-10 and the least HOMA-IR levels in CC genotype (p<0.05). On the other hand the least serum IL-10 and the highest HOMA-IR levels were found in AA genotype (p<0.05) (Table 3) and (Figures 2 and 3). In post hoc analysis, subjects homozygous for the A allele (A/A) showed significantly increased HOMA-IR and decreased IL-10 levels compared with homozygous (C/C) and heterozygous (C/A) carriers of the C allele (p<0.05). On the other hand, a significant statistical difference was observed between subjects carrying the -592C/A genotype and those carrying the -592C/C genotype regarding HOMA-IR (p<0.05) but not IL-10 (Table 3).
Multivariate logistic regression for risk of T2DM showed that the positive family history was the most significant risk OR; 98.3 (4.5-2111.9), followed by BMI >25 OR; 78 (3.5-1734.4), IL10<20 OR; 45.9 (1.6-1336.8) and AA genotypes OR; 21.9 (2.1-647.2) (Table 3).
Table 3. Comparisons among different genotypes as regards serum IL10 and
HOMA-IR levels in T2DM patients.
Parameter Different genotypes K
test
P
value
AA CA CC
Serum IL-10 [pg/ml]
5.4±2.1 6.7±2.2 8.4±1.7 6.2 <0.05
HOMA- IR 20.6±5.8 13.6±5.4 8.3±1.4 19.3 <0.05
Post hoc
Serum IL-10 [pg/ml]
AA <0.05 <0.05
CA <0.05 >0.05
CC <0.05 >0.05
HOMA- IR
AA <0.05 <0.05
CA <0.05 <0.05
CC <0.05 <0.05
P<0.05: significant, IL-10: serum interleukin-10, HOMA–IR: homeostatic model assessment-insulin resistance
Table 4. Multivariate logistic regression for risk of T2DM.
Parameter OR CI [95%] P value
Family history [+ve] 98.3 4.5-2111.9 <0.05
BMI
78 3.5-1734.4 <0.05 <25*
>25
Genotypes 21.9 12.1
2.1-647.2 0.5-286.9
<0.05 >0.05
CC*
AA
CA
IL-10
45.9 1.6-1336.8 <0.05 <20
>20*
*P<0.05: significant, BMI: body mass index, IL-10: serum interleukin-10
85 Sally Said Donia et al.: The Association Between Interleukin-10 Gene Promoter Polymorphism and Insulin Resistance in Type 2 Diabetes Mellitus
r = -0.7 p value <0.001
Figure 3. Correlation coefficient between serum IL-10 levels & HOMA-IR in
group I.
Figure 4. Association between IL-10 -592 C/A polymorphism & serum IL-10
levels in T2 DM group.
Figure 5. Association between IL-10 -592 C/A polymorphism & HOMA-IR
in group I.
4. Discussion
Type 2 diabetes mellitus is a common chronic disease, and its complications have become a major cause of morbidity, mortality and disability in both developed and developing countries [2]. Increasing evidence suggests a link between a chronic low-grade inflammatory state and the development of obesity and the coexisting conditions of insulin resistance, T2DM and the metabolic syndrome [38]. The aim of this work was to evaluate IL-10 gene promoter single nucleotide polymorphism [SNP] at position -592 C/A and serum IL-10 level as risk factors for insulin resistance and T2DM.
In the present study, there was a significant increase of fasting and 2 hours post prandial blood glucose, glycated Hb, LDLc, TC, TG, fasting insulin and HOMA-IR in group I (patients with T2DM) when compared with group II. On the other hand, there was a significant decrease in HDLc, insulin sensitivity, β cell activity and serum IL-10 levels in group I when compared with group II.
We demonstrated a significant positive association between circulating IL-10 levels and insulin sensitivity. IL-10 was also associated with other variables closely linked to insulin sensitivity, such as fasting and 2 hours postprandial blood glucose, glycated Hb, LDLc, TC, TG, HDLc, fasting insulin and HOMA-IR, β cell activity. IL-10 was considered a positive regulator of insulin sensitivity [39], a concept that is consistent with our results indicating that polymorphisms and haplotypes of the IL-10 promoter are associated with insulin resistance.
In this regard, pro-inflammatory cytokines, such as tumor necrosis factor (TNF) increases insulin resistance in humans and animals [40]. In contrast, plasma levels of anti-inflammatory cytokine, IL-10, are positively related to insulin sensitivity in healthy subjects and are reduced in obese and diabetic subjects [41] suggesting that an unpaired balance between pro-inflammatory versus anti-inflammatory cytokines may have a role in the pathogenesis of T2DM and related traits [42].
Interleukin 10 is an important immunoregulatory cytokine that plays an important role in stimulating and suppressing the immune response, and functions as an immune response modulator [43, 44]. The association of low interleukin IL-10 production capacity with the metabolic syndrome and T2DM was established. It has been reported that co-treatment with IL-10 prevented IL-6 induced defects in both hepatic and skeletal muscle insulin action in rats [46]. In addition, daily subcutaneous administration of IL-10, a known potent inhibitor of IFN-γ production by TH1 T cells, to 9 and 10-week-old non-obese diabetic (NOD) mouse was shown to delay the onset of disease and significantly reduce the incidence of diabetes [47].
Immunosuppressive effects of IL-10 involve both inhibition of cytokine synthesis [e.g., TNF-α, IL-6] and their biological activities on target cells. IL-10 was shown to increase pancreatic β-cell functions in response to glucose in vitro, and IL-10 treatment significantly reduced insulitis and prevented diabetes onset in non-obese diabetic mice [48].
Approximately 75% of the variation in IL-10 secretion
American Journal of Clinical and Experimental Medicine 2016; 4(3): 81-87 86
capacity in humans derives from genetic factors that contribute to disease susceptibility [45]. Previous studies have documented that genetic polymorphisms of interleukins play a critical role in their activity, and could alter cytokine function and dysregulate their expression [49]. Therefore, individual genetic differences may be closely related to the development of T2DM [50]. In the current study we aimed to evaluate IL-10 gene promoter single nucleotide polymorphism (SNP) at position -592 C/A as a risk factor for insulin resistance and T2DM.
We demonstrated that the carriers of the −592A/A genotype have lower levels of circulating IL-10 levels compared with other two genotypes suggesting that these allele combinations may affect IL10 transcription. On the other hand, no differences were observed between subjects carrying the -592C/A genotype and those carrying the 592C/C genotype regarding serum IL-10 levels, thus suggesting a recessive effect of the A allele. Scarpelli and colleagues were demonstrated similar findings but in normal persons and not in diabetics [39].
Because pro-inflammatory cytokine such as tumor necrosis factor-α and IL-6 have been associated to insulin resistance, and T2DM, on the other hand IL-10 downregulates the production of these pro-inflammatory cytokines [51], so the impaired IL-10 production in carriers of the 592A/A composite genotype may result in increased production of pro-inflammatory cytokines, which in turn affect insulin action in peripheral tissues [39].
5. Conclusions
Based on the previous results, we demonstrated that serum IL-10 has a significant positive association with insulin sensitivity, and that the AA genotype of the IL-10 gene promoter as well as low serum IL-10 levels might be considered as genetic risk factors for insulin resistance and type 2 diabetes mellitus.
References
[1] Luis-Rodríguez D, Martínez-Castelao A, Górriz JL, De-Álvaro F, Navarro-González JF. Pathophysiological role and therapeutic implications of inflammation in diabetic nephropathy. World J Diabetes 2012; 3 [1]: 7-18.
[2] World Health Organization. Screening for type 2 diabetes: report of a World Health Organization and International Diabetes Federation meeting, http://www.who.int/dia betes/publications/en/screening_mnc03.pdf [2003, accessed 26 September 2013].
[3] Giulietti A, van Etten E, Overbergh L, Stoffels K, Bouillon R, Mathieu C. Monocytes from type 2 diabetic patients have a pro-inflammatory profile. 1, 25-Dihydroxyvitamin D [3] works as anti-inflammatory. Diabetes Res Clin Pract. 2007; 77: 47–57.
[4] Nakagami T; Tajima N; Oizumi T; Karasawa Sh; Wadac K; Kameda W; Susa Sh; Kato T and Daimon M. Hemoglobin A1c in predicting progression to diabetes. Diabetes research and clinical practice 2010; 87:12 6–131.
[5] DeFronzo RA: Pathogenesis of type 2 diabetes: metabolic and molecular implications for identifying diabetes genes. Diabetes Review 5: 177–269,1997
[6] Reaven GM: Insulin resistance and its consequences: type 2 diabetes mellitus and coronary heart disease. In Diabetes Mellitus: A Fundamental and Clinical Text. LeRoith D, Taylor SI, Olefsky JM, Eds. Philadelphia, Lippincott Williams & Wilkins, 2000 , p. 604–615
[7] Grodsky GM: Kinetics of insulin secretion: underlying metabolic events in diabetes mellitus. In Diabetes Mellitus: A Fundamental and Clinical Text. Le Roith D, Taylor SI, Olefsky JM, Eds. Philadelphia, Lippicott Williams & Wilkins, 2000, p. 2–11.
[8] Meglasson MD, Matschinsky FM: Pancreatic islet glucose metabolism and regulation of insulin secretion. Diabetes Metab Rev 2: 163–214, 1986.
[9] Robertson RP, Harmon JS, Tanaka Y, Sacchi G, Tran PO, Gleason CE, Poitout V: Glucose toxicity of the β-cell: cellular and molecular mechanisms. In Diabetes Mellitus: A Fundamental and Clinical Text. Le Roith D, Taylor SI, Olefsky JM, Eds. Philadelphia, Lippincott Williams & Wilkins, 2000, p. 125–132.
[10] Mandrup-Poulsen T. Type 2 diabetes mellitus: a metabolic autoinflammatory disease. Dermatol Clin 2013; 31: 495–506.
[11] Hua Y, Shen J, Song Y, et al. Interleukin-10 – 592C/A, –819C/T and –1082A/G polymorphisms with risk of type 2 diabetes mellitus: a HuGE review and meta-analysis. PLoS One 2013; 8: e66568.
[12] Lippitz BE. Cytokine patterns in patients with cancer: a systematic review. Lancet Oncol 2013; 14: e218–e228.
[13] Eskay RL, Grino M and Chen HT. Interleukins, signal transduction, and the immune system-mediated stress response. Adv Exp Med Biol 1990; 274: 331–343.
[14] Gounaris E, Blatner NR, Dennis K, et al. T-regulatory cells shift from a protective anti-inflammatory to a cancer-promoting proinflammatory phenotype in polyposis. Cancer Res 2009; 69: 5490–5497.
[15] Aggarwal BB and Totpal K. Mechanisms of regulation of cell growth by cytokines of the immune system. In: Pasquier C, Olivier RY, Auclair C, Packer L [eds] Oxidative stress, cell activation and viral infection. Molecular and Cell Biology Updates. Basel: Birkha¨ user, 1993, pp.155–163.
[16] Esposito K, Pontillo A, Giugliano F, Giugliano G, Marfella R, Nicoletti G, Giugliano D: Association of low interleukin-10 levels with the metabolic syndrome in obese women. J Clin Endocrinol Metab 88: 1055–1058, 2003
[17] Kim HJ, Higashimori T, Park SY, Choi H, Dong J, Kim YJ, Noh HL, Cho YR, Cline G, Kim YB, Kim JK: Differential effects of interleukin-6 and -10 on skeletal muscle and liver insulin action in vivo. Diabetes 53: 1060–1067, 2004.
[18] Saxena M, Srivastava N and Banerjee M. Association of IL-6, TNF-a and IL-10 gene polymorphisms with type 2 diabetes mellitus. Mol Biol Rep 2013; 40: 6271–6279.
[19] Del Prete G, De Carli M, Almerigogna F, et al. Human IL-10 is produced by both type 1 helper [Th1] and type 2 helper [Th2] T cell clones and inhibits their antigen-specific proliferation and cytokine production. J Immunol 1993; 150: 353–360.
87 Sally Said Donia et al.: The Association Between Interleukin-10 Gene Promoter Polymorphism and Insulin Resistance in Type 2 Diabetes Mellitus
[20] Kim JM, Brannan CI, Copeland NG, et al. Structure of the mouse IL-10 gene and chromosomal localization of the mouse and human genes. J Immunol 1992; 148: 3618–3623.
[21] Eskdale J, Kube D, Tesch H, et al. Mapping of the human IL-10 gene and further characterization of the 5’ flanking sequence. Immunogenetics 1997; 46: 120–128.
[22] Garcı´a-Elorriaga G, Vera-Ramı´rez L, del Rey-Pineda G, et al. –592 and –1082 interleukin- 10 polymorphisms in pulmonary tuberculosis with type 2 diabetes. Asian Pac J Trop Med 2013; 6: 505–509.
[23] Yin YW, Sun QQ, Zhang BB, et al. Association between interleukin-10 gene – 592 C/A polymorphism and the risk of type 2 diabetes mellitus: a meta-analysis of 5320 subjects. Hum Immunol 2012; 73: 960–965.
[24] Hua Bai, Danqing Jing, Aitao Guo and Shinan Yin. Association between interleukin 10 gene polymorphisms and risk of type 2 diabetes mellitus in a Chinese population. Journal of International Medical Research 2013; [0]: 1–9.
[25] Standards of medical care in diabetes-2014. Diabetes Care 2014; 37 [1], S14-S79.
[26] Kohler HP: Insulin resistance syndrome: interaction with coagulation and fibrinolysis. Swiss Med Wkly. 2002; 132: 241–252.
[27] Enyioma O; Michael PT; Abd-Ishakur A; Mustapha S and Mona A: Leptin, lipid and lipid metabolism related hormones in chronic renal failure in Arabia. Nephrology. 2002; 7:115-119.
[28] Matthews D; Hosker J; Rudenski A; Naylor B; Treacher D and Turner R: Homeostasis model assessment: insulin resistance and beta cell function from fasting plasma glucose and insulin concentrations in man. Diabetologia. 1985; 28:412-419.
[29] Gonen B and Rubenstien AH. Determination of glycohemoglobin. Diabetologia 1978; 15: 1 5.
[30] Trinder P. Determination of glucose in blood using glucose oxidase with an alternative oxygen acceptor. J Ann Clin Biochem 1969; 6: 24-25.
[31] Rifai N and Warnick R. Lipids, lipoproteins, apolipoproteins and other cardiovascular risk factors. In: Tietz Textbook of Clinical Chemistry and Molecular Diagnosis. Carl, A. B, Edward, R. A and David, E. B [edrs.]. Saunders. [4th edition] 2006; Ch 26. PP. 918-922.
[32] Gordon T, Zidek W and Amer M. Determination of high-density lipoprotein cholesterol. J. Med 1977; 42: 707:710.
[33] Friedewald W, Levy R and Fredrickson D. Estimation of the concentration of low-density lipoprotein cholesterol in plasma, without use of the preparative ultracentrifuge. Clin Chem 1972; 18:499- 502.
[34] Fossati P and Prenciphe L. Determination of serum triglyceride. Clin Chem 1982; 28: 207-210.
[35] Schultze, J. L., et al. [1997] CD40- activated human B cells; an alternative source of highly efficient antigen presenting cells to generate autologous antigen specific T cells for adoptive immunotherapy. J. Clin. Invest.100, 2757-2765.
[36] Judzewitch R, Pfeifer M, Best J, Halter J and Port D [1982]: Chronic chlorpropamide therapy of noninsulin-dependent diabetes augments basal and stimulated insulin secretion by
increasing islet sensitivity to glucose. J Clin Endocrinol Metab. 1982 Aug; 55(2):321-8.
[37] Hua Bai, Danqing Jing, Aitao Guo and Shinan Yin. Association between interleukin 10 gene polymorphisms and risk of type 2 diabetes mellitus in a Chinese population. Journal of International Medical Research 2013; [0]: 1–9.
[38] Wellen KF, Hotamisligil GS: Inflammation, stress, diabetes. J Clin Invest 2005; 115: 1111–1119.
[39] Scarpelli D, Cardellini M, Andreozzi F, Laratta E, Hribal ML, Marini MA, Tassi V, Lauro R, Perticone F, Sesti G: Variants of the interleukin-10 promoter gene are associated with obesity and insulin resistance but not type 2 diabetes in Caucasian Italian subjects. Diabetes 2006; 55:1529–1533.
[40] Kern PA, Ranganathan S, Li C, Wood L, Ranganathan G: Adipose tissue tumor necrosis factor and interleukin-6 expression in human obesity and insulin resistance. Am J Physiol 2001; 280:E745–E751
[41] Straczkowski M, Kowalska I, Nikolajuk A, Krukowska A, Gorska M: Plasma interleukin-10 concentration is positively related to insulin sensitivity in young healthy individuals. Diabetes Care 2005; 28:2036–2037.
[42] Pickup JC, Mattock MB, Chusney GD, Burt D: Inflammation and activated innate immunity in the pathogenesis of type 2 diabetes. Diabetes Care 27:813– 823, 2004.
[43] Chagas BS, Gurgel AP, da Cruz HL, et al. An interleukin-10 gene polymorphism associated with the development of cervical lesions in women infected with human papillomavirus and using oral contraceptives. Infect Genet Evol 2013; 19C: 32–37.
[44] Helminen M, Lahdenpohja N and Hurme M. Polymorphism of the interleukin-10 gene is associated with susceptibility to Epstein– Barr virus infection. J Infect Dis 1999; 180: 496–499.
[45] Kim H-J, Higashimori T, Park S-Y, Choi H, Dong J, Kim Y-J, Noh H-L, Cho Y-R, Cline G, Kim Y-B, Kim JK: Differential effects of interleukin-6 and -10 on skeletal muscle and liver insulin action in vivo. Diabetes53:1060 –1067, 2004.
[46] Pennline KJ., Roque-Gaffney E and Monahan MRecombinant Human IL-10 Prevents the Onset of Diabetes in the Nonobese Diabetic Mouse Clinical Immunology and Immunopathology. Volume 71, Issue 2, May 1994, Pages 169–175.
[47] Diabetes Mellitus Human Immunology Volume 66, Issue 12, December 2005, Pages 1258–1263.
[48] Yih-Hsin Chang, Chien-Ning Huang, Chuan-Yin Wu, Association of Interleukin-10 A-592C and T-819C Polymorphisms with Type 2 diabetes mellitus. Hum Immunol. 2005 Dec; 66(12):1258-63.
[49] Kim JM, Brannan CI, Copeland NG, et al. Structure of the mouse IL-10 gene and chromosomal localization of the mouse and human genes. J Immunol 1992; 148: 3618–3623.
[50] Del Prete G, De Carli M, Almerigogna F, et al. Human IL-10 is produced by both type 1 helper [Th1] and type 2 helper [Th2] T cell clones and inhibits their antigen-specific proliferation and cytokine production. J Immunol 1993; 150: 353–360.
[51] Moore KW, de Waal-Malefyt R, Coffman RL, O’Garra A: Interleukin-10 and the interleukin-10 receptor. Annu Rev Immunol 2001; 19: 683–765.