the art & science of sales pipeline management (volume & variety)
TRANSCRIPT

© Copyright 2017 | Pendio Group, Inc | All Rights Reserved
SALES METRICS THAT MATTER:
Volume Variety
7 V’sof PIPELINE HEALTH
Part 2/4: VOLUME & VARIETY

© Copyright 2017 | Pendio Group, Inc | All Rights Reserved
Considering Our Sales Stage Base Rates…
Are there enough winnable opportunities in the pipeline to achieve all of our quarterly Objectives?
Are there enough deals in the pipeline to make our number this quarter?
Sales Artists Ask: Sales Artists + Data Science:
VOLUME: Key Concept to Consider
Next: Key Pipeline Metrics
Volume
By 2020, the world will have created 40 zettabytes of data, which is 43 Trillion gigabytes.BIG DATA FUN FACT:
© Copyright 2017 | Pendio Group, Inc | All Rights Reserved
Volume
The concept of ‘VOLUME’ in Big Data, refers to the almost unimaginable sizes and unfamiliar numerical names that are required.
Using Volume to Measure Pipeline Health:
We can all agree that too much Volume would be a nice problem to have. Adopting a dimensional approach to pipeline analysis and management poses dozens of questions. It is crucial to understand which ones matter for you and your business.
Next: Art of Selling + Data

© Copyright 2017 | Pendio Group, Inc | All Rights Reserved
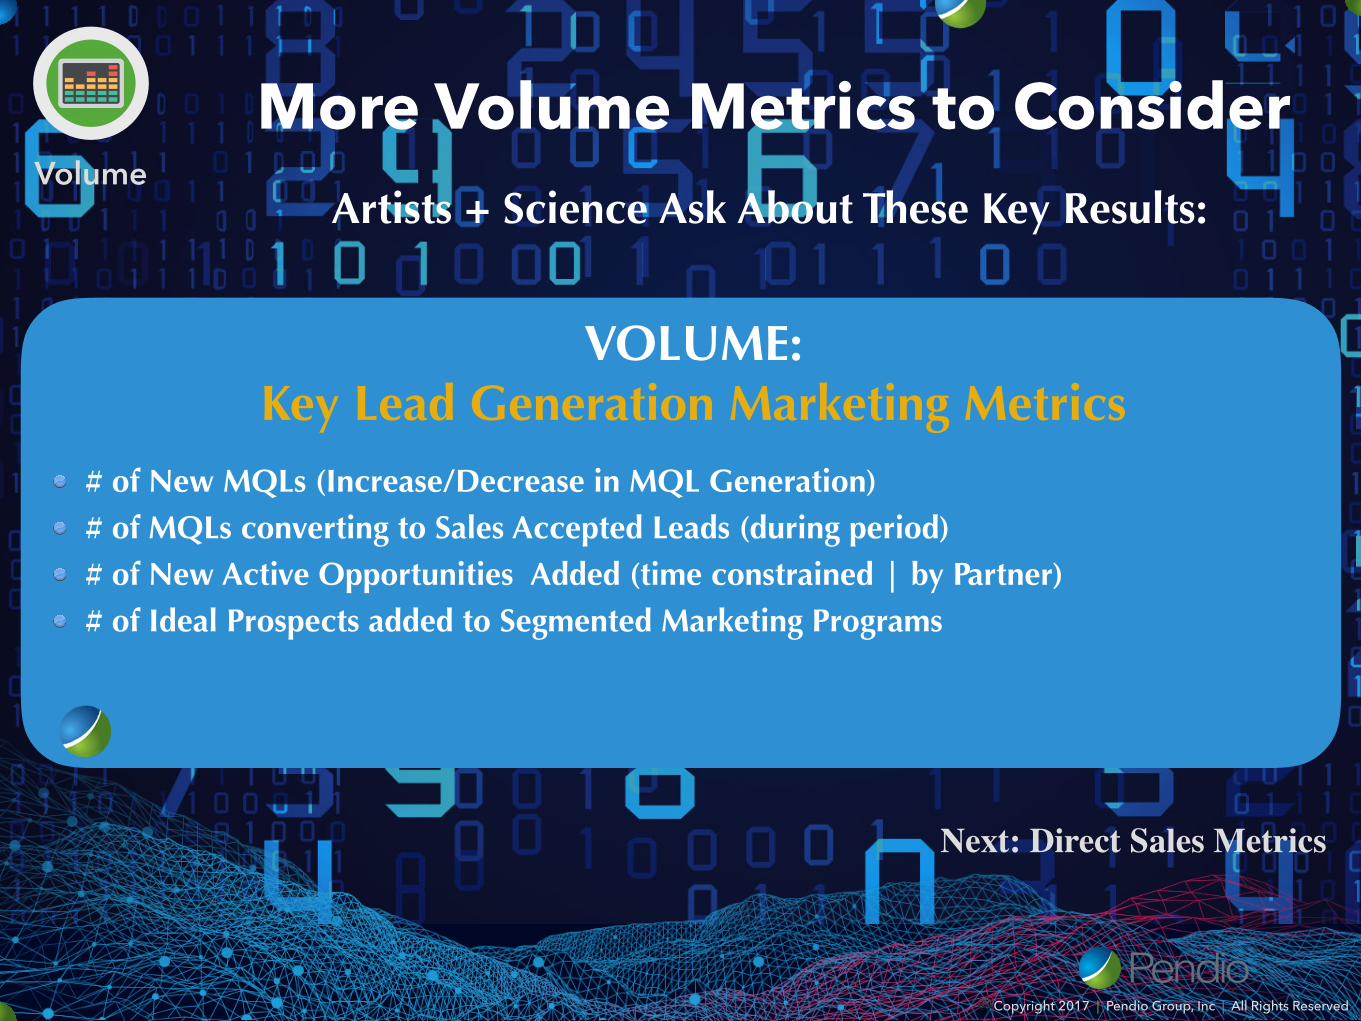
Artists + Science Ask About These Key Results:
More Volume Metrics to Consider
Total Monetary Value of Pipeline (Snap-Shot, 30-day, 90-day growth/deficit) Average Revenue per Sale (Increase / Decrease over time | by Market Segment) Average Margin per Sale (Increase / Decrease over time) Activity Tracking: # of Quality Meetings and Conversations, New Leads Developed
VOLUME: Key Pipeline Health Metrics
Next: Lead Generation Metrics
Volume
(Note: If you are spending too much time focused on tracking the volume of activity vs. outcomes, it may be time to conduct a time audit)
© Copyright 2017 | Pendio Group, Inc | All Rights Reserved
Artists + Science Ask About These Key Results:
More Volume Metrics to Consider
# of New MQLs (Increase/Decrease in MQL Generation) # of MQLs converting to Sales Accepted Leads (during period) # of New Active Opportunities Added (time constrained | by Partner) # of Ideal Prospects added to Segmented Marketing Programs
VOLUME: Key Lead Generation Marketing Metrics
Next: Direct Sales Metrics
Volume

© Copyright 2017 | Pendio Group, Inc | All Rights Reserved
Artists + Science Ask About These Key Results:
More Volume Metrics to Consider
VOLUME: Key Metrics for Direct Sales
Predictive and Forecastable Revenue, Late-Stage Pipeline (Growth Rates | by Rep) Total Monetary Value of Direct Sales Pipeline (Growth / Decline | by Rep) # of SQLs converting to Active Opportunities (Conversion Rates by Rep) Average Revenue/Margin per Sale (by Rep, with similar market segment focus) # of New Active Opportunities Generated (time constrained | by rep) What % of wallet share do we currently have with our key (Pareto) customers? Activity Tracking: # of Quality Meetings and Conversations, New Leads Developed
Next: Indirect Sales Metrics
Volume
(Note: If you are spending too much time focused on tracking the volume of activity vs. outcomes, it may be time to conduct a time audit)
© Copyright 2017 | Pendio Group, Inc | All Rights Reserved
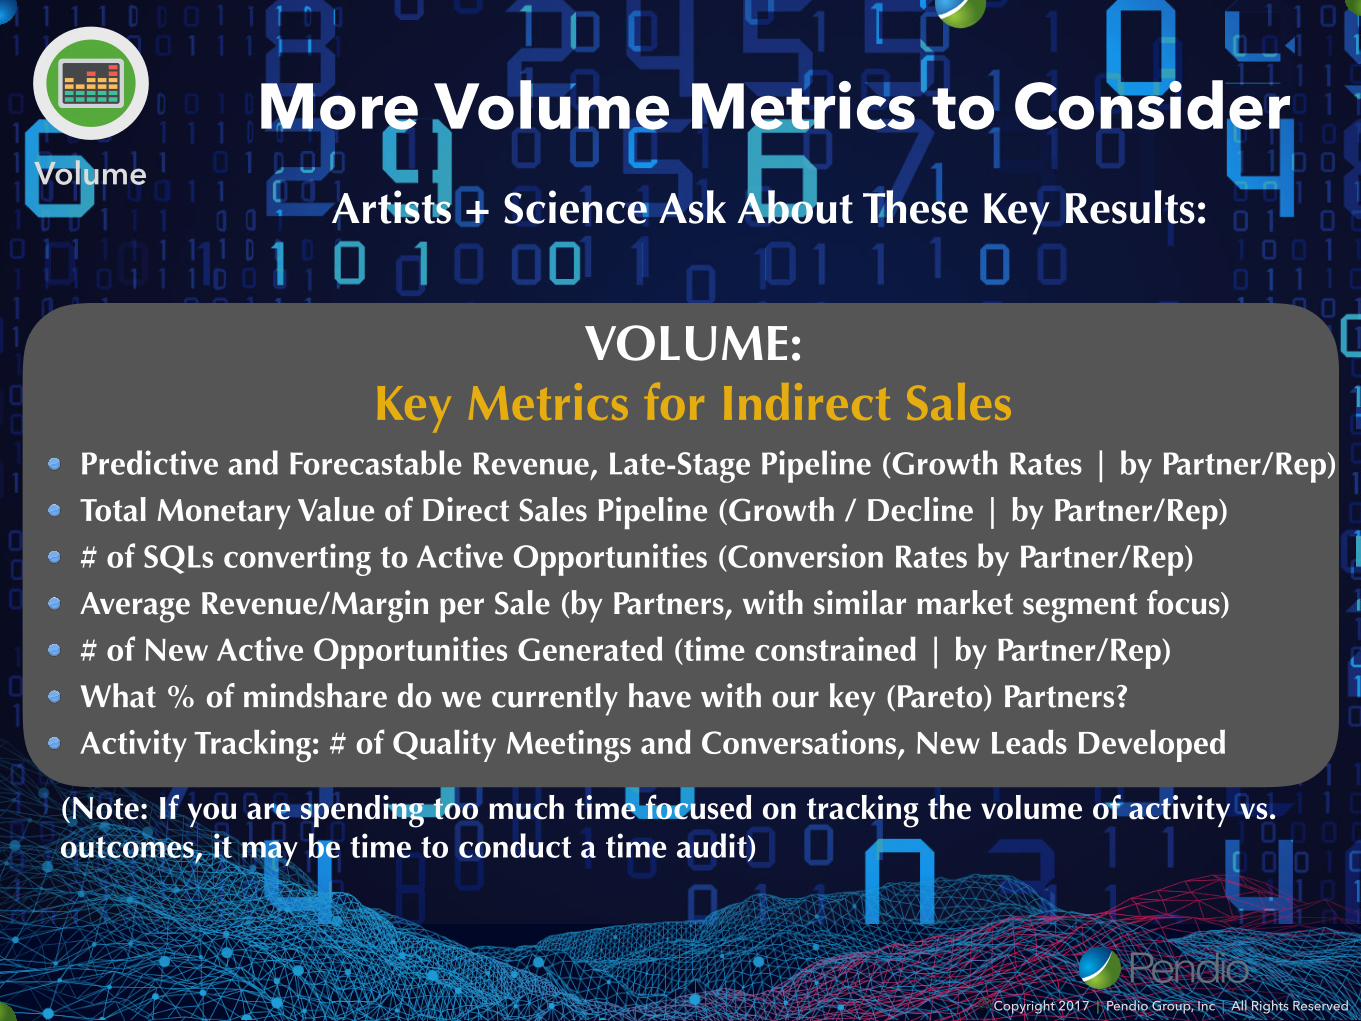
Artists + Science Ask About These Key Results:
More Volume Metrics to Consider
VOLUME: Key Metrics for Indirect Sales
Predictive and Forecastable Revenue, Late-Stage Pipeline (Growth Rates | by Partner/Rep) Total Monetary Value of Direct Sales Pipeline (Growth / Decline | by Partner/Rep) # of SQLs converting to Active Opportunities (Conversion Rates by Partner/Rep) Average Revenue/Margin per Sale (by Partners, with similar market segment focus) # of New Active Opportunities Generated (time constrained | by Partner/Rep) What % of mindshare do we currently have with our key (Pareto) Partners? Activity Tracking: # of Quality Meetings and Conversations, New Leads Developed
Volume
(Note: If you are spending too much time focused on tracking the volume of activity vs. outcomes, it may be time to conduct a time audit)

© Copyright 2017 | Pendio Group, Inc | All Rights Reserved
Volume
What Volume Metrics Matter to You & Your Business?
Something to think about…
Next: Variety Pipeline Metrics

© Copyright 2017 | Pendio Group, Inc | All Rights Reserved
Variety
In Big Data Analytics, Variety is a challenge pertaining to unstructured, indecipherable masses of data that need to be massaged, manipulated, and prioritized.
Using Variety to Measure Pipeline Health:
The concept of variety refers to achieving a healthy balance in the pipeline. One example is the revenue concentration risk that occurs with a top-heavy pipeline filled with a few very large opportunities. Get them all - you’re a hero. Lose one too many and you miss the quarter, and not by a little bit. A dimensional approach to managing pipeline health with Variety, forces you to look at data in greater detail. The temptation is to keep segmenting to find more insights. Before you do that, make sure the insights not only make sense, but make a difference.
© Copyright 2017 | Pendio Group, Inc | All Rights Reserved
\
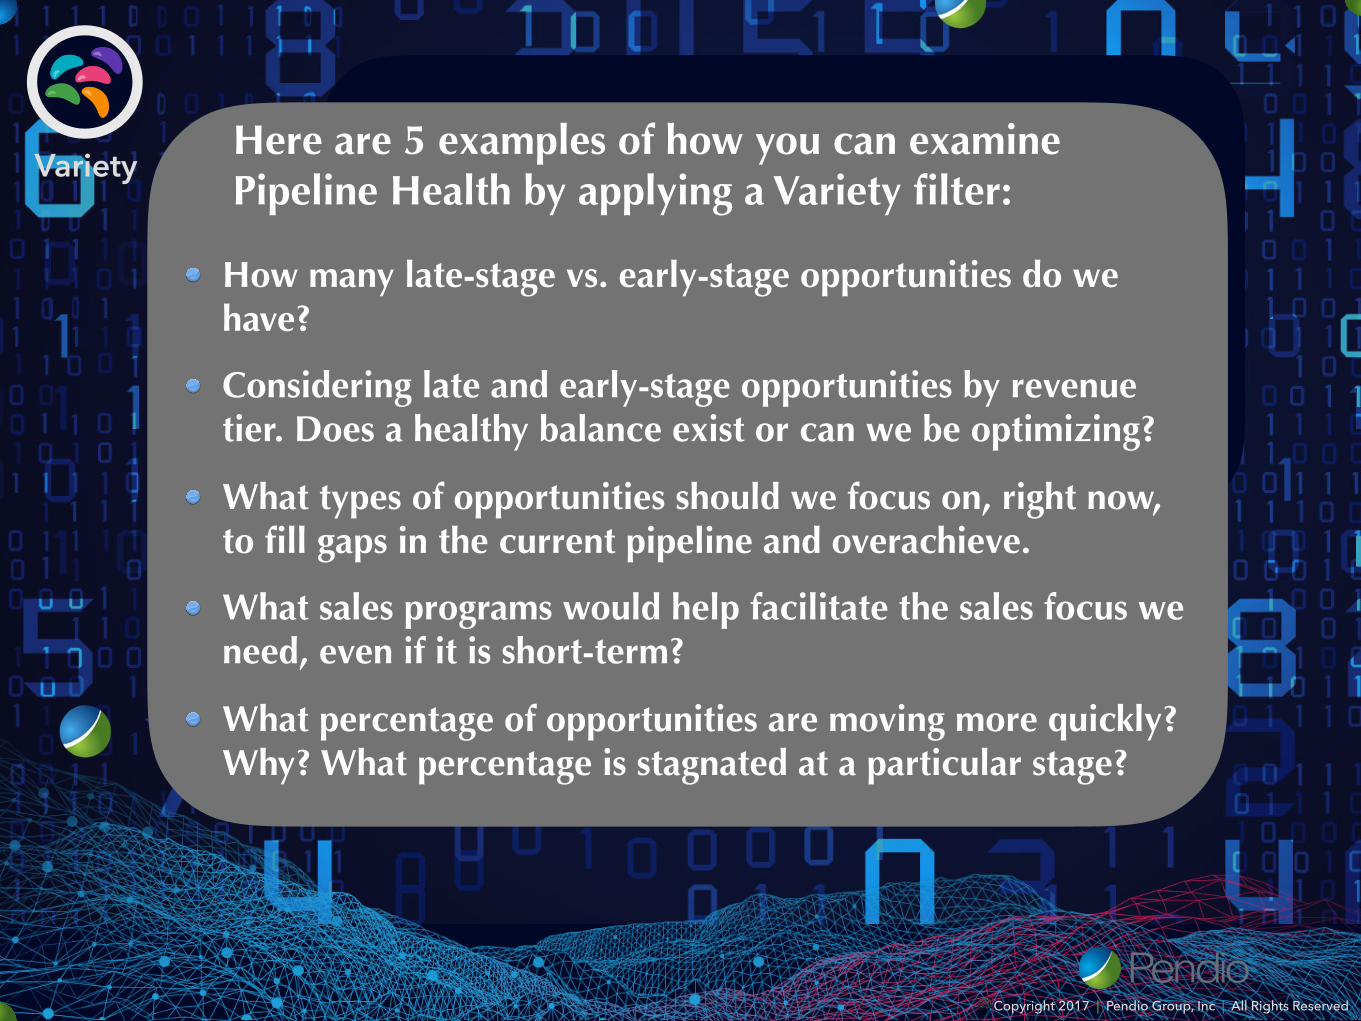
VarietyHere are 5 examples of how you can examine Pipeline Health by applying a Variety filter:
How many late-stage vs. early-stage opportunities do we have?
Considering late and early-stage opportunities by revenue tier. Does a healthy balance exist or can we be optimizing?
What types of opportunities should we focus on, right now, to fill gaps in the current pipeline and overachieve.
What sales programs would help facilitate the sales focus we need, even if it is short-term?
What percentage of opportunities are moving more quickly? Why? What percentage is stagnated at a particular stage?

© Copyright 2017 | Pendio Group, Inc | All Rights Reserved
\
VarietyHere are 5 more examples of how you can examine Pipeline Health by applying a Variety filter:
What percentage of opportunities are within our existing customer base? Do we have preferred vendor status in those accounts? What is our current NPS score within each account?
What percentage of active opportunities are RFP-driven? What percentage of those RFPs did we participate in creating? What percentage do we have no control of?
What type of opportunities (industry segments, deal size, commodity vs. consultative) do we win more often. What are the differentiating factors?
What percentage of active opportunities represent a potential client that fit our Ideal Client Profile?
What percentage of opportunities are based on value propositions / solutions that typically result in our highest win rate? How many opportunities are we in that represent scenarios we struggle to win.

© Copyright 2017 | Pendio Group, Inc | All Rights Reserved
Variety
Ask yourself a metrics-driven question about your Pipeline Health. Can you invert the question? Does that pair of questions help you better understand specific risks based on the balance in your pipeline?
Something to think about…
Next: Variety Pipeline Metrics
© Copyright 2017 | Pendio Group, Inc | All Rights Reserved
Volume Variety
VariabilityValue
VeracityVelocity
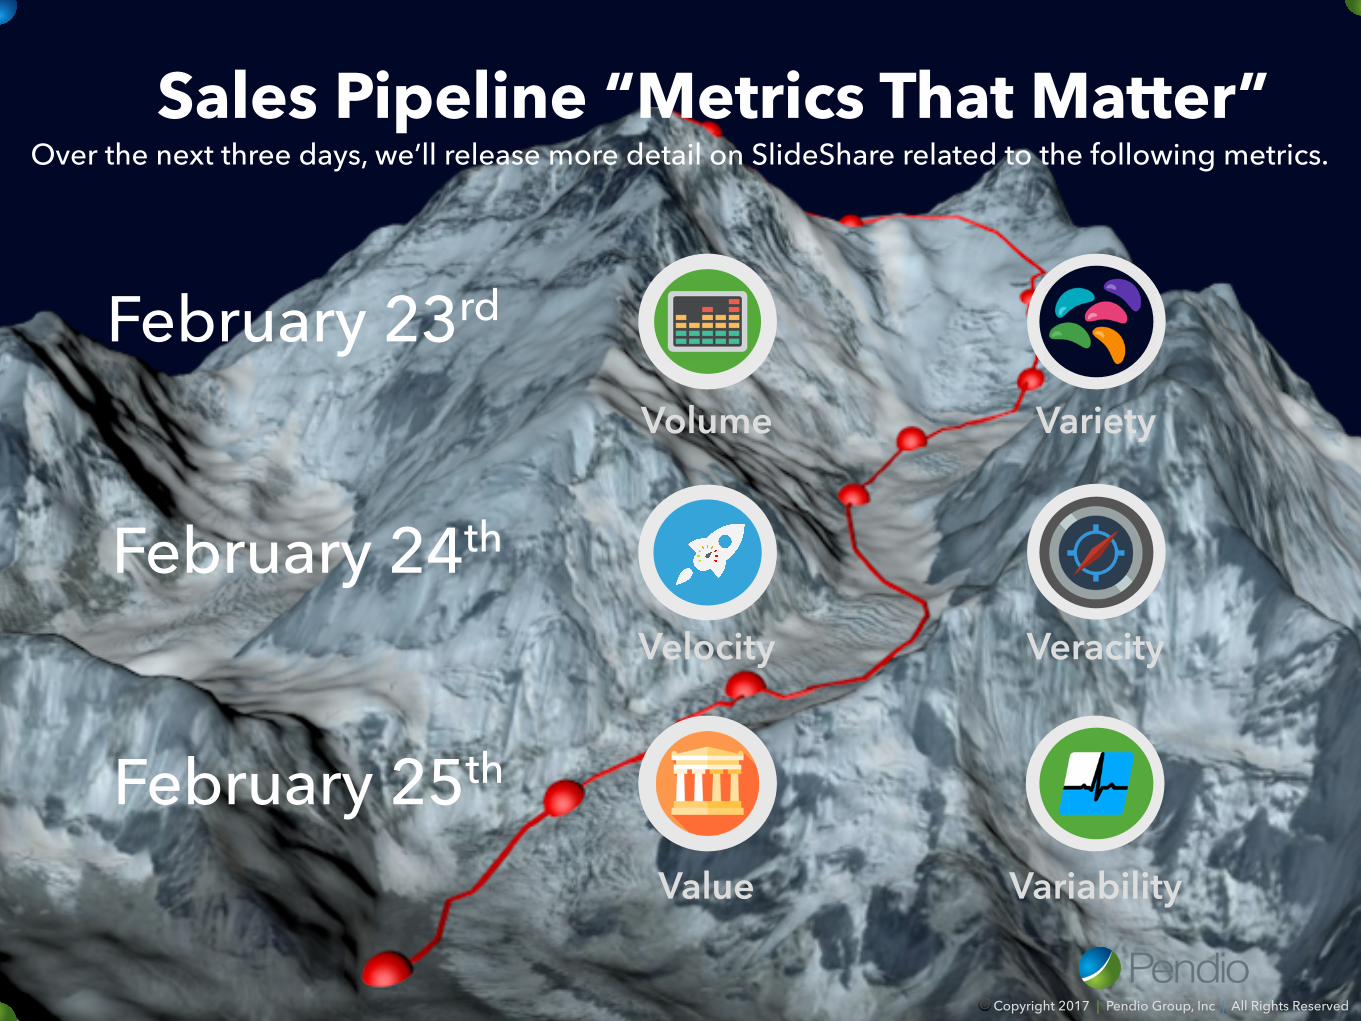
February 23rd
February 24th
February 25th
Over the next three days, we’ll release more detail on SlideShare related to the following metrics.Sales Pipeline “Metrics That Matter”