the arms race in college athletics:facility spending and
TRANSCRIPT

University of Arkansas, FayettevilleScholarWorks@UARK
Accounting Undergraduate Honors Theses Accounting
5-2014
The arms race in College Athletics:facility spendingand its relationship to College Athletics andUniversity CommunitiesHaley Roane PrewettUniversity of Arkansas, Fayetteville
Follow this and additional works at: http://scholarworks.uark.edu/acctuht
Part of the Business Administration, Management, and Operations Commons
This Thesis is brought to you for free and open access by the Accounting at ScholarWorks@UARK. It has been accepted for inclusion in AccountingUndergraduate Honors Theses by an authorized administrator of ScholarWorks@UARK. For more information, please contact [email protected],[email protected].
Recommended CitationPrewett, Haley Roane, "The arms race in College Athletics:facility spending and its relationship to College Athletics and UniversityCommunities" (2014). Accounting Undergraduate Honors Theses. 7.http://scholarworks.uark.edu/acctuht/7
The Arms Race in College Athletics: Facility Spending and its Relationship to
College Athletics and University Communities
By
Haley Prewett
Advisor: Dr. Steve Dittmore
An Honors Thesis in partial fulfillment of the requirements for the degree Bachelor of Science in Business Administration in Accounting.
Sam M. Walton College of Business
University of Arkansas Fayetteville, AR
May 10, 2014

i
Abstract
The arms race in collegiate athletic facilities continues to advance and involves more and more money all the time. Large athletic departments continue to spend money on new, large, state-of-the-art facilities for their programs in order to give them the ability to attract big name coaches, players, and donors. College athletics is a major interest to many people in this country and the fact that these programs have become more and more of a business makes major facility expenditures an interesting and relevant topic to most of the general public. This leads to the question of what factors within the athletic department and within the university community are related to the amount of money that collegiate athletic departments spend on their facilities. This specific study took data from a six year time period for FBS Division I institutions in the areas of finance, athletic performance, facility usage, athletic department size, and institutional factors. The data was gathered from a variety of outside sources and then put through statistical analyses to find correlation and regression information between these variables and facility spending. These tests provided information about the relationships between the variables, how they affected each other, and what they could predict about facility spending. The correlations provided insights into which variables actually affected the amount of facility spending within a collegiate athletic department. It was not surprising that the financial variables were the most related, but it was interesting to note that some of the institutional factors and performance variables were not very related at all. The regressions also proved to be informative because of the variables that contributed to the variance in spending and which ones did not. These results even led to running a second regression with a change in the independent and dependent variable to gain more insights. Although there is much information about facility spending and the rising expenses in college athletics, there is not much correlational data to date. The results from this study can help give collegiate athletic departments more information and a more holistic picture of the relationships between these important variables before they start investing in a new major facility.

ii
Acknowledgements
I would like to thank the faculty and staff of the University of Arkansas. I would also like to specifically thank the faculty and staff of the Sam M. Walton College of Business for constantly pushing me to grow and for their continued support.
I would also like to thank Dr. Stephen Dittmore for all the time he gave to helping me through this thesis process and for always being there to answer my questions and force me to think through everything I did. I would like to thank Professor Ronn Smith for being willing to be the second reader of this paper and for his feedback and help in improving this project.
Finally, I would like to thank my family and friends for always supporting me and continuously encouraging and inspiring me.

iii
Table of Contents
Introduction……………………………………………………………………………………………………………………..1
Literature Review……………………………………………………………………………………………………………..3
Methodology…………………………………………………………………………………………………………………….6
Data & Results…………………………………………………………………………………………………………………11
Discussion……………………………………………………………………………………………………………………….19
Limitations………………………………………………………………………………………………………………………24
Future Research.……………………………………………………………………………………………………………..27
Bibliography.……………………………………………………………………………………………………………………30
Table of Tables
Table 1. Variable Information………………………………………………………………………………………….10
Table 2. Descriptive Statistics………………………………………………………………………………………….12
Table 3. Correlations……………………………………………………………………………………………………….15
Table of Figures
Figure 1. Regression Model Summary……………………………………………………………………………..17
Figure 2. Coefficients……………………………………………………………………………………………………….17
Figure 3. Regression Model Summary………………………………………………………………………………18
Figure 4. Coefficients……………………………………………………………………………………………………….18

1
Introduction
When Oregon, Arkansas, and Alabama all revealed new and improved football facilities
in the same month, totaling $112 million spent, the collegiate athletics arms race was never
more prevalent. (Bennett, 2012 & Manfred, 2013). Institutions big and small across this
country are investing in new football stadiums, basketball arenas, practice facilities, student-
athlete academic centers, and more. Collegiate athletics are as popular as ever, and the
landscape continues to become more and more of a business environment with the amount of
money involved continuing to increase and leaving a larger impact across the nation. The Knight
Commission (2013) reported that in a recent NCAA Presidential Task Force for Intercollegiate
Athletics study that “nearly 20 percent of current spending on average is tied to facility
expansion and capital debt.” (pg. 16). This shows how large the facility expenditures issue has
become. It is now a necessity for athletic departments to build these bigger and better facilities
in order to keep up with their peers. These facilities are used to attract the big name coaches
and recruits and also to please donors so that they will continue to support the program. There
does not seem to be a slowdown in the future, the large programs will continue to build more
and bigger facilities and the smaller ones will fight to stay relevant. All of this led to the goal of
this study: to analyze factors that contribute to the amount spent by collegiate athletic
departments on facilities. There is much information available about the amount that
institutions are spending and the rising costs of collegiate athletics, but there is not much
correlational data related to this topic. This study will attempt to explain the issues and provide
different variables that may be related to facility spending and in turn are influencing the arms
race.

2
This study uses public FBS Division I institutions only, since these institutions have the
high budget, high facility expenditure athletic departments. The amount of annual debt service
on facilities is used to represent the amount athletic departments are spending throughout this
study. The study looks at a period of six years from 2006-2011 to measure the relationships
between facility spending and 14 other variables. The other variables were chosen because
they are relevant to all athletic departments and universities communities, and it would be
beneficial to know how they are related to facility spending. The variables represented five
different categories: finance, athletic performance, facility usage, athletic department size, and
institutional factors. All of these variables matter to an athletic department when making any
big decisions, so it is important to understand how they are related to the decision of investing
in a new or upgraded facility.
Correlations between the Annual Debt Service on Facilities and all of the other variable
categories previously mentioned will allow for a greater understanding of the whole picture on
facility spending. Athletic Departments can take the knowledge of these relationships and use
them to help make more informed decisions about facility expenditures in the future. Facility
spending has created an all out arms race in college athletics, and it has become a major
concern for every athletic department, making the factors contributing to this spending very
intriguing. The correlational data is a new way to look at this information and will highlight
relationships between variables that may not have been known or explored before. The
regression data will also provide a way to understand which variables contribute the most to
the variances in spending and which do not.
3
This paper will outline the way the study was conducted and what was learned from it.
It will start with a review of other similar research and thoughts about the collegiate athletics
arms race and facility spending. This topic is widely publicized and there are several different
opinions to discuss. The paper will then outline the methodologies used in this specific study
and will detail more about each variable and what statistical tests were conducted to achieve
solid results. Then the paper will present the data and results from the statistical tests. It will
then analyze these results and discuss what can be learned from them and what they could
mean for athletic departments. Next, any limitations in the study will be presented in order for
the readers to understand the scope and generalizations that can be made. Finally, the paper
will end with recommendations about future research and what athletic departments should
do next with this research to help them make decisions about their future.
Literature Review
The issue of facility spending in collegiate athletics continues to garner more and more
attention every time a new, bigger, and better facility opens on a campus across this country.
There are several differing opinions about the current arms race throughout collegiate athletics.
There are opinions about the benefits of the facilities, the problems they cause, and the large
amounts of money being spent. Much of the information reports the amounts spent on these
new facilities, the amount of the budget at these institutions, and about subsidies that the
athletic departments receive from institutions. However, there is not much information
regarding the relationships that this increase in facility spending has with the other important
variables within an athletic department. This is why this study aims to fill some of that void and
provide a unique view of the spending on facilities within collegiate athletic departments.

4
As mentioned earlier, there are not a lot of previous studies similar to this one to draw
from but there are studies dealing with collegiate athletic departments’ budgets, and there is
plenty of research about college athletics spending as a whole to evaluate. For example,
McEvoy, Morse, & Shapiro’s (2013) study used several different variables that are important to
college athletic departments in its study to see what influenced revenue. In the study of
McEvoy et al., the research design was very similar to the one that this study employed because
it used a group of variables in statistical tests to determine how they were related to revenue.
The variables McEvoy et al. used in their study were analyzed when picking variables for the
study detailed in this paper and although not a lot of the same ones were used, the study by
McEvoy et al. provided a basis for finding variables that would be relevant to analyze in the
current study. The McEvoy et al. study found that conference affiliation was a primary predictor
of revenues, and although this variable was not touched in this study, it could definitely add to
facility spending information in the future.
The Knight Commission (2014) recently released a database all about spending within
college athletics. There are several different categories of spending addressed in the Knight
Commission database, and the study completed here used their information about the Annual
Debt Service on Facilities. The Knight Commission database information shows the public, in
many different ways, how much the spending in collegiate athletics has increased over the last
several years. There have been many articles that used this data to point out the percentage
change in spending per student athlete and even compare it to the percentage change in
spending per regular student. For example, according to a Vedder (2013) “inflation-adjusted
academic spending per student rose a modest 8% from 2005 to 2011. Meanwhile athletic

5
spending per athlete rose by more than 38%.” Vedder’s article is just one of many to reference
overall spending in collegiate athletics when talking about the arms race. This particular study
tries to narrow the spending down by focusing on facility spending only, but it is important to
see that the overall spending in athletics is following the same trends as facility spending. The
Knight Commission (2009) suggested the construction boom in athletics is mirroring what is
happening campus-wide across the country. This was an interesting point to make that the
arms race may not be solely focused in athletics, but is also happening with research
laboratories, residence halls, and other projects as well. Finally, this Knight Commission (2009)
article addressed different types of facility expenditures. It mentions football stadiums, for
example, being renovated or built new to include, “added capacity, luxury suites, and other
premium amenities.” (pg. 16-17). This shows how revenue streams are added from facility
spending. The added capacity means more ticket revenue, luxury suites mean people paying
more money to sit in them, and premium amenities keep people returning to your facility. It is
an interesting idea to see how these revenue producing facilities would influence athletic
department factors as compared to the non-revenue producing ones like practice facilities or
tutoring centers.
All of this information made it even clearer that the public and media are all over the
board on their opinions of the issue. There are people who believe the amount of spending
during this arms race is excessive, and there are studies that back up their claims, and there are
also those that believe these facilities add value to the institution and more importantly benefit
the student-athletes substantially, and there are figures that back this up as well. This led to the
development of the specific research question that this study aims to answer; what factors

6
contribute to the amount of money that college athletic departments spend on facilities? The
studies that have been done in the past reveal a lot about how departments spend their money
and compare this to a lot of different variables, but this new research should provide a way for
athletic departments to see something different when analyzing a new investment.
Methodology
The purpose of this study is to help better understand the current arms race in
collegiate athletics by analyzing the factors that contribute to the amount of facility spending
by collegiate athletic departments. In this study, the research design involved gathering the
data for a set of 14 quantitative variables that are important in college athletic departments
and university communities and then using statistical analyses to understand the relationships
between these variables and the facility spending at the chosen institutions. The amount of
annual debt service at these institutions was used to represent the amount of facility spending
throughout this study.
This methodological approach fit this study best because it helped reach the objective of
this study, understanding what factors affect the facility spending at these institutions. This
research problem focuses specifically on the relationships between variables so using a
statistical analysis on a set of variables that are related to the athletic departments and
universities and the amount of facility spending paints a picture of those relationships; if they
exist, and how strong they are. The correlations and regression results found made it possible
to analyze the relationships between the variables and what they mean for athletic
departments. This type of correlational data is not readily available to athletic departments and

7
using the methodology outlined here made it possible to address this need and provide new
information for athletic departments to consider when investing in a new facility of any kind.
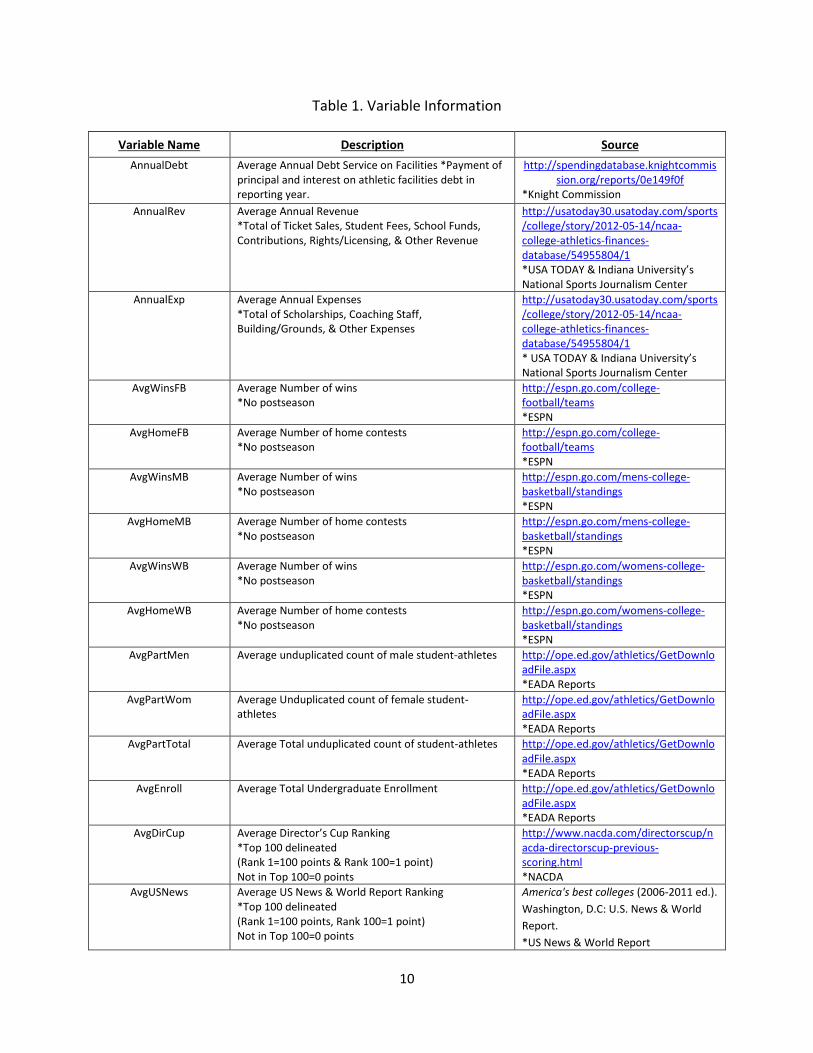
Fourteen variables used in this study were chosen because they are relevant to this
research question and would help in drawing relevant conclusions. The 14 variables can be
broken down into five different categories. The first category is financial, which includes Annual
Revenue and Annual Expenses. The second category is performance, which includes Average
Number of Wins (Football), Average Number of Wins (Men’s Basketball), Average Number of
Wins (Women’s Basketball), and Average Director’s Cup Ranking. Facility usage is another
category, which includes Average Number of Home Contests (Football), Average Number of
Home Contests (Men’s Basketball), and Average Number of Home Contests (Women’s
Basketball). The size of athletic departments is another category and includes Average Male
Participants, Average Female Participants, and Average Total Participants. The final category is
institutional factors, which includes Average Enrollment and Average US News & World Report
Ranking. Table 1 on Page 14 shows more detailed information about each of the variables.
The data was gathered for each of these variables for each year from 2006-2011. The
years are congruent with school years, which is the way most universities report their fiscal
year. For example, the 2005-2006 school year is reported as 2006 in this data set and the 2010-
2011 school year is reported as 2011 in this data set. The year 2006 was chosen as the first year
because it was the year that the BCS National Championship game began which started
pumping more money into college football through television distributions and such. This
additional revenue helped trigger the arms race along with programs trying to improve and

8
make it to this National Championship game. After finding the data for each individual year, an
average over the six years was taken for each variable at each institution. The relationships
between the variables were found using the averages of each variable at each institution over
the six year period included in this study.
There were a few different ways to measure a few of the variables but they were
standardized as much as possible to make it as simple as possible. For example, in the Number
of Wins and Number of Home Contest variables, no postseason events were included. For the
Number of Participants variables, the numbers are an unduplicated count in order to not count
student-athletes that participate in more than one sport twice. The Total Enrollment number is
undergraduate students only. Finally, the Director’s Cup and US News & World Report Rankings
were based on a point system. Only the institutions that were in the top one hundred received
points and these points were delineated. For example, the number one ranked school received
100 points and the number 100 ranked school received one point. These points were then
averaged over the six year time period, just like the rest of the variables, before being used in
the statistical analysis.
This study focused on institutions that would be relevant to the facility spending issue
and, therefore, the current arms race. This study includes 95 Division I FBS public institutions.
There are no private schools included because their information is not available to the public in
most cases and smaller NCAA divisions would not have been as relevant in the amounts of
facility spending. Any institutions that moved up to the FBS division during the time period in

9
the study were eliminated because their data would not have been standardized over the
whole period.
To gather the data several different sources of archival research were used. The data
was all already available to the public and combined in this process to determine the
relationships between the variables and amount of facility spending by each institution. All of
the data was originally gathered by an outside party. The information about each variable;
name, description, and original source can be found in Table 1 on Page 10.
10
Table 1. Variable Information
Variable Name Description Source
AnnualDebt Average Annual Debt Service on Facilities *Payment of principal and interest on athletic facilities debt in reporting year.
http://spendingdatabase.knightcommission.org/reports/0e149f0f
*Knight Commission
AnnualRev Average Annual Revenue *Total of Ticket Sales, Student Fees, School Funds, Contributions, Rights/Licensing, & Other Revenue
http://usatoday30.usatoday.com/sports/college/story/2012-05-14/ncaa-college-athletics-finances-database/54955804/1 *USA TODAY & Indiana University’s National Sports Journalism Center
AnnualExp Average Annual Expenses *Total of Scholarships, Coaching Staff, Building/Grounds, & Other Expenses
http://usatoday30.usatoday.com/sports/college/story/2012-05-14/ncaa-college-athletics-finances-database/54955804/1 * USA TODAY & Indiana University’s National Sports Journalism Center
AvgWinsFB Average Number of wins *No postseason
http://espn.go.com/college-football/teams *ESPN
AvgHomeFB Average Number of home contests *No postseason
http://espn.go.com/college-football/teams *ESPN
AvgWinsMB Average Number of wins *No postseason
http://espn.go.com/mens-college-basketball/standings *ESPN
AvgHomeMB Average Number of home contests *No postseason
http://espn.go.com/mens-college-basketball/standings *ESPN
AvgWinsWB Average Number of wins *No postseason
http://espn.go.com/womens-college-basketball/standings *ESPN
AvgHomeWB Average Number of home contests *No postseason
http://espn.go.com/womens-college-basketball/standings *ESPN
AvgPartMen Average unduplicated count of male student-athletes http://ope.ed.gov/athletics/GetDownloadFile.aspx *EADA Reports
AvgPartWom Average Unduplicated count of female student-athletes
http://ope.ed.gov/athletics/GetDownloadFile.aspx *EADA Reports
AvgPartTotal Average Total unduplicated count of student-athletes http://ope.ed.gov/athletics/GetDownloadFile.aspx *EADA Reports
AvgEnroll Average Total Undergraduate Enrollment http://ope.ed.gov/athletics/GetDownloadFile.aspx *EADA Reports
AvgDirCup Average Director’s Cup Ranking *Top 100 delineated (Rank 1=100 points & Rank 100=1 point) Not in Top 100=0 points
http://www.nacda.com/directorscup/nacda-directorscup-previous-scoring.html *NACDA
AvgUSNews Average US News & World Report Ranking *Top 100 delineated (Rank 1=100 points, Rank 100=1 point) Not in Top 100=0 points
America's best colleges (2006-2011 ed.).
Washington, D.C: U.S. News & World
Report.
*US News & World Report
11
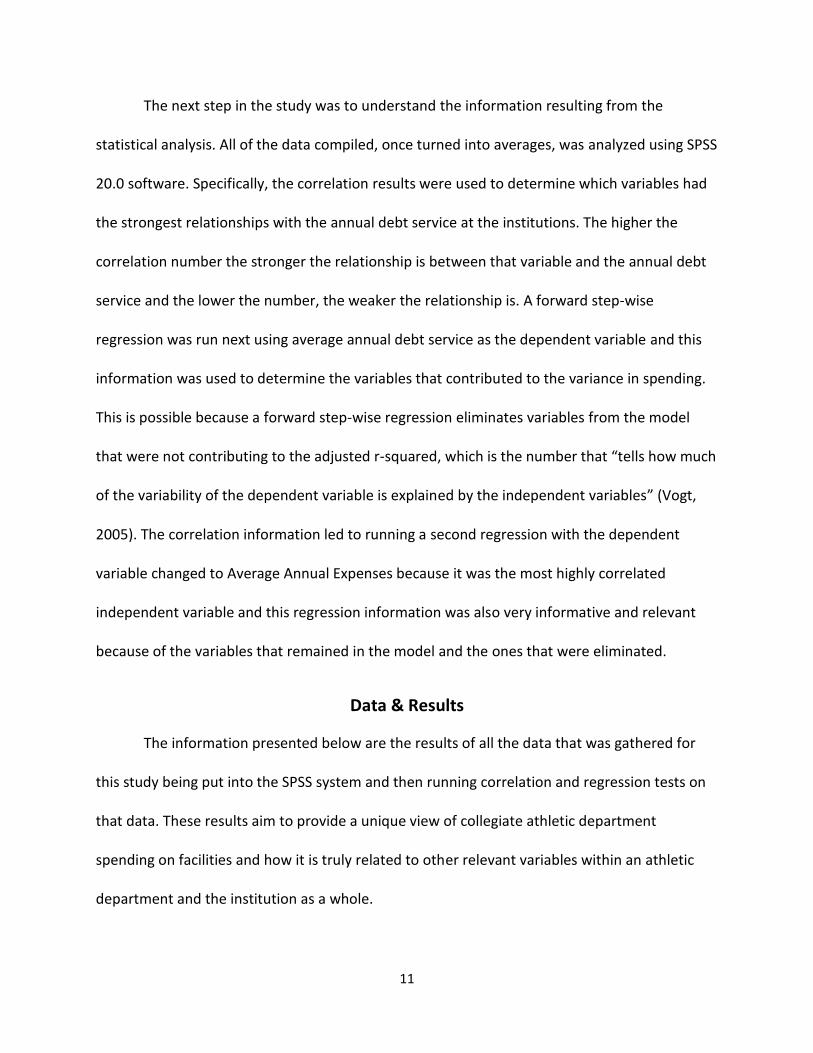
The next step in the study was to understand the information resulting from the
statistical analysis. All of the data compiled, once turned into averages, was analyzed using SPSS
20.0 software. Specifically, the correlation results were used to determine which variables had
the strongest relationships with the annual debt service at the institutions. The higher the
correlation number the stronger the relationship is between that variable and the annual debt
service and the lower the number, the weaker the relationship is. A forward step-wise
regression was run next using average annual debt service as the dependent variable and this
information was used to determine the variables that contributed to the variance in spending.
This is possible because a forward step-wise regression eliminates variables from the model
that were not contributing to the adjusted r-squared, which is the number that “tells how much
of the variability of the dependent variable is explained by the independent variables” (Vogt,
2005). The correlation information led to running a second regression with the dependent
variable changed to Average Annual Expenses because it was the most highly correlated
independent variable and this regression information was also very informative and relevant
because of the variables that remained in the model and the ones that were eliminated.
Data & Results
The information presented below are the results of all the data that was gathered for
this study being put into the SPSS system and then running correlation and regression tests on
that data. These results aim to provide a unique view of collegiate athletic department
spending on facilities and how it is truly related to other relevant variables within an athletic
department and the institution as a whole.

12
Table 2 below shows the descriptive statistics for this group of data. The six years worth
of data was averaged to get one number for each institution for each variable. The descriptive
statistics below are the minimum, maximum, mean, and standard deviation of all of the
institutions together for each of the 15 variables measured. It is interesting to note some of the
ranges that this data showed; especially in terms of the financial variables. The Annual Revenue
variable had a range of $116,422,241 and the Annual Expenses variable had a range of
$105,707,544. It is also interesting to note that the mean Annual Revenue and Annual Expenses
are very similar numbers. Finally, because this study does focus on facility spending; it is of note
that the mean Annual Debt Service on Facilities is a little over $3.7 million for each of these 95
FBS Division I Institutions. There are several other numbers in this table that point to trends
within these institutions, but this study will focus mainly on the spending variables.
Table 2. Descriptive Statistics
Minimum Maximum Mean Std. Deviation
AnnualDebt .00 20,794,509.33 3,735,711.96 3,931,927.91
AnnualRev 9,478,460.00 125,900,701.00 48,201,977.24 28,210,277.52
AnnualExp 9,416,734.33 115,124,278.50 46,025,591.42 25,426,381.87
AvgWinsFB 2.17 11.17 6.27 1.97
AvgHomeFB 4.83 7.67 6.24 .65
AvgWinsMB 9.83 26.50 17.26 4.02
AvgHomeMB 13.00 18.83 16.26 1.44
AvgWinsWB 6.50 28.50 16.24 4.39
AvgHomeWB 12.00 18.17 15.14 1.28
AvgPartMen 164.80 524.83 273.33 65.31
AvgPartWom 113.33 429.00 214.58 71.96
AvgPartTotal 289.20 891.17 487.91 129.52
AvgEnroll 5,825.00 38,457.00 18,813.98 7,114.85
AvgDirCup .00 96.67 37.38 34.83
AvgUSNews .00 80.00 13.84 23.30

13
Table 3 on Page 15 illustrates the correlations found between all of the different
variables in this study. These correlations were part of the base used to answer the research
question presented in this study; what factors contribute to the amount of facility spending in
collegiate athletic departments. They are the link to be able to understand the relationships
between all of the athletic department and institutional factors and the annual debt service, or
facility spending amounts.
Table 3 illustrates Average Annual Expenses and Average Annual Revenues are the most
strongly correlated with Average Annual Debt Service at .733 and .719 respectively. Average
Number of Wins in Men’s Basketball and Average US News & World Rankings are the least
correlated at .190 and .264 respectively. The football variables are the most highly correlated
among the sports tested with correlations of .533 for Average Number of Wins and .588 for
Average Number of Home Contests. The Average Director’s Cup Ranking also shows a strong
relationship at .592. The institutional variables and size of the athletic department variables
were all not very highly correlated with the spending amounts, with Total Enrollment being the
most correlated of all of those.
It is also interesting to note some of the correlations among the independent variables.
For example, Average Annual Revenue and Average Annual Expenses are more highly
correlated with the Average Number of Home Contests than with the Average Number of Wins
in all three sports tested. The Financial variables are much more correlated with football than
the other sports. There are several other relationships between these variables that are
interesting and could be studied further in the future. All of these correlations paint a picture of

14
how interrelated collegiate athletic departments really are and how strong these relationships
are.

15
Table 3. Correlations
Annual Debt
Annual Rev
Annual Exp
Avg Wins
FB
Avg Home
FB
Avg WinsMB
Avg Home
MB
Avg WinsWB
Avg Home
WB
Avg Part Men
Avg Part Women
Avg Part Total
Avg Enroll
Avg Dir Cup
AvgUSNews
AnnualDebt 1.000 0.719 0.733 0.533 0.588 0.190 0.484 0.265 0.440 0.377 0.372 0.381 0.422 0.592 0.264
AnnualRev
1.000 0.991 0.551 0.801 0.435 0.675 0.397 0.478 0.607 0.614 0.647 0.580 0.887 0.554
AnnualExp
1.000 0.551 0.814 0.455 0.697 0.419 0.491 0.641 0.638 0.678 0.605 0.900 0.576
AvgWinsFB
1.000 0.466 0.087 0.314 0.340 0.259 0.308 0.222 0.279 0.255 0.472 0.174
AvgHomeFB
1.000 0.422 0.781 0.317 0.479 0.455 0.486 0.500 0.484 0.746 0.395
AvgWinsMB
1.000 0.563 0.221 0.366 0.269 0.352 0.331 0.284 0.420 0.292
AvgHomeMB
1.000 0.301 0.558 0.421 0.445 0.459 0.377 0.644 0.374
AvgWinsWB
1.000 0.373 0.405 0.338 0.392 0.215 0.454 0.294
AvgHomeWB
1.000 0.365 0.277 0.338 0.168 0.448 0.287
AvgPartMen
1.000 0.780 0.938 0.503 0.675 0.710
AvgPartWomen
1.000 0.949 0.567 0.620 0.659
AvgPartTotal
1.000 0.569 0.685 0.724
AvgEnroll
1.000 0.588 0.467
AvgDirCup
1.000 0.646
AvgUSNews
1.000
16
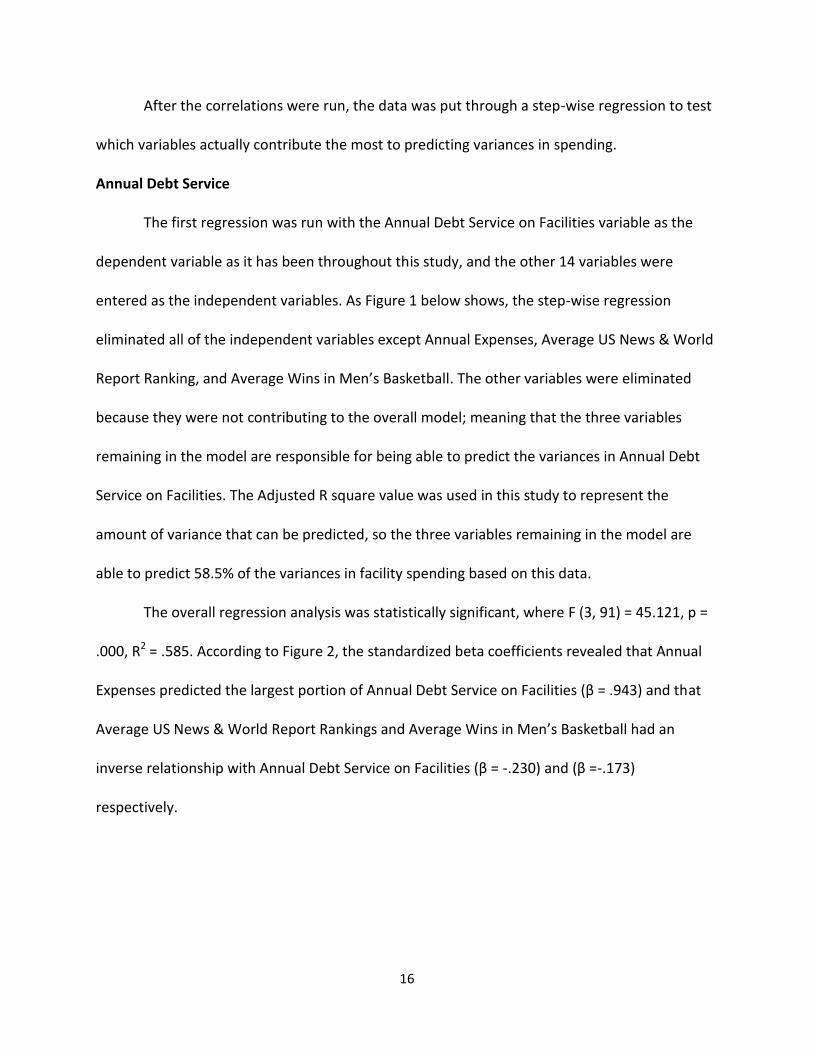
After the correlations were run, the data was put through a step-wise regression to test
which variables actually contribute the most to predicting variances in spending.
Annual Debt Service
The first regression was run with the Annual Debt Service on Facilities variable as the
dependent variable as it has been throughout this study, and the other 14 variables were
entered as the independent variables. As Figure 1 below shows, the step-wise regression
eliminated all of the independent variables except Annual Expenses, Average US News & World
Report Ranking, and Average Wins in Men’s Basketball. The other variables were eliminated
because they were not contributing to the overall model; meaning that the three variables
remaining in the model are responsible for being able to predict the variances in Annual Debt
Service on Facilities. The Adjusted R square value was used in this study to represent the
amount of variance that can be predicted, so the three variables remaining in the model are
able to predict 58.5% of the variances in facility spending based on this data.
The overall regression analysis was statistically significant, where F (3, 91) = 45.121, p =
.000, R2 = .585. According to Figure 2, the standardized beta coefficients revealed that Annual
Expenses predicted the largest portion of Annual Debt Service on Facilities (β = .943) and that
Average US News & World Report Rankings and Average Wins in Men’s Basketball had an
inverse relationship with Annual Debt Service on Facilities (β = -.230) and (β =-.173)
respectively.
17
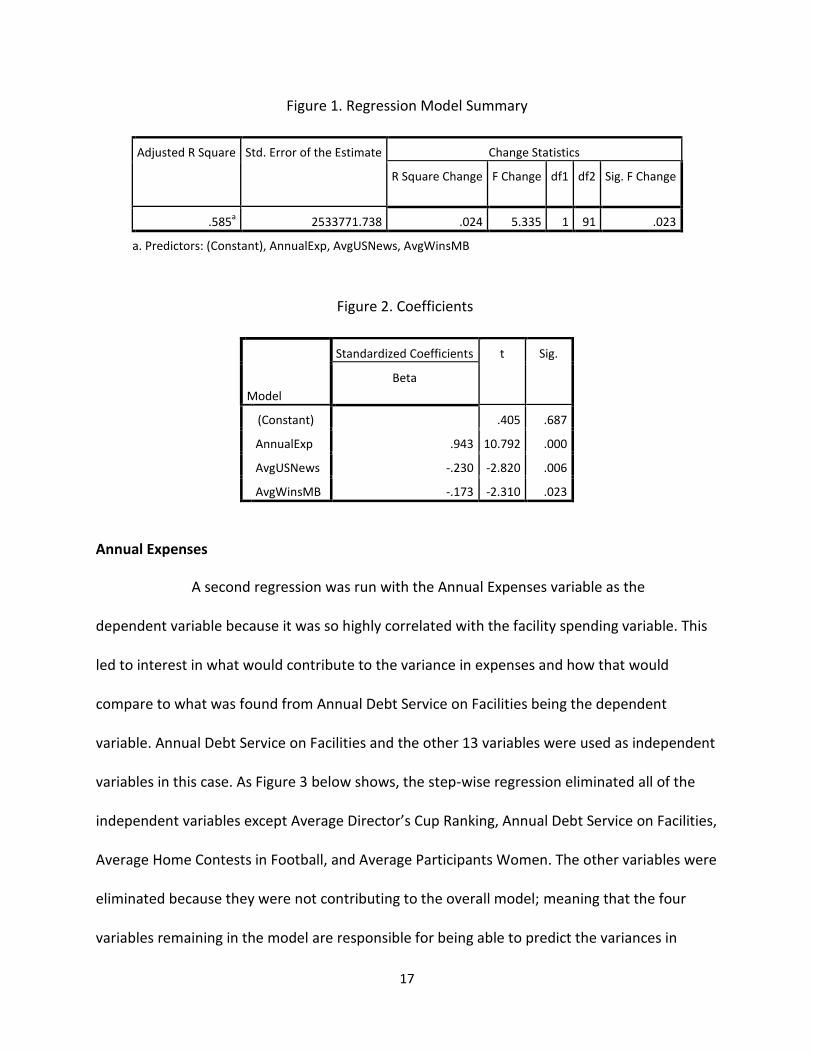
Figure 1. Regression Model Summary
Adjusted R Square Std. Error of the Estimate Change Statistics
R Square Change F Change df1 df2 Sig. F Change
.585a
2533771.738 .024 5.335 1 91 .023
a. Predictors: (Constant), AnnualExp, AvgUSNews, AvgWinsMB
Figure 2. Coefficients
Model
Standardized Coefficients t Sig.
Beta
(Constant) .405 .687
AnnualExp .943 10.792 .000
AvgUSNews -.230 -2.820 .006
AvgWinsMB -.173 -2.310 .023
Annual Expenses
A second regression was run with the Annual Expenses variable as the
dependent variable because it was so highly correlated with the facility spending variable. This
led to interest in what would contribute to the variance in expenses and how that would
compare to what was found from Annual Debt Service on Facilities being the dependent
variable. Annual Debt Service on Facilities and the other 13 variables were used as independent
variables in this case. As Figure 3 below shows, the step-wise regression eliminated all of the
independent variables except Average Director’s Cup Ranking, Annual Debt Service on Facilities,
Average Home Contests in Football, and Average Participants Women. The other variables were
eliminated because they were not contributing to the overall model; meaning that the four
variables remaining in the model are responsible for being able to predict the variances in

18
Annual Expenses. The Adjusted R square value was used in this study to represent the amount
of variance that can be predicted, so the four variables remaining in the model are able to
predict 90.1% of the variances in expenses based on this data.
The overall regression analysis was statistically significant, where F (4, 91) = 215.490, p =
.000, R2 = .901. According to Figure 4, the standardized beta coefficients revealed that Average
Director’s Cup Ranking predicted the largest portion of Annual Expenses (β = .493) followed by
Annual Debt Service on Facilities (β = .261), Average Home Contests in Football (β = .228), and
finally Average Participation Women (β = .132).
Figure 3. Regression Model Summary
Adjusted R Square Std. Error of the Estimate Change Statistics
R Square Change F Change df1 df2 Sig. F Change
.901a
7989863.662 .011 10.205 1 90 .002
a. Predictors: (Constant), AvgDirCup, AnnualDebt, AvgHomeFB, AvgPartWom
Figure 4. Coefficients
Model
Standardized Coefficients t Sig.
Beta
4
(Constant) -3.447 .001
AvgDirCup .493 8.736 .000
AnnualDebt .261 6.237 .000
AvgHomeFB .228 4.507 .000
AvgPartWom .132 3.195 .002

19
Discussion
This study looked at collegiate athletic spending on facilities in a unique way; it aimed to
provide information about how other relevant athletic department variables are related to this
spending. The results presented earlier indicate many interesting relationships between the
variables and also provided information from the regressions about predicting variances in the
spending. There are many ways to interpret all of these results and collegiate athletic
departments can now use these results to help them make more informed decisions about new
facility investments.
Annual Debt Service
The variables most highly correlated Annual Debt Service on Facilities were Annual
Expenses at .733 followed closely by Annual Revenue at .719. It is not surprising that these two
financial variables were the most closely correlated with facility spending because the amount
of money the department has does dictate its ability to afford new and upgraded facilities.
Although the current arms race definitely reaches all divisions in college athletics, it was started
and remains concentrated in the high budget athletic departments. These institutions that do
spend the most on facilities are most often the departments with the largest amounts of
revenue and therefore large amounts of expenses as well. This study continued to back this
thought by correlations that showed a strong relationship between the two.
The correlations also showed that the Average Number of Wins in Men’s Basketball and
the Average US News & World Report Ranking were the least correlated at .190 and .264
respectively. This is interesting because it shows that facility spending does not necessarily

20
translate to winning men’s basketball games and that having a successful men’s basketball
program does not mean the university will spend more on facilities. The US News & World
Report Ranking not being highly correlated is not quite as surprising because this is an academic
ranking of the institution. This weak relationship does possibly show that institutions that are
highly ranked academically may not focus as much on athletic facility spending and the
institutions that are focusing on athletic facility spending may not be ranked as high
academically. This distinct split between the two; athletics and academics, may not be the case
at all institutions, but it is interesting to note. It was also interesting to note that of the three
sports that were studied here, football was the most highly correlated with facility spending.
This is congruent with what most people think of when they hear about the collegiate athletics
facilities arms race. The renovations to football stadiums like Texas A&M is completing, the new
stadiums like Baylor is building, the operations centers like Oregon revealed, and the practice
facilities like Florida State is working on raising funds for are all examples that back up why
football may be the more correlated sport to facility spending. The Average Number of Wins in
Football correlation was .533 and the Average Number of Home Contests in Football was .588.
This shows that institutions are most likely to receive a return on their investment in facilities
when dealing with football over any other sport. The amount of spending on football may
actually translate into some success on the field which is why there continues to be
improvements in facilities all over the country. Athletic departments believe these facilities will
attract better student-athletes, coaches, and will please large donors.
Another interesting correlation worth mentioning is that the Average Director’s Cup
Ranking was fairly highly correlated at .592. This shows that good performance by the entire
21
athletic department may result in more spending. This makes sense, because good
performance may lead to more donations to help fund a new facility, it may lead to more ticket
revenue, concession revenue, and merchandise revenue, or it may lead other revenue streams
that would allow for new facility investments. Finally, these correlations showed that there was
not a very strong relationship between the size of the athletic department variables or the
institutional variables and the facility spending variable. This was interesting because it showed
that the number of student-athletes may not be a reason to need a new facility even though it
may be intuitive to think that in some cases. It also shows that the university community itself
may not have all that much affect on what the athletic department spends on facilities.
Although this may not be so in the case of every institution, as a whole this data shows that the
university community and athletic department do mostly act separately when it comes to
spending on new facilities.
The information from the two regression analyses also provide many insights that help
reach this study’s objective. The first regression used Annual Debt Service on Facilities as the
dependent variable and the 14 other variables mentioned repeatedly in this paper as the
independent variables. This particular regression, being a step-wise regression, only keeps
relevant variables in the final model. This means it eliminated 11 variables that did not
contribute to predicting variance in the model. This was interesting because this model did
reject many of the variables that were highly correlated. It was interesting that both of the
football variables and the Director’s Cup Ranking variables did not contribute more to
predicting variances after seeing the correlations. It was not surprising at all, however, that
Annual Expenses was still in the model because of its very close relationship with the Annual

22
Debt Service on Facilities. It was also not surprising that the expenses variable predicted the
largest portion of the variances in facility spending, but the coefficient being as high as it was
(.943) is very interesting. It does make sense however, because a variance in expenses would
most likely move along with a variance in facility spending. Facility spending is an expense of
the athletic department so almost the entire model being able to be predicted by Annual
Expenses does make sense. These results are also interesting because the only other variables
that remained in the model, Average US News & World Report Ranking and Average Wins in
Men’s Basketball, were the least correlated. Their negative standardized beta coefficients’ is
intriguing because that says that as these variables decrease the amount of athletic facility
spending would increase. This is interesting because it appears that institutions that are highly
ranked academically may not spend as much on athletic facilities suggesting they are putting
more focus on their academic pursuits. It also appears from these numbers that a Men’s
Basketball program with more wins might actually decrease the spending within the
department. This is intriguing because intuitively it would make sense that a winning program
would encourage more spending whether to accommodate more fans, improve the student-
athlete experience, or other reasons. There were three sports included in this study and Men’s
Basketball is the only one that showed these results, indicating that Football and Women’s
Basketball winning programs are actually more related to facility spending. This could be
because football is obviously the revenue maker and women’s basketball represents a lot of the
spending institutions do to satisfy Title IX. These three variables together in this model were
able to predict 58.5% of the variance in facility spending, which means that the model would be
fairly relevant to use in predicting spending at a certain institution.
23
Annual Expenses
The second regression using Annual Expenses as the dependent variable and included
Annual Debt Service on Facilities with all the other variables as independent variables. This
regression was run because of how closely related the expense variable was to the facility
spending variable. This regression was extremely interesting because the four variables that
were kept in this model were able to predict 90.1% of the variance in Annual Expenses. Average
Director’s Cup Ranking, Annual Debt Service on Facilities, Average Home Contests in Football,
and Average Participants Women were the four variables that were left in this model. Again, it
makes sense that Annual Debt Service would be included because of how related the two are.
The home football game variable is interesting because of how expensive hosting a home
football game can be. It makes sense that the number of home games an athletic department
hosts a year can contribute to a variance in their expenses. Director’s Cup Ranking was actually
the variable the contributed the most however, with a standardized beta coefficient of .493.
This shows that successful athletic departments may spend more money as whole than the less
successful ones. Finally, this regression included Average Participants Women. While it was the
variable that contributed to the model the least, at .132, it was still more relevant than all the
other variables that were eliminated. This is interesting because it is not intuitive that this
variable would help explain variance in expenses. The number of women student-athletes in
the athletic department may influence the expenditures because of Title IX laws. Title IX forces
athletic departments to treat women fairly in regards to sports offered, scholarships, and types
of facility accommodations and this could force expenses to mirror the number of female
student-athletes. More female student-athletes would lead to a little more spending within the

24
department to make sure that the female student-athletes are having the same proportion of
money spent on them as the men are. This regression analysis provided much information that
athletic departments could use to help understand their spending habits better and make them
more aware of what could change as a result of adding or cutting expenses.
Limitations
As with any research study, there were some issues in this study that did affect the
results discussed earlier in this paper. There were several different types that must be detailed
in order to fully understand the scope and results of this study. None of these issues were
problematic enough to overwhelm the entire study, but they do deserve attention and full
disclosure.
First, the sample in this particular study is not completely representative. This study only
examined the correlations and data for 95 FBS Division I institutions. This sample can’t be
representative of every institution affected by the collegiate athletics arms race because it does
leave several major groups out. There are no private institutions involved in this study and
many of these are leading the charge in facility spending. Institutions like Stanford and
Southern California are always leaders in the facilities race and other private schools like Baylor,
who is currently building a new football stadium, are in the race as well. Division I schools that
don’t sponsor FBS football are not considered in this study either and many of them have also
contributed to the facility spending increase over recent years. Many of these schools spend a
lot of money on their basketball programs and more on other sports as well. Finally, this study
does not include any institutions that are not in Division I. The arms race in collegiate athletics

25
definitely started in Division I institutions but the facility spending has trickled down to the
other divisions as well. All of the data from these other types of institutions would have
undoubtedly also offered very interesting results and more conclusions about facility spending
in college athletics. The fact that these institutions were not included in this study does mean
that the results found here cannot be generalized for the smaller division or private institutions.
Next, not all of the data used in the averages that were run through the analysis were
completely standardized. This is true because some of the averages were taken using less than
six years of data instead of all six years that this study represents. There were some holes in the
data in a few variables where the information was missing. In this case the average of that
variable for that specific institution was found by taking the average over the number of years
that information was available. This still produced an average to use for that institution but this
could be a limitation because most of the averages within the variables were found using all six
years of data.
A limitation of this study was that there has not been a lot of prior research similar to
this. This fact made it hard to replicate anything else that has been done and therefore this
study was exploratory in nature. There is plenty of research out there about the amount of
spending on facilities in college athletics and research about how institutions are planning on
spending money on facilities. There are also plenty of opinions about the amount of money
being spent on athletics and facilities specifically. Although all of this research and information
exists, there is not much empirical data about what variables contribute to the amount of
spending. This fact may lend to the need for more research on this subject in order to allow

26
athletic departments along with the general public to be more informed about facility spending
and what is really happening in this current collegiate athletics arms race.
The fact that all the data used in this study was believed to be true is another limitation.
There is no reason to believe that any of the information would not be accurate, but since all
the data is secondary data there is a chance that some data may not be. Much of the data used
in this study relied on self-reporting from the institutions. This does leave a chance that there
was some bias in the reporting; that the school reported a number that would benefit them the
most. All of the data was investigated more than once and nothing stuck out as being off base,
but because none of the data is from primary research there is a chance that something could
be wrong.
Another issue with this study is that it is limited by the fact that the variables only
represent three sports. These Division I FBS institutions have to sponsor at least 16 sports and
all of the sports use athletic department funds; not just football, men’s basketball, and
women’s basketball. There are many institutions that actually bring in revenue from baseball,
for example, and they spend money on facilities for baseball as well. Using data from other
sports could have changed results that were reported previously or could provide insight into
more factors that affect spending on facilities. Although this issue does not affect any of the
data in this study, it did need to be disclosed just to allow full understanding of the scope of this
particular study.
The final limitation in this study is that the data used was only available up to the year
2011. The financial data based on fiscal years and other institutional reports were only accurate

27
and complete through the 2011 fiscal year. Although the information from the years 2006-2011
was very informative and provided results and analysis, there could potentially be different or
more conclusions drawn from newer data. It is also worth noting that the years 2006-2011 fell
during the US Financial Crisis which did constrain spending at most institutions across the
country. The data from the last three years may paint a different picture because a lot of the
country is recovering from that financial crisis, meaning that there has been much more money
spent and more facilities built since that time. The data and results that this study presents are
accurate but it may be out of date soon, if not already, based on new information from the last
three years as well. There are limitations in any research study and these mentioned are the
most pressing ones in this particular study.
Future Research
The research conducted in this study and the results from the data provided a different
look at facility spending in collegiate athletics. It is research that athletic departments can use
to make a more informed decision when deciding whether to invest in a new facility. They can
now see how that spending could affect all of the other variables that were discussed; from
revenue and expenses to participation numbers and Director’s Cup Rankings. This study is a
beginning point, there is much more research that can be done regarding this issue in the
future.
It would be worth it for this research to be repeated again using different variables.
There are other important variables within an athletic department; whether its conference
affiliation, television deals, merchandise sales, etc. Being able to understand the relationships
28
between facility spending and other relevant variables would only increase the information
available to athletic departments when they began to consider a new facility.
Also, there could be studies completed that emphasize facility spending in terms of how
the money is being spent. For example, the amount of spending could be broken down into
spending on football facilities versus all other sports. Then see how other variables are related
to the spending just on football and look at the relationships between the variables and the
facility spending not related to football. You could also break the spending into competition
versus non-competition facilities or even revenue producing facilities versus non-revenue
producing facilities. Football and basketball practice facilities and student-athlete academic
centers, while very practical and important, are not directly producing any revenue or hosting
any competitions. These kinds of distinctions among the spending could show a different set of
conclusions based on the money spent to create more money or the money spent to benefit
the student-athletes and program itself.
Finally, further research could also be conducted which emphasize other sports. This
study only looked at football, men’s basketball, and women’s basketball as related variables but
it is extremely possible that other sports would also be related to spending. Baseball and
Hockey are two great examples because there are several institutions across the country that
have spent large amounts of money on new baseball stadiums, baseball practice facilities, and
even separate hockey facilities. These sports’ performance measures and facility usage
measures could potentially affect facility spending and certainly warrant future research on the
issue.

29
There are many different studies that could be pulled out of the results that this study
provided that would provide even more understanding of the facility spending in collegiate
athletics. There should be continued research on this matter, incorporating the ideas
mentioned above or other relevant ideas. All of this research will continue to provide a
different way of looking at facility spending and increase the understanding that athletic
departments and the general public have about the facilities arms race that has garnered so
much attention in recent years.

30
Bibliography
2013-14 NCAA College Basketball Standings - ESPN. (n.d.). Retrieved from
http://espn.go.com/mens-college-basketball/standings
2014 Women's College Basketball Standings - ESPN. (n.d.). Retrieved from
http://espn.go.com/womens-college-basketball/standings
America's best colleges (2006 ed.). (2005). Washington, D.C: U.S. News & World Report.
America's best colleges (2007 ed.). (2006). Washington, D.C: U.S. News & World Report.
America's best colleges (2008 ed.). (2007). Washington, D.C: U.S. News & World Report.
America's best colleges (2009 ed.). (2008). Washington, D.C: U.S. News & World Report.
America's best colleges (2010 ed.). (2009). Washington, D.C: U.S. News & World Report.
Best colleges (2011 ed.). (2011). Washington, D.C: U.S. News & World Report.
College Athletics Departments Are Breaking Even, After Shelling Out TV Money On Salaries and
Lavish Facilities | The Big Lead. (n.d.). Retrieved from
http://thebiglead.com/2013/05/09/college-athletics-departments-are-breaking-even-
after-shelling-out-tv-money-on-salaries-and-lavish-facilities/
College football -- Facilities arms race proves recession-proof - ESPN. (n.d.). Retrieved from
http://espn.go.com/college-football/story/_/id/8047787/college-football-facilities-
arms-race-proves-recession-proof
Colleges? Athletics Arms Race Is for Losers - Bloomberg View. (n.d.). Retrieved from
http://www.bloombergview.com/articles/2013-12-27/colleges-athletics-arms-race-is-
for-losers
Clotfelter, C. T. (2011). Big-time sports in American universities. Cambridge: Cambridge
University Press.
Custom Reporting Results | Athletic & Academic Spending Database for NCAA Division I. (n.d.).
Retrieved from http://spendingdatabase.knightcommission.org/reports/0e149f0f

31
Dick Harmon: Are we spending too much money on college football? | Deseret News. (n.d.).
Retrieved from http://www.deseretnews.com/article/865591845/Are-we-spending-
too-much-money-on-college-football.html?pg=all
Dosh, K. (2013). Saturday millionaires: How winning football builds winning colleges.
EADA Download Data Files. (n.d.). Retrieved from
http://ope.ed.gov/athletics/GetDownloadFile.aspx
End Athletics Arms Race. (n.d.). Retrieved from http://centerforcollegeaffordability.org/25-
ways/use-fewer-resources/end-athletics-arms-race
Football's facility arms race: Can you top this? - NBC Sports | NBC Sports. (n.d.). Retrieved from
http://www.nbcsports.com/college-football/footballs-facility-arms-race-can-you-top
For local colleges, athletic facility improvement has become a big-money "arms race" |
MLive.com. (n.d.). Retrieved from
http://www.mlive.com/sports/saginaw/index.ssf/2012/04/for_local_colleges_athletic_
fa.html
JIIA - 2013 Issue. (n.d.). Retrieved from http://csri-jiia.org/back_issues/back_issues_2013.html
Jozsa, F. P. (2013). College sports Inc: How commercialism influences intercollegiate athletics.
New York, NY: Springer.
Knight Commission on Intercollegiate Athletics - Chapter 2: Expenses. (n.d.). Retrieved from
http://www.knightcommission.org/collegesports101/chapter-2
Knight Commission on Intercollegiate Athletics (2009). Construction in college sports: An arms
race? In College Sports 101: A Primer on Money, Athletics, and Higher Education in the
21st Century (pp. 16-17).
McEvoy, C. D., Morse, A. L., & Shapiro, S. L. (2013). Factors Influencing Collegiate Athletic
Department Revenues. Journal of Issues in Intercollegiate Athletics, 2013(6), 249-267.
Retrieved from http://csri-
jiia.org/documents/puclications/research_articles/2013/JIIA_2013_6_14_249_267_Coll
ege_Revenues_Factors.pdf

32
NACDA OFFICIAL ATHLETIC SITE - Directors Cup. (n.d.). Retrieved from
http://www.nacda.com/directorscup/nacda-directorscup-previous-scoring.html
NCAA college athletics department finances database â?? USATODAY.com. (n.d.). Retrieved
from http://usatoday30.usatoday.com/sports/college/story/2012-05-14/ncaa-college-
athletics-finances-database/54955804/1
NCAA College Football Teams - ESPN. (n.d.). Retrieved from http://espn.go.com/college-
football/teams
NCAA Rule Changes Open Door For Escalation Of College Athletics Arms Race - Forbes. (n.d.).
Retrieved from http://www.forbes.com/sites/jasonbelzer/2013/01/21/ncaa-rule-
changes-open-door-for-escalation-of-college-athletics-arms-race/
NCAA Sports Sponsorship. (n.d.). Retrieved from
http://web1.ncaa.org/onlineDir/exec2/sponsorship?sortOrder=0&division=1A&sport=
MFB
New Alabama Football Facility Pictures - Business Insider. (n.d.). Retrieved from
http://www.businessinsider.com/alabama-football-facility-pictures-2013-7?op=1
New Oregon Football Building Photos - Business Insider. (n.d.). Retrieved from
http://www.businessinsider.com/new-oregon-football-building-photos-2013-7
The Research Problem/Question - Organizing Your Social Sciences Research Paper - LibGuides at
University of Southern California. (n.d.). Retrieved from
http://libguides.usc.edu/content.php?pid=83009&sid=618412
Vogt, W. P. (2005). Dictionary of statistics & methodology: A nontechnical guide for the social
sciences. Thousand Oaks, Calif: Sage Publications.