the arecibo pisces-perseus supercluster...
TRANSCRIPT

The Arecibo Pisces-Perseus Supercluster Survey
1
UAT 16.06
Martha Haynes
Cornell University
UAT 06.16
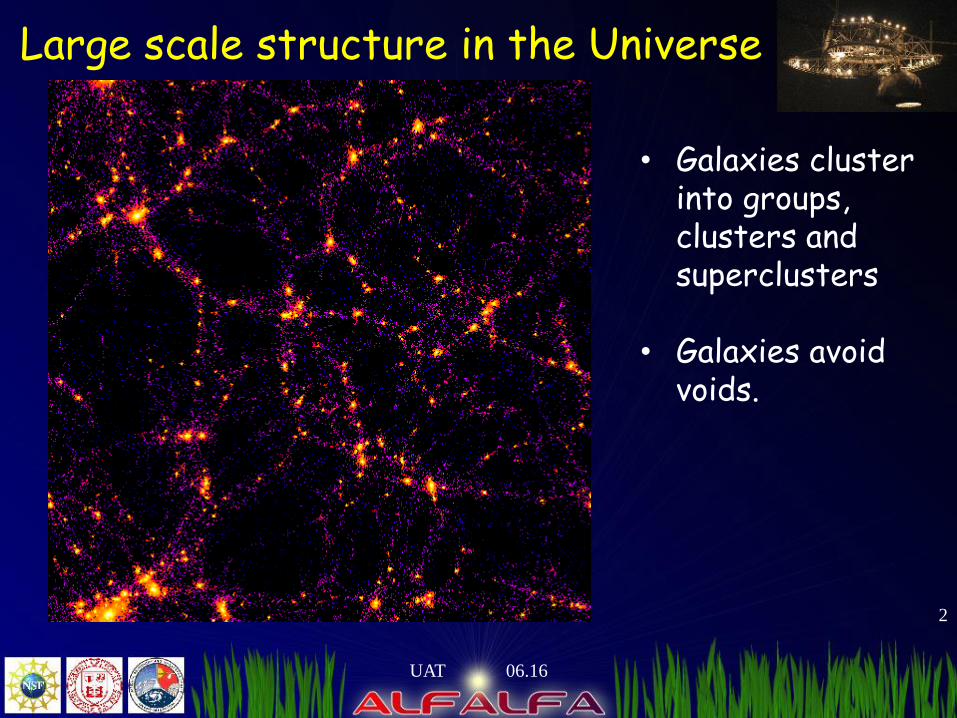
Large scale structure in the Universe
2
UAT 06.16
• Galaxies cluster into groups, clusters and superclusters
• Galaxies avoid voids.

time
• Do cosmological models predict this behavior?
• Can they give us any insight into how and why this structure develops?
• How did the structures we see today form and evolve?
Large scale structure
UAT 06.16
4
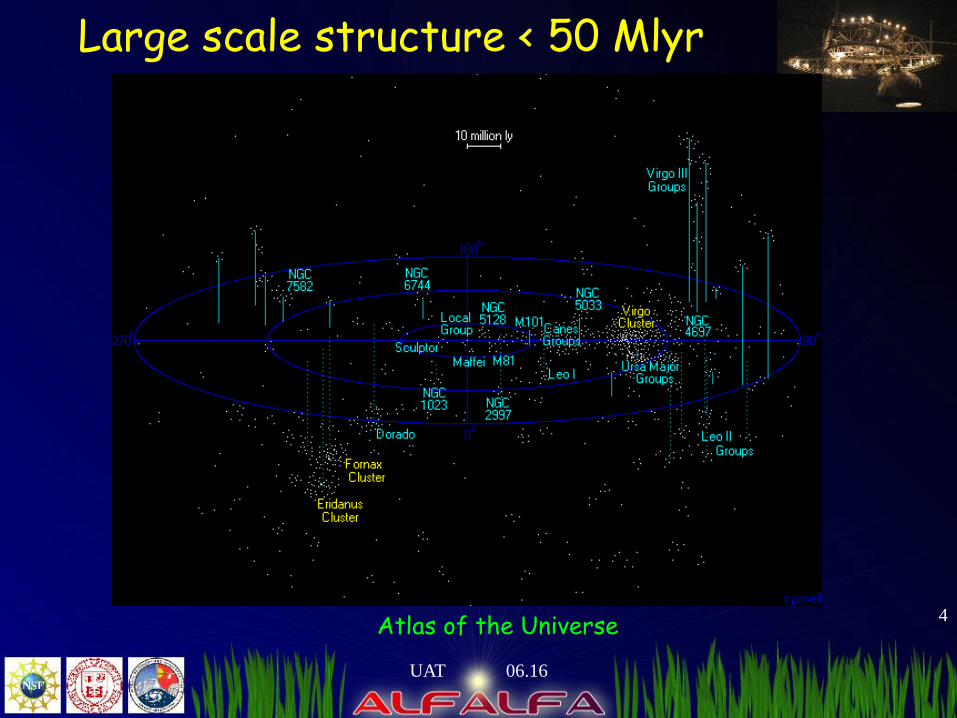
Large scale structure < 50 Mlyr
Atlas of the Universe

UAT 06.16
5
Large scale structure < 1 Glyr
Pisces-Perseus Supercluster
“A Metagalactic Cloud between Perseus and Pegasus”Bernheimer (1932 Nature)
Atlas of the Universe

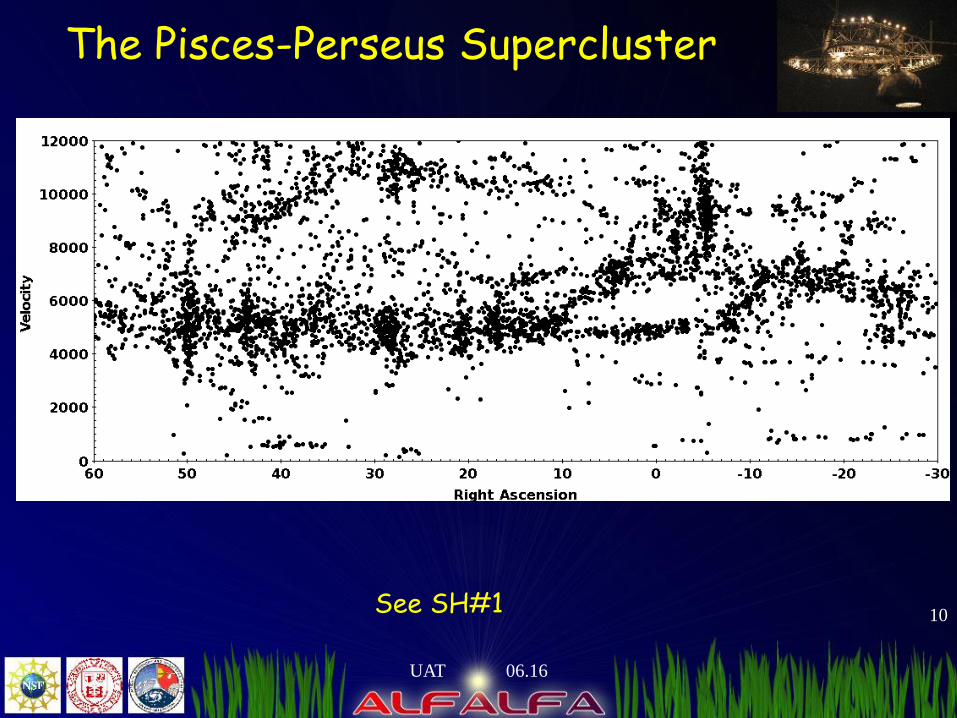
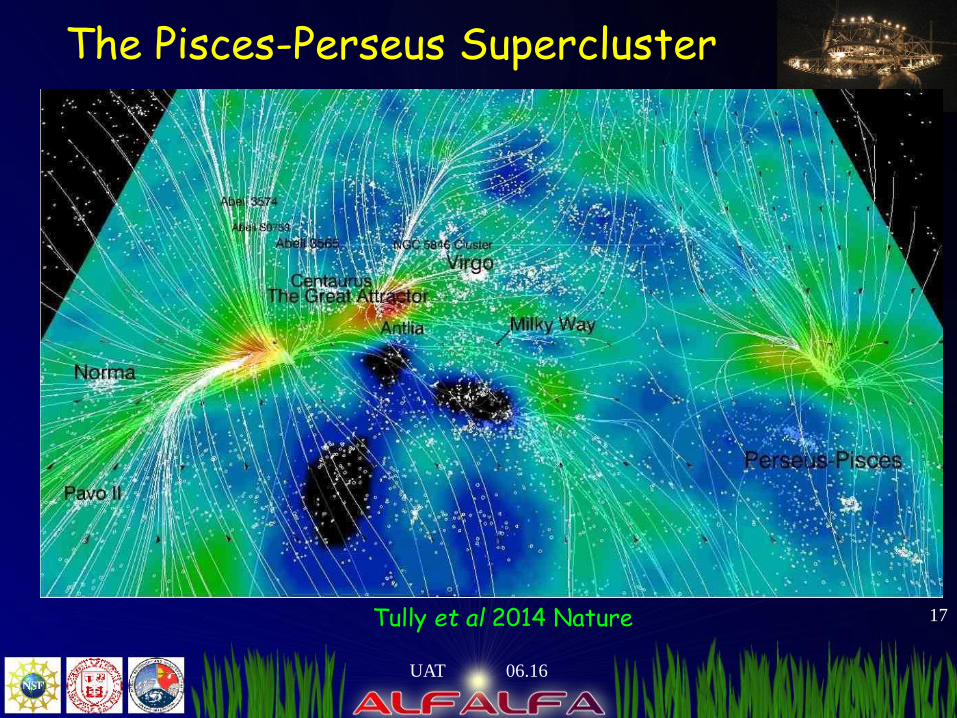
The Pisces-Perseus Supercluster
6
UAT 06.16
Tully et al 2014 Nature 513, 71
Tully et al 2014 Nature

UAT 06.16
7Atlas of the Universe
The Pisces-Perseus Supercluster

UAT 06.16
8Atlas of the Universe
The Pisces-Perseus Supercluster

The Pisces-Perseus Supercluster
9
UAT 06.16
See SH#1
The Pisces-Perseus Supercluster
10
UAT 06.16
See SH#1

The Pisces-Perseus Supercluster
11
UAT 06.16

Main clusters/groups in PPS
12
UAT 06.16
See SH#1

Smooth Hubble Flow
13
UAT 06.16
• The dominant motion in the universe is the smooth expansion, known as the Hubble Flow.
• Cosmological principle: On large scales, the universe is homogeneous and isotropic.
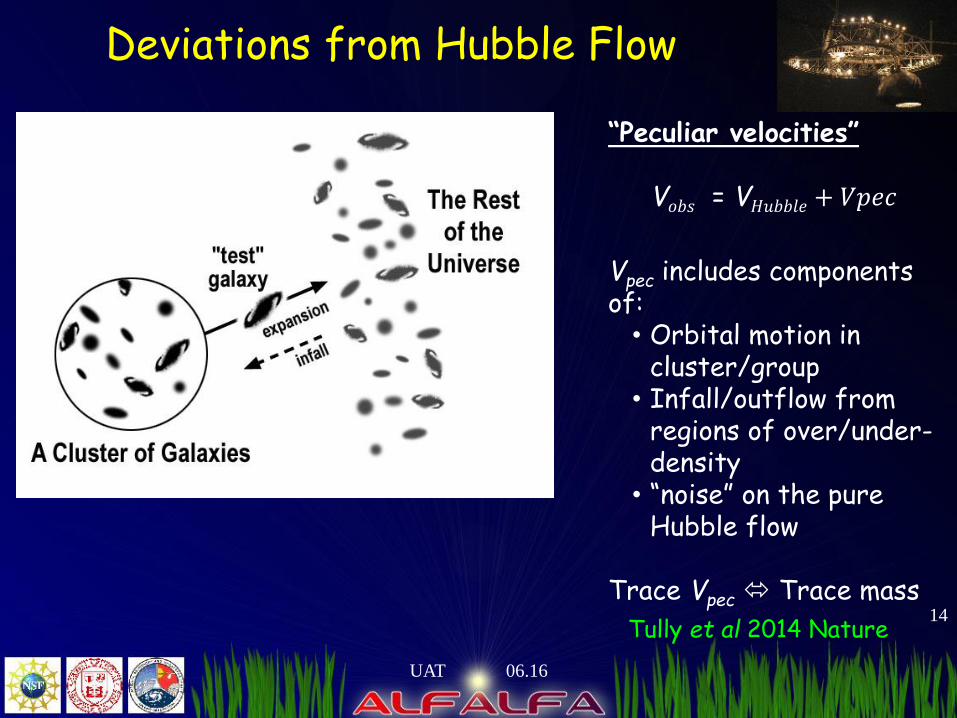
Deviations from Hubble Flow
14
UAT 06.16
“Peculiar velocities”
V𝑜𝑏𝑠 = V𝐻𝑢𝑏𝑏𝑙𝑒 + 𝑉𝑝𝑒𝑐
Vpec includes components of:• Orbital motion in
cluster/group• Infall/outflow from
regions of over/under-density
• “noise” on the pure Hubble flow
Trace Vpec Trace mass
Tully et al 2014 Nature

Deviations from Hubble Flow
15
UAT 06.16
“Peculiar velocities”
V𝑜𝑏𝑠 = V𝐻𝑢𝑏𝑏𝑙𝑒 + 𝑉𝑝𝑒𝑐
Vpec includes components of:• Orbital motion in
cluster/group• Infall/outflow from
regions of over/under-density
• “noise” on the pure Hubble flow
Trace Vpec Trace mass
Tully et al 2014 Nature

“Peculiar velocity: field => mass
16
UAT 06.16
“Peculiar velocities”
V𝑜𝑏𝑠 = V𝐻𝑢𝑏𝑏𝑙𝑒 + 𝑉𝑝𝑒𝑐
Vpec includes components of:• Orbital motion in
cluster/group• Infall/outflow from
regions of over/under-density
• “noise” on the pure Hubble flow
Trace Vpec Trace mass
Tully et al 2014 Nature
The Pisces-Perseus Supercluster
17
UAT 06.16
Tully et al 2014 Nature

Velocity field from CosmicFlows
18
UAT 06.16

Measuring peculiar velocities?
19
UAT 06.16
“Peculiar velocities”
V𝑜𝑏𝑠 = V𝐻𝑢𝑏𝑏𝑙𝑒 + 𝑉pec
V𝐻𝑢𝑏𝑏𝑙𝑒 = Ho D
Vpec = Vobs – Ho D
• Observe the recessional velocity
• Measure the distance by a redshift-independent method
• Estimate the Hubble velocity expected for a galaxy at that distance.
• The difference between the observed and expected recessional velocity is the peculiar velocity.
The method we use to estimate the distance depends on:• the type of galaxies we study;• their distance from us;• how accurate we need the distance to be;• the investment of telescope time needed to achieve the
result.

Tully-Fisher relation
20
UAT 06.16
Tully & Fisher, 1977, A&A 54, 661 http://burro.astr.cwru.edu

Tully-Fisher relation
21
UAT 06.16
Tully & Fisher, 1977, A&A 54, 661 http://burro.astr.cwru.edu

Tully-Fisher relation
22
UAT 06.16
Tully & Fisher, 1977, A&A 54, 661
• Observe the HI 21 cm emission profile:• Measure Vobs
• Measure Wobs (width of 21 cm profile)
• Obtain an image of the galaxy• Measure total brightness
(apparent magnitude m)• Measure the apparent axial
ratio b/a
• Make lots of corrections to get rotational velocity and absolute magnitude
• Use TFR to get distance
UAT 06.16
23
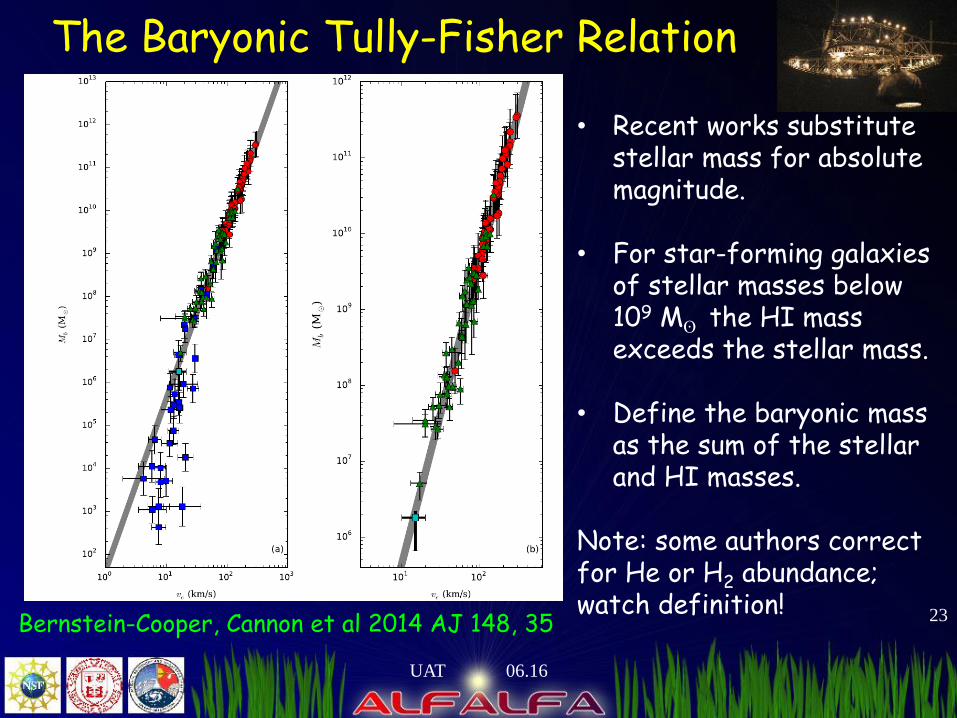
The Baryonic Tully-Fisher Relation
Bernstein-Cooper, Cannon et al 2014 AJ 148, 35
• Recent works substitute stellar mass for absolute magnitude.
• For star-forming galaxies of stellar masses below 109 Mʘ the HI mass exceeds the stellar mass.
• Define the baryonic mass as the sum of the stellar and HI masses.
Note: some authors correct for He or H2 abundance; watch definition!
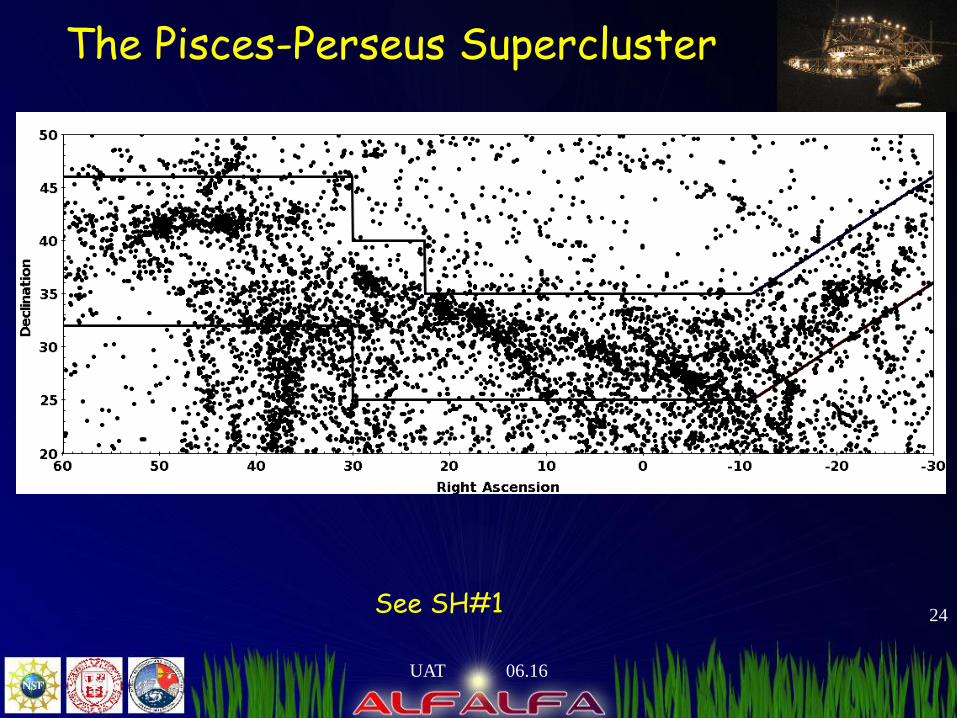
The Pisces-Perseus Supercluster
24
UAT 06.16
See SH#1

The Arecibo Pisces-Perseus Supercluster Survey
25
UAT 06.16
• Aims to measure the infall/backflow into PPS using the BTFR
• In addition to ALFALFA, more galaxies!
• Mike Jones (almost) PhD

The Arecibo Pisces-Perseus Supercluster SurveyThe APPS survey or the APPSS
Mean overdensity over the vHelio range (4000,8000) produced by interpolating between 2MRS overdensity map points (Erdogdu+ 2006)
The black dotted rectangle outlines our target area:22h < RA < 3h and +23 < Dec < +35

The Arecibo Pisces-Perseus Supercluster SurveyThe APPS survey or the APPSS
Cone diagram
ALFALFA (blue)
Optical (red)
LBW (green)

Filaments in the Illustris Simulation
28
UAT 06.16
Here is an example of a filament in the Illustris simulation

Filaments in the Illustris Simulation
29
UAT 06.16
Here is the expected infall and backflow around that filament.

APPSS Survey Objective
• Measure BTFR distances and peculiar velocities to a large sample of galaxies in the PPS
• Look for infall and backflow onto the PPS overdensity
• Measure the mass per unit length of the supercluster.
• Compare the result to the predictions of numerical simulations.
UAT 06.16
30

Measuring Infall onto PPS
31
UAT 06.16
• Peculiar velocity measurements are tricky because of all the corrections that have to be made.
• The uncertainty in the BTFR distance on an individual galaxy is probably 25-30%. For a distance of 5000 km/s, that is a velocity error of > 1000 km/s!
• We need to be able to average/bin galaxies to reduce the uncertainty.
• We need more galaxies with BTFR distances!
• Comparison with simulations will allow us to place limits on the results, in the presence of uncertainty, sample bias, and statistics.

APPSS LBW proposal• Explore fainter SDSS/GALEX objects which are very blue and
have sample range of AbsMag, r_d, SB => are they in the volume or not?• Identify PPS targets meeting SDSS spectroscopic sample and
blue (NUV-r), but not in a.70• Conduct LBW survey of these targets
• Measure HI flux densities, recessional velocities and velocity widths
• Measure magnitudes and axial ratios of detections• Calculate stellar masses and inclinations• Calculate baryonic masses (stars+gas)• Calculate rotational velocities (corrected for inclination)
• Explore dependence of HIMF/WF across range of environments sampled
• Using BTFR to measure infall onto PPS ridge
UAT 06.16
32
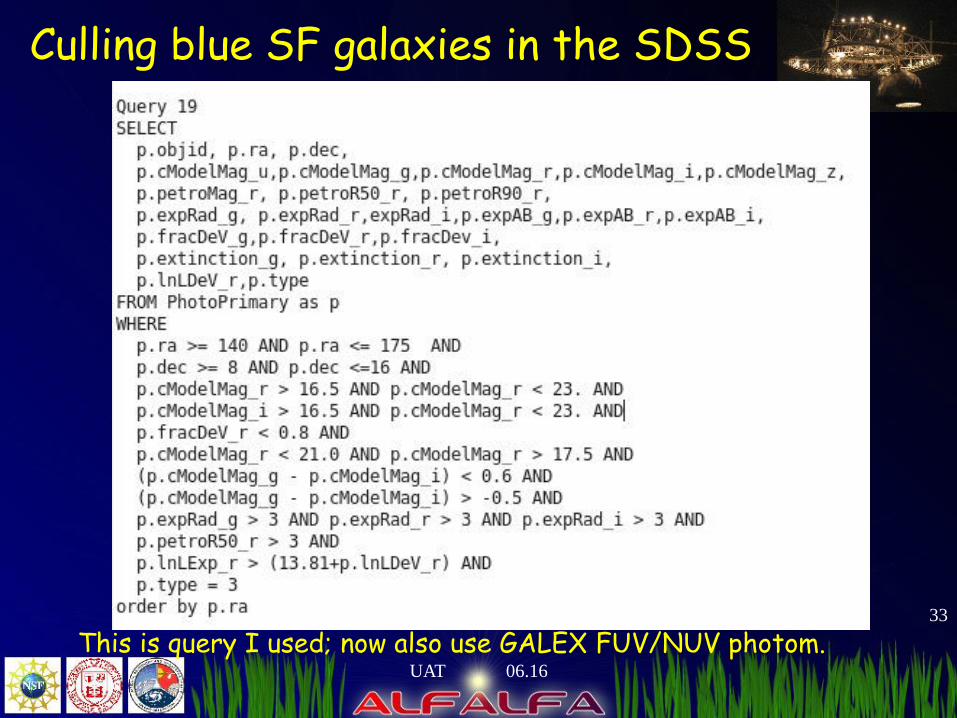
This is query I used; now also use GALEX FUV/NUV photom.UAT 06.16
33
Culling blue SF galaxies in the SDSS

• Query returns a lot of lsb, blue galaxies but also bogus objects.
• Further refinement GALEX+examination to pick best targets
• Our LBW observtionsshow than in fact, many of these objects are actually in target redshift range!
• More observations coming (we hope!)
UAT 06.16
34
APPSS results

The Arecibo Pisces-Perseus Supercluster SurveyThe APPS survey or the APPSS