the aquatic system comprises a great biodiversity ...apjor.com/files/1470915157.docx · web...
TRANSCRIPT

HPLC-DETECTED PHYTOPLANKTON PIGMENT PROXIES - A CONTRIVANCE FOR PROMPT FORTITUDE OF PHYTOPLANKTON COMPOSITION AND ECOLOGICAL
RECONSTRUCTIONDr.Aneeshkumar Narikkatan* and Dr.Sujatha C.H
Department of Chemical Oceanography,
Cochin University of Science and Technology
Cochin 682016
Corresponding Author: Dr.Aneeshkumar Narikkatan
* Central Ground Water Board
Ministry of water recourses
NWHR, Jammu 180004
Email: [email protected]
Contact No : 09419210601
Abstract: Fossil pigment distribution and their chemotaxonomy with respect to phytoplankton
biomass and hydrological background were analyzed in the sediments collected from in Cochin
back water systems by HPLC. Higher order association of the individual Pigment, PSC, PSP,
PPC and Bio mass proportion calculated. The picoplankton communities add significantly to the
estuarine biomass structure whereas micro plankton appears to be most abundant in
anthropogenic affected area. The systems were classified into allochthonous vs. autochthonous
using total chlorophyll derivative to total carotene (CD/TC) ratios. A vertical profile of the Ch a,
its degradation pigments, carotene and their ratios were find out vertically at the depth of 6 cm.
Key Word: HPLC, Phytoplankton, Marker pigments, Sediments, Ecology.
1.1 Introduction
The quality and intensity of the factors and processes influencing the aquatic ecosystem,
and their consequences are extremely complicated they causes high temporal and spatial
variability both in the chemical and biological characteristics of water masses. Thus, it is very
rarely possible to reconstruct the exact state of past ecosystems by means of short-term
monitoring data. Palaeorecords in estuarine sediments can be used for recording long-term
changes in land-use which includes biological, geochemical and lithological information stored
in accumulative deposits over certain time periods (Chambers, 1993; Leavitt, 1993; Hassan et
al. 1997; Lami et al.1997). An understanding of the phytoplankton biomass- A fundamental
importance for the biology and its contributing pattern with respect to the behavioral chemistry of
nutrients, organic matters (O M) like carbohydrate and proteins would provide a pre requisite
1

knowledge for the biogeochemical process occurring in the Cochin estuarine system. The
phytoplankton biomass comprises of carotenoids, phytopigments (chlorophyll a, b and c) and its
degraded products. Often carotenoids and chlorophylls are the only fossil remains of
nonsiliceous algae and bacteria and are therefore of considerable value to palaeoecology and
palaeolimnology as an indicator for chemotaxonomic or photo physiological studies ( Barlow, 1993;
Claustre et al.1994) . Higher order association of the individual pigment (sums and ratios) permits the
formulation of variables that are useful to different perspectives. The pool of photosynthetic (PSC) and
photo protective carotenoids (PPC) are key steps for both photo physiological studies and total
amount of accessory (non-chlorophyll a) pigments (TAcc) are useful in remote sensing investigations
(Trees et al. 2000). Accessory pigments have either photosynthetic properties allowing the
phytoplankton cells to increase their light harvesting spectrum or a role of photo protection in
dissipating the excess of light energy received and reducing the oxidation that takes place due to
stress in conditions of strong irradiance. The ratios that can be derived from these pooled variables,
e.g. [PSC]/ [TChl a] are dimensionless and have the advantage for automatically scaling the
comparison of results from diverse environs.
Very little information is available on these aspects for their change in the back waters
characters and the neritic zones. Since in estuarine environments, phytoplankton is
quantitatively the second source of particulate organic matter after terrestrial inputs from soil
erosion which supply the highest quality food source and constitutes premier basis of the
estuarine food web. The present study aims to investigate the inference featured in the morpho
- dynamic system of the Cochin estuary to provide evidence for the influence of various
circulation features on phytoplankton community structure in terms of pigment biomarkers using
high-performance liquid chromatography (HPLC). Furthermore it aim in addressing the
relationship between phytoplankton community structure and the balance between regenerated
and new production in the various identified circulation features using a combination of pigment
data and photosynthetic activity data.
2 MATERIALS AND METHOD2.1 Study areaThis research article focuses on the Cochin backwaters situated on the south-west coast of
India from the northern extension (9040’ to 100 10’ N and 760 13’ to 760 50’ E) of the Vembanad
lake along the Kerala coast (figure 1). All the sites have been influenced by anthropogenic
nutrient inputs from varies sources and have frequently monitored and recorded the past five
decades. Each location represents a unique depositional environment with regards to
preservation conditions which make them ideal sites for studying the biomarker pigments and its
2

application. The backwater system covers an area of approximately 300 km2 with one
permanent bar mouth maintained at 12m depth at Cochin and two seasonal openings during the
peak monsoon period. The estuary is wide (16 km) in the Vembanad lake area and several
narrow canals carry along with water flow municipal waste and other particulate organic matter
and empting into it. Several major rivers Periyar, the Muvattupuzha and Pampa discharge fresh
water into the estuarine system. This estuary is classified as a tropical positive estuary and
character is influenced by the rivers flowing into it including the strong tidal currents. Both these
phenomenon characterizes the hydrological conditions of the estuary. Vallarpadam is situated
next to Bolgatty Island on the west, and linked to the Ernakulum mainland via the Goshree
bridges. It is about 3.5 km in length in north-south direction and hosts a population of 10,000
people. Vallarpadam is 1 km away from Ernakulum mainland. Cochin harbor is a major natural
harbor.
Based on the salinity characteristics of the surveyed area, stations 1 to 7 are grouped
into three zones (Table 1). Zone a (station S1) is the riverine zone, where the salinity remains
less than 1ppt throughout the year i.e. remains as freshwater zone. Zone B (stations S2, S3 &
S4) is partially estuarine in character and saline in the pre- monsoon season. The stations in
these zones are canals and tributaries which are in the vicinity of industries and markets.
Stations S5, S6 & S7 grouped together as zone C, becomes saline in the pre-monsoon and
post-monsoon seasons and acts as a sink for the discharges from the Pampa and, Vembanad
rivers, along with effluents from the municipal and industrial wastes from the Cochin City.
Sample collection were made bimonthly from November 2005 to September 2007,
surface water sample were collected approximately 5 cm below the water surface. Bottom
samples were collected approximately 25 cm above the sediments. The depth at each sampling
site varied throughout the year depending on the season and tide, the intervals observed were
(S1) 5-10 m , (S2) 0 to 0.5 m ( only surface sample ) (S3) 1to 2m, (S4) only surface sample (S5)
2- 4 m , (S6) 3- 7m (S7) 1- 5 m. The highest water level was found in the monsoon season and
lowest in the pre-monsoon. Water samples grabbed from the sites using Niskin sampler.
Sediment samples were collected at four distinct locations of CBWS by using a Van Veen Grab
sampler and the samples were immediately packed into special plastic cooling boxes and
transported to the laboratory for preservation at -20oC till analyses. Sediment samples for
pigment analysis were collected during peak summer using a stainless steel corer. Samples
were analyzed with a minimum 8 cm through the core and stored in pre cleaned polyethylene
bags for processing and transferred to the laboratory and preserved at 4oC. The sediment
samples for pigment analysis were immediately transferred to 15 ml vials kept in ice bags in the
3

dark and then stored in a -70oC freezer to render them more stable ( Yacobi et al. 1990).
Finally transferred for preservation under -80oC (SANYO Ultra low MDFU-3086 maintained at -
80oC) and then directly freeze-dried in Viotis BENCHTOP-2K SI 213489 Lyophilizer) at -40oC, 6-
8 hrs. All field and laboratory work was carried out in subdued light to minimize pigment
degradation. Color, odor, taste and pH were noted at site. Sample for physico chemical analysis
was treated and analyzed according to Standard method (Standard methods 1995; Grasshoff et
al. 1999).
2.2 Phyto - Pigment Extraction and HPLC Analysis
Total carotenoids and chlorophyll with their degradation products were determined by
spectophotmetric method (Parsons, 1984). The sediment sample after collection was stored at
-80oC until analysis. The freeze dried samples were homogenized prior to sub sampling. After
weighing (approx 0.1mg) each sub sample was extracted in 95% acetone with internal standard
(vitamin E) sonicated in an ice cold sonication bath for 10min, mixed on a vortex mixer allowed
to extract at 4oC for 20hr and vortexed again. Extracts were then filtered through 0.2μm teflon
syringe filters to remove cell and filter debris, transferred to HPLC vials and placed in the
cooling rack of the HPLC. 357 μl buffer and 143 μl extract were injected on the HPLC
(Shimadzu LC-10A HPLC System with LC solution software) using a pre treatment program.
The adapted HPL method was described earlier (Hooker et al. 2005) not separating -β
carotene. The detection wave length was 420 and 450 nm and the flow rate was 12.5μl min -1.
Identification was based on the retention time and peak shape i.e. through fingerprint matching
with known peak shape from the diode array spectral library created by running pure standard of
individual pigments ( DHI group Denmark). The concentrations of the pigments were computed
from the peak areas.
3. Result and discussion3.1 Hydrological back ground During the observation period, the bathymetry of the water body indicates that depth variation
occurs between 1.5 m and 6.0 m in most parts except the dredged channels which are
maintained at 10–13 m deep. The hydrographical conditions of the CBWS are greatly influenced
by seawater intrusion and influx of river water as indicated by the distribution of temperature and
salinity at surface and bottom (0.25 m above the estuary bed). There are three pronounced
seasonal conditions prevailing in this estuary, i.e. monsoon (June–September), post-monsoon
(October–January) and pre-monsoon (February–May). During the monsoon period the region
receives about 290-320 cm rainfall annually, of which, nearly 60% occurs during the southwest
monsoon season and the rest fall on north east monsoon. The estuary is connected to the
4

Arabian Sea at two locations, Cochin (Latitude 9°58′ N) and Azhikode (Latitude 10°10′ N) during
December to April, a salinity barrier at Thanneermukkom virtually cuts off the tidal propagation
further south and modifies the circulation in the remaining part of the estuary. The onset date
and duration of the southwest monsoon vary from year to year and the quantity of rainfall
contributes to the variability of the estuarine water levels and flow. It is recognized that the water
quality plays an important role in selecting the phytoplankton community. Zone A is situated at
upstream has the recorded lowest salinity in the study area and a fresh water zone 0.01- 0.12
(avgas 0.07). Zone B designated in the back water zone where the salinity ranges from 0.02 to
13.97 (avg1.79). While in the seaward end of the study area the estuary, salinity ranges
between 0.1 and 35.64 (avgas 16.8). The highest salinity was recorded at pre and post
monsoon and the salinity decreases with the onset of monsoon and became poorly fresh water
in character. pH drops up to 5.42 ( river), 5.92 ± 0.3 (back waters) and 6.14 ± 0.5 ( estuary )
and increased to 8.16 ± 0.2 , river ; 7.20 ± 1.2 , back waters and 8.3 ± 0.2 in estuary. This
trend creates an alkaline behavior at pre monsoon and monsoon. Lowest pH 5.34 (October) and
highest pH 8.5(August) was found wing to the immediate monsoon onset at Zone B and C. High
acidic or alkaline effluents may release from the various neighboring industries located in the
proximity of Zone B in the rain fall time and there is a pH recovery was eminent in pre monsoon.
DO content in the study varies from 1.28 to 8.0 mg/L. Lowest oxygen was recorded in
pre monsoon thereafter a recovery of DO was observed in the Post monsoon season due to low
water temperature and considerable growth of algae, which may release appreciable amount of
oxygen as a result of photosynthetic activities. Dilution of sewage and deposition of organic
material in the lower reaches of canal and estuarine openings resulting in the lowering of
oxygen content in surface water during monsoon in Zone B.
Zone A has lowest nitrate whereas Zone B & C recorded the highest. A net addition of
nutrients in monsoon and post monsoon and a net removal in pre-monsoon was observed.
Earlier studies support this drift (De Sousa et al. 1981). Among these locations, sites S2 is
located near by a fish market and slaughtering units and always prone to higher nutrient
enrichment with high anthropogenic discharges (> 1.2 mg/L) irrespective of season. Spatially
nitrite ranges from not detectable level to 0.6mg/L. An increase of nitrate concentration from
river, back water then to estuary was noted. Highest value was reported at (S2) and S4 with low
O2 (<4.0 to 1.28 mg/L) with a foul smell during summer and winter season due to anthropogenic
pollution. High NO3 content was observed in this station indicating an upward mixing and
displacement of NO2- to NO3
- completely. Phosphate content showed highest in back waters
than in the estuary and least in the riverine samples. The lowest value is viewed at Muvattupuza
5

(S1) and highest > 4.0 mg/L was at Champakkara - a back water site. Champakara (S2) as
mentioned earlier is a direct anthropogenic effected area which has recorded highest PO4
concentration (4.4 mg/L) throughout the study period. Phosphate showed maximum in the pre
monsoon than in the monsoon and lowest was accounted in the winter season. It was observed
that generally the nutrients were more enriched at the surface than in the bottom and often
these nutrient availability in the water column were not fully utilized by the phytoplankton and
high concentration detected in the surface column. Similar observation reported earlier that that
higher productivity in bottom waters in these tropical waters and low concentration of nutrients
at bottom layer in the same study area (Gopinathan et al. 2001; Nair et al.1988). The
concentration of chlorophyll a (pre monsoon to Post monsoon) ranges from 0.84 – 29.75 mg/m3.
Chl a value were high during the pre monsoon at all stations and ranged from 1.18 to 14.06
( avg 5.07) mg/m3 at river ( S1 ), 1.05 to 29.75 mg/m3 ( avg 5.87) at Zone B and 2.75 to17.97
mg/m3 ( 6.5) at Zone C. The highest Chl a value (29.75 mg /m3 ) was observed S2. Moderately
high and lower values were noticed in the back waters where a regular pattern was observed in
the estuarine and riverine sites. In general lower values observed in monsoon and highest
values recorded in the pre monsoon and post monsoon seasons. Chl b is an accessory pigment
of Chl a and same trend has followed as that of chl a. The highest values were recorded in
some pockets of Zone B and C at pre monsoons. The concentration ranged from 0.62 - 3.6;
0.59 – 9.98 and 1.32- 10.42 mg /m3 at Zone A, B and C respectively. Moderately high and low
values were observed at Zone B (Champakara) and Zone C (Bolgatty) in monsoon and pre
monsoon periods respectively. The concentration of Chl c fluctuated between 1.17-11.1 mg/m3
in Zone A, 0.16-14.13 mg/m3 Zone B and 0.98 - 10.67 mg/m3 Zone C.
3.2 Phytoplankton speciation Being eutrophic, primary production in the estuary is always high and is mainly
constituted by nanoplankton (<20 mm) community. Perusal of literature from last five
decades(1958-2009) stand in this area reveals that total of 700 species of flora and fauna
comprising 65- 194 species of phytoplankton , 135 species of zooplankton 199 species of
benthos, 150 species of fishes and 7 species of mangroves were recorded between 1958 and
2007 (Table 2). Of the various categories, the concentration of nanoplankton (<20 mm)
community largely composed of diatoms (Bacillariophyceae), is relatively high throughout the
year, around 70% of the total phytoplankton was contributed by Skeletonema costatum. In the
present study and earlier work of Aneeshkumar and Sujatha. (2012) reveals the presence of 43
diatoms (Bacillariophyceae) species, 2 chlorophyceae species and 40 dinoflagellates species
at station S1. 42 diatoms species, 2 chlorophyceae species and 4 dinoflagellates species at
6

station S2 whereas 66 bacillariophyceae species, 1 chlorophyceae species , 4 dinofllagellates
species, 1 chrysophyceae species and 1 stroptophyceae species were identified at champakara
(S3) site. At station S4 Cheranellur, 52 diatoms species 2 chlorophyceae species and 6
dinoflagellates species were detected.
3.3 PigmentsChromatographic analysis revealed the presence of a wide range of pigments which
clearly exhibits spatial variability. Identification was based on the retention time and peak shape
through fingerprint matching with known peak shape from the diode array of spectral library.
These were created by running pure individual pigment standards. The concentrations of the
pigments were computed from the peak areas (Figure 2 and 3). Nearly 12 algal classes were
recorded by HPLC in this monograph belonging to pico phytoplankton (<2 μm), nano
phytoplankton and (2-20 μm) micro phytoplankton (20-200 μm) which are rarely detected by
classical method (Table 3). The phytoplankton pigment composition was significantly different in
each of the sites. The identified carotenoids include fucoxanthin (diatoms), diatoxanthin and
diadinoxanthin (diatoms, dinoflagellates), alloxanthin (chryptophytes), lutein (green algae and
higher plants), zeaxanthin (cyanobacteria) and peridinin synthesized by dinoflagellats
(Johansen, 1974). Chl b commonly is ascribed to green algae while the β-carotene and Chl a are
more general indicators of total algal abundance.
Marker pigments were categorized into photosynthetic pigments (PSP) and photo
protective carotene or pigments (PPC), Photo synthetic carotene (PSC), Total accessory
pigments (TAcc). These macro variables are composed of pigment sums and ratios for
reconciling inquiries applied to data bases from different regimes. Total pigments and Pigment
ratio were calculated and presented in Table 4.
Photo protective carotenoids (PPC) = [Allo] + [Diad] + [Diato] + [Zea] + [Caro]
Photosynthetic carotenoids (PSC) = [But] + [Fuco] + [Hex] + [Peri]
Photosynthetic pigments (PSP) = [PSC] + [TChl a] + [TChl b] + [TChl c]
Total accessory pigments (Tacc) = [PPC] + [PSC] + [TChl b] + [TChl c]
Total pigments (TPig) = [TAcc] + [TChl a]
The maximum PPC, PSC and PSP were observed at station Champakara (S3) than at
the estuarine site. This intensity of photo protecting chlorophylls and carotenoids at these
stations derived from large density of hydropytes, diatoms and cynobacteria (zeaxanthin),
cryptophyta (alloxanthin), chrysophyta and algae (-β carotene). Bacillariophyta,
prymnesiophytes, chrysophyta, raphidophytes and several dinoflagellates indicated by
fucoxanthin contribute largest to the PSC budget. The high concentration of PSC resulted from
7

the inherent chromatic and light intensity adaptation property of phytoplankton cells to specific
light conditions. The photosynthetic pigments (PSP) are constituted by floating flora and all the
photosynthetic algae excluding prochlorophyts, green algae, euglenophyta and plants. The
lower PPC, PSC and PSP at station S2 (Cheranellur) were due to the low production of flora. A
moderate value observed at estuarine sites reveals indicated the mesotropic nature. The
pigment derived ratios (Table 4) are dimensionless and are used for scaling. The ratios are
almost the same in all studied sites which indicate the authenticity in elution and identification of
each pigment and can be used for universal applications.
3.4 Taxonomic pigments and size structure indicesTo derive size-equivalent pigment indices Diagnostic Pigment [DP] criteria were
introduced by Claustre et al. (1994) then developed by Vidussi et al. (2001) and recently
extended by Uitz et al. ( 2006) which roughly correspond to the biomass proportions relevant to
pico-phytoplankton (less than 2μm), nano-phytoplankton (between 2 and 20μm) and micro-
phytoplankton (greater than 20μm); [pPF] or pBP, [nPF] or nBP, and [mPF] or mBP,
respectively. These variables are equivalent to the Fp ratio defined as the biomass ratio of
phytoplankton involved in new production over total phytoplankton and as such are equivalent to
the f- ratio (new production/ total production) (Claustre et al.1994; Eppley and Peterson,1979).
This means that together with size significance some of the criteria defined here also have a
functional/ biogeochemical significance. In addition to pigment indices, macro variables are
composed of pigment sums and ratios are in turn key for reconciling inquiries applied to
databases from different oceanic regimes.
The taxonomic composition of phytoplankton influences many change in the
biogeochemical processes. Therefore phytoplankton biomass and its composition over the
continuum of phytoplankton size were also performed simultaneously. The diagnostic pigment
(DP), mPF, nPF and pPF were derived by adopting the method of Vidussi et al.(2001) and Uitz et
al. (2006). These taxa are then grouped into three size classes (micro-, nano-, and
picophytoplankton), according to the average size of the cells. Generally seven pigments are used
as biomarkers of several phytoplankton taxa: fucoxanthin, peridinin, alloxanthin, 19-
butanoyloxyfucoxanthin, 19-hexanoyloxyfucoxanthin, zeaxanthin and total chlorophyll-b. In order to
know the contribution of each community in the study area, data reduction was performed and size
structure indices were made as follows (Rajdeep et al.2006).
Pico plankton proportion factor [pPF] = ([Zea] + [TChl b])/ [DP])
Nano plankton proportion factor [nPF] = ([Hex] + [But] + [Allo])/ [DP])
Micro plankton proportion factor [mPF] = ([Fuco] + [Peri])/ [DP])
8

Diagnostic pigments (DP) = ([PSC] + [Allo] + [Zea] + [TChl b])
The Composition within each class is determined at each site from the pigment-derived
criteria (Figure 4). In estuarine site S1, the pico phytoplankton was predominant (70.8 %) then
nano plankton (15.0 %) and finally micro plankton (14.2 %). 55.5 % pico, 20.3 % nano and 24.2
% micro phytoplankton were observed at station S2. Similarly 68.6% pico, 17.1 % nano and
14.3 % micro phytoplankton was noted at Cheranellur ferry (S4). In Contrast to these sites a
proportional difference was observed at Champakara (S3), composed of highest portion by
micro (64.3 %) followed by pico (22.4 %) and nano (13.3 %) phytoplankton. Earlier studies have
confirmed that small sized phytoplankton is an integral component in environmental monitoring
assessment of the plankton community though their relative contribution to the total community
varies with the abundance of large-sized phytoplankton (Legendre and Fevre, 1988; Cermeno
et al. 2006; Raimbault et al. 1988). The greater abundance of pico plankton at estuary than
Champakra, probably reflects the difference in micronutrient availability. Generally, nutrient
enrichment favors the growth of large phytoplankton while the production of small phytoplankton
(nano-) is mainly controlled by microzooplankton (cilites and flagellates) grazing ( Riegman et
al.1993; Jyothibabu et al. 2006). The results confirm the predominance of micro plankton
cells and diatoms in the station Champakara. Upwelling, tidal activities, southwest and north
east monsoon and river discharges will often reflect nutrient enrichment in estuary which
ultimately results in spurts of smaller planktons. Typically large-sized phytoplanktons have
greater potential to export organic matter through a short classical food chain whereas the
small-sized phytoplanktons are utilized by complex microbial food webs that favor the recycling
of organic matter ( Cermeno et al. 2006). More over exogenous nitrates from anthropogenic
inputs are principally used by large phytoplankton (micro phytoplankton) and mainly contributes
to new production while regenerated forms of nitrogen (ammonia and urea) are the likely source
for pico planktons and nano planktons (Goldman, 1993; Vidussi et al. 2001). The station S3
was one among the high discharge area of anthropogenic waste containing easily available
exogenous nitrate. The period of study was close to the end of the summer period and these
processes was therefore more pronounced at the former stations, supporting larger pico
biomass plankton. A significant contribution was also seen from the nanoplankton community.
Picoplankton communities are generally contributed by prochlorophyte and cyanobacteria are
often investigated in tropical oceans and most likely, represent systems associated with
regenerated production (Claustre et al. 1994).
A linear regression analysis performed between DP and Chl a (Figure 5 a) found a
significant correlation (r2 =0.84,), indicating that DP can also act as a proxy of phytoplankton
9

biomass. An existence of similar correlation between DP and Chl a has previously been
reported at eastern Mediterranean Sea at southern Benguela and at south west coat of India
( Vidussi et al. 2001; Rajdeep et al. 2006; Barlow et al. 2005). However the DP/Chl a ratio may
change with variations in nutrient dynamics and prevailing light condition, the DP can still be
used as a surrogate of phytoplankton biomass and for identifying general trends (Rajdeep et al.
2006). A good correlation were observed between PPP and PSP &PSP and TChl a ( r2=0.9
and 0.99 respectively) (Figure 5 b&c). Significant linear correlations were found between Chl a
and the photosynthetic carotenoid; photosynthetic pigment and photo protective carotenoids.
3.4 Pigment as a tool for recent ecological reconstructions Total carotenoids provide some indication of tropic status and also some evidence for
the relative importance of allochthonous vs autochthonous detritus in the sedimentary organic
matter. In decaying leaves and soil organic layers, chlorophyll derivatives are ultimately better
preserved than carotenoids, even though the initial breakdown of chlorophyll is faster.
Information about the bio-production and degradation of organic matter in estuarine system can
also be obtained from the Total Chlorophyll derivative to Total Carotene (CD/TC) ratios.
Intensive production of phytopigments or faster degradation of carotenoids in eutrophic system
may be the most important factor in the formation of higher CD/TC ratio in sediments
(Swain, 1985; Sanger, 1988). Algal decay favors preservation of carotenoids and diminishes
the ratios. Owing to the bulk organic matter of autochthonous character present in eutrophic
zone while in oligotrophic zone (ratios are higher) allochthonous detritus from the drainage
basin is the major source. High ratios reflect a greater proportional input of allochthonous
detritus and possibly a greater degree of aerobic decomposition of the autochthonous
sedimentary organic matter. These phenomena are compatible with swallowing and invasion
of the aquatic system. The CD/TC values in the sediment cores differ sharply site by sites
(Table 5). Overall a high value of CD/TC was observed at back water sites and lower values in
the estuary. Similar trend in the mesotropic system was also observed by many researchers.
The input of allochothonus detritus from the drainage basin and decaying of organic matter and
lower sedimentation would cause better preservation of chlorophyll derivative. As pointed out
by many authors these conditions favor degradation of carotenoids than that of chlorophyll
derivatives results in back water region (Swain, 1985; Sanger, 1988). Lower ratios (0.69) at
S1 and (0.48) S2 are probably indicative of eutrophic trend with autochthonous plankton
production prevailing. The back water stations are characterized by moderate carbon, high total,
inorganic and organic phosphate compared to estuarine station indicating the relatively
moderate rate of degradation. Preservation pattern in these two systems (S3 and S4) are
10

different which were coupled with long residence time due to low flow conditions that result in
an accumulation of organic matter in the surf zones compared estuarine zone. This observation
has been further confirmed by CHN analysis reveals that the percentage of nitrogen was very
low but moderate carbon and sulphur detected in back water stations. These confirm the
predominance of grazing activities in these stations both Nitrifying bacteria and Sulphur bacteria
would act an important role in this process.
Sedimentary Chlorophyll degradation products (SCDP) preserved and embedded in the
sediment have been examined earlier in many surface sediment core studies, but their
knowledge value in paleoecology and paleolimnology remains still unraveled. The degradation
and preservation pathways which are seem to be initiated by rather subtle differences in the
sedimentary environment. Factors influencing the sediment pigment record include photo- and
chemical oxidation as well as herbivore digestive processes in the water column during
deposition and post depositional degradation in the sediment. However various organisms
including bacteria, fungi, protozoans crustaceans, oligochaetes, etc were abundant in the
sediment phase as pheophytin a, pheophorbide a, chlorophyllide a, or in various enzyme
systems, operating over differing pH ranges, confine to promote chlorophyll degradation. In this
study a two step slow mechanism was proven, first the loss of Mg2+ ions resulting the formation
of Pheophytin a and then phytol in the side chain resulting in the formation of Pheophorbide a
(Aneeshkumar and Sujatha, 2012).
Vertical profile of the chlorophyll a, its degradation pigments and carotene were found
from surface to a (0 cm) depth to 6 cm deep (figure 6). The core is immediately sub sampled in
the interval of 2 cm (0, 2, 4 and 6 cm). Highest concentration was recorded at surface and the
concentration of pigment decreases from top to bottom. Highest concentration of surface
chlorophyll recorded at Champakara (S3), ranging 8.42-1.42 μg/g; 3.83-1.1 μg/g at S4; 4.09- 2.2
μg/g at S1 and lowest inventory pigment 1.64 -0.7 μg/g were recorded at station S2 from top to
bottom. Pheophytin as expected was nearly double in concentration compared to Chl a
concentration. Vertically (0 to 6 cm depth) it ranges from 1.62 to 0.62; 0.86 to 0.23; 16.27to2.36
and 3.99to 0.56 μg/g at stations S1; S2; S3 and S4 respectively. Total Carotenoids varied as;
8.61- 1.32 μg/g at S1; 2.30 – 0.5 μg/g at S2; 13.46- 6.22 at S3 and 7.68 - 1.32 μg/g at S4. The
concentration of pigments below 6 cm characterized by lowest inventory pigment and often
difficult for separation in ordinary method due to leached materials of substantial degradation
caused by the daily tidal base of the sediment. A rapid decrease in concentration from top to
bottom was observed at station S1 and S2 up to 2cm than the degradation found to be slow
11

down. The anthropogenic input and high oxic condition would help rapid degradation of the
pigment in surface and sub surface layers but anoxic conditions in the sub surface layers
retarding the degradation of pigment in bottom layers. Pheophytin to chlorophyll ratios at these
stations showed variations (Figure 6). Pheopigment-a/chlorophyll-a ratio at station S2 and S3
indicates a net increase in ratio at 2 cm and indicate a rapid degradation of chlorophylls. Rapid
deposition of fresh sediment and oxic conditions may be the prevailing reason. Beyond this
layer, degradation was found to be lower due to low availability of oxygen. Anoxic conditions in
bottom waters results primarily from reduced water exchange due to the bathymetry and highly
stratified waters. The CD (Chlorophyll derivative) to TC (Total Carotenoid) ratio support the
Pheophytin a to Chla ratio. The increase in CD to TC ratio indicates the slow degradation of
chlorophyll or degradation of algae. The low ratio indicates the preservation of carotenoids.
The pigment profiles at Champakara (S3) showed a distinct subsurface maximum
attributes preservation showing major production changes due to deterioration of redox
conditions. The site is characterized by low oxygen content < 2mg/L .Good oxygen conditions
observed previously could be explained the lower pigment rate in the bottom of the sediment
core. However, no significant trend was noted in the pheopigment- a/chlorophyll-a ratio at this
site indicating the preservation regime a fairly constant. Degradation products of chlorophyll
origin, especially pheophytin a was heavily dominated in the sediment pigment record. Low
salinity at this site results mostly large macrofauna, e.g. polychaetes, influencing much in the
sediment. Re suspension of sediment from dredging process and high sedimentation rate
observed for one meter per annum at monsoon and average sedimentation rate at
0.21cm/annum were often reflected for the limited preservation of pigments in the estuary. Re
suspended material in this steep-sided estuary experiences an extended period of exposure to
high oxygen concentrations and light intensity in the water column which in turn causes high
degradation of pigments.
4. Conclusion The article introduces chemical oceanographer and related researches and insight in
to the Chemotaxonomic account on sediment associated pigments. The Pigment profiles in the
sediment varied widely. The pigment profile distribution inferring the influence of environment
changes, past productivity and exchange mechanism of nutrients across the different stations.
The degradation product of Chl a in this study were found to be Pheophytin a greater than
pheophorbide a establishes a recent and advanced degradation state of the sediment.
The other carotenoid pigments reflect specific distribution along the different sites. 12
algal class were identified form of this taxonomic pigment. The Pigment indices provide an
12

useful insight into the functioning of ecosystem as the larger phytoplankton are known to be
generally dominant in nutrient- rich, productive waters whereas smaller phytoplankton are more
abundant under mesotropic conditions. The biomass proportions derived from the marker
pigments and DP (Diagnostic pigment) as defined above indicate that the picoplankton
community contributed significantly to the biomass structure in the estuarine waters whereas
micro plankton appear to be most abundant in the Champakara canal . The order of distribution
of phytoplankton observed in the study area was micro plankton (38.6%), pico plankton (32.7%)
and nao plankton (24.6%).
Acknowledgment We thank Director, School of Marine Sciences, CUSAT, Cochin and
Dr. N. Chandramohanakumar, Head, Department of Chemical Oceanography, CUSAT for
providing laboratory facilities and suggestions.
References
Aneeshkumar, N., C.H. Sujatha., 2012. Biomarker pigment signatures in Cochin back
water system - A tropical estuary south west coast of India, Estuarine, Coastal and
Shelf Science 9, 182-190.
Barlow, R.G., Mantoura. R.F.C., Gough. M.A., Fileman. T.W., 1993. Pigment signature in
phytoplankton composition in the north eastern Atlantic during the 1990 spring bloom. Deep Sea
Research 40, 459-477.
Barlow, R.G., Sessions. H., Balarin. M., Weeks, S., Whittle, C., Hutchings, L., 2005.
Seasonal variation in phytoplankton in the southern Benguela: pigment indices and
ocean colour. African Journal of Marine Science 27, 275-288.
Cermeno, P., Maranon, E., Perez, V., Serret, P., Fernandez, E., Castr, C.G., 2006.
Phytoplankton size structure and primary production in highly dynamic coastal
ecosystem (Ria de Vigo, NW-Spain): Seasonal and short-time scale variability.
Estuarine, Coastal and Shelf Science.67, 251–266.
Chambers, F. M., 1993. Climate Change and Human Impact on the Landscapes, (Ed.)Chapman
& Hall, London, Glasgow, New York, Tokyo, Melbourne, Madras.
Claustre, H., Kerherve, P., Marty. J.C., Prieur, L., Videau, C., Hecq, J.H., 1994. Phytoplankton
dynamics associated with a geostrophic front: Ecological and biogeochemical implications.
Journal of Marine Research. 52, 711-742.
De Sousa, S.N., Sen Gupta, R.S.S., Rajagopal, M.D., 1981. Studies on nutrients of
Mandovi and Zuari river systems. – Indian J. Mar. Sci. 10, 314–321.
13

Devessy, V.P., Bhattathiri. 1974. Phytoplankton ecology of the Cochin backwater.
Indian Journal of Marine sciences. 3, 46-50.
Eppley, R.W., Peterson, B.J., 1979. Particulate organic-matter flux and planktonic new
production in the deep ocean. Nature. 282, 677– 680.
Goldman, J., 1993. Potential role of largeoceanic diatomsin new primary production,
Deep Sea Res., Part l, 40, 159-168.
Gopinathan, C.P., 1972. Seasonal abundance of the phytoplankton in the Cochin
backwaters. Journal of the Marine Biological Association of India. 14 (2), 568-572.
Gopinathan, C.P., Gireesh, R., Smith, K.S., 2001. Disribution of chlorophyll “a” and “b”
in the eastern Arabian Sea( west Cast of India ) in relation to nutrients during post
monsoon. J.mar.biol.Ass.India. 43. (1&2), 21-30.
Grasshoff. K., Ehrhardt, M. & Kremling, K, 1999. 3rd ed. Wiley-VCH: Verlag GmbH, D-69469
Weinheim (Federal Republic of Germany).
Hassan, K. M., Swinehart, J. B., Spalding, R. F., 1997. Evidence for Holocene environmental
change from C/N ratio, and δ13C and δ 15N values in Swan Lake sediments, western Sand
Hills, Nebraska. J. Paleolimnol. 18, 121–130.
ICMAM PD. 2002. Critical Habitat Information System Technical report.
http://www.icmam.gov.in/COC.PDF accessed on May 2011.
Jeffrey, S. W., Mantoura, R. F. C., Wright, S.W., 1997. Phytoplankton pigment in
oceanography: Guidelines to modern methods, UNESCO Publications (Eds.), pp. 39–
84.
Johansen, J.E., Sevc, W.A., Liaaen-Jensen, S., Haxo, F.T., 1974. Carotenoids of the
dinophyceae. Photochemistry 13, 2261-2271.
Jyothibabu, R., Madhu, N.V., Jayalakshmi, K.V., Balachandran, K.K., Shiyas. C.A.,
Martin, G.D., 2006. Impact of fresh water influx on micro zooplankton mediated food
web in a tropical estuary (Cochin backwaters—India). Estuarine, Coastal and Shelf
Science 69, 505–518.
Kumaran, S., Rao, T.S.S., 1975. Phytoplankton distribution and abundance in the
Cochin back waters during 1971–1972. Bulletin Department of Marine Science.
University of Cochin 7(4), 791–799.
Lami, A., Guilizzoni, P., Ryves, D. B., Jones, V. J., Marchetto, A.,Battarbee, R. W., Belis, C. A.,
Bettinetti, R., Manca, M.,Comoli, P., Nocentini, A. , Langone, L.,1997. A Late Glacial and
14

Holocene record of biological and environmental changes from the crater lake Albano, central
Italy: An interdisciplinary European project (PALICLAS). Water, Air, and Soil Pollut. 99, 601–
613.
Leavitt, P. R., 1993. A review of factors that regulate carotenoid and chlorophyll deposition and
fossil pigment abundance. J. Palaeolimnol. 9, 109-127.
Legendre, L and Le Fevre, J., 1988. Hydrodynamic singularities as controls of recycled
versus export production in oceans. In: W. H. Berger, V. S. Smetacek, & G. Wefer
(Eds.), Productivity of the ocean: Present and past, Dahlem Konferenzen. Chichester:
Wiley.
Madhu, N.V., R. Jyothibabu., K.K. Balachandran., U.K.Honey., G.D. Martin., J.G. Vijay.
2007. Monsoonal impact on planktonic standing stock and abundance in a tropical
estuary (Cochin Backwaters—India). Estuarine, Coastal and Shelf Science 73, 54–64.
Nair, K.K.C., Gopalakrishnan, T.C., Venugopal, P., George Peter, M., Jayalakshmi,
K.V., Nair, K.K.C., Sankaranarayanan, V.N., Gopalakrishnan, T.C., Balasubramanian,
T., Lalithambikadevi, C.B., Aravindakshan, Krishnankutty, M., 1988. Environmental
conditions of some paddycum-prawn culture fields of Cochin backwaters, south west
coast of India. Ind. J.Mar. Sci. 17, 24–30.
Parsons, T.R, Maita, y., Lalli, C.M., 1984. A manual of Chemical and biological methods for sea
water analysis. First edition Pergamon Press Ltd, Headington Hill Hall oxford OX3 OBW,
England.
Raimbault, P., Rodier, M., Taupier-Letage, I., 1988. Size fraction of phytoplankton in the
Ligurian Sea and the Algenan Basin (Mediterranean Sea): size distribution versus total
concentration. Marine Microbial Food Webs 3, 1–7.
Rajdeep R., Anil, P., Mangesh, G., Naqvi, S.W.A., 2006. Spatial variation of
phytoplankton pigments along the southwest coast of India. Estuarine, Coastal and
Shelf Science 69,189-195.
Riegman, R., Kuipers, B.R., Noordeloos, A.A.M., Witte, H.J., 1993. Size-differential
control of phytoplankton and the structure of plankton communities. Netherlands Journal
of Sea Research 31, 255–265.
Sanger, J. E, (1988). Fossil Pigments in Paleoecology and Palaeolimnology.
Palaeogeography, Palaeoclimatology, Palaeoecology 62, 343–359.
15

Sanilkumar, 2009. Micro Algae in the Southwest Coast of India, PhD Thesis. Cochin
University of science and Technology.
Selveraj, G.S.D., Thomas, V.J., Khambadkar, C.R. 2003 seasonal variation of
phytoplankton and productivity in the surf zone and backwater at Cochin. Journal of the
Marine Biological Association of India 45, 9-19.
Sreekumar, R., Joseph, K.J., 1995. Periphyton colonization in Cochin estuary. Indian
Journal of Marine Sciences 24, 94–96.
Standard methods for the Examination of water and Waste Water 19th edition. (1995) Published
by APHA, AWWA and WEF. Washington. D.C 20005.
Swain, E., 1985. Measurement and interpretation of sedimentary pigments. Freshwat.
Biol. 15, 53–75.
Trees, C.C., Clark, D.K., Bidigare, R.R., Ondrusek, M.E., Mueller, J.L, 2000. Accessory
pigments versus chlorophyll a concentrations within the euphotic zone: a ubiquitous
relationship. Limnology and oceanography 45, 1130– 1143.
Uitz, J., H. Claustre., A. Morel., S. Hooker., 2006. Vertical distribution of phytoplankton
communities in Open Ocean: an assessment based on surface chlorophyll. Journal of
Geophysical Research 111, C08005.
Vidussi, F., H. Claustre., B.B. Manca, A. Luchetta., J.C. Marty., 2001. Phytoplankton
pigment distribution in relation to upper thermocline circulation in the eastern
Mediterranean Sea during winter Journal of Geophysical Research 106, C9, 19 939–19
956.
Yacobi, Y. Z., Eckert, W., Tr¨uper, H. G., Berman, T., 1990. High Performance Liquid
Chromatography detection of phototrophic bacterial pigments in aquatic environments. Microbial
Ecology 19, 127–136.
Hooker, S. B., L.Van Heukelem.,C.S. Thomas.,H. Claustre., J.Ras., R.Barlow., H. Sessions.,
L.Schluter ., J. Perl., C. Trees., V. Stuart., H.Head., L., Clementson. , J. Fishwick., C. Llewellyn.,
and J.Aiken, 2005. The second SeaWiFS HPLC Analysis Round-Robin Experiment
(SeaHARRE-2), NASA, Goddard Space Flight Center, Maryland, Technical Memorandum
NASA/TM-2005-212787..112.
16

Table1. Description of sampling site and Salinity in the study area
Zone Salinity Station ID Name of Sampling Site
A <0.1 mg/L S1
Muvattupuzha (Surface)
Muvattupuzha (Bottom)
B 0.02-14 mg/L
S2 Champakkara canal (Surface)Champakkara canal (Bottom)
S3 Cheranellur west (Surface)
S4 Cheranellur ferry(Surface)Cheranellur ferry (Bottom)
C 0.01-35.0 mg/L
S5 Port-Taj (Surface)S6 Port-jetty (Surface) Port-jetty (Bottom)
S7 Bolgatty (Surface) Bolgatty (Bottom)
17

Table 2 .Phytoplankton abundance in the study area (microscopic examination) for the last 5
decades.
Phyto plankton Group/Species No Species
Time of Sampling Reference
Bacillariophyceae,Dinofla
gellates,Cyanophyceae,C
hlorophyceae &
Filamemntous algae 194
1958-1975
Devessy and
Bhattathiri ,1974;
Gopinathan, 1972;
Kumaran, and Rao,1975
(Periphytic algae)
…….Sreekumar and Joseph.
1995
Bacillariophyceae 66
Chlorophyceae 8
Cyanophyceae 2
Bacillariophyceae 89
1999 ICMAM PD,2002Dinophyceae 31
Chlorophyceae 2
Cyanophyceae 1
Bacillariophyceae 582001-02 Selveraj et al ,2003
Dinoflagellates 2
Bacillariophyceae,Dinofla
gellates & others
89 (Pre monsoon)
65 ( Monsoon)2003 Madhu et al. 2007
Bacillariophyceae 28
2006-07
Sanilkumar, 2009.
Dinoflagellates 9
Chlorophyceae 2
Bacillariophyceae 54
2007-08Dinoflagellates 19
Chlorophyceae 2
18
Table 3 Pigment and corresponding Algal Class identified during the study by marker signature
pigment by HPLC (Jeffrey et al, 1997)
Pigments Name of Algal Class Size Fraction Size μm
Chl a,b Green algae Picoplankton < 2
Zeaxanthin Cynobacteria Picoplankton < 2
Canthaxanthin Eustigmatophyta Nanoplankton 2--20
Fucoxanthin Prymnesiophytes Nanoplankton 2--20
Diatoxanthin Chrysophyta Nanoplankton 2--20
Peridinin Dinophyta Nanoplankton 2--20
Fucoxanthin & Diatoxanthin Bacillariophyta Microplankton >20
Peridinin Dinoflagellates Microplankton >20
Alloxanthin Cryptophyta Microplankton 2-200
Lutein Chlorophyta Microplankton 2-200
9'-cis neoxanthin Euglenophyta Microplankton 20-200
Fucoxanthin Raphidophytes Microplankton 20-200
9'-cis neoxanthin Prasinophyta Microplankton 20-200
19

Table 4 photosynthetic pigments (PSP) and photo protective carotene or pigments (PPC), Photo
synthetic Carotene (PSC), Total accessory pigments (TAcc) and Ratios in the study area
Accessory pigmentsStations
S1 S2 S3 S4
PPC 2.77 5.2 14.81 0.82
PSC 0.16 0.44 3.04 0.05
PSP 2.39 3.39 39.25 1.34
TAcc 4.86 8.3 54.06 1.99
TPig 5.81 9.99 65.07 2.64
Ratios
Tacc/TCha 5.12 4.91 4.91 3.06
PPC/TPig 0.48 0.52 0.23 0.31
PSP/TPig 0.41 0.34 0.6 0.51
PSP/Tcha 2.52 2.01 3.56 2.06
Table 5.The CD/TC values in the sediment cores.
Stations S1 S2 S3 S4
CD/TC 0.69 0.48 1.75 1.34
Classification of
Tropic status Autochthonous Autochthonous Allochothonous Allochothonus
20

Figure 1. Map of Cochin estuary showing sampling sites
21

Figure 2 Distribution of Marker pigments in the study area
22

Figure 3 Distribution of Chlorophylls and its degradation pigments
23

Figure 4 Distribution of Phytoplankton Composition with in each class at each site from the
pigment-derived criteria
24
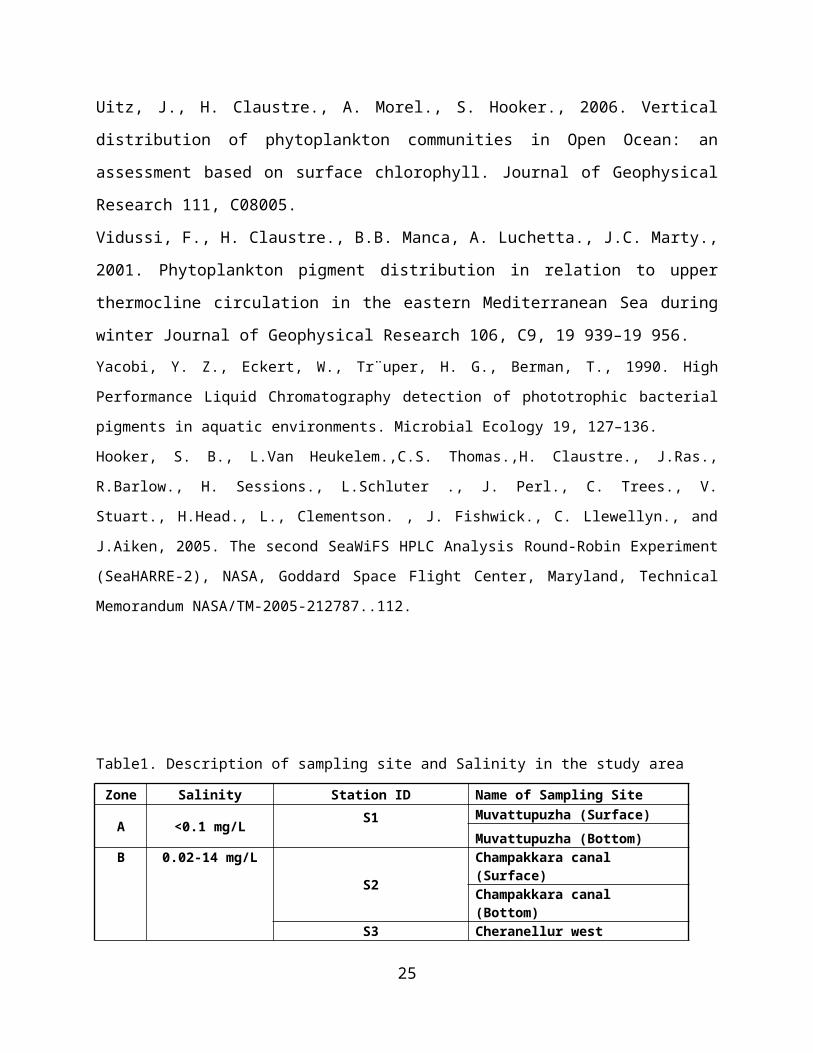
Figure 5 A linear regression analysis performed between DP vs TChl a (a); PPP vs PSP (b) and
PSP Vs TCha (c).
25

Figure 6 The Vertical profile of the Chlorophyll a, its degradation pigments, carotene and ratios
from surface to 6 cm deep
26

Figures
Figure 1. Map of Cochin estuary showing sampling Sites
Figure 2 Distribution of Marker pigments in the study area.
Figure 3 Distribution of Chlorophylls and its degradation pigments.
Figure 4 Distribution of Composition with in each class is determined at each site from the
pigment-derived criteria.
Figure 5 A linear regression analysis performed between DP and Chl a.
Figure 6 The Vertical profile of the Chlorophyll a, its degradation pigments, carotene and
ratios from surface to 6 cm deep.
27

Tables
Table 1.Description of sampling site and Salinity in the study area
Table 2 .Phytoplankton abundance in the study area (microscopic examination) for the last 5
decades.
Table 3.Pigment and corresponding Algal Class identified during the study by marker signature
pigment by HPLC (Jeffrey et al, 1997)
Table 4 .Photosynthetic pigments (PSP) and photo protective carotene or pigments (PPC),
Photo synthetic Carotene (PSC), Total accessory pigments (TAcc) and Ratios in the study area
Table 5.The CD/TC values in the sediment cores .
28