the application of statistical design of experiments for mathematical modeling of a bacterial cell...
DESCRIPTION
A full factorial statistical design was used to mathematically model the process for growing the E. coli cell line (BL21(DE3)/ pET17b::gfpuv. The experimental factors of mixing (RPM), temperature, glucose concentration, and tryptic soy broth concentration were included in the shaker flask study. Optical density measurements were used as the means of quantifying cell growth. During the exponential growth phase, the process showed a statistically significant dependence upon mixing, temperature, and tryptic soy broth concentration. The interaction between mixing and temperature was also found to have a statistically significant effect upon the exponential growth rate. Interestingly, the glucose concentration did not exhibit a statistically significant effect upon this growth phase. Optical density measurements taken at seven individual time points throughout the experiment were also used to model the system during different growth phases. It was interesting to note that mixing initially exhibited a negative effect upon growth rate, but as the growth rate accelerated, it had a positive effect. In the early growth phase, tryptic soy broth concentration had the largest positive effect, while temperature dominated most phases of cell growth. As expected, higher temperatures favored higher growth rates. From these data, mathematical models were constructed that may be used to predict the growth rate within the experimental bounds explored in this study.TRANSCRIPT

The Application of Statistical Design of Experiments for Mathematical Modeling of
a Bacterial Cell Culture Process
Driss Elhanafi
Biomanufacturing Training & Education Center (BTEC) Golden LEAF BTEC Building 850 Oval Dr, CB, Centennial Campus, North Carolina State University, Raleigh, NC 27695-7928
919-513-8236, [email protected]
Jim Carey
NCE Development, LLC
Apex, NC 27502
919-367-2954, [email protected]

Abstract
A full factorial statistical design was used to mathematically model the process for growing the E. coli cell line (BL21(DE3)/ pET17b::gfpuv. The experimental factors of mixing (RPM), temperature, glucose concentration, and tryptic soy broth concentration were included in the shaker flask study. Optical density measurements were used as the means of quantifying cell growth. During the exponential growth phase, the process showed a statistically significant dependence upon mixing, temperature, and tryptic soy broth concentration. The interaction between mixing and temperature was also found to have a statistically significant effect upon the exponential growth rate. Interestingly, the glucose concentration did not exhibit a statistically significant effect upon this growth phase. Optical density measurements taken at seven individual time points throughout the experiment were also used to model the system during different growth phases. It was interesting to note that mixing initially exhibited a negative effect upon growth rate, but as the growth rate accelerated, it had a positive effect. In the early growth phase, tryptic soy broth concentration had the largest positive effect, while temperature dominated most phases of cell growth. As expected, higher temperatures favored higher growth rates. From these data, mathematical models were constructed that may be used to predict the growth rate within the experimental bounds explored in this study.
9/24/2009 2Bioprocessing and Process Development
Symposium (BPD)

IntroductionThe statistical design of experiments (DOE) approach to process development offers several key advantages over the traditional one-variable-at-a-time (OVAT) approach. DOE studies allow for the evaluation of the statistical significance of individual process parameters, as well as the interaction between factors. It is this ability to unambiguously assess the contribution of interaction terms that is simply not possible using the OVAT approach.
Another major advantage of the DOE approach is that the statistical significance of various mathematical models can be tested using the appropriate model-fitting functions provided in the DOE software package. The mathematical models can then be utilized to find the predicted optimum system response, such as cell culture growth rate, within the experimental bounds of the study. The optimized set of conditions can then be verified experimentally to validate the model prediction.
In the current study, the DOE approach was used to determine the statistically significant factors affecting the growth of the E. coli cell line (BL21(DE3)/ pET17b::gfpuv in shaker flasks. A 2-level full factorial design was employed to assess the statistical significance of mixing (RPM), temperature, glucose concentration, and tryptic soy broth concentration. Replicate runs made at various design points were conducted to provide an estimate of the purely experimental error for the system. Based upon the analysis of variance, the statistically significant factors were then included as terms in the mathematical prediction equations to model the cell culture growth rate within the limits of the experimental design space.
9/24/2009 3Bioprocessing and Process Development
Symposium (BPD)

Materials and Method
The study was initiated using an overnight seed culture of E. coli in 10 mL Luria Bertali (LB) media, at 37 C at 250 RPM. The starting cell concentration for the seed media, 3.5 x 10⁹ CFU per mL, was determined experimentally using serial dilution platings. A 50 µL aliquot of the seed culture was inoculated into 50 mL of the various test media contained within a 250 mL baffled Erlenmeyer flask. The bacterial growth for each set of experimental conditions were monitored by measuring its optical density as a function of time using a spectrophotometer at 600 nm. The resulting optical density values were used to construct growth curves. Media used was composed of a constant concentration of yeast extract (Bacto, 10 g/L), varying amounts of tryptic soy broth (Bacto), and glucose (Fisher). The obtained optical density values were used to construct growth curves and determine the cell culture growth rates. The software package Stat-Ease Design-Expert 7.16 was used to determine the statistical significance of each experimental factor and to generate the corresponding mathematical prediction models.
9/24/2009 4Bioprocessing and Process Development
Symposium (BPD)
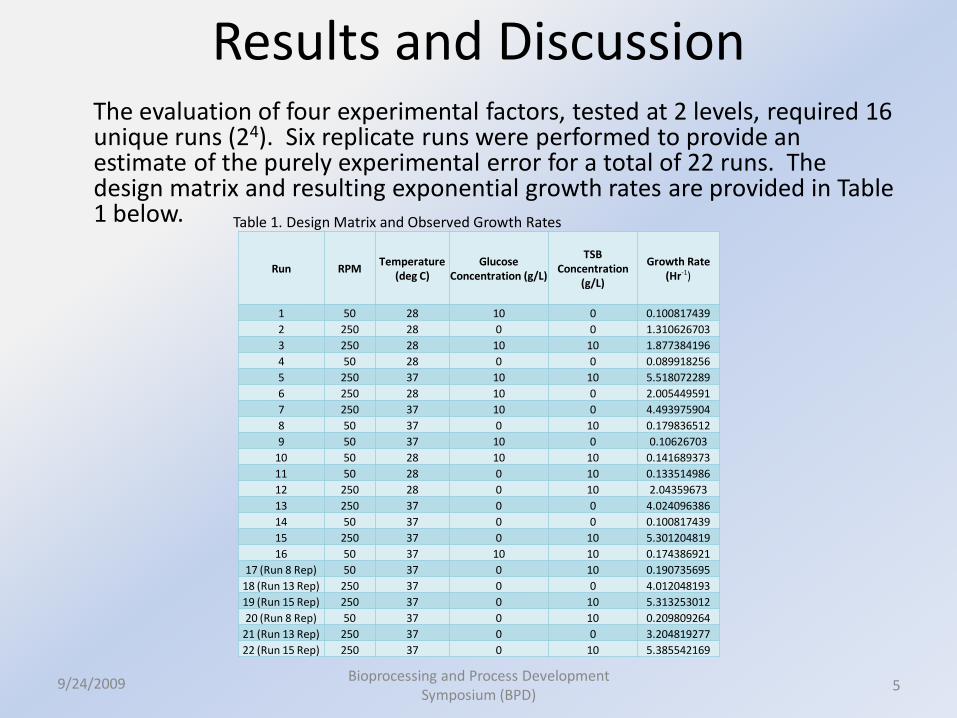
Results and DiscussionThe evaluation of four experimental factors, tested at 2 levels, required 16 unique runs (24). Six replicate runs were performed to provide an estimate of the purely experimental error for a total of 22 runs. The design matrix and resulting exponential growth rates are provided in Table 1 below.
Run RPMTemperature
(deg C)Glucose
Concentration (g/L)
TSB Concentration
(g/L)
Growth Rate (Hr-1)
1 50 28 10 0 0.100817439
2 250 28 0 0 1.310626703
3 250 28 10 10 1.877384196
4 50 28 0 0 0.089918256
5 250 37 10 10 5.518072289
6 250 28 10 0 2.005449591
7 250 37 10 0 4.493975904
8 50 37 0 10 0.179836512
9 50 37 10 0 0.10626703
10 50 28 10 10 0.141689373
11 50 28 0 10 0.133514986
12 250 28 0 10 2.04359673
13 250 37 0 0 4.024096386
14 50 37 0 0 0.100817439
15 250 37 0 10 5.301204819
16 50 37 10 10 0.174386921
17 (Run 8 Rep) 50 37 0 10 0.190735695
18 (Run 13 Rep) 250 37 0 0 4.012048193
19 (Run 15 Rep) 250 37 0 10 5.313253012
20 (Run 8 Rep) 50 37 0 10 0.209809264
21 (Run 13 Rep) 250 37 0 0 3.204819277
22 (Run 15 Rep) 250 37 0 10 5.385542169
Table 1. Design Matrix and Observed Growth Rates
9/24/2009 5Bioprocessing and Process Development
Symposium (BPD)

Results and DiscussionThe measurement of the cell culture growth rate for the exponential phase was determined by plotting the optical density measurements as a function of time and calculating the slope of the curve. The plots for the 16 unique runs are shown in Figure 1 below.
Figure 1. Growth Curves for Full Factorial Design Points
0
0.2
0.4
0.6
0.8
1
0 5 10
Run 4
Run 1
Run 14
Run 9
Run 11
Run 10
Expansion of slow growth runs
9/24/2009 6Bioprocessing and Process Development
Symposium (BPD)

Analysis of variance table [Partial sum of squares - Type III]
Sum of Mean F p-value
Source Squares df Square Value Prob > F
Block 1.77 1 1.77
Model 57.3 4 14.33 797.56 < 0.0001 significant
A-RPM 47.94 1 47.94 2668.96 < 0.0001 significant
B-Temperature 1.56 1 1.56 86.66 < 0.0001 significant
D-TSB 0.73 1 0.73 40.55 < 0.0001 significant
AB 0.62 1 0.62 34.51 < 0.0001 significant
Residual 0.29 16 0.018
Lack of Fit 0.25 13 0.019 1.52 0.4081 not significant
Pure Error 0.038 3 0.013
Cor Total 59.36 21
Results and DiscussionStatistical analysis of the observed exponential growth rates revealed that mixing (RPM), temperature, tryptic soy broth concentration, and the interaction term between mixing and temperature were each statistically significant and could therefore be included in the mathematical prediction equation model. The prediction equation “lack of fit” was found to be not significant, indicating a good fit of the model to the data. The analysis of variance results are provided in Table 2 below.
Table 2. Analysis of Variance (ANOVA) for Exponential Growth Phase
9/24/2009 7Bioprocessing and Process Development
Symposium (BPD)

Design-Expert® SoftwareLn(Growth Rate)
A: RPMB: TemperatureC: GlucoseD: TSB
Positive Effects Negative Effects
Pareto Chart
t-V
alu
e o
f |E
ffe
ct|
Rank
0.00
12.92
25.83
38.75
51.66
Bonferroni Limit 3.44432t-Value Limit 2.11991
1 2 3 4 5 6 7 8 9 10 11 12 13 14 15
A
B
D AB
Results and DiscussionThe rank ordering of statistically significant factors is shown in the Pareto chart in Figure 2 below. The results show that mixing (RPM) is the predominant factor affecting growth during the log phase.
Figure 2. Pareto Chart Rank Ordering of Significant Factors
9/24/2009 8Bioprocessing and Process Development
Symposium (BPD)

Results and DiscussionThe mathematical prediction model derived from the statistical analysis,
was used to generate the 3-D plot shown in Figure 3 below, demonstrating the interaction between temperature and mixing.
Figure 3. Three-dimensional Plot of Temperature-RPM Interaction
Design-Expert® SoftwareTransformed ScaleLn(Growth Rate)
1.70803
-2.40885
X1 = A: RPMX2 = B: Temperature
Actual FactorsC: Glucose = 5.00D: TSB = 5.00
50.00
100.00
150.00
200.00
250.00
28.00
30.25
32.50
34.75
37.00
-2.2
-1.25
-0.3
0.65
1.6
L
n(G
row
th R
ate
)
A: RPM B: Temperature
Ln(Growth Rate) = -3.18196 + 2.76815E-003 * RPM + 5.87318E-003 * Temperature+0.037122 * TSB + 3.91402E-004 * RPM * Temperature
9/24/2009 9Bioprocessing and Process Development
Symposium (BPD)

Results and DiscussionIn addition to evaluating the exponential growth rate for each set of experimental conditions, the instantaneous growth rates at 1.50, 2.33, 3.33, 4.41, 5.41, 6.24, and 9.91 hours were also evaluated. Analyses at each of these seven time intervals showed multiple statistically significant factors, including several two-factor interactions, and one three-factor interaction (temperature*glucose*TSB at 1.50 hours).
Table 3. Statistically Significant Factors forIndividual Elapsed Time Points
A: RPMB:TemperatureC: GlucoseD: TSB
Elapsed Time
(Hours)
Statistically Significant
Factors1.50 A, B, C, D, AC, BD, CD, BCD
2.33 A, B, C, D, AB, BD, CD
3.33 B, D, BD
4.41 A, B, C, D, AB, CD
5.41 A, B, C, D, AB, CD
6.24 A, B, C, D, AB, CD
9.91 A, B, D, AB
9/24/2009 10Bioprocessing and Process Development
Symposium (BPD)

Results and DiscussionIt was interesting to note that in the initial growth phase, there was a negative interaction between glucose concentration and TSB concentration (Figure 4). As the concentration of one of these nutrients increased in the presence of the other, the result was a reduction in the instantaneous growth rate. While the magnitude of this effect was modest compared to the dominant effect of TSB concentration alone, it may provide an area of future research for process optimization.
Figure 4. Negative Interaction Between Glucose and TSB
Design-Expert® Software
Elapsed Time 1.50
C- 0.000C+ 10.000
X1 = D: TSBX2 = C: Glucose
Actual FactorsA: RPM = 150.00B: Temperature = 32.50
C: Glucose
0.00 2.50 5.00 7.50 10.00
Interaction
D: TSB
Ela
ps
ed
Tim
e 1
.50
0.003
0.007
0.011
0.015
0.019
9/24/2009 11Bioprocessing and Process Development
Symposium (BPD)

ConclusionsStatistically significant mathematical models were derived describing the dependency of bacterial cell culture growth rates upon mixing (RPM), temperature, glucose concentration, and tryptic soy broth concentration. The relative importance, and even the sense of the factor effects varied as the growth process progressed. Temperature was found to be an important factor in every growth phase. The sense of the effect was always positive, meaning that higher temperatures favored higher growth rates. Mixing was controlled by adjusting the RPM of the shaker table and was shown to be an important factor in most growth phases. Interestingly, mixing exhibited a negative influence upon growth in the early growth phases, meaning that lower RPM favored higher growth rates. After the initial four hours of the experiment, mixing exhibited the expected positive influence upon growth, namely that higher RPM favored higher growth rates. This is the predicted behavior because higher mixing rates equate to a higher dissolved oxygen content. The concentration of glucose had a relatively minor effect upon cell growth and in fact was found to be not statistically significant during the exponential growth phase. An important interaction between temperature and mixing was also identified and quantified. Tryptic soy broth concentration was the dominant factor affecting growth in the earliest growth phase, but its relative impact upon the process diminished as the growth proceeded. Higher tryptic soy broth concentrations favored higher growth rates. A curious interaction between tryptic soy broth concentration and glucose concentration was observed. This interaction exhibited a negative effect upon growth, meaning that as the concentrations of either ingredient increased, in the presence of the other ingredient, the two-factor interaction caused a reduction in growth rate. This interaction term was relatively large in magnitude during the first half of the overall growth cycle. Since tryptic soy broth was the dominant factor in the earliest phase of growth, this observation may be indicating that glucose is not required, or may even be detrimental to the growth process in the system studied. An observation supporting this hypothesis was the fact that glucose concentration was not found to be a statistically significant factor during the exponential growth phase for this cell culture.
9/24/2009 12Bioprocessing and Process Development
Symposium (BPD)