the application of remote sensing in mineral exploration
TRANSCRIPT

Sultan Qaboos University
Collage of Science
Department of Earth Sciences
Remote Sensing Course (ERSC3061)
The Application of Remote Sensing in Mineral Exploration
Ibrahim Al Jabri (ID: 120991)
Abdullah Al Maashari (ID: 119315)

❖ Introduction:
Remote sensing is obtaining information about areas or objects without direct
contact. The main elements of remote sensing are the sensor, the sensing, and the
signal. There are many types of sensors such as satellite, airborne, and some types can
be on the ground like mounted on a tripod. The data that took by remote sensing are
very helpful for the scientists and countries. Remote sensing is very important in
numerous aspects because it is faster and cheaper than other methods. This technology
used for studying the environments, oceans, natural phenomena, and for mineral
exploration.

Figure 1: this image shows the various methods of remote sensing (H. S. Lim et al., 2009).
We choose this subject because of the big effect of remote sensing on the mineral
industry. In this report, we will discuss the relationship between remote sensing and
mineral exploration, how we can improve mineral exploration by remote sensing, the
advantages of remote sensing in the mining industry, and finally, examples of using
remote sensing for mineral exploration in Oman.
❖ Methods:
In this report, we investigate the influence of remote sensing methods on
mineral exploration and mining industry based on the data obtained from scientific
papers, articles, and satellite images. We concluded that there is an evolution in
mineral exploration due to the support from remote sensing technology, which
increased mining.
❖ Discussions and Result:
▪ The connection between remote sensing and mineral exploration:
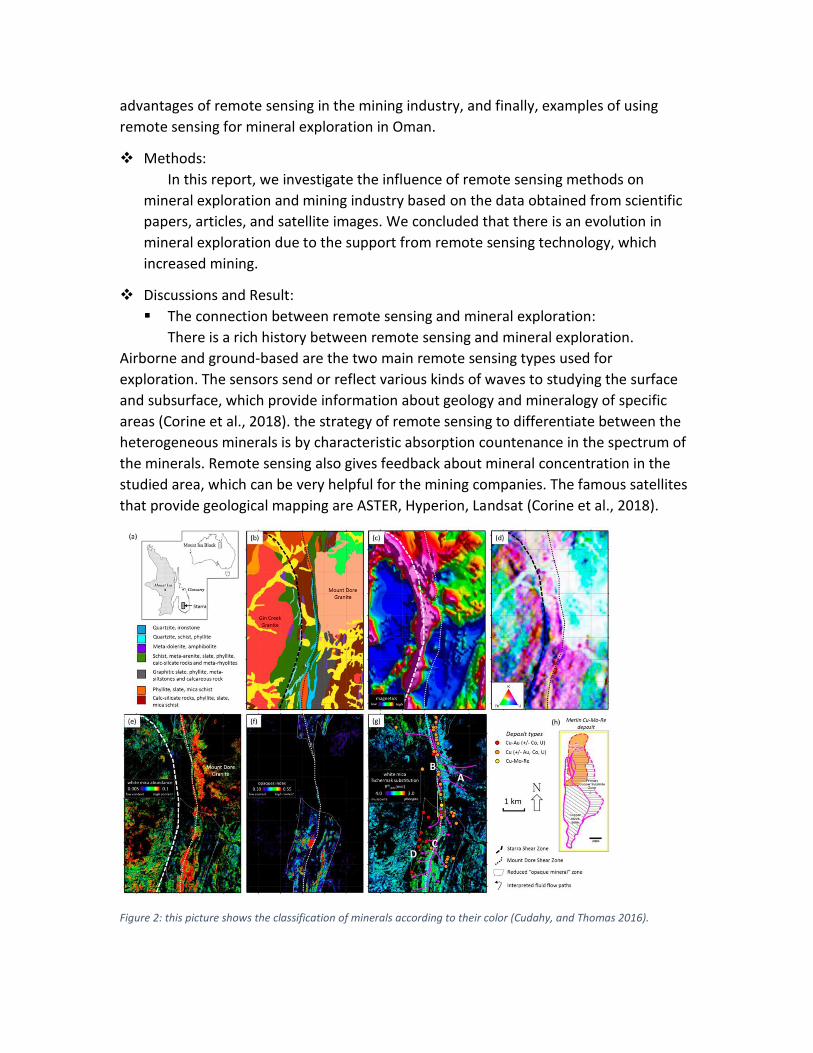
There is a rich history between remote sensing and mineral exploration.
Airborne and ground-based are the two main remote sensing types used for
exploration. The sensors send or reflect various kinds of waves to studying the surface
and subsurface, which provide information about geology and mineralogy of specific
areas (Corine et al., 2018). the strategy of remote sensing to differentiate between the
heterogeneous minerals is by characteristic absorption countenance in the spectrum of
the minerals. Remote sensing also gives feedback about mineral concentration in the
studied area, which can be very helpful for the mining companies. The famous satellites
that provide geological mapping are ASTER, Hyperion, Landsat (Corine et al., 2018).
Figure 2: this picture shows the classification of minerals according to their color (Cudahy, and Thomas 2016).

▪ The advantages of remote sensing in the mining industry:
The mining industry considered as one of the lucrative business in the world,
some countries economy is linked to mining. From 1960 to 2010, remote sensing
technology has been evolved to become more effective and efficient (R.Baumann 2009).
There are a lot of advantages of remote sensing in the mining industry such as high
temporal frequency, and covering sizable lands more and faster than other methods,
this feature can reduce costs and save time (k. Koruyan et al., 2012). Also, the satellite
can provide 2D and 3D images with various depths.
The data that are taken from remote sensing that related to the mining industry
not gust about mineral exploration, but also about the negative impacts of mining. By
using various remote sensing methods (mostly satellite), the scientists studying the
mining lands, and they found a decrease in natural vegetation and destroying of animal
habitats (k. Koruyan et al., 2012).
Figure 3: this image shows the impact of gold mining on the tree cover in Myanmar (Cudahy, and Thomas 2016).
▪ How remote sensing help mining field?
Optical remote sensing can be used for a wide range of applications that can be
relevant to the mining industry. It helps for mineral exploration by mapping surface
mineralogy and geology, which can be an indicator for subsurface geology and the
presence of ore bodies. (Davids, C., Rouyet, L. 2018.)
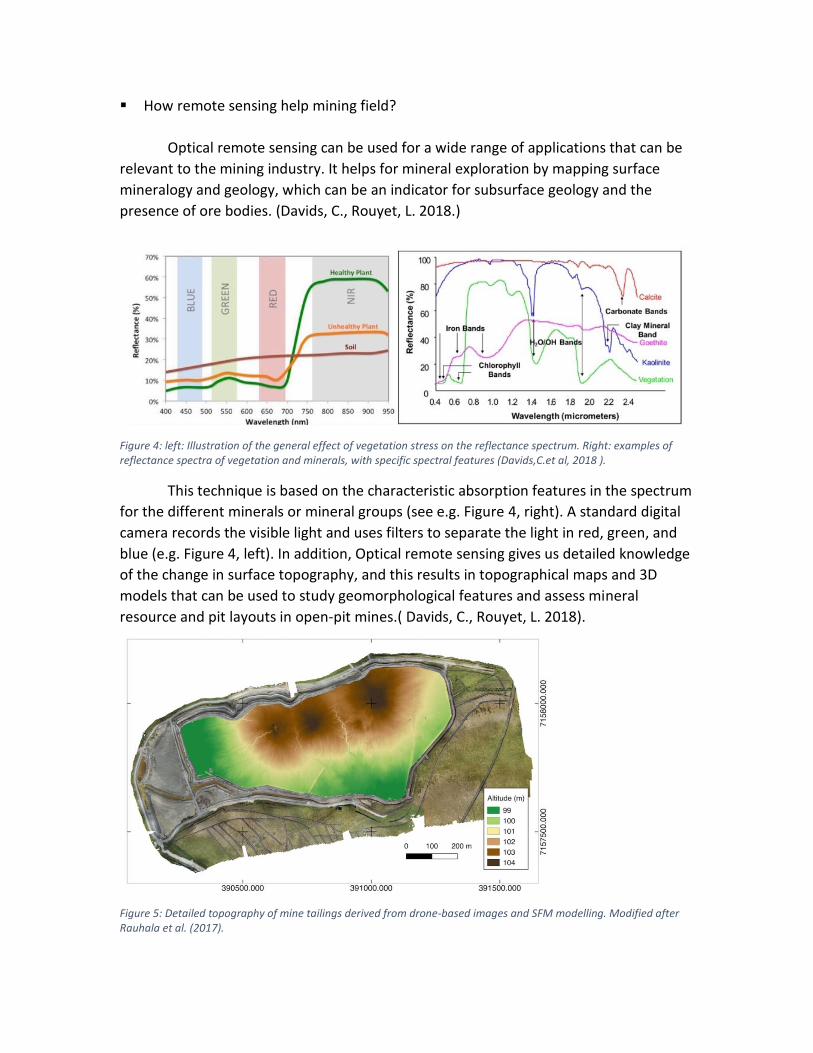
Figure 4: left: Illustration of the general effect of vegetation stress on the reflectance spectrum. Right: examples of reflectance spectra of vegetation and minerals, with specific spectral features (Davids,C.et al, 2018 ).
This technique is based on the characteristic absorption features in the spectrum
for the different minerals or mineral groups (see e.g. Figure 4, right). A standard digital
camera records the visible light and uses filters to separate the light in red, green, and
blue (e.g. Figure 4, left). In addition, Optical remote sensing gives us detailed knowledge
of the change in surface topography, and this results in topographical maps and 3D
models that can be used to study geomorphological features and assess mineral
resource and pit layouts in open-pit mines.( Davids, C., Rouyet, L. 2018).
Figure 5: Detailed topography of mine tailings derived from drone-based images and SFM modelling. Modified after Rauhala et al. (2017).

In addition to conventional methods of surveying, which are often laborious and
require access to the site, 2 methods are often used: 1. Laser scanning or LIDAR (Light
Imaging Detection A Ranging), either ground-based/terrestrial laser scanning (TLS) or
airborne laser scanning (ALS); and 2 Photogrammetry from manned or unmanned
aircraft (Figure 5). I addition, it is possible to derive a digital elevation model from very
high-resolution stereo satellite imagery, such as Worldview or SPOT. ( Davids, C.,
Rouyet, L. 2018).
▪ Are there any examples of using remote sensing for mining in Oman?
Oman has the potential occurrence of industrial minerals and ore deposits which
mostly occur in inaccessible mountains and desert regions where it is difficult to do the
conventional geological mapping. By knowing the absorption characters of spectral
bands of Advanced Spaceborne Thermal Emission and Reflection Radiometer (ASTER)
and selected imaging processing methods, it reduces the time to discover the wide-area
and save a lot of time and money that spent in the past for minerals exploration. (Nasir,
S. J., & Sankaran's, R. 2017).
Figure 6: The country is rich with occurrences of economic industrial minerals and ore deposit namely chromite, copper, gold, lead, zinc, iron, coal, magnetite, manganese, silica, barite, clay, dolomite, gypsum, kaolinite, limestone, and marble.

❖ Here we have some examples of using remote sensing for mining in Oman:
Figure 7: Principal Components RGB image (R: PC1, G: PC2 and B: PC3) showing the
occurrence of manganese deposits in Ras Al Hadd region, Oman (Qf –Alluvial; Qb- Sabkhah; Qe-
Aeolian; MF2 - Middle Fars Group (Miocene to Pliocene); MF1 - Lower Fars Group (Miocene to
Pliocene); EMD - Dhofar Group (Late Eocene to Early Miocene); EHT3 - Upper Hadhramut Group
(Paleocene to Eocene); EHT2 - Middle Hadhramut Group (Paleocene to Eocene); TRKAR - Al
Aridh Group; PKHD - Hamrat Duru Group) (Rajendran and Nasir, 2013a).

Figure 8: ASTER SWIR RGB (PC5, PC3 and PC1) image showing the presence of
hydrothermal altered rock (listwaenite in dark red color marked as Li) and mineralized areas in
range of colors interpreted along the thrust fault zones (dotted lines in yellow color) of the
Fanjah area (Rajendran et al., 2013).

Figure 9: ASTER RGB band ratios (4/7, 4/1, 2/3*4/3) image (Rajendran and Nasir, 2014a)
showing the hydrothermally altered serpentinized peridotites of the study area. T – Tertiary
formations; E- Basic extrusives mostly spilites with pillow lava; D- Diabase dike swarms; HG-
Gabbroid hypabyssal rocks; G- Gabbro; Pg- Peridotites with gabbro intrusions; P – Peridotites
partly serpentinized; P' - strongly sheared serpentinized harzburgite, Ha- Haliw Formation; OM-
Oman Melange; and HD – Hamrat Duru Formations.

Figure 10: SAM classified image (Rajendran and Nasir, 2014a) showing the occurrence of
hydrothermal altered serpentine minerals (cyan in color) within the serpentinized zone. The
abbreviations of the image are T – Tertiary formations; E- Basic extrusives mostly spilites with
pillow lava; D- Diabase dyke swarms; HG- Gabbroid hypabyssal rocks; G- Gabbro; Pg- Peridotites
with gabbro intrusions; P – Peridotites partly serpentinized; P' - strongly sheared serpentinized
harzburgite, Ha- Haliw Formation; OM- Oman Melange; and HD – Hamrat Duru Formations.

Figure 11: RGB image of band ratios (R: (b1+b2)/b3; G: (b2+b4)/b5; B: (b4+b6)/b5) showing
the VMS mineralized zone and dashed line is the recommended zone for exploration (SE1 and
SE2 are extrusives and * Cu occurrences; Rajendran et al., 2013b).
❖ Conclusion : Briefly, this report has shown the engagement of remote sensing in mineral exploration
since the sixties, the benefits of this technology in the mining industry, plus some examples in
Oman. We finished up with the remote sensing help to reduces expenses, cover a large area in
the shortest time, and proof of mining damage. We must raise awareness of the increased use
of remote sensing methods to monitor the impact of mining on vegetation and animal habitats.

References: Cudahy, & Thomas. (2016, November 29). Mineral Mapping for Exploration: An
Australian Journey of Evolving Spectral Sensing Technologies and Industry
Collaboration. Retrieved from https://www.mdpi.com/2076-3263/6/4/52/htm#
Cudahy, & Thomas. (2016, November 29). Mineral Mapping for Exploration: An
Australian Journey of Evolving Spectral Sensing Technologies and Industry
Collaboration. Retrieved from https://www.mdpi.com/2076-3263/6/4/52/htm#
Davids, C., Rouyet, L. (2018). Remote sensing for the mining industry. Northern
Research Institute, 36. Retrieved from
https://www.oulu.fi/sites/default/files/36/RESEM_EOReview.pdf
HISTORY OF REMOTE SENSING, SATELLITE IMAGERY, PART
II.R,Baumann. (2009). Retrieved from
http://employees.oneonta.edu/baumanpr/geosat2/RS History II/RS-History-Part-
2.html
Koruyan, K., Deliormanli, A. H., Karaca, Z., Momayez, M., Lu, H., & Yalçin, E.
(2012). Remote sensing in management of mining land and proximate
habitat. Journal of the Southern African Institute of Mining and Metallurgy, 112(7),
667-672.
Lim, H. S., MatJafri, M. Z., Abdullah, K., & Wong, C. J. (2009, October 1). Air
Pollution Determination Using Remote Sensing Technique. Retrieved from
https://www.intechopen.com/books/advances-in-geoscience-and-remote-sensing/air-
pollution-determination-using-remote-sensing-technique
Nasir, S. J. (2018). Review of the Role of Remote Sensing Applications in Mineral
Exploration and Sustainable Development in Oman. International Journal of
Environment and Sustainability, 6(3), 24–55. doi: 10.24102/ijes.v6i3.896
Rajendran, S., Nasir, S. (2013a), “Mapping of manganese potential lithology using
ASTER satellite data in parts of sultanate of Oman”, Int. J. Geosci. Geomatics 1 (2),
92–101
Rajendran, S., Nasir, S. (2014a), “Hydrothermal altered serpentinized zone and a
study of Ni magnesioferrite– magnetite–awaruite occurrences in Wadi Hibi,
Northern Oman Mountain: discrimination through ASTER mapping”, Ore Geol.
Rev. 62, 211–226